Article

Corrosion Behaviour of Nodular Cast Iron Used for Rotor Manufacturing in Different Wastewaters

by
Carmen Nejneru
,
Diana-Petronela Burduhos-Nergis
*,
Mihai Axinte
*,
Manuela Cristina Perju
and
Costica Bejinariu
Faculty of Materials Science and Engineering, Gheorghe Asachi Technical University, 700050 Iași, Romania
*
Authors to whom correspondence should be addressed.
Coatings 2022, 12(7), 911; https://doi.org/10.3390/coatings12070911
Submission received: 4 June 2022 / Revised: 16 June 2022 / Accepted: 24 June 2022 / Published: 28 June 2022

Abstract

:
Submersible drainage sump pumps work in a highly corrosive environment, forming films with corrosive reaction products on the surface. Pump rotors are high-demand parts, so they are made of quality materials with good wear and corrosion resistance properties such as nodular graphite cast iron. This paper analyses the corrosion behaviour of cast iron used in the manufacture of rotors in three types of wastewaters, with variable pH. Nodular graphite cast iron samples were immersed in wastewater for 30, 60, and 90 days and tested by linear polarisation and electrochemical impedance spectroscopy (EIS). Also, the layers of reaction products formed on the surface of the material were analysed by SEM and EDS. The results showed that nodular cast-iron immersed in wastewater with acidic pH showed intense corrosion, the oxide layer formed on its surface is unstable. Also, the final structure of the product layer is that of a tri-layer with cations and anions absorbed from the corrosion media: the double-electric layer directly connected to the metal surface, an internal layer consisting of ferrous compounds and ferric compounds that control the diffusion of oxygen, an outer layer, and a compact crust of ferric compounds. The change in the pH of the wastewater has a major influence on the corrosion rate of the cast iron, which increases from 356.4 µm/year in DWW-1 (6.5 pH) to 1440 µm/year in DWW-2 (3 pH) and 1743 µm/year DWWW-3 (11 pH) respectively. As can be seen, the experimental study covers the problem of the corrosion behaviour of the pump rotor in various types of wastewaters this aspect is particularly important for the good use of wastewater pumps and to predict possible deviations for the operation of the equipment within the treatment plants.

1. Introduction

The wastewater transport and purification system include both pipes and connecting elements as well as pumps and other actuating elements [1]. Wastewater pumps (domestic and industrial) are generally high-power centrifugal pumps, which work in heavy conditions because the water contains strong organic and inorganic corrosive agents as well as suspensions and abrasive particles of various sizes and shapes.
Wastewater composition varies depending on the geographical area, the type of household consumers, and the type of industrial consumers. The composition of wastewater contains sewage waste that includes pathogenic bacteria, organic and inorganic particles, emulsions, dissolved gases, etc. [2] The most corrosive agent is sulfuric acid, resulting from the decomposition of organic waste and which is found in high concentrations in wastewater [3].
The component metallic materials from the wastewater transport systems are subjected to various aggressions as follows:
  • The acidic pH of the water, which increases the content of active ions, and the chemical reactivity of the liquid is also influenced by the temperature at which the process takes place;
  • Corrosion, given by sulfuric acid and sulphur dioxide dissolved in water, occurs as a result of the decomposition of substances of an organic origin;
  • The accentuated corrosion due to the presence of dissolved oxygen in the transported liquid, which modifies the acidity of the water;
  • Accelerated flow corrosion due to the removal of the protective oxide layer from the pump metal (especially for low-alloy steels and grey cast iron).
Wastewater contains various types of abrasive particles that are involved in the turbulent movements of industrial and domestic fluids that intensify the effect of corrosion due to the destruction of the boundary layer of protection that is formed near the wall of the transport pipeline [4]. The fraction of heavy metals such as lead, cadmium, copper, zinc, manganese, and iron has a special impact on the corrosion of wastewater. The mentioned chemical elements are found in suspension if the particles are very small or as a powder entrained by the fluid jet [5]. The metallic elements from the treatment plant components, such as the copper-based ones, can be protected from the effects of corrosion and by deposits such as polyaniline, the substance deposited electrophoretically by colloidal suspensions, the method studied in the paper [6].
Also, water for industrial and domestic use contains chemically active elements, salts, and dissolved organic acids that can change the pH of the water and can be a corrosive environment for the transport system (pipes, safety elements, etc.), as well as for actuating elements and accessories [7].
The rotor of the wastewater pumps is made of metallic materials with good wear and corrosion resistance properties such as brass or cast iron with nodular graphite. However, over time, researchers have tried to replace these materials with improved propylene composites with the addition of graphene and carbon nanotubes have been tested so that they can be used in conditions of intense wear and corrosion [7]. Also, composite materials based on polyester reinforced with fibres and carbon nanotubes were studied and analysed for use in industrial wastewater treatment systems [8] both in the manufacture of active elements [9] and in the manufacture of protective elements (housings) [10]. Possible aspect considering the mechanical and physico-chemical characteristics of resistance to combined stresses such as corrosive wear and dynamic stresses [11]. In addition, niobium alloy steels are used for the manufacture of fluid transport facilities in extreme temperature conditions because niobium has the effect of obtaining a very fine grain that gives the metal material very good properties of refractoriness and corrosion resistance in low temperatures [12]. Also, to withstand improper conditions a fluid transport network from areas with temperatures below 0 °C [12], and aluminium alloys with ceramic inserts were also tested and found to be satisfactory [13].
Regarding the studies made on cast iron, Chien-Hung Lin et al. [14] investigated the mechanism of crack propagation in nodular graphite cast iron under atmospheric exposure at temperatures between −30 and 100 °C and observed that spherical nodules inhibit crack propagation and improve its ductility. The mechanical strength of the samples decreased with increasing operating temperature. Under ambient conditions, the corrosion rate of nodular cast iron was more than an order of magnitude lower than in extreme conditions. Nodular cast iron samples showed poor mechanical performance in the presence of saltwater (3.5% by mass NaCl), especially in hot water, due to their cracking by stress corrosion. Ojo Jeremiah Akinribide et al. [15] investigated the corrosion resistance of the austempered nodular graphite cast iron and nodular graphite cast iron used in the production of engine sleeves. Significant sodium chloride concentrations (0.01 M and 0.05 M) were used to analyse the corrosion behaviour of both materials in the two media and observed that heat-treated cast iron has higher corrosion resistance due to a wider range of passive layers. Masters S. and Wang H. [16,17] studied the effects of five factors influencing the corrosion on the corrosion of grey cast iron. The results showed that the order of importance of the factors influencing the corrosion process is: residual chlorine > sodium chloride > dissolved oxygen > temperature > solution pH. Sancy et al. [18] used the EIS to investigate the characteristics of the corrosion product in tap water and found that the porous layer produced by corrosion on the electrode surface had an inhibitory effect on corrosion. Rios et al. [19] used the rotating cylindrical electrode (RCE) to study the electrochemical corrosion behaviour of copper, carbon steel, and 304 stainless steel in tap water, and the results showed that the corrosion resistance of various metals was mainly related to the condition of the thin layer created as a result of the surface corrosion process. Fabbricino et al. [20] studied the variation of the corrosion potential (Ecor) of iron in stagnant and flowing tap water, and their results showed that the on-site measurement of Ecor was a practical and fast method to determine the effects of changes in hydraulic conditions and water quality on the pipeline. The effect of corrosion has also been studied by combining electrochemical measurement methods with the weight loss method. Zou et al. [21] recorded polarisation curves and used the weight loss method to measure the corrosion rate of mild steel that has been submerged in seawater for a long time. Sadeghisi et al. [22] studied the improvement of the abrasion-corrosion behaviour of grey cast iron used in centrifugal pumps, welded with various types of electrodes, noting that the use of electrodes with Ni substrate reduces hard and brittle phases (martensitic and carbides) while welding with carbon steel electrode (DIN1913) has higher corrosion resistance. Liu et al. [23] performed a computational fluid dynamics (CFD) simulation and electrochemical measurements to study corrosion at different positions of the elbow and its adjacent areas in water supply pipelines. Researchers have noticed that the passive film of corrosion on the surface of the nodular cast iron plays an important role in the study, and although corrosion activity occurs more frequently in the inner part of the elbow and the outer part of the straight sections downstream, corrosion in the upper and outer part of the elbow occurs less frequently. Guo et al. [24] analysed the corrosion behaviour of ferrous materials (grey iron, carbon steel, and ductile iron) over time in a simulated flow corrosion system. It has been observed that ductile iron has the lowest corrosion rate and the most stable corrosion film forming an efficient layer of limestone containing stable compounds of α-FeOOH and CaCO3, which limits mass diffusion and slows down the process of electrochemical corrosion. Ogundare et al. [25] published a comparative study of the corrosion behaviour of nodular graphite cast iron and austenitic stainless steel in a concentrated salted medium for 1200 h. Using the immersion testing technique, it was found that the corrosion rate of nodular cast iron is lower than that of steel. Nodular cast iron corrosion product morphologies showed that the nodular matrix was gradually covered as the immersion time progressed, while the corrosion channels and the volume of the holes that initially formed in the steel deepened and, respectively, increased with increasing exposure time. Song and his colleagues [26] studied the effect of chlorine on the corrosion of nodular cast iron and carbon steel over time. Researchers have observed that chlorine has slowed down the corrosion rate while increasing the difficulty of the diffusion process by thickening the rust layers and transforming the rust compositions. Carbon steel is more susceptible to chlorine attack than nodular cast iron. Roman and his collaborators [27] studied the absorption of industrial wastewater pollutants using nanocrystalline ferrites and developed and analysed an artificial intelligence model based on a neural network to model the adsorption rates followed by the generation of 3D adsorption rate models for each type of synthesised ferrite. Zaharia et al. [28] have studied a commercial Fe-C material (P265GH) used for natural gas delivery and transportation systems that were analysed in H2S atmosphere to establish the corrosion resistance and the acceleration of metallic materials deterioration.
As can be seen, the corrosion behaviour of various metallic materials used in the manufacture of pumping systems has been intensively studied. However, regarding the nodular graphite cast iron used in the manufacture of the rotor, it is considered that additional tests are needed to study its behaviour and find a solution that improves corrosion resistance. The experimental study covers the problem, the corrosion range of the pump rotor in various types of wastewaters as well as the analysis of corrosion products over time, this aspect being particularly important for the good use of wastewater pumps and to predict possible deviations, for the operation of the equipment within the treatment plants. Therefore, the novelty of this study is the analysis of the corrosion behaviour of cast iron used in the manufacture of pump rotors in three types of different wastewaters, with different immersion intervals, by linear polarisation, electrochemical impedance spectroscopy (EIS), and scanning electron microscopy (SEM). The results of the study show that the least aggressive wastewater is that with neutral pH (DWW-1), considering the values of corrosion rate which increases from 356.4 µm/year in DWW (6.5 pH)-1 to 1440 µm/year in DWW-2 (3 pH) and 1743 µm/year DWWW-3 (11 pH).

2. Materials and Methods

2.1. Material

This paper analysed the pH and immersion time influence on the wastewater of nodular cast iron. A sample of nodular cast iron cut from the rotor of a commercial submersible pump was studied, its chemical composition has been determined using a Foundry Master spectrometer and is shown in Table 1. In this table, the principal characteristics of the material according to standard SR EN 1563:2019 are also presented.

2.2. Methods

Three synthetic sewage products with different pHs were used as the corrosion medium. The composition of the basic synthetic wastewater, abbreviated as DWW-1, is shown in Table 2. The inorganic components are responsible for the corrosive properties of the solution while the food components may function as protectors or inhibitors. The DWW-1 solution has a pH very close to neutrality—pH = 6.5.
To study the pH influence on corrosion behaviour, the pH of the base solution (DWW-1) was changed by adding hydrochloric acid and sodium hydroxide. This is how the solutions were obtained:
DWW-2: pH = 3.0—by adding 0.1 M HCl solution to the base solution,
DWW-3: pH = 11.0—by adding 0.1 M NaOH to the base solution.
To study the influence of the immersion time on the instantaneous corrosion rate, the samples were sanded on abrasive paper up to 2000 grit, degreased in acetone, washed with plenty of distilled water, and placed separately in 50 mL of simulated wastewater, in which the samples were introduced. They were coated without sealing to ensure oxygenation. Once every 5–6 days, the solutions were further aerated by bubbling air for 5 min. As the sample area was relatively small and the volume of solution sufficiently large, the composition of the corrosion medium did not change over time, except by incorporating a very small amount of reaction products. At various intervals (30, 65, and 90 days) the samples were removed from the vessel, washed with distilled water, and placed in the electrochemical measuring cell with a fresh solution. The linear polarisation curves were recorded at a 0.5 mV/s scanning speed (sweeping) of the electrode potential, over the potential range of (PCD ± 150) mV. Due to the very low currents recorded in this potential range, the structure and properties of the surface were only negligibly influenced, so three determinations were made for each sample.
All measurements were required to calculate the corrosion rate [29], therefore the data were assessed using the facilities provided by VoltaMaster 4 software. The considered calculation area was 120 mV (±60 mV around the corrosion potential) and the linearity range for Evans curves was 30 mV.
To analyse the macroscopic structure of the corroded surface and the influence of the immersion time on it, after the linear polarisation measurements, electrochemical impedance measurements were made. Electrochemical Impedance Spectroscopy (EIS) measurements were performed at the open circuit potential (OCD ≈ Ecor) in naturally aerated solutions. The spectra were recorded in the frequency range 10−2…105 Hz at alternating potential with an amplitude of 10 mV, using a PGZ 301 potentiometer (Radiometer, Copenhagen). Also, to study the morphology and chemical composition of the product layer form on the surface of the cast iron was used a Vega Tescan LMH II scanning electron microscope and an EDX QUANTAX QX2 detector.
Impedance data analysis was conducted using the “ZSimWin” program, which uses a wide variety of equivalent electrical circuits to numerically correlate the measured impedance data. This is done by nonlinear correlation based on the least-squares method and the use of successive iterations. When choosing the most suitable equivalent circuit, it was taken into account that it should contain a minimum number of elements and the relative error should be small enough. The degree of correlation of the equivalent circuit chosen with the experimental data is expressed by the parameter χ2, which is directly related to the relative error of the measured electric current. An χ2 value with an order of 1 × 10⁻⁴, as evaluated in the program, corresponds to a circuit fitting error of 0.018 (approximately 2%). In addition, the error associated with each item must be less than 5%.
Because the measurements were performed with the PGZ 301 potentiometer, for the use of the ZSimWin program, the experimental data were converted using the “EIS file converter” software (EISFC150).
SIE data were represented in the Nyquist diagram (imaginary impedance component as a function of the actual impedance component: −Zim = f (Zreal)) and the Bode diagram (impedance modulus and phase angle according to the logarithm of the frequency: lg Z = f(ln f); θ = f(lg f)). The Nyquist and Bode diagrams corresponding to the experimental data series obtained for the initial moment and various immersion intervals in the three corrosion environments are presented in the Supplementary Materials.

3. Results and Discussion

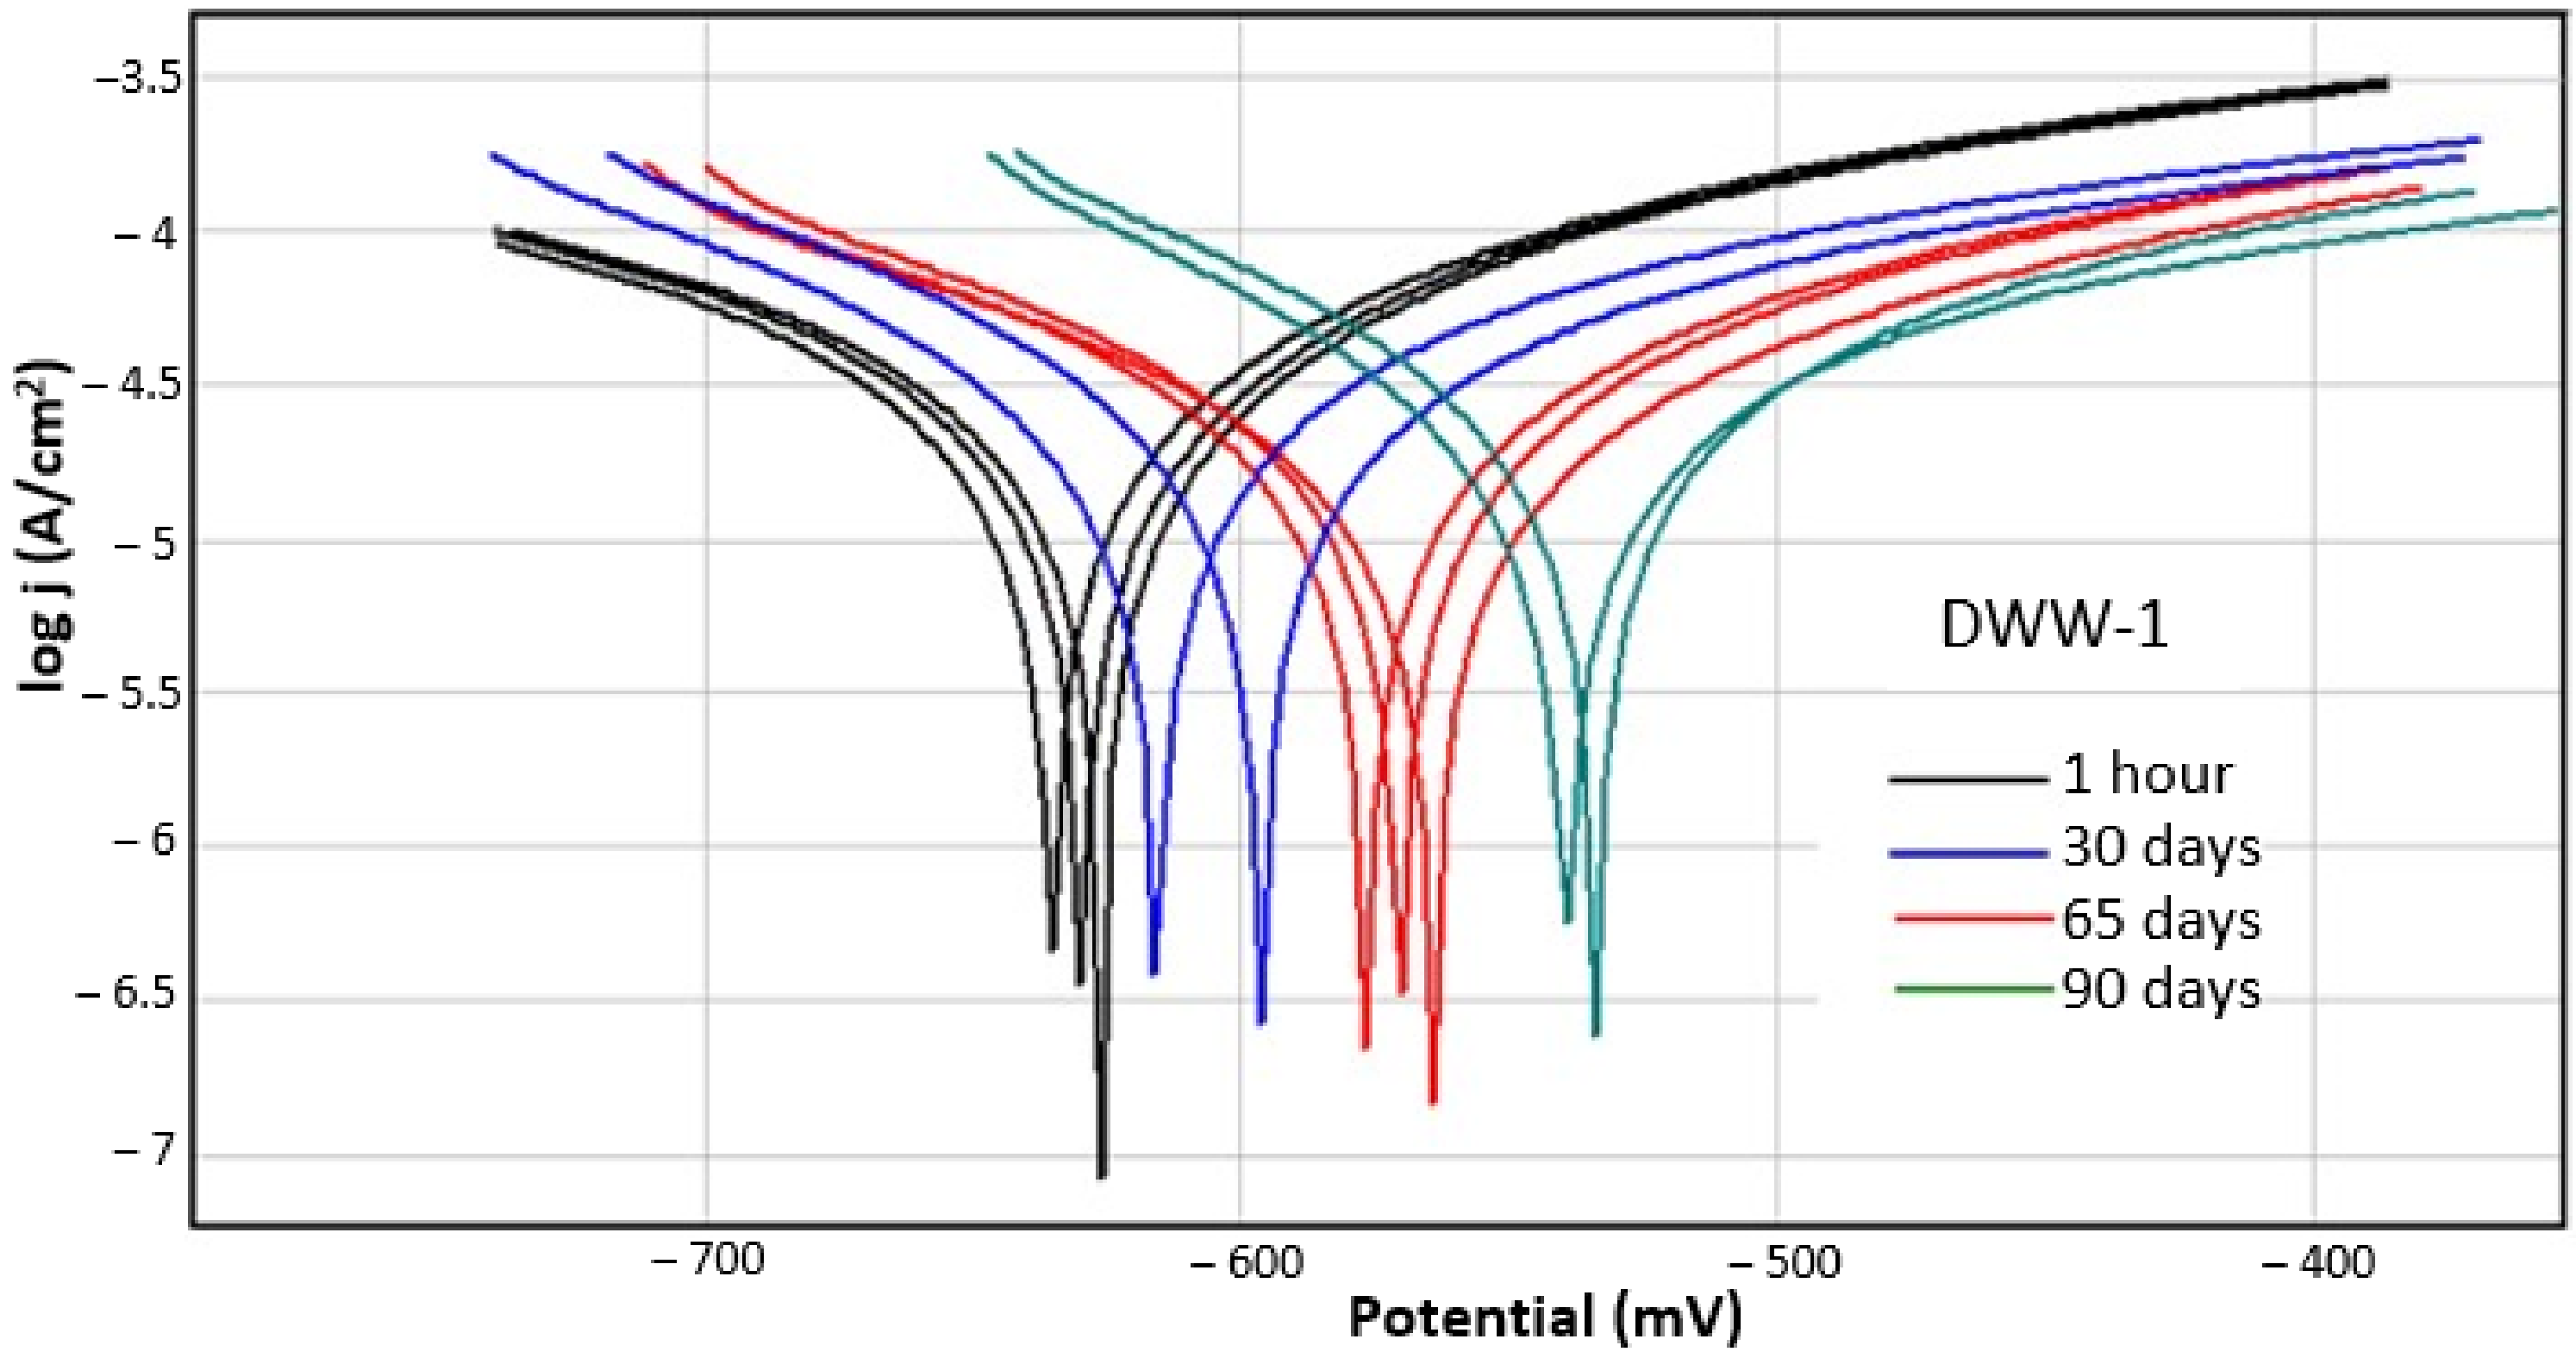
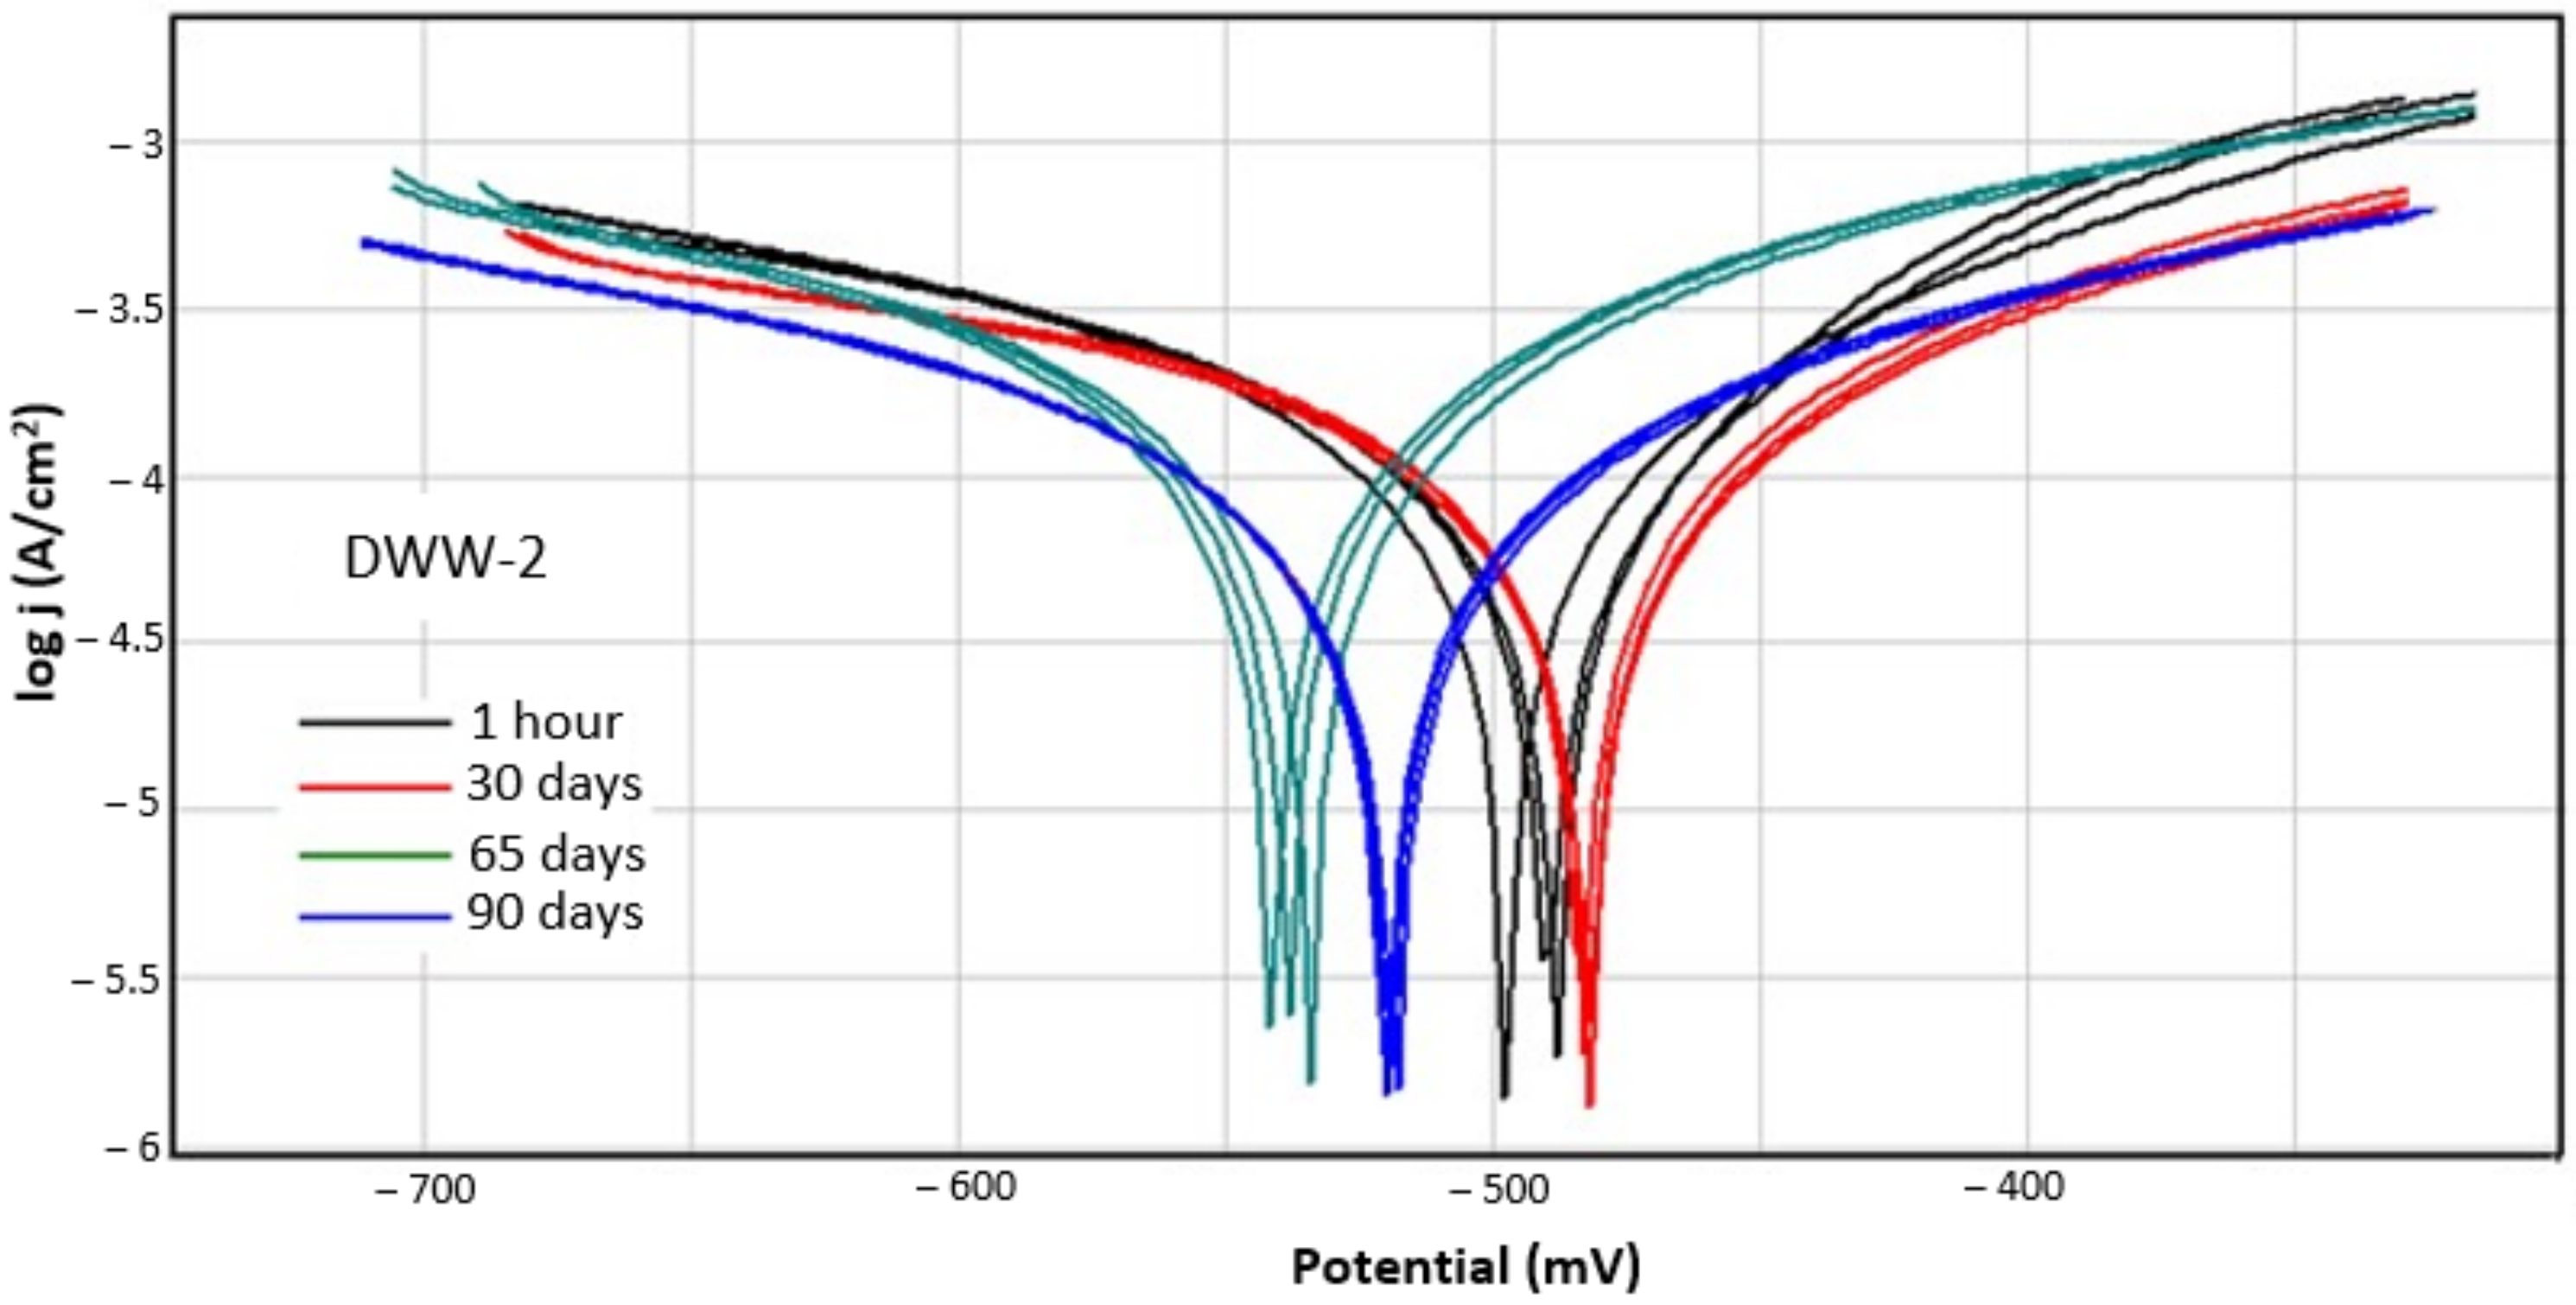
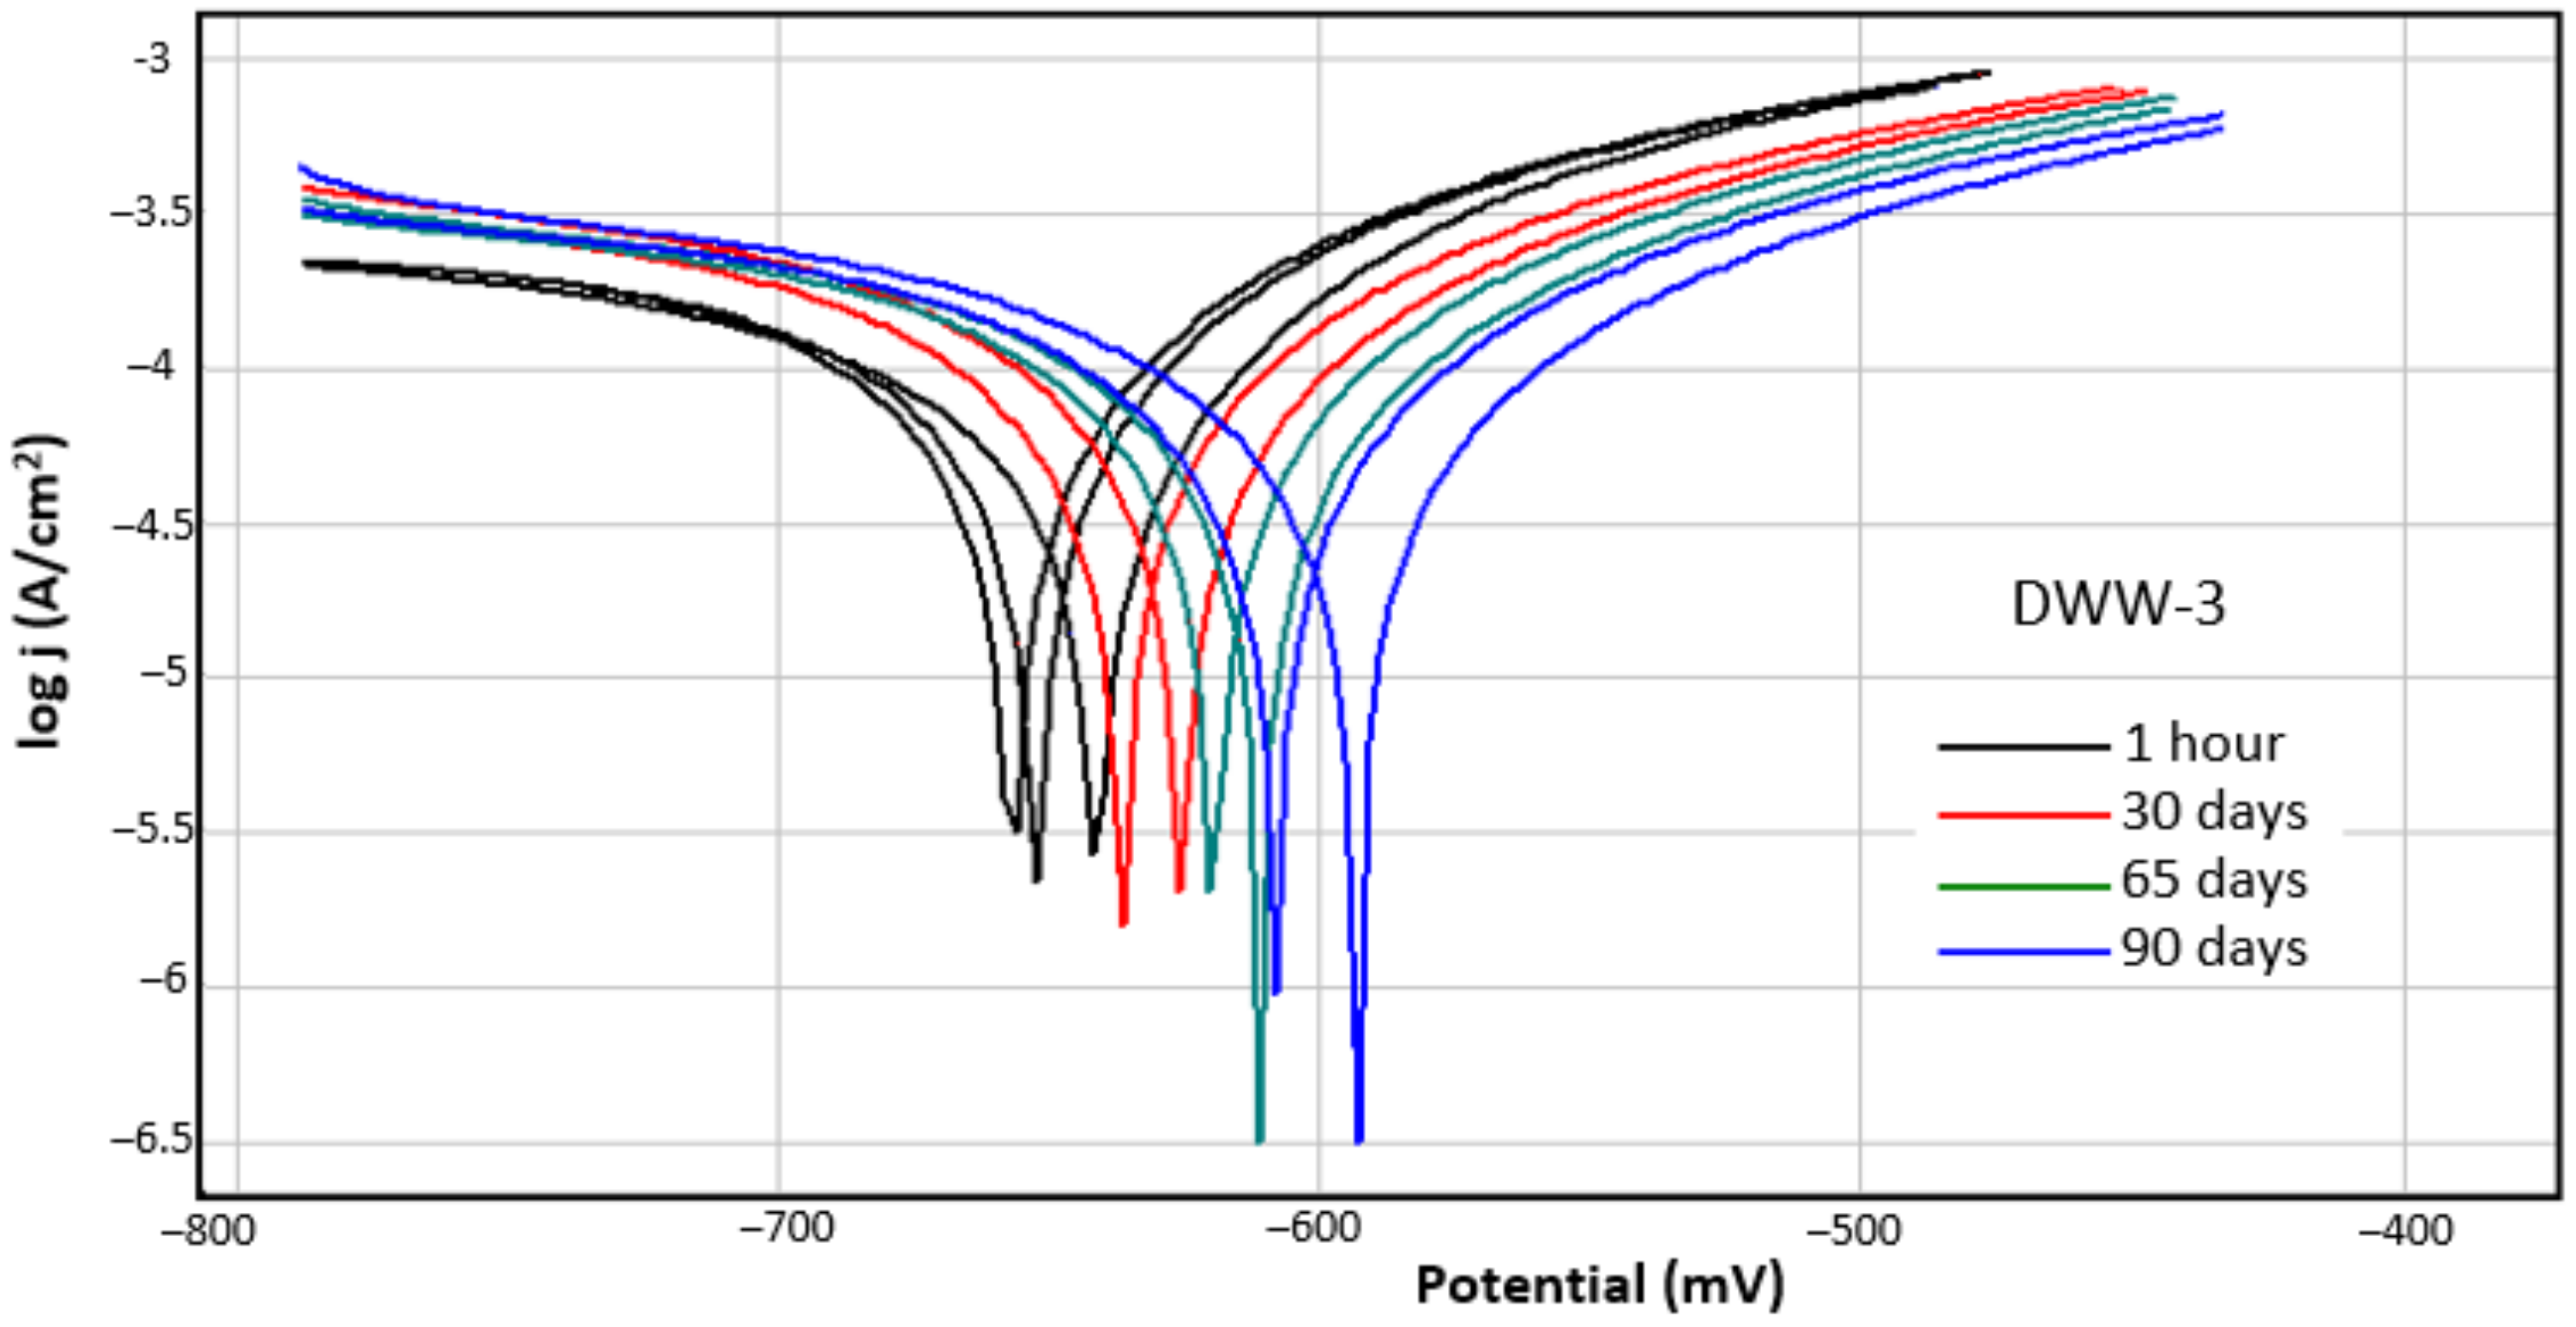
3.1. Instantaneous Corrosion Rate

For each sample, three experiments were performed. The arithmetic means values obtained for each parameter were recorded in Table 3, Table 4 and Table 5. The linear polarisation curves in semilogarithmic coordinates (Evans diagrams), based on which the data in the tables were calculated, are shown in Figure 1, Figure 2 and Figure 3.
The analysis of the data from these tables allows us to highlight several observations that are summarised below:
  • The data in the tables show very good reproducibility of the measurements, with 1%–2% arithmetic average errors being detected.
  • In neutral and basic solutions (solutions DWW-1 and DWW-3), E (I = 0), which is the corrosion potential, moves to more positive values as the immersion time in the solution increases. As this quantity expresses the thermodynamic probability of corrosion, its positivity over time expresses a tendency to passivate. In acidic solutions, however (respectively in DWW-2) E (I = 0) varies randomly: after 30 days of immersion, it is positive, but later, after 65 and 90 days, it reaches even higher negative values in absolute value than in the initial moment. This is probably a consequence of the fact that in the acid environment the corrosion process but also the evolution of the reaction product are more complex.
  • In DWW-1 and DWW-3, the polarisation resistance increases with the immersion time, and consequently the current density and corrosion rate decrease accordingly. Quantitatively DWW-1, the corrosive agent with pH = 6.5, is much less corrosive than the DWW-3 solution, the polarisation resistance in DWW-1 is 3–4 times higher than in DWW-3. Under these conditions, the corrosion rate is 5–6 times lower in DWW-1 than in DWW-3.
  • In the acid solution (DWW-2) the polarisation resistances and consequently the corrosion rates are of the same order of magnitude as in the basic solution (DWW-3) but, as in the case of the variation of the corrosion potential, the time dependence immersion does not follow a certain order.
  • In DWW-2 and DWW-3 solutions, the absolute slope of the Tafel cathode is significantly higher than the anodic slope, which indicates that the overall corrosion process is anodically controlled and is limited only by concentration. In the DWW-1 solution (pH = 6.5), in the initial stages, the Tafel slopes are of the same order of magnitude, while at longer periods of immersion the anodic slope becomes larger than the cathodic slope, indicating that the metal tends to passivation.
  • The anodic slope of the Tafel curves is much more accentuated compared to the cathodic slope, this aspect being observed also in the case of corrosion in water with neutral pH (drinking water) from nodular cast iron covered with cement (cement mortar lining), a phenomenon studied and confirmed by Yunhul et al. [30].

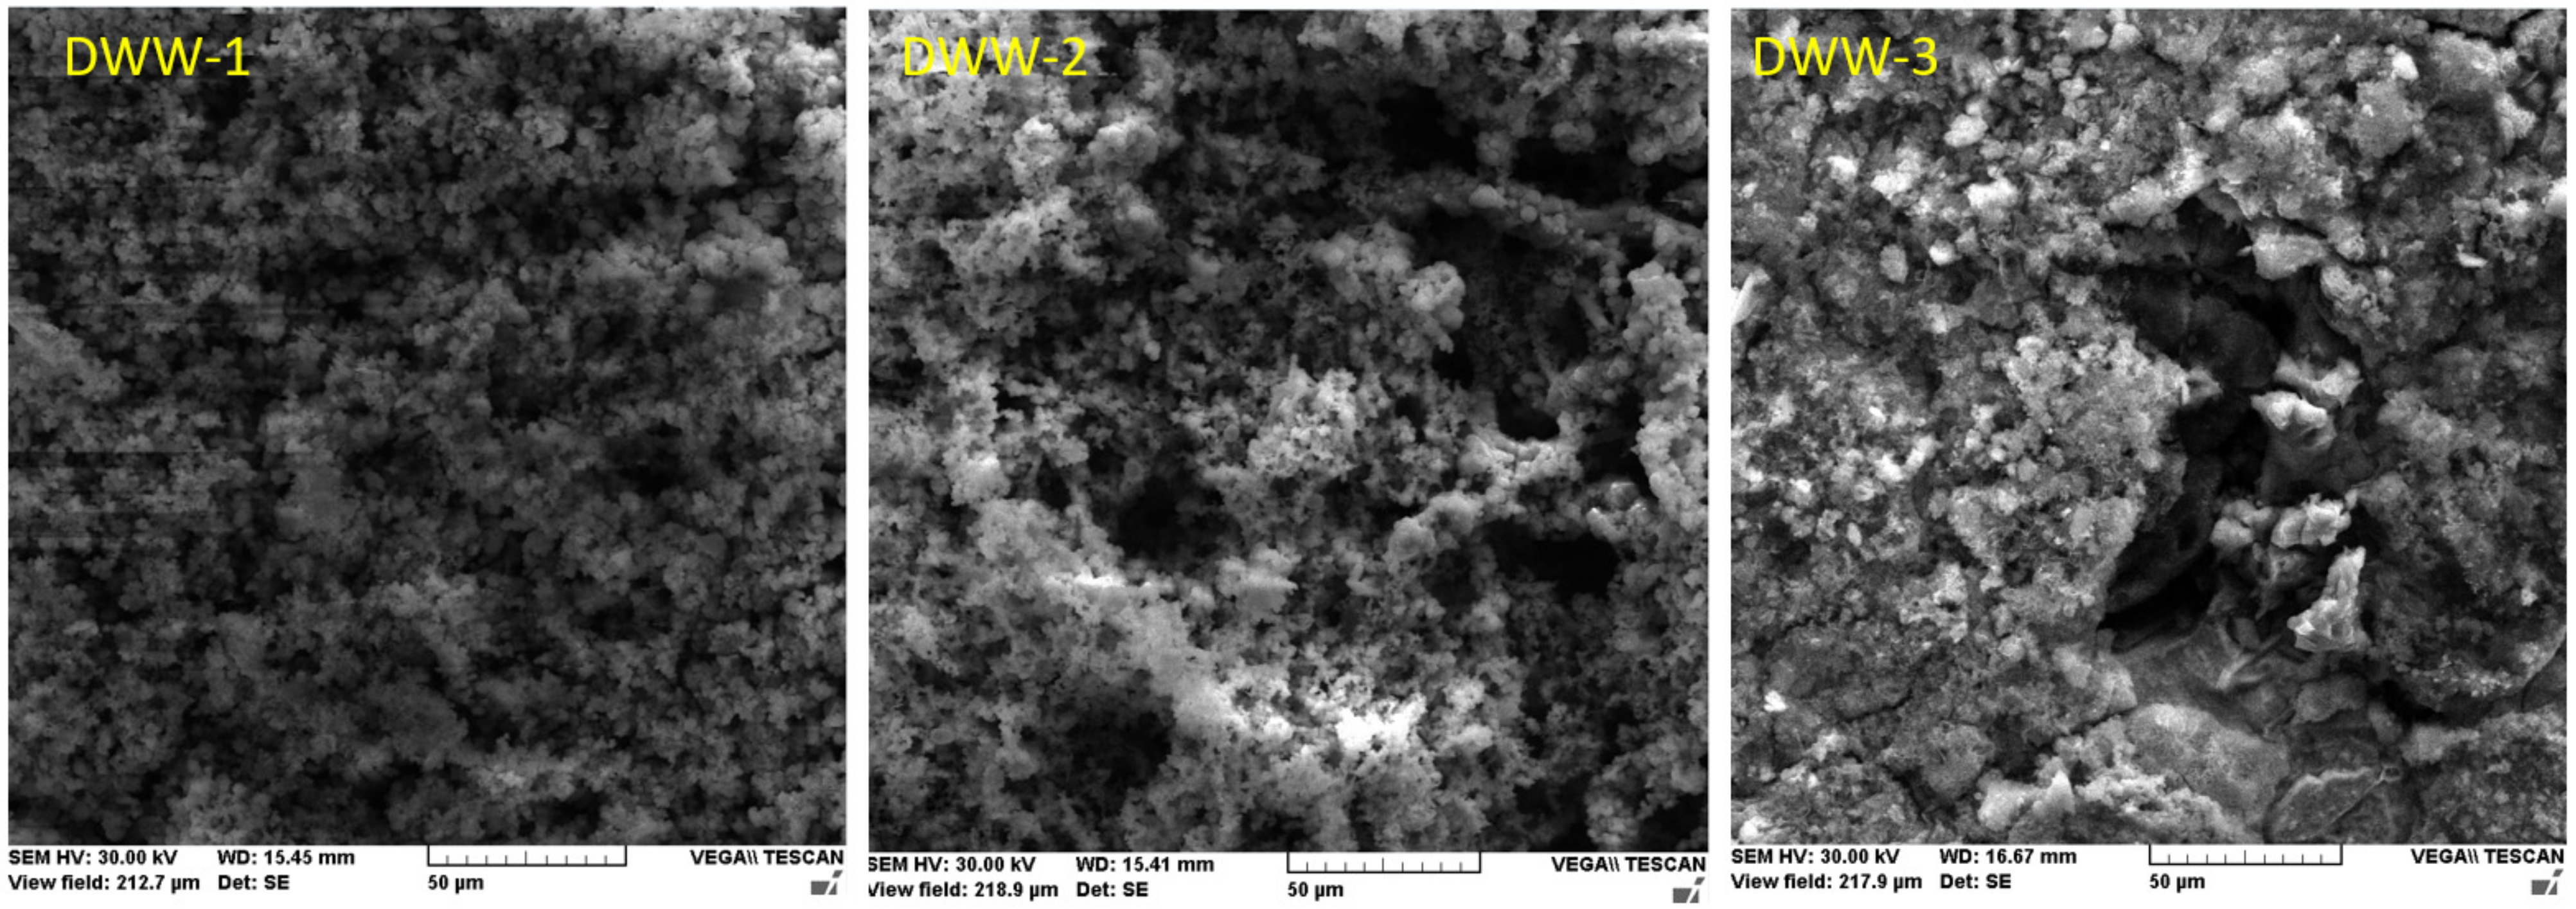
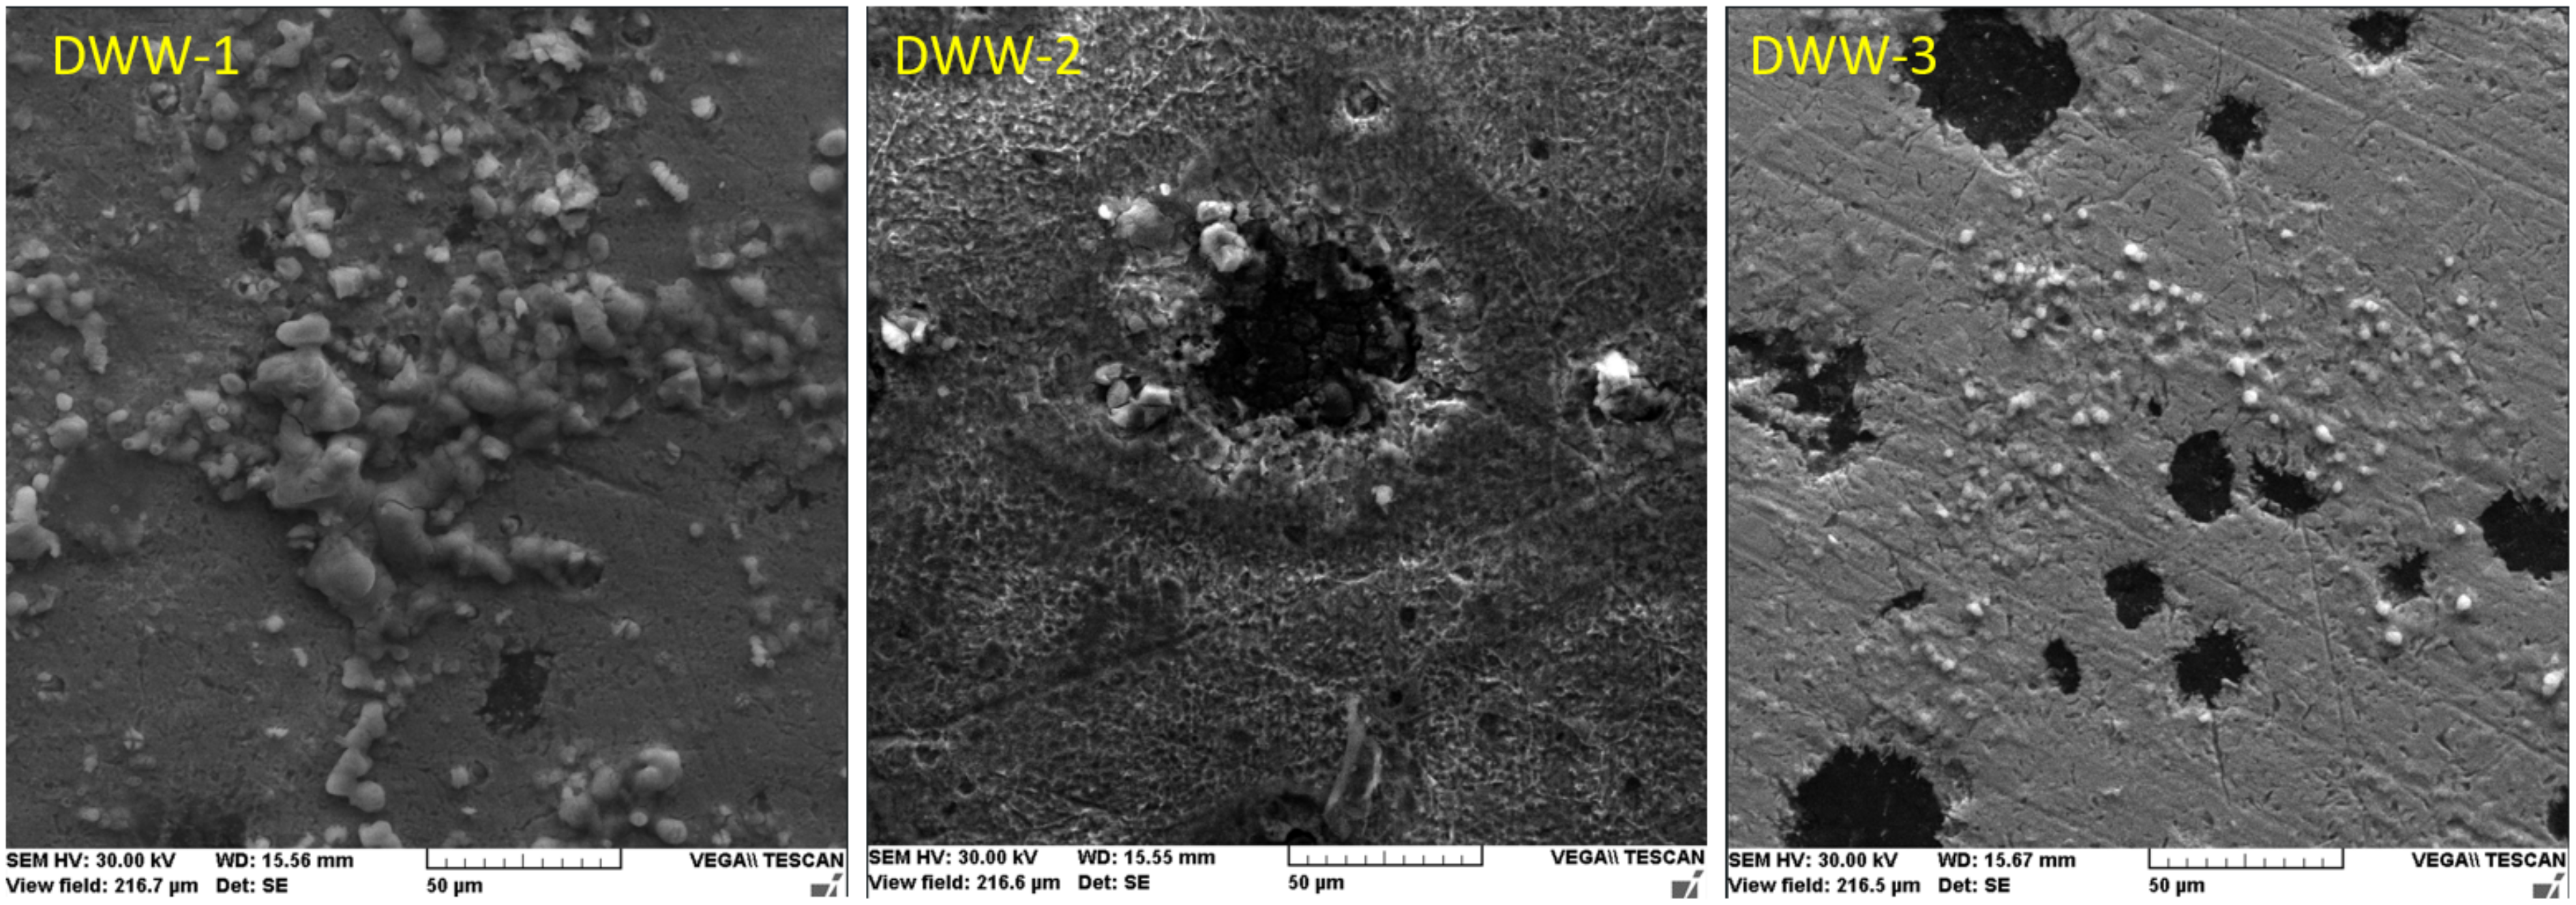
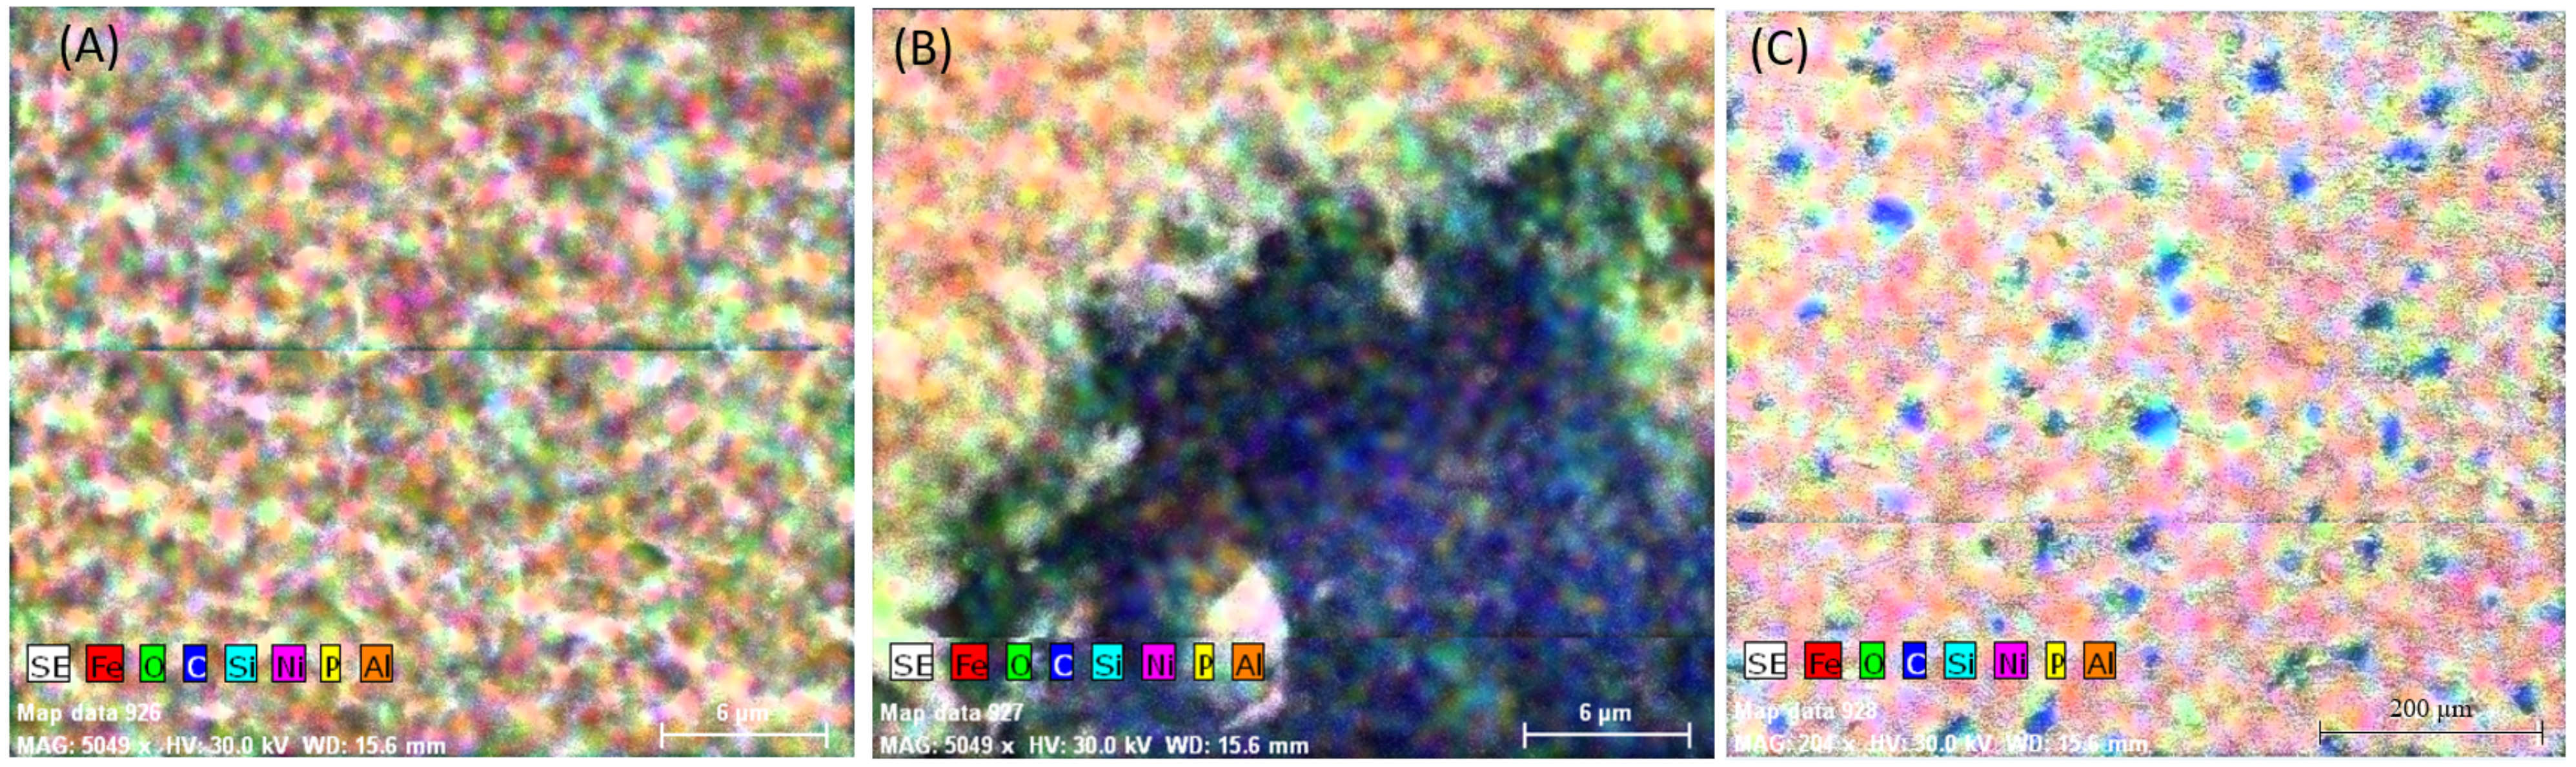
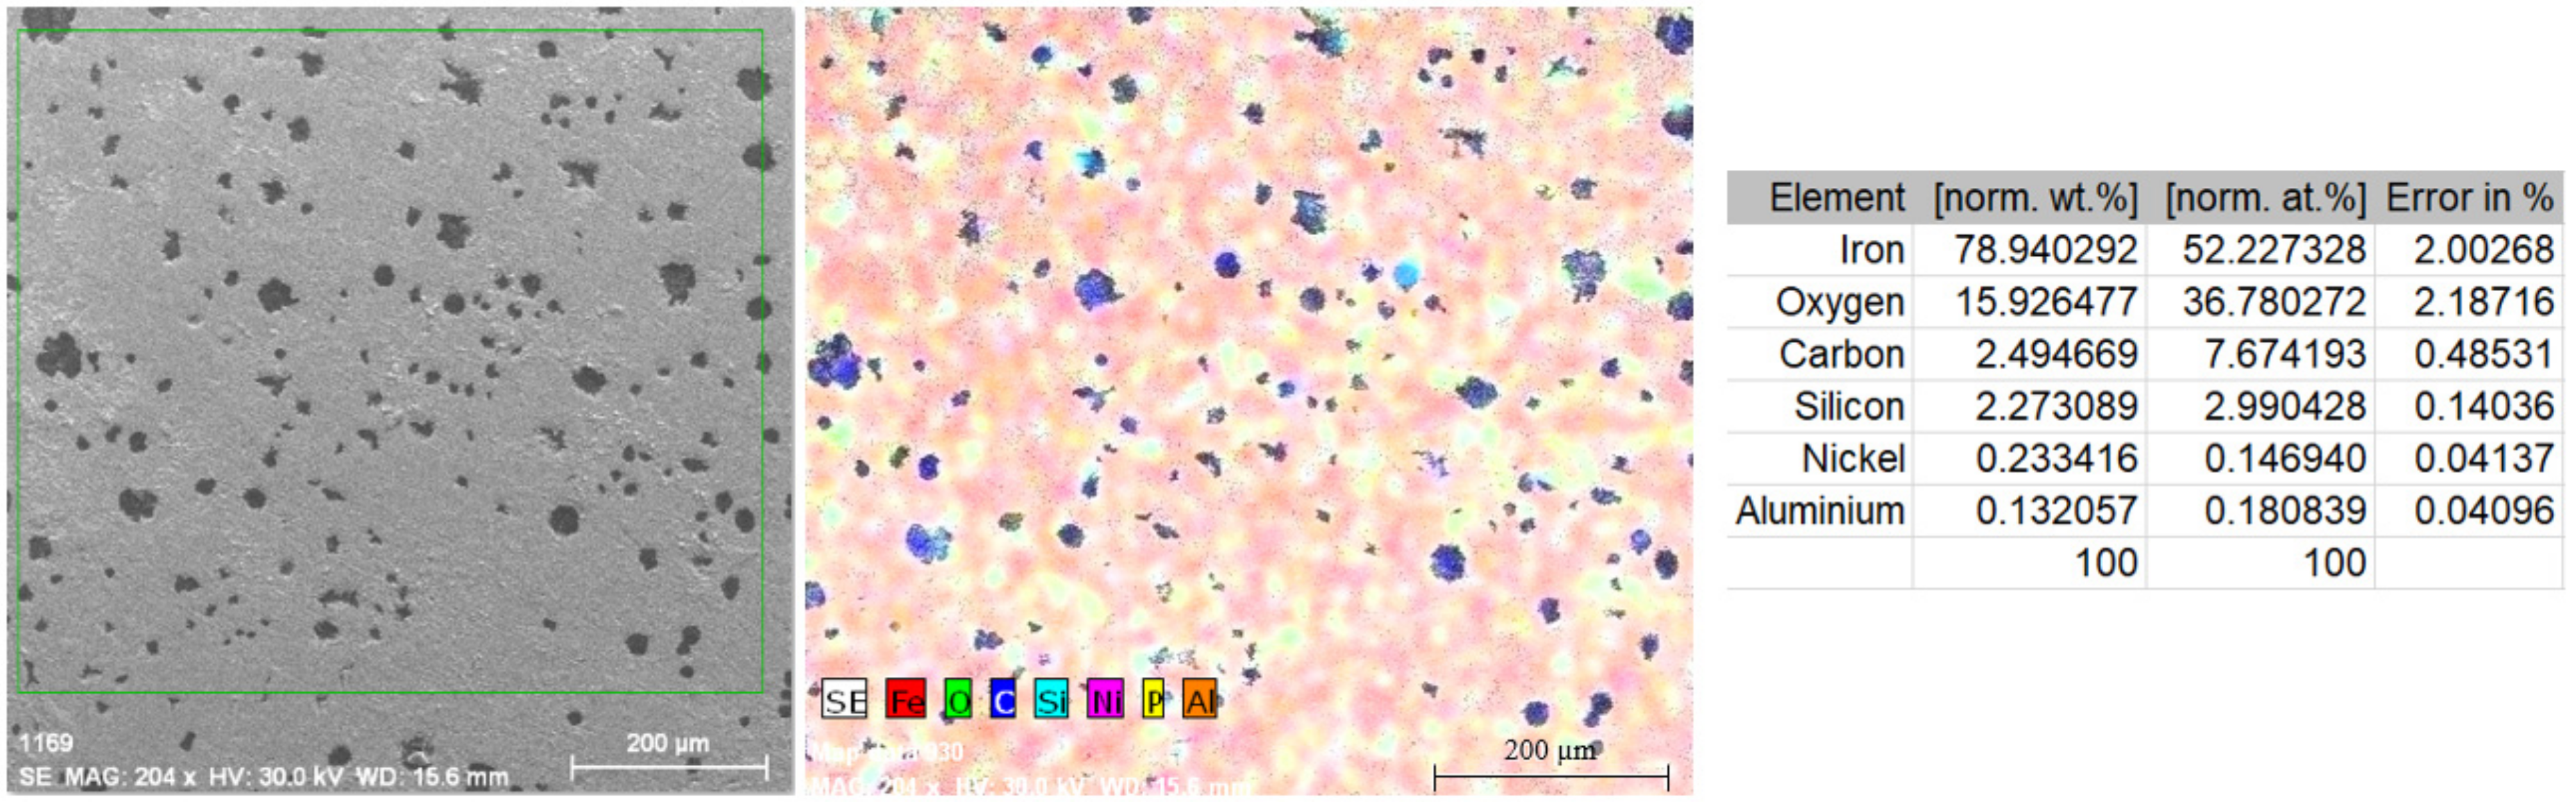
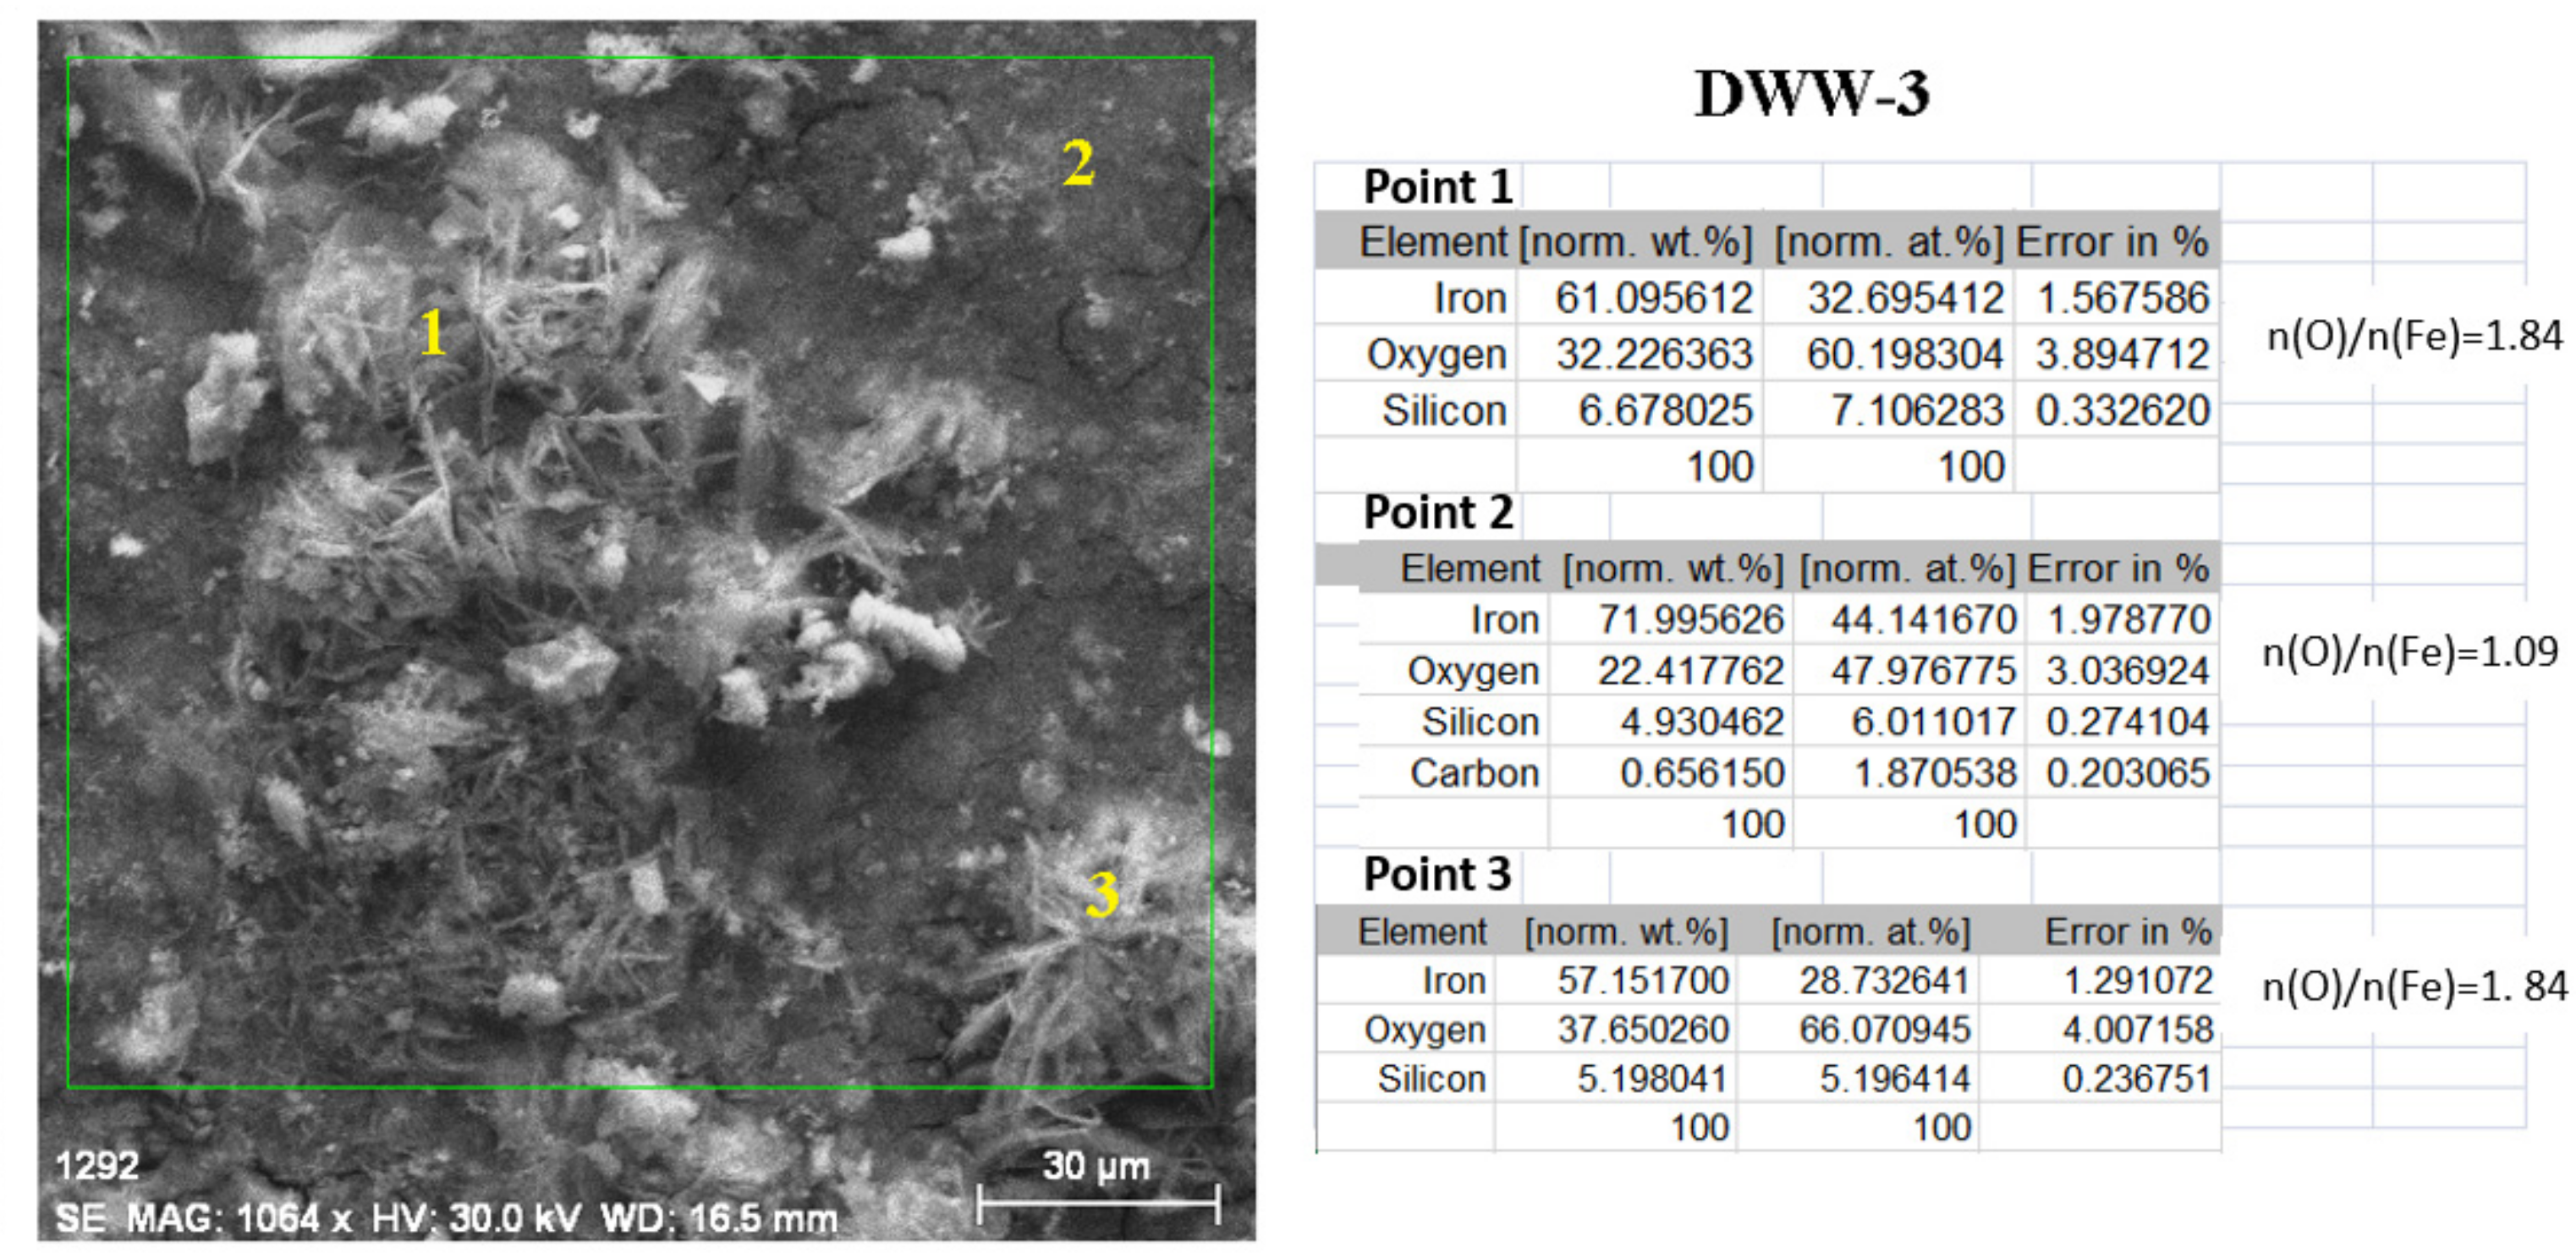
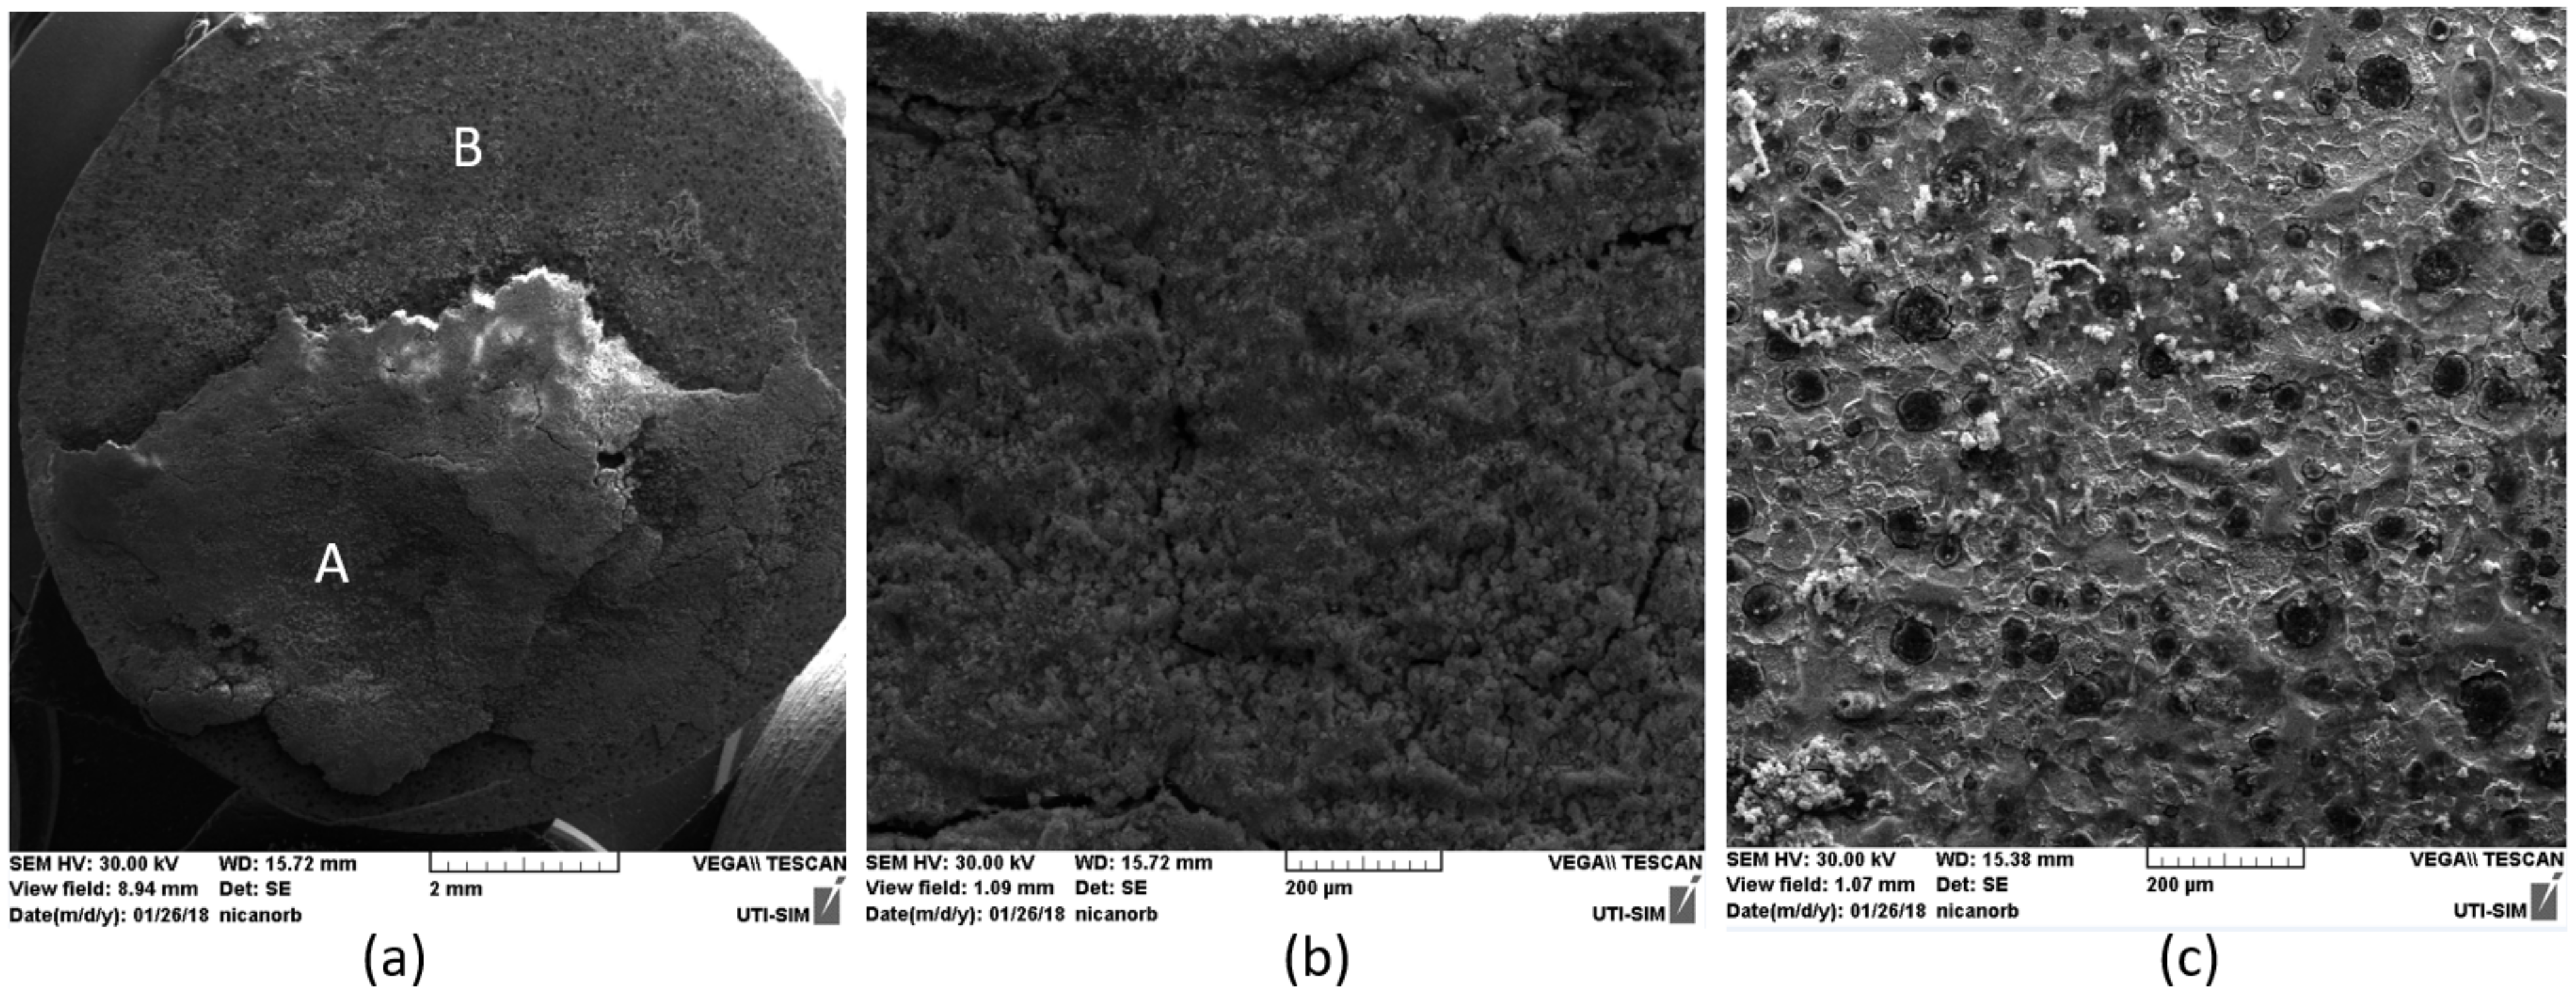
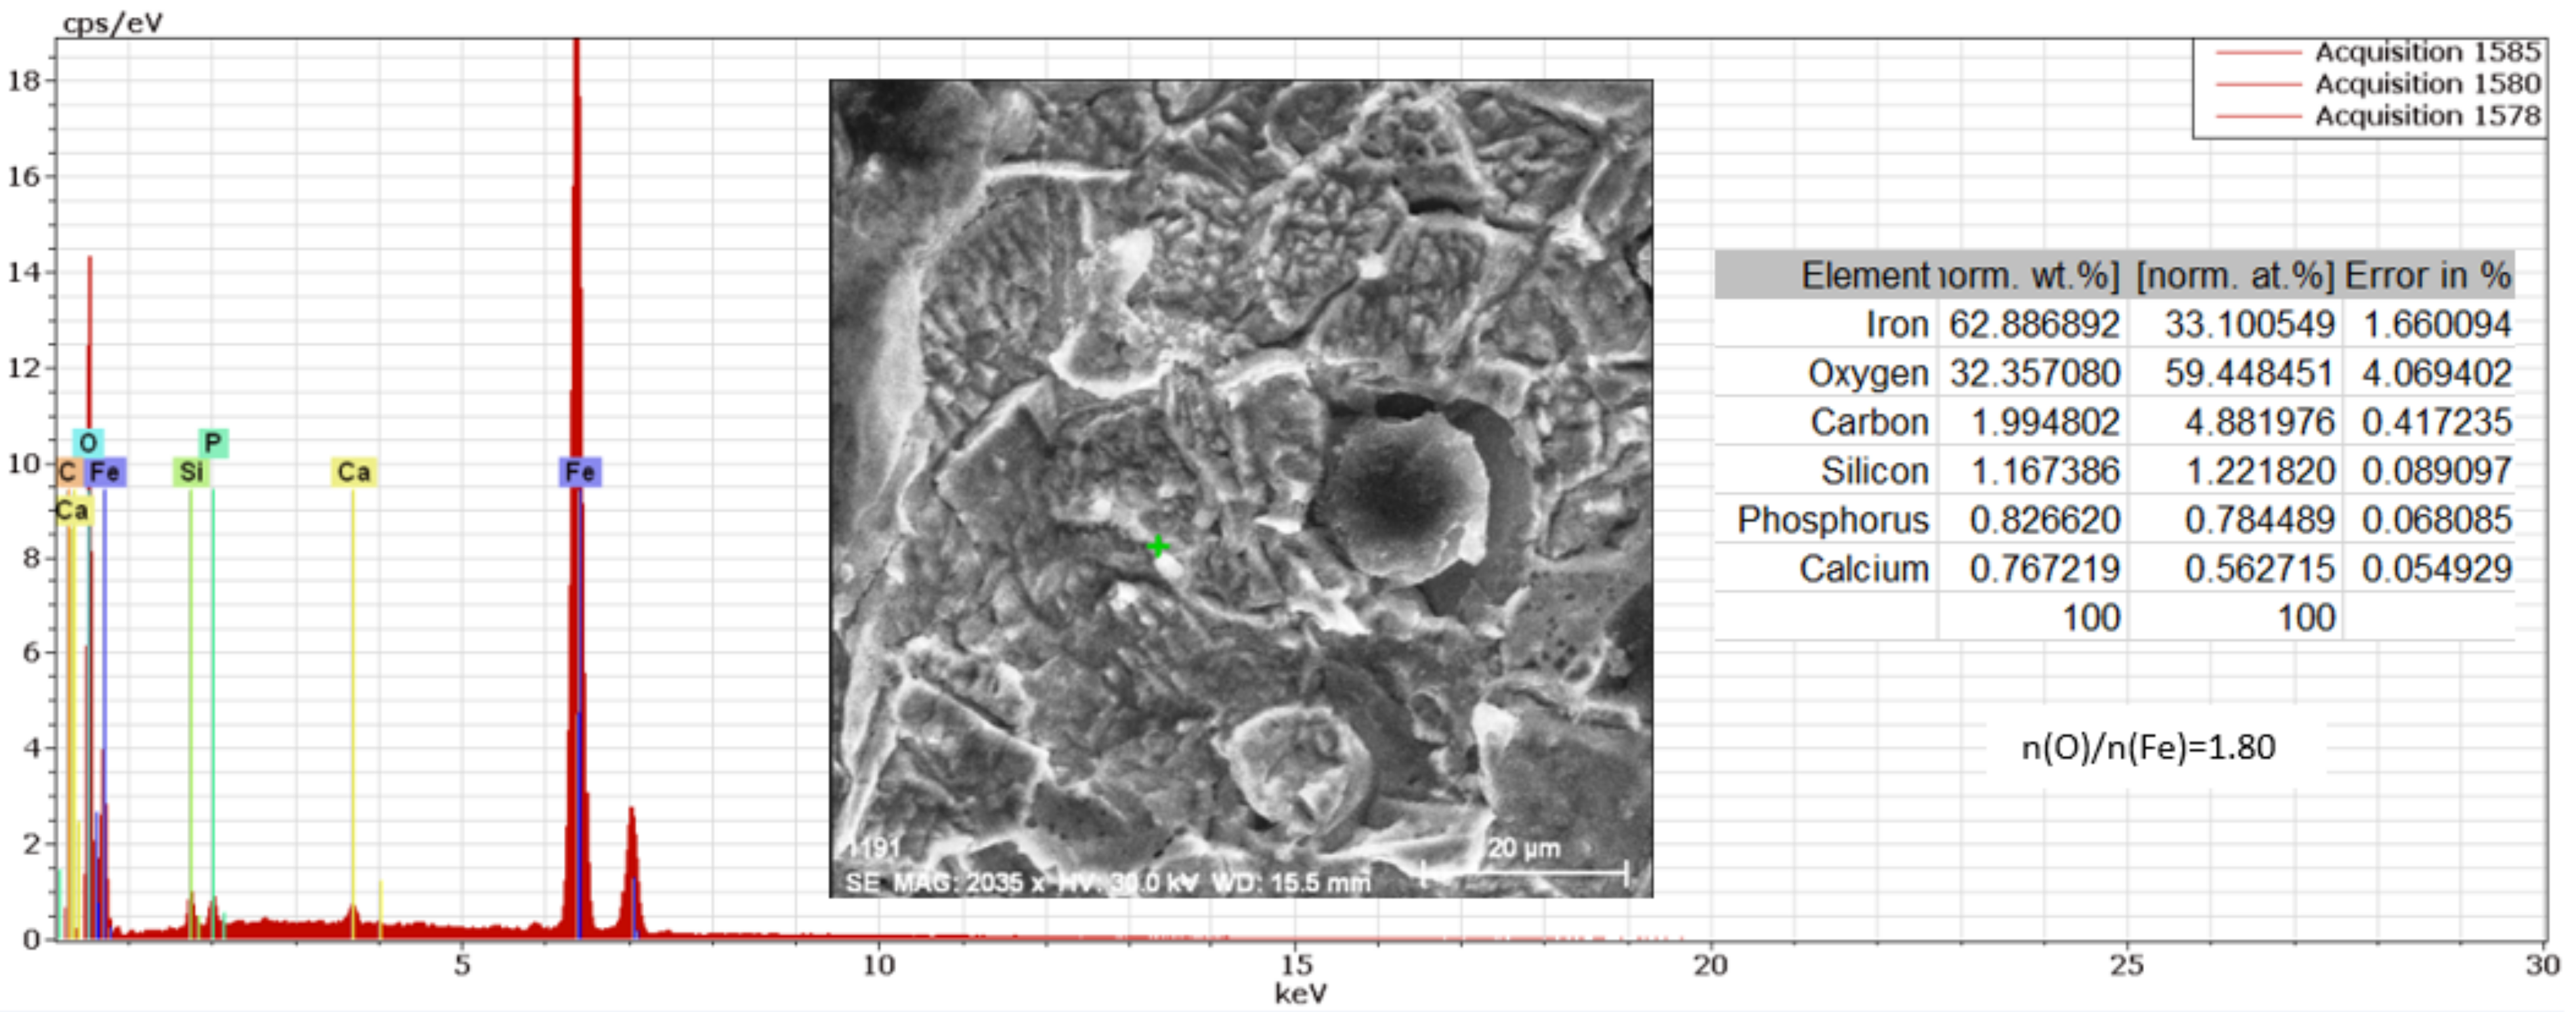
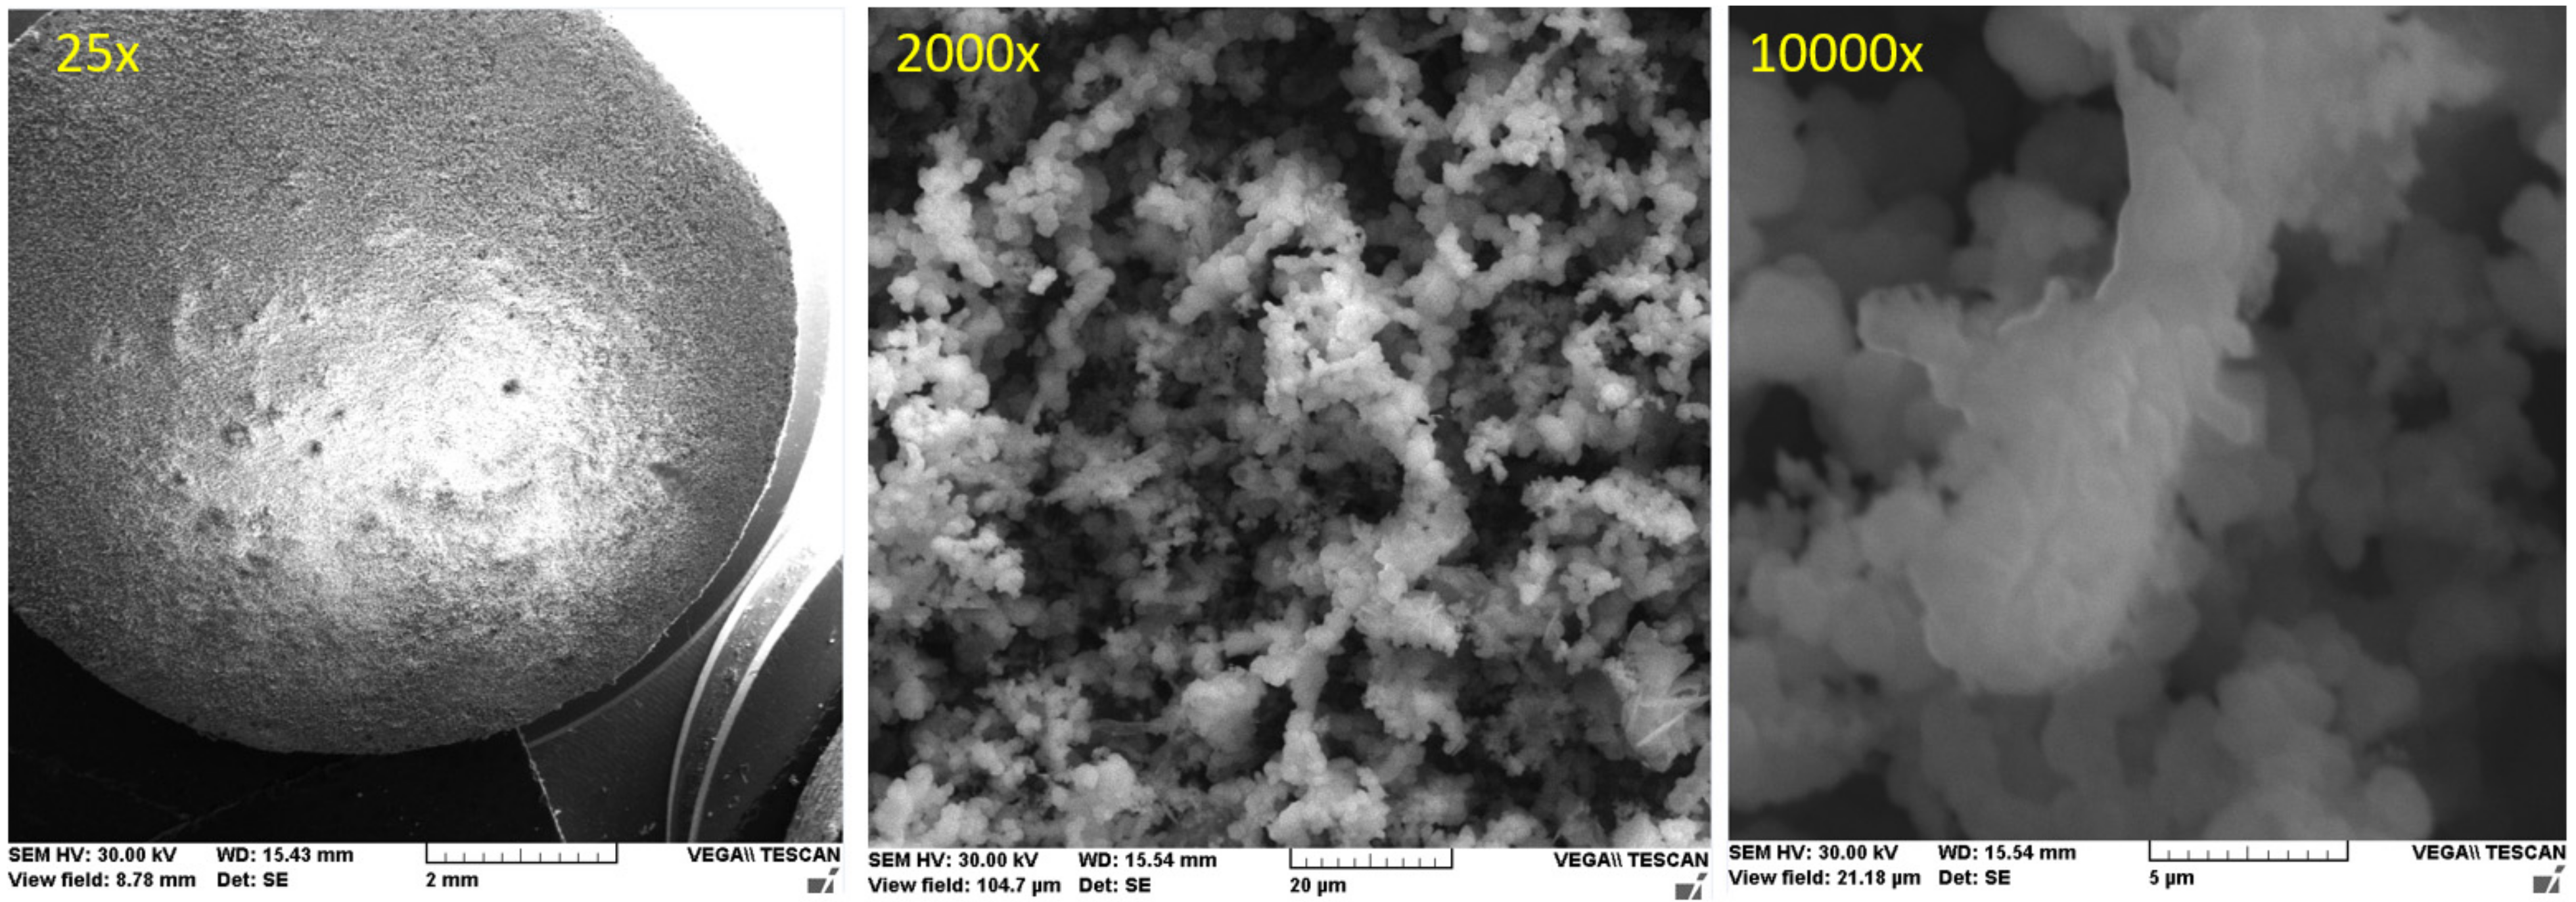
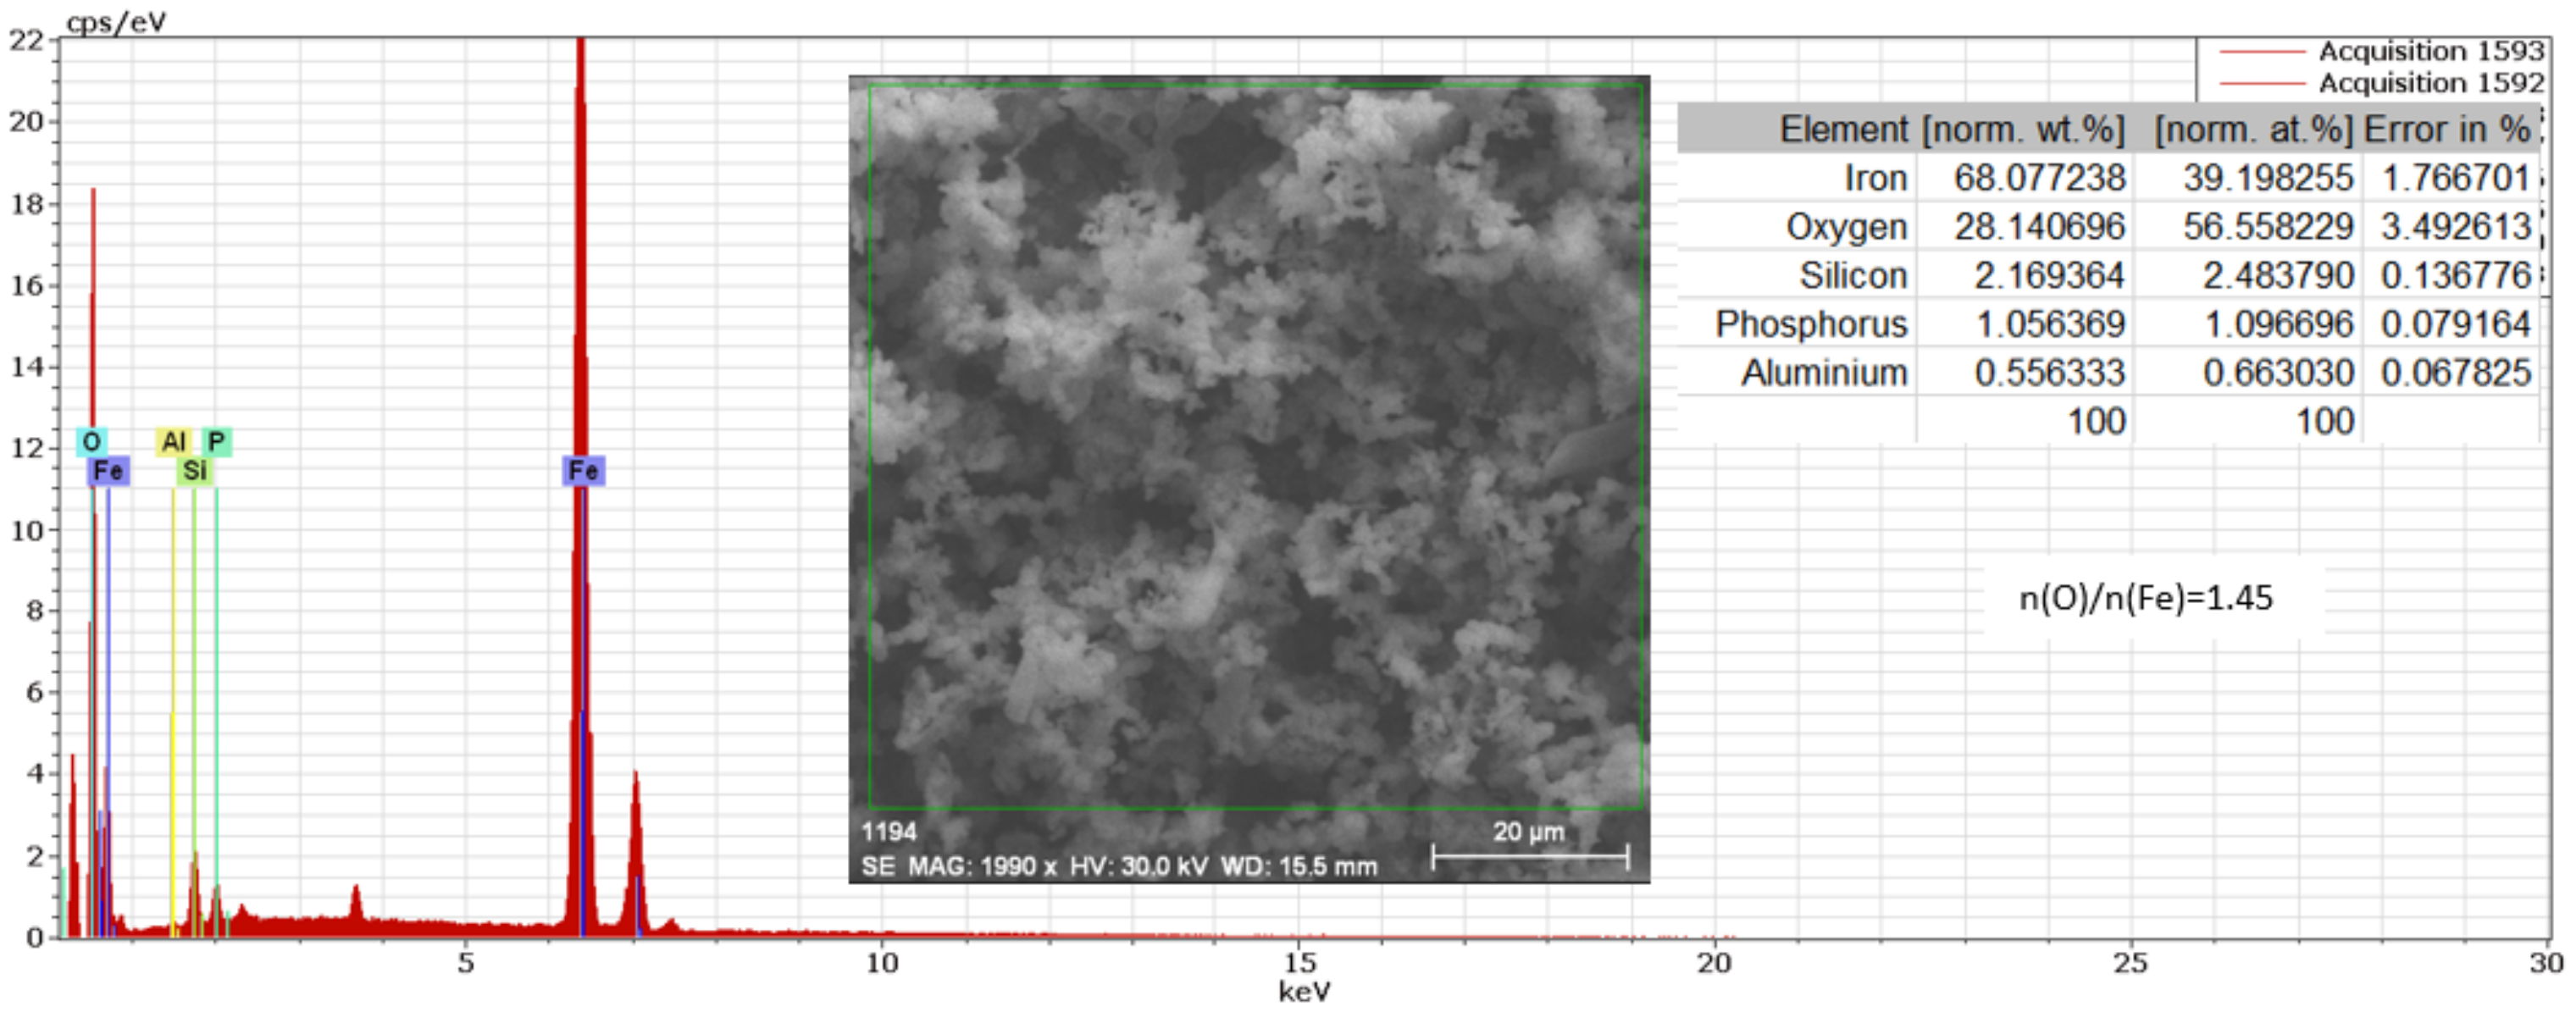
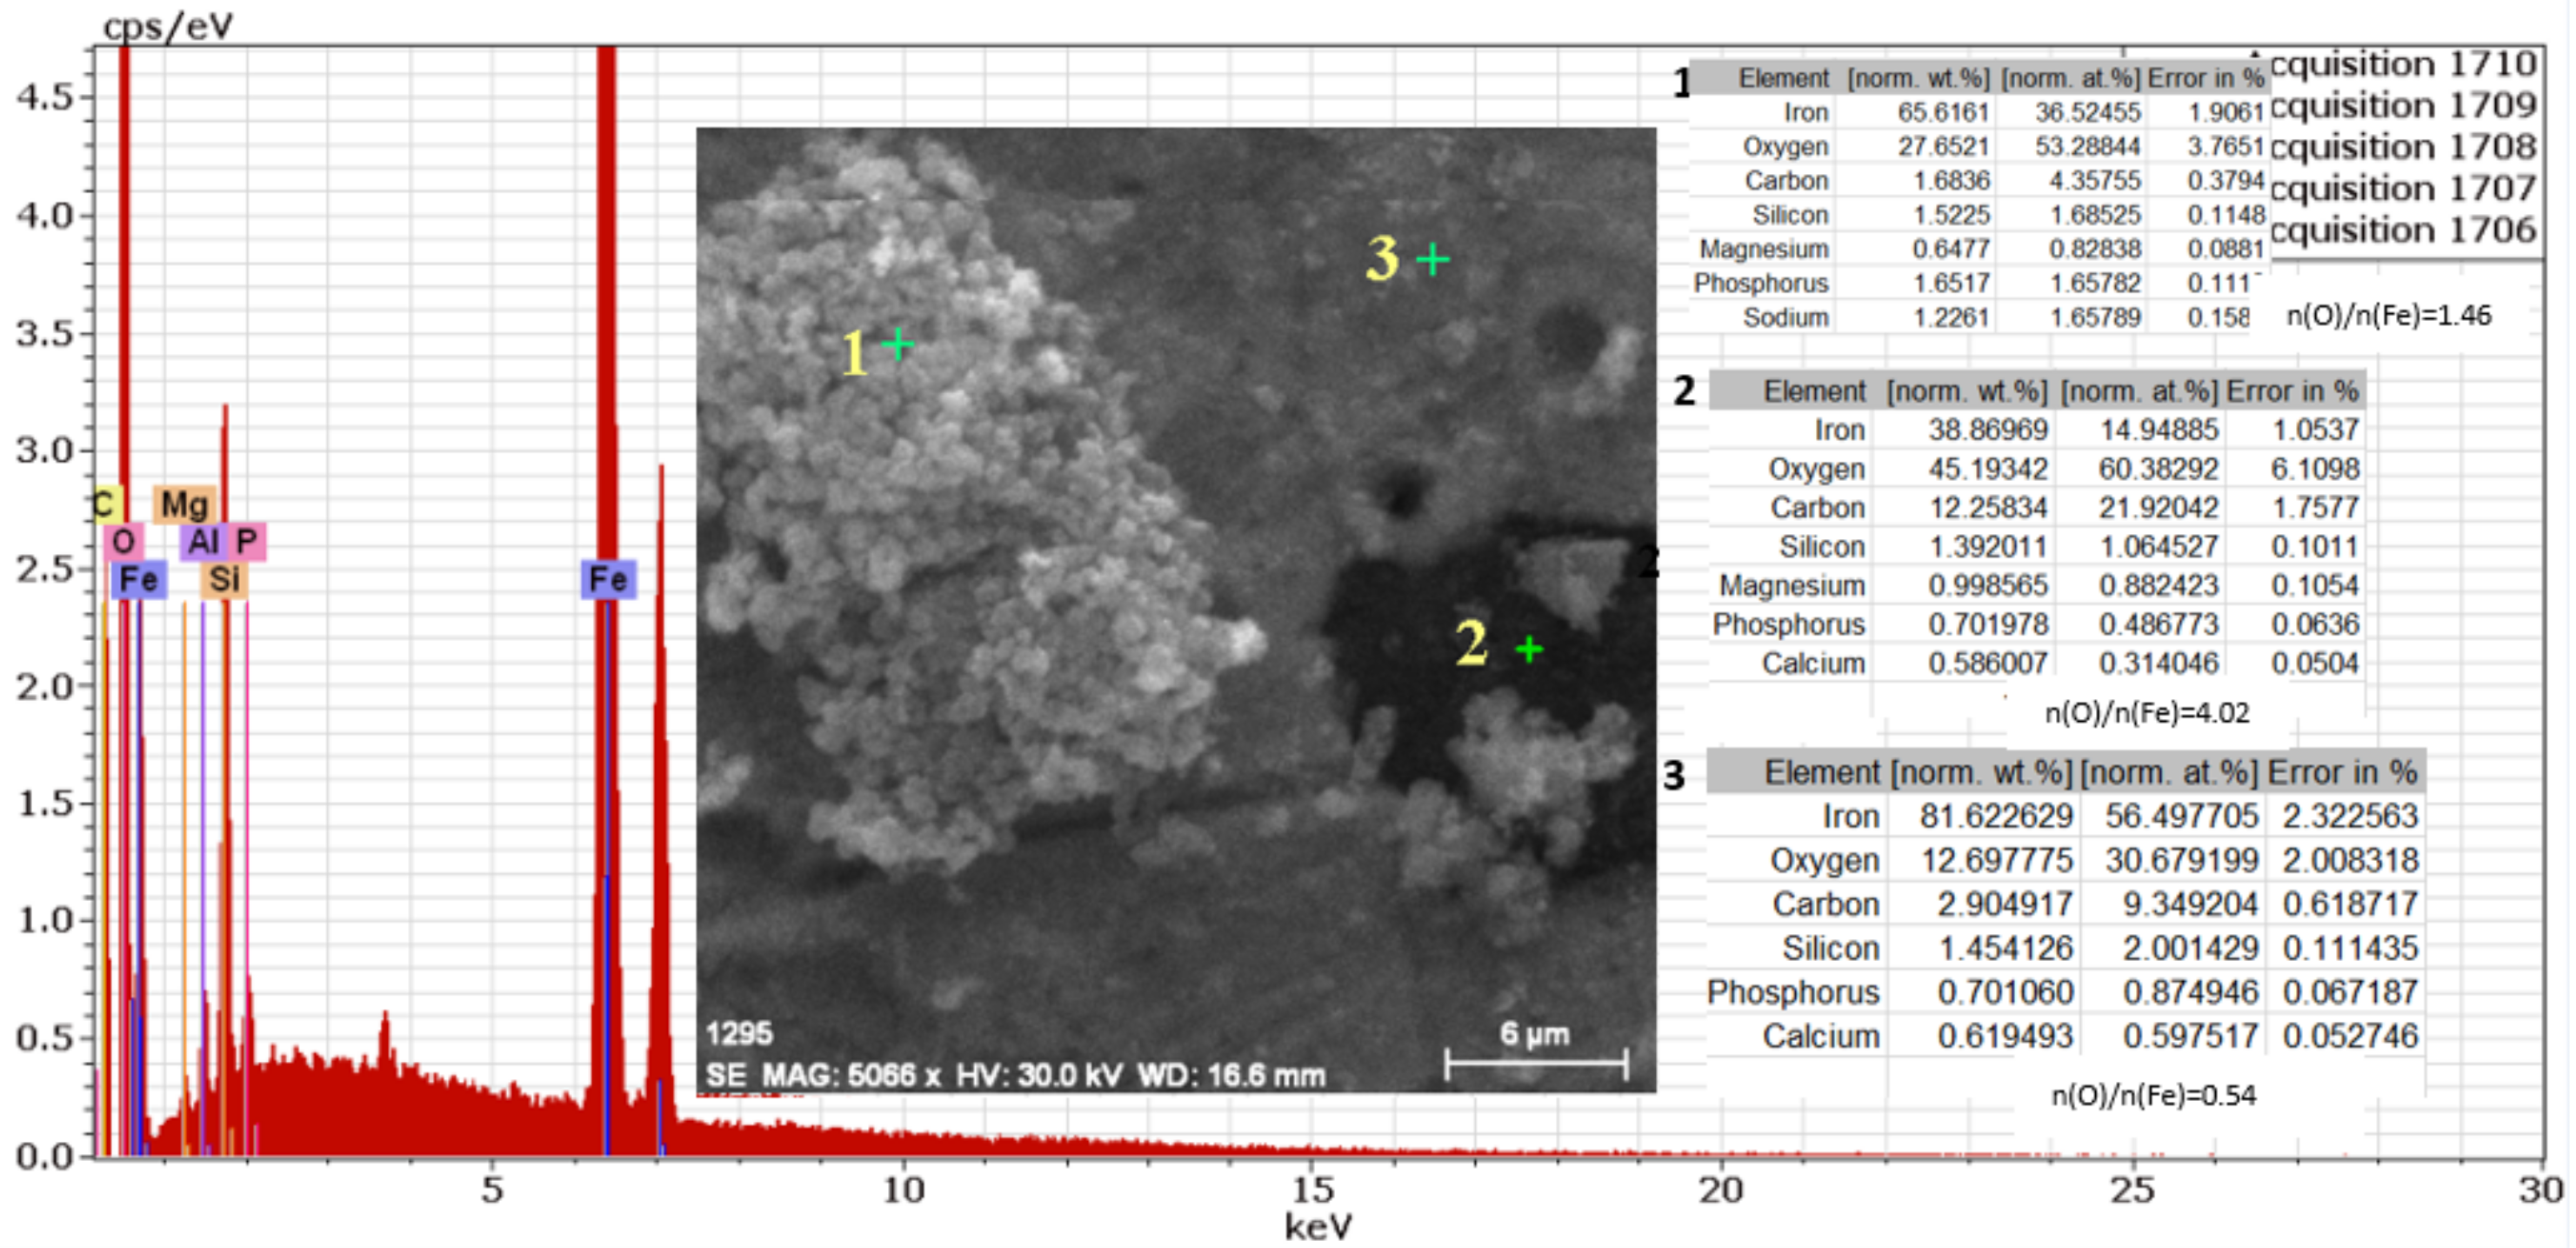
3.2. The Cast Iron Surface Layer Structure and Composition after Various Time Intervals of Immersion in Wastewaters with Different pHs

The structure and composition of the surface layer were analysed by Electrochemical Impedance Spectroscopy (EIS), scanning electron microscopy (SEM), and EDS microanalysis.
The EIS measurements, in this case, have some peculiarities because a horizontal three-electrode electrochemical cell was used in which the distance between the reference electrode and the measuring electrode was large (4 cm). In addition, the surface area of the sample exposed to contact with the corrosion medium was small (0.127 cm2). Under these conditions, the resistance of the liquid column between the reference electrode and the working electrode was relatively high. This choice has, on the one hand, the advantage that it allows one to obtain results slightly influenced by accidental fluctuations, but it has the disadvantage of the appearance of a false capacitive loop in the Nyquist diagram at very high frequencies [31]. This is an artificial state which, however, results in the fact that in the data analysis the evaluated capacity for the high-frequency loop is much smaller than any real capacity, being of the order of 10−10–10−9 F/cm2. An example of Nyquist and Bode’s plots, illustrating the occurrence of the high-frequency capacitive loop, is illustrated in Figure 4.

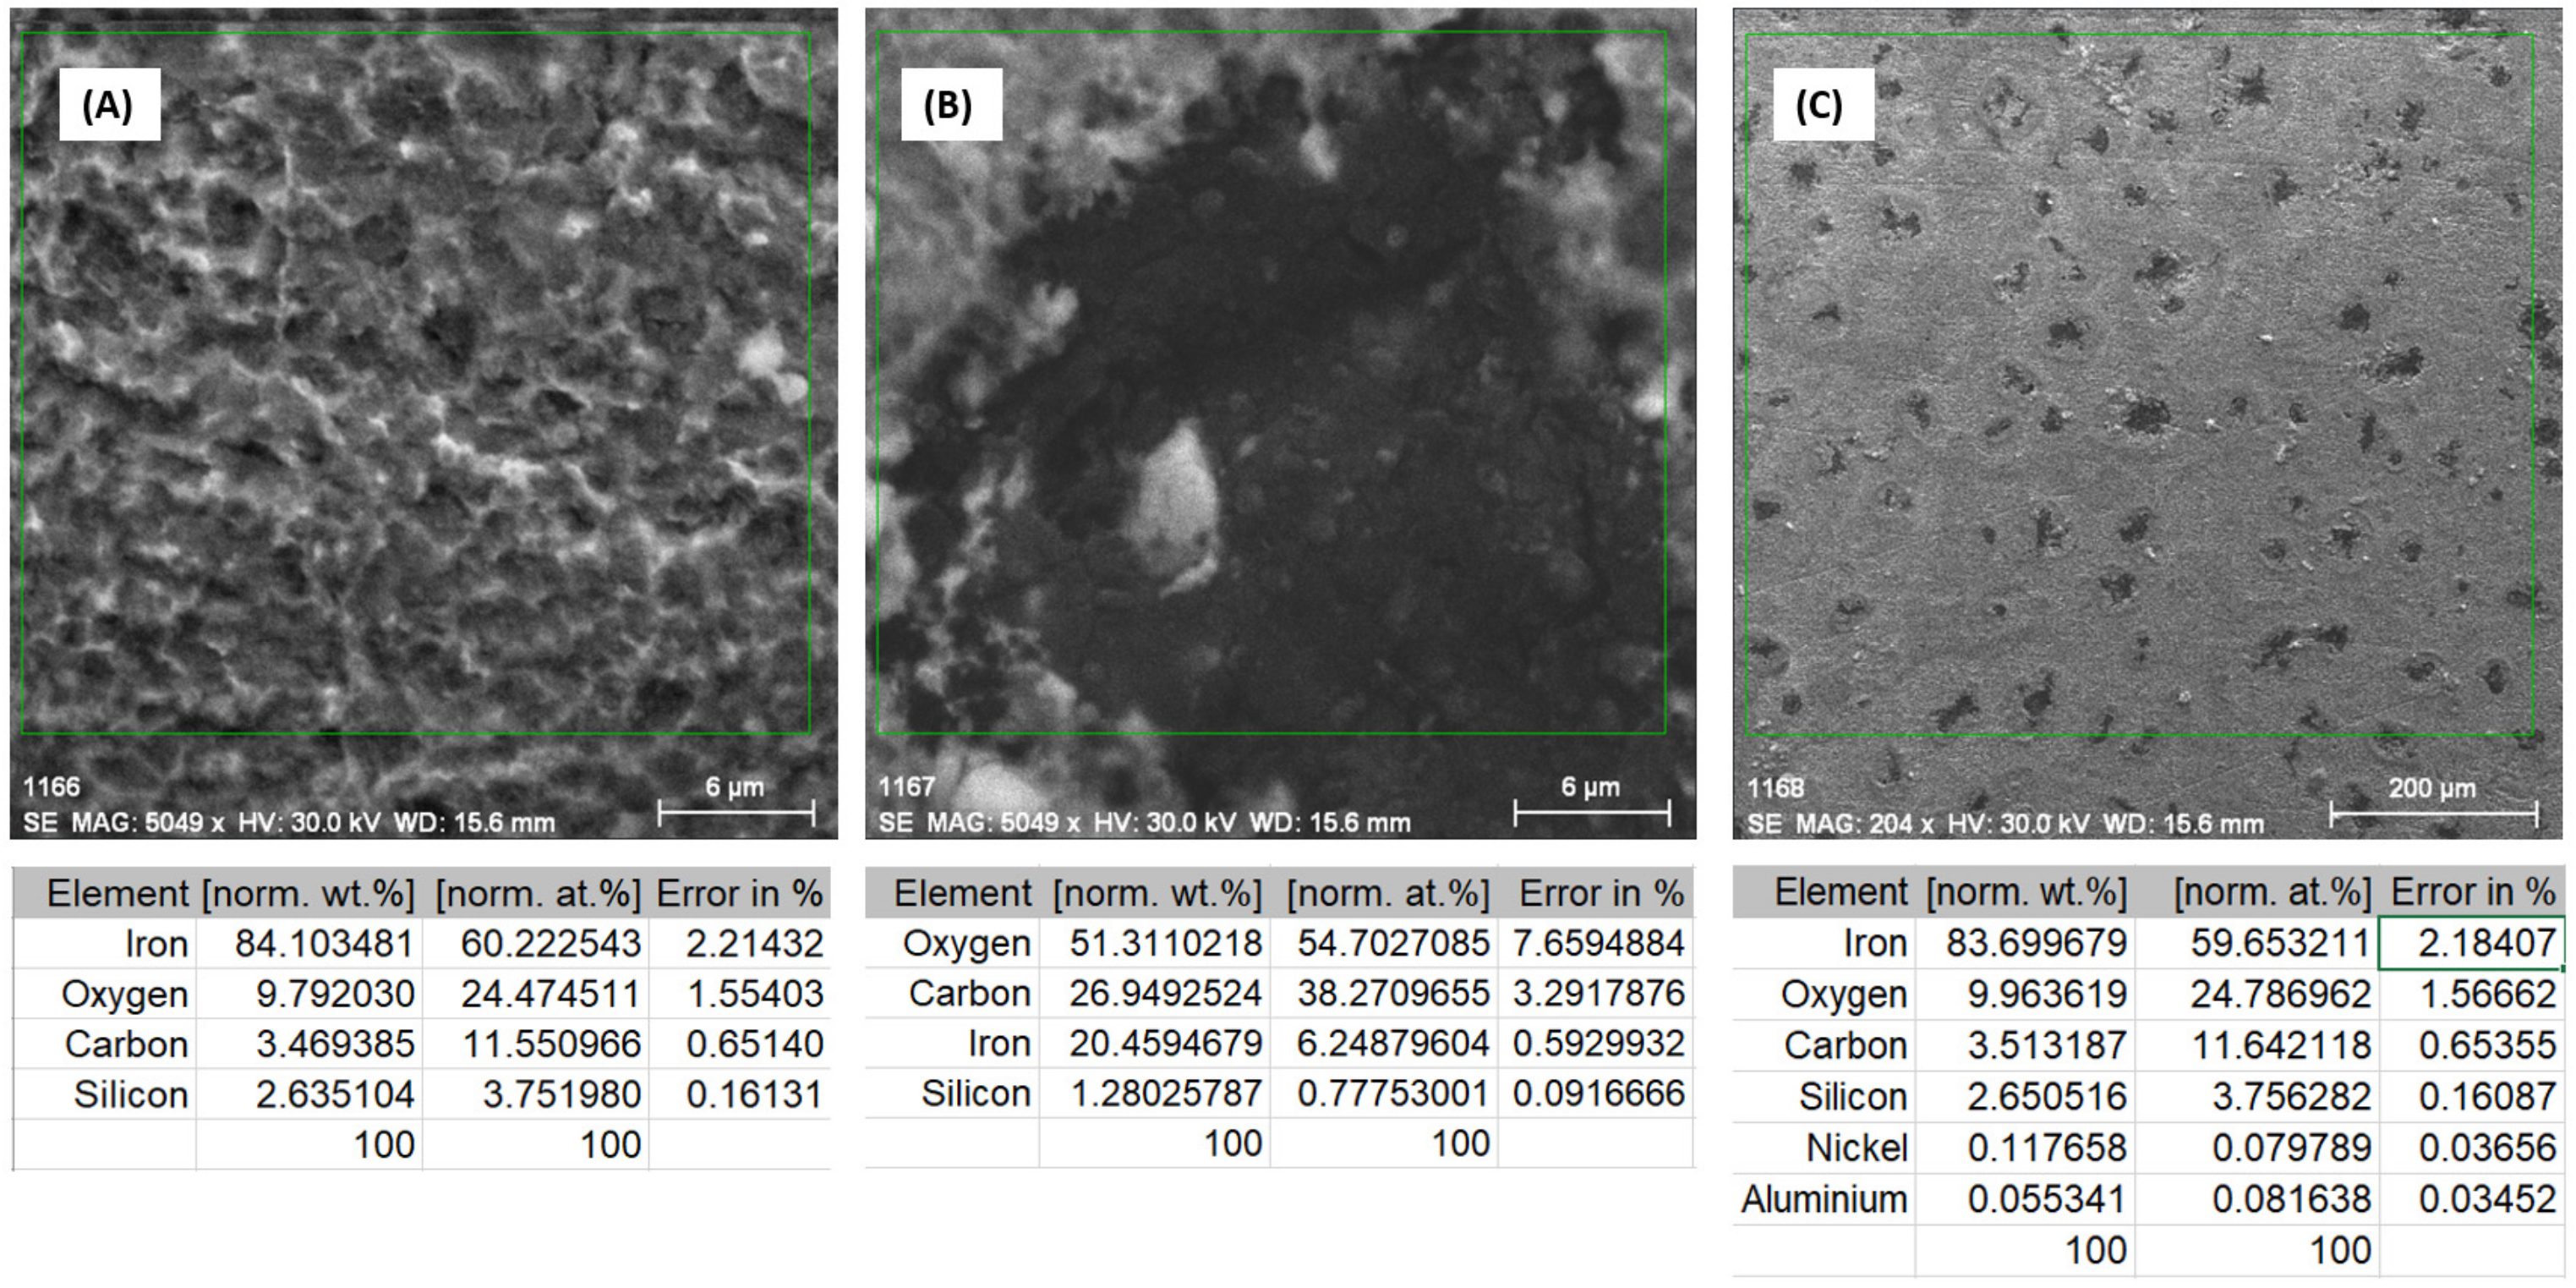
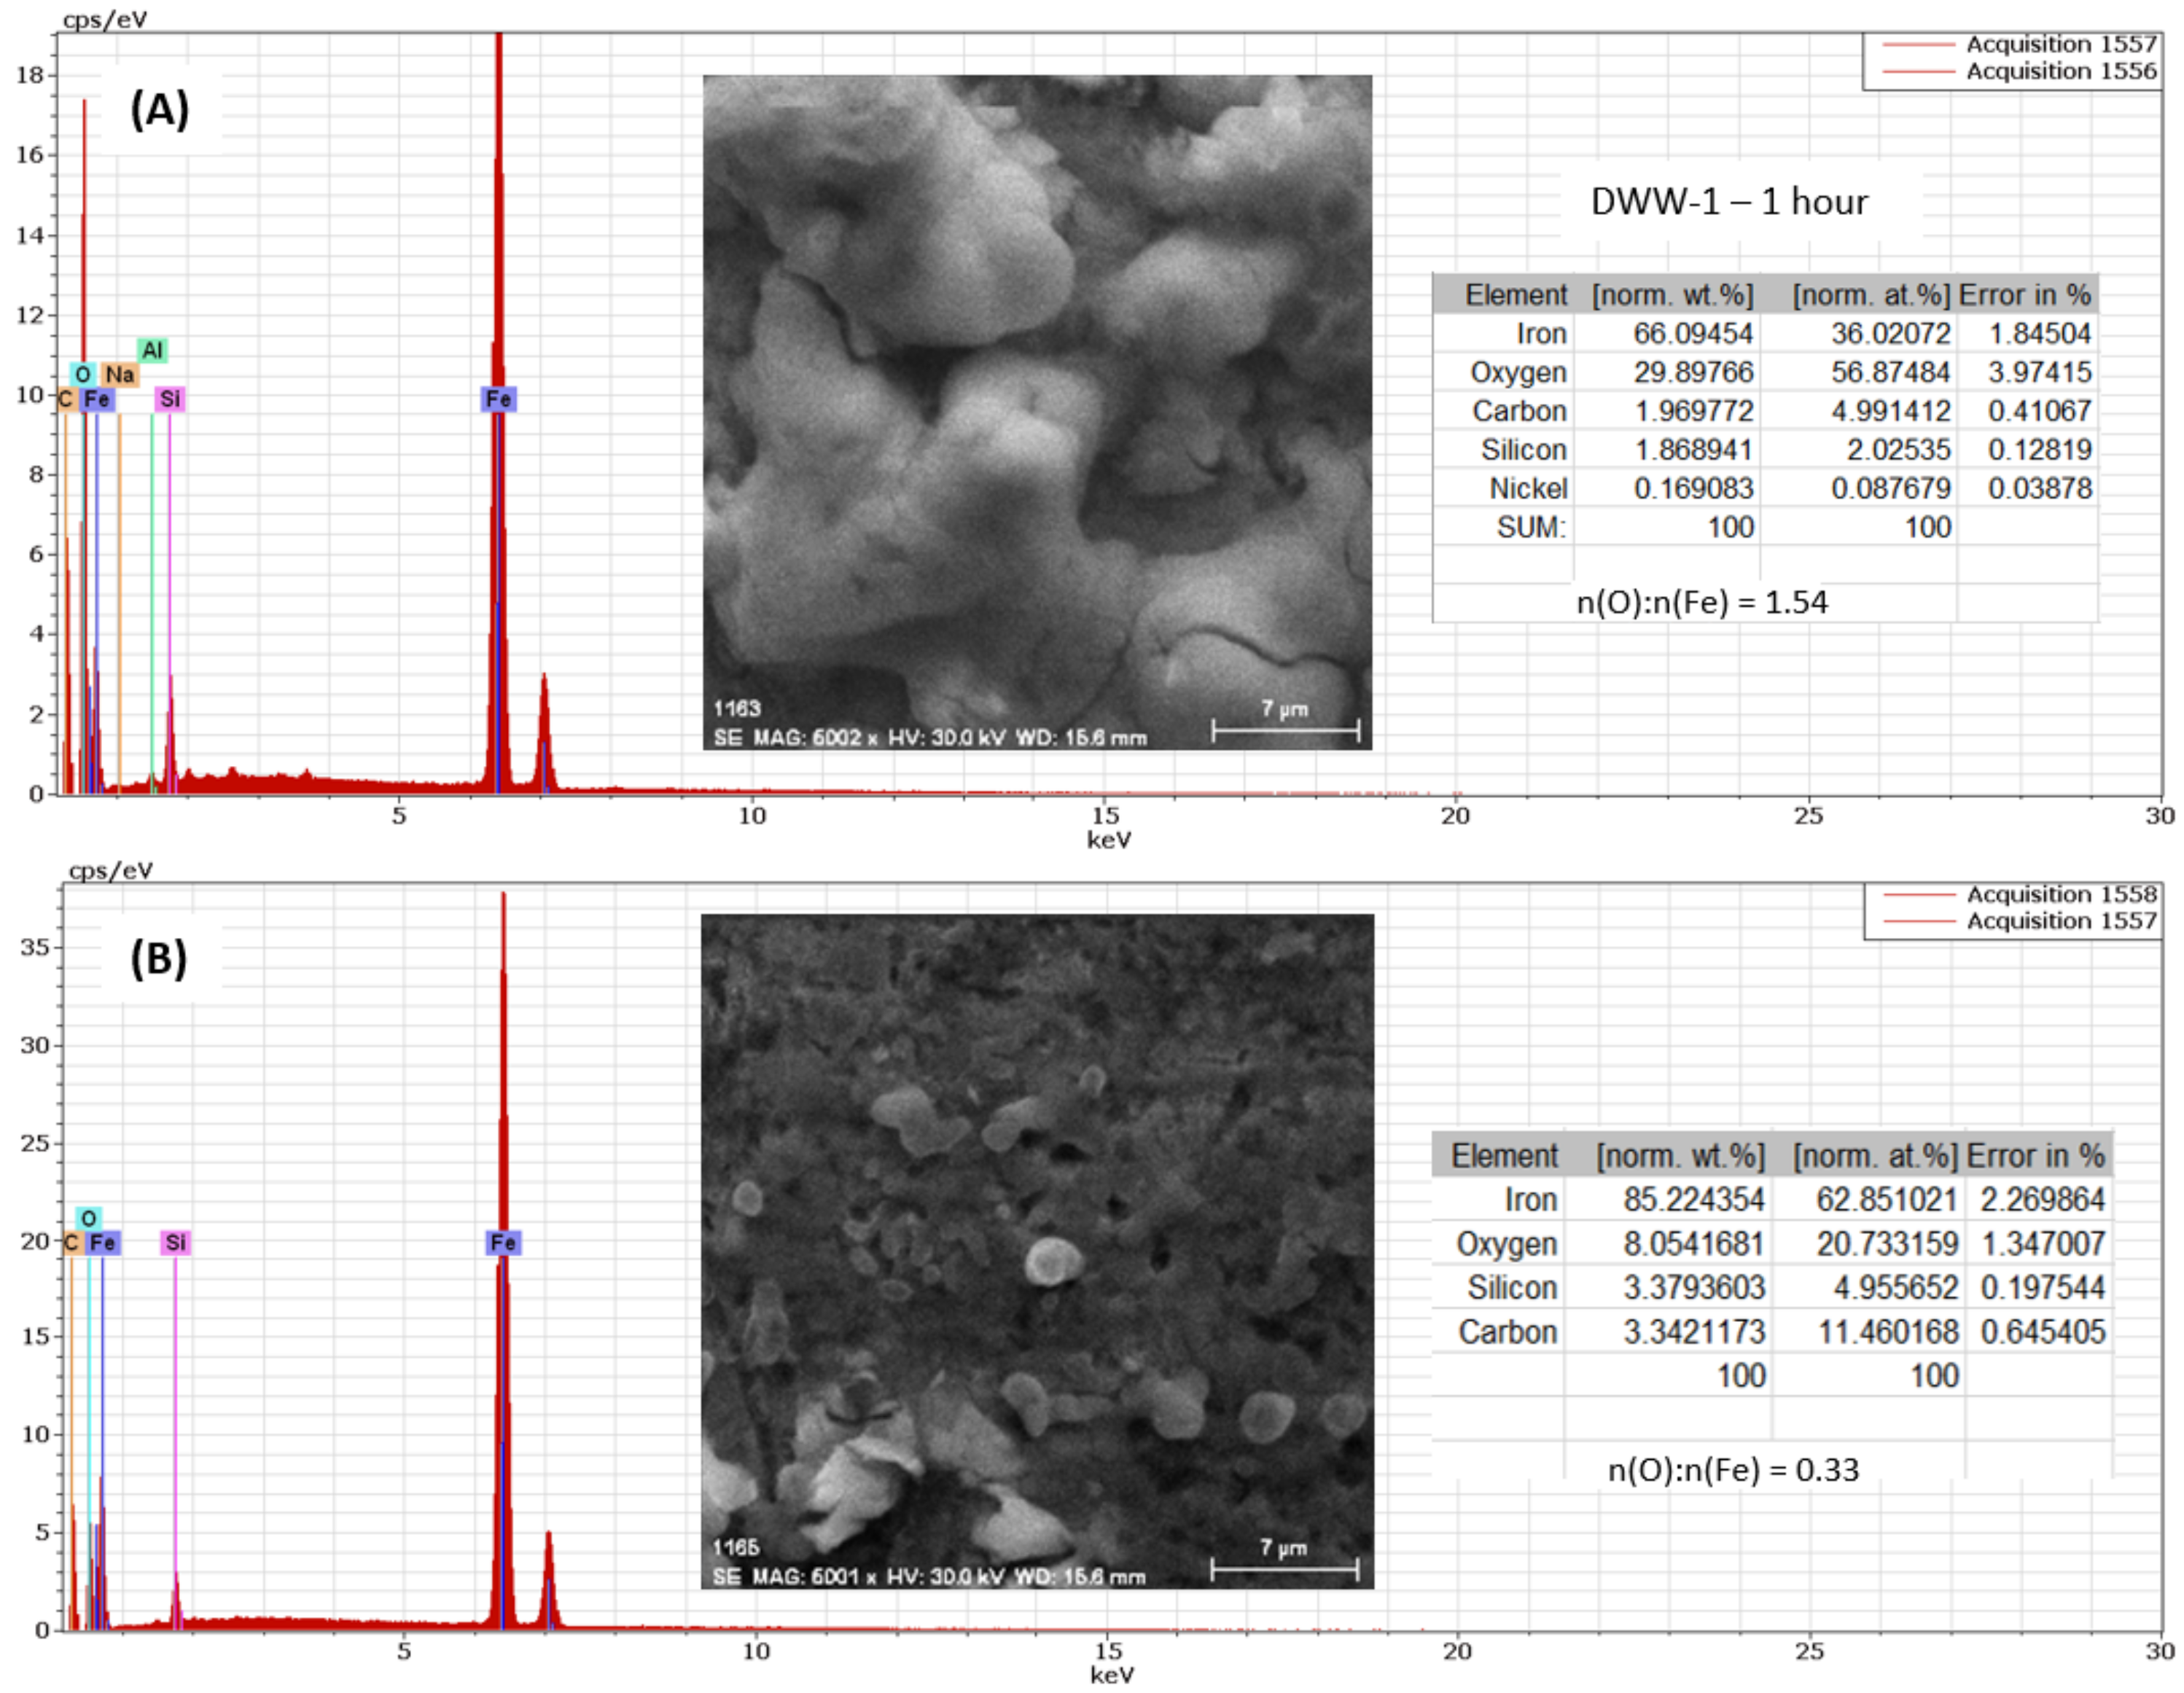
3.2.1. Study of Nodular Cast Iron Sample (Immersion Time 1 Hour)

For nodular cast iron with the polished surface in the base solution (DWW-1), acid solution (DWW-2) and alkaline solution (DWW-3), the fitting of the experimental data could be carried out with the same equivalent circuit, shown in Figure 5.
The Nyquist curves, obtained at Ecor, indicate a capacitive behaviour, characterised by incomplete semicircles, while the Bode representations show one or two constants for the relaxation time, indicated by 1-2 maximums on the phase variation curve with frequency. On Bode diagrams, Z = lg f, in the range of average frequencies straight lines are obtained with a slope close to the value (−1). The obtained spectra were interpreted by modelling the data with this circuit. The shape of the Bode spectra suggests a two-layer structure of the solution alloy interface. The values of the circuit elements in the three corrosion environments are shown in Table 6.
The value ε(Z) in the penultimate table column of the data represents the impedance measurement error (in percent). Its values indicate the accuracy of the measurements.
Better data modelling was achieved by replacing the capacity of the double layer (Cdl) with a constant phase element, respectively CPE (CPE—Constant Phase Element), which expresses the nonideal behaviour of capacities (capacity variation by frequency). The impedance of a constant phase element can be expressed by the relation proposed by Zoltowski [32,33] (1):
Z CPE = 1 Q j ω n
where: Q—is a constant proportional to the active area; <Q> = Ω−1 sn/cm2 S·sn/cm2, ω—angular frequency (ω = 2πf, f—the frequency of the applied alternating current), j—is the imaginary number; j = (−1)½. The frequency exponent can take values between (−1) şi (+1). CPE is a pure capacitor when n = 1, a pure resistor when n = 0, an inductor when n = −1, and a Warburg impedance when n = ½.
The elements of the equivalent circuit in Figure 5 have the meanings: Rs—electrolyte resistance between the working electrode (sample) and the reference electrode, Rct—resistance to charge transfer through the double-electric layer, CPE—constant phase element which in theory would represent the capacity of the double-electric layer (Cdl), but here it has the meaning of an imperfect capacitor (n < 1), Cext—the capacity of the outer layer, Rext—the resistance of the outer layer.
The resistance of the solution is higher in the case of DWW-1 (326 Ω·cm2), which has an almost neutral pH and contains relatively small quantities of inorganic salts but also electrically neutral organic compounds. In acidic and basic solutions, the resistance of the solution is lower due to HCl (158 Ω·cm2) or NaOH (205 Ω·cm2) added to adjust the pH to 3 and 11, respectively, thereby increasing the electrical conductivity of the solution.
The low values of charge transfer resistance (Rct) of the samples immersed in DWW-2 (284 Ω·cm2) and DWW-3 (584 Ω·cm2) indicate a high corrosion rate compared to the value of Rct in DWW-1 (1182 Ω·cm2). Therefore, the value of Rct decreases in the following order DWW-1 > DWW-3 > DWW-2, which means that the DWW-1 solution is the least aggressive compering with the other two.
The strength of the outer layer (Rext) is relatively high in the case of DWW-1 and much lower in other corrosion environments, also the value of the electric capacity of the outer layer (Cext) is extremely low (0.114 nF/cm2). This leads to the idea that the layer of corrosion products formed in the initial moments (during the time elapsed from the completion of the sample, introduction into solution, thermostatic, recording of linear polarisation curves, and electrochemical impedance measurements) is very thin. In the case of the sample measured in the solution with a pH of 6.5, the resistance of the outer layer is higher due to the adsorption of some organic compounds in the solution. This is confirmed by SEM micrographs, recorded at the same magnification power (×1000), as can be seen in the Figure 6.
It can be seen that, in the case of the DWW-1 solution, the amount of products adsorbed on the surface is much higher than in the DWW-3, while in the acidic environment, there are practically no adsorption points. These are consistent with the values of external resistance in the three environments.
The subunit value of the frequency exponent indicates that the constant phase element assigned to the electric double layer is an imperfect capacitor whose value increases in the order of DWW-1, DWW-2, and DWW-3. Double-layer ion transfer resistances (Rct), which are inversely proportional to the corrosion rate, are in good agreement with the evaluated corrosion rates in the linear polarisation curves.
The composition and the distribution spectrum of the elements on those two studied sample surface areas from DWW-1 are presented in Figure 7.
Iron oxide is predominant on some surface areas (detail A) which, according to the oxygen/iron molar ratio, could be Fe2O3. On other parts of the surface (detail B), the amount of oxide is very small but the deposits (light-coloured particles) could be portions of the adsorbed food components and the amount of oxide is much smaller.
For the sample studied in the acid corrosion environment (DWW-2) the surface aspects and compositions are shown in Figure 8, and the distribution of the elements on various areas of the surface is shown in Figure 9.
Most of the alloy surface is very weakly oxidised; the Oxygen/Iron molar ratio is very small, of the order of 0.3… 0.4, and the oxygen is evenly distributed on the surface, as can be seen in Figure 9A,C.
For the graphite nodule area, an increase in the number of oxides at the nodule/main alloy mass interface can be seen (Figure 9B). These have already pre-existed since the process of transforming the grey cast iron into nodular cast iron.
The surface appearance, the distribution of the elements in the alloy, and the surface composition of the freshly polished cast iron sample analysed in DWW-3 are presented in Figure 10. Unlike the samples analysed in DWW-1 and DWW-2, in this case, the surface of the alloy is relatively clean, without granular or extensive deposits and the degree of oxidation is low, the molar ratio n(O)/n(Fe) ~ 0.7.

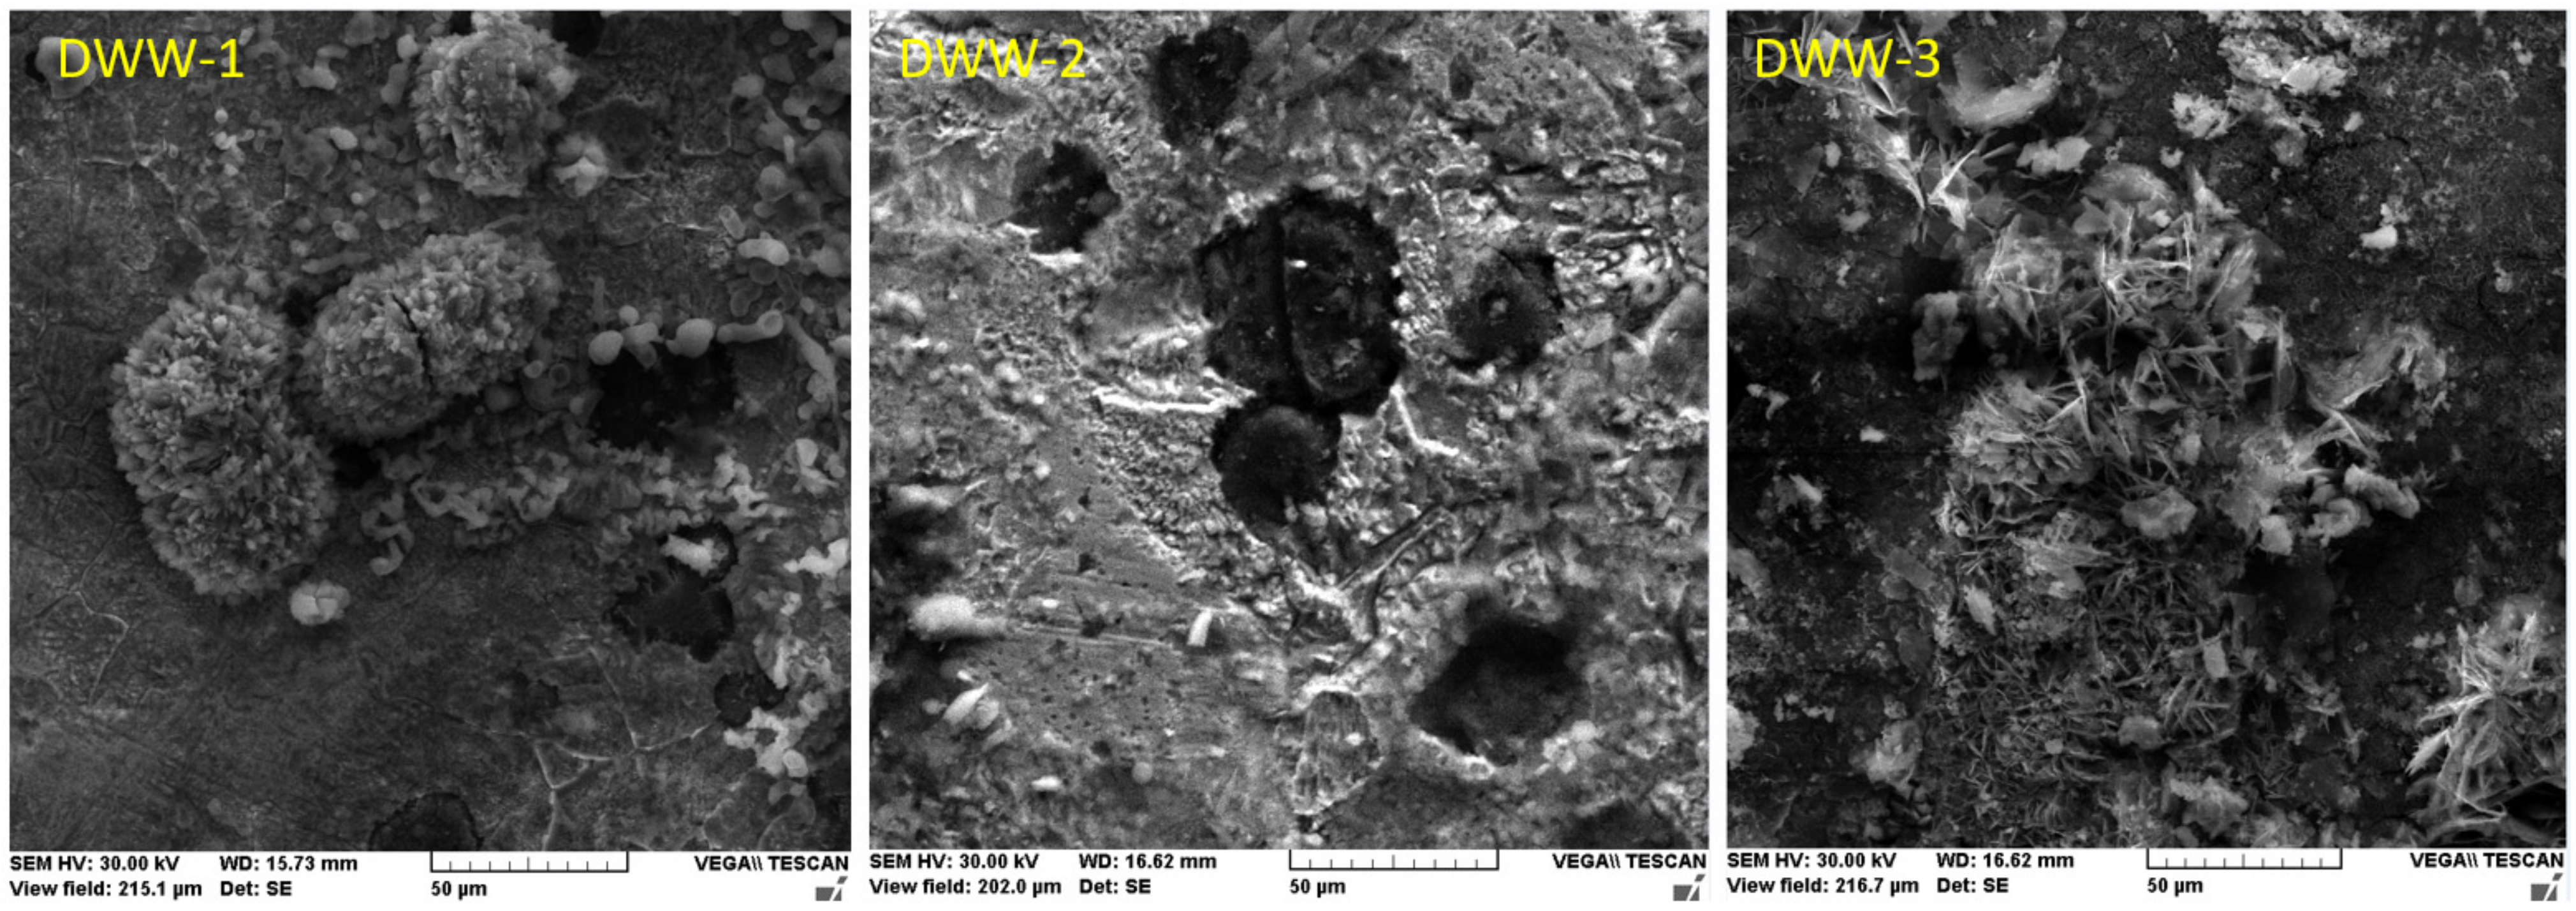
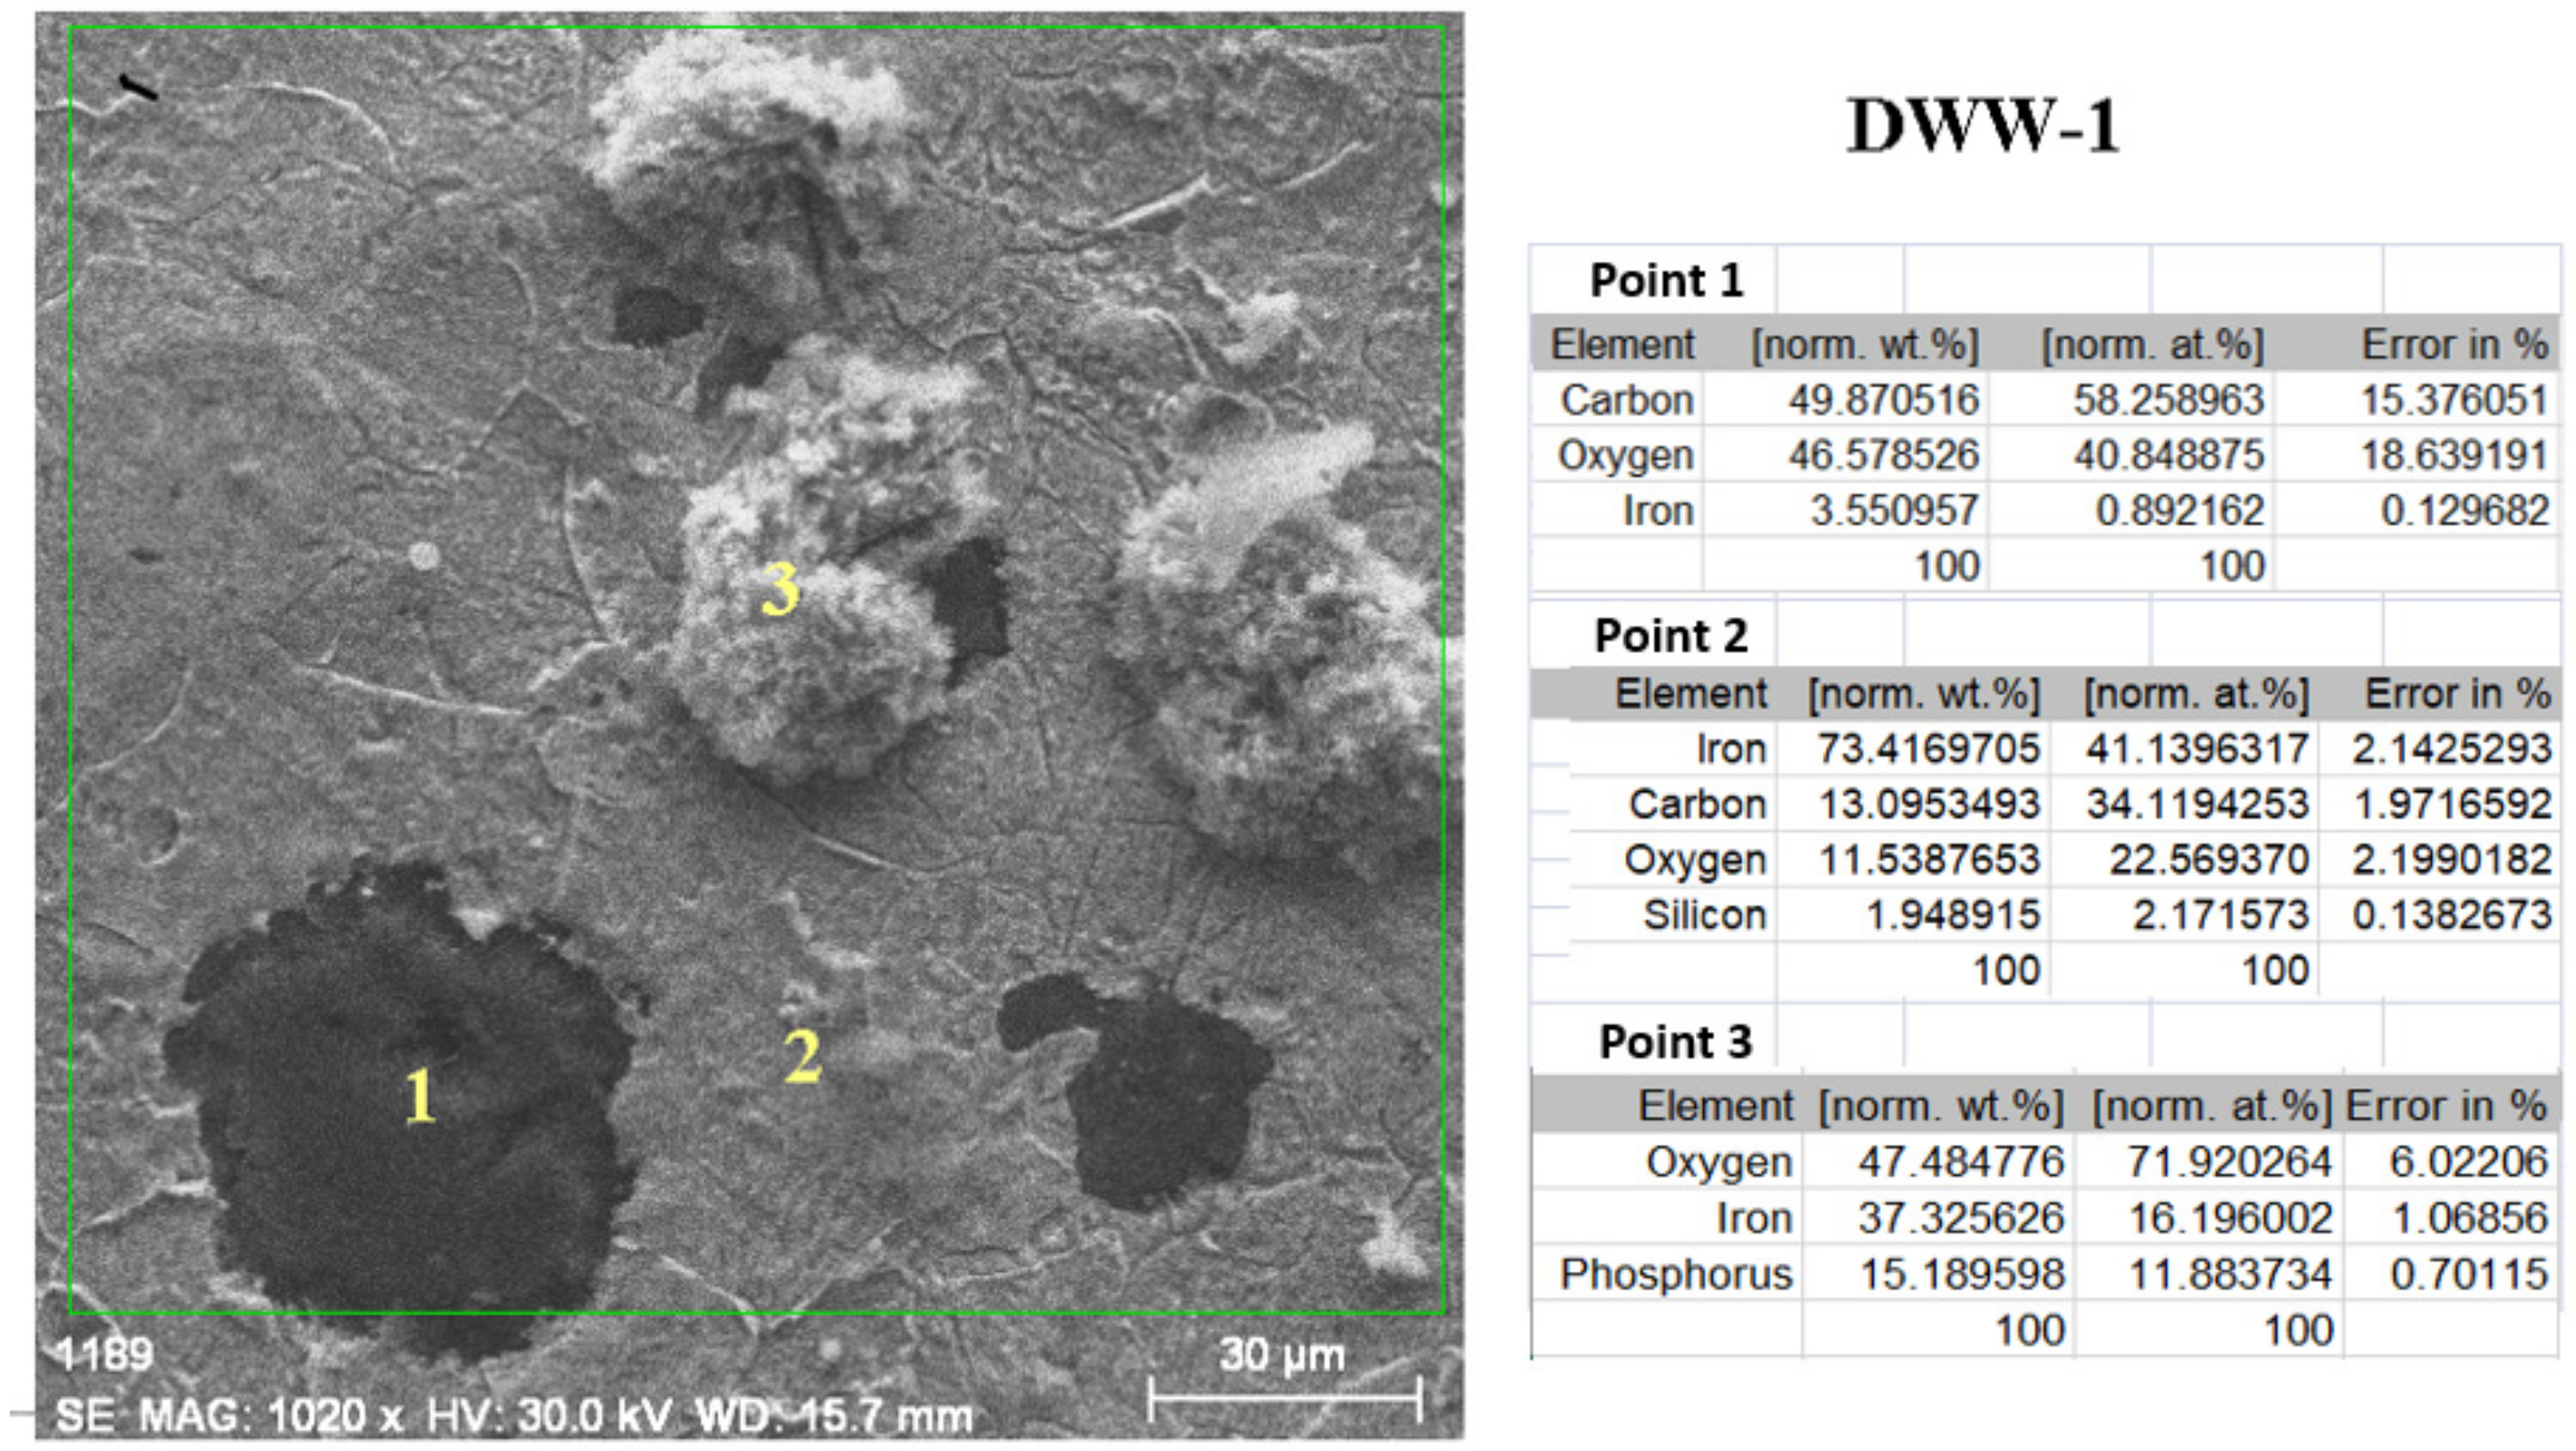
3.2.2. Study of Nodular Cast Iron Samples Immersed for 30 Days in Solution

The processing of the experimental data for electrochemical impedance to evaluate the structure of the surface layer after 30 days of immersion in corrosion media was performed using the same equivalent circuit as in the case of freshly polished samples—the circuit in Figure 5. The values of the equivalent circuit elements are presented in Table 7.
The solution resistance is in good agreement with the values obtained when studying freshly polished samples, the small differences being attributable to the changes produced in the solutions during long storage. The capacity of the outer layer is of the same order of magnitude (nF/cm2) for the DWW-1 and DWW-3 solutions but is three orders of magnitude larger for the acid solution. Unexpectedly, the strength of the outer layer in the DWW-1 solution is lower than for the freshly polished sample. And in these cases, the constant phase element is associated with an imperfect capacitor, in the case of DWW-2, this circuit element is very close to a Warburg impedance.
The corrosion rate of the samples, which can be correlated with the Rct, increases as the immersion time for sample DWW-3 decreases (from 584 Ω·cm2 to 572 Ω·cm2), while for the samples immersed in DWW-1 and DWW-2 an increase of the value of Rct can be observed. This aspect can be explained by changing the layer of products formed on the cast iron surface.
The values of resistance of solution (Rs) do not change significantly with increasing the immersion time.
As can be seen from Figure 5 for both sample’s one-hour and 30-day immersion, the physical significance of the equivalent circuit suggests the presence of an outer layer characterised by Rext and Cext but also a non-ideal capacitor (CPE) corresponding to the electric double layer.
The appearance of the nodular cast iron surface immersed for 30 days in the three corrosion media is shown in Figure 11. Different behaviours are observed depending on the pH of the solution, although the chemical composition is the same. According to the electrochemical impedance data, the surface layer has a two-layer structure, but the composition of the outer layer is much different from that found in the case of freshly polished samples.
A more complete characterisation of the deposits formed on the surface of the cast-iron immersed for 30 days in the three solutions was done by point microanalysis on various characteristic areas. Figure 12 shows the analysis of the surface maintained for 30 days in the neutral solution.
At point “1”, which is a graphite node, it is surprising to note the presence of large amounts of oxygen (molar ratio C:O = 1.42) although the oxidation of carbon is excluded. It may be assumed that the adsorption of some organic compounds from the solution (acetate, starch, etc.) has taken place. Iron is practically absent in the node. Equally surprising is the presence of carbon on the majority surface (point 2), only if organic components are absorbed here as well. It seems that iron is not oxidised (molar ratio O:Fe = 0.55), the oxygen present is probably part of the adsorbed substances. According to the crystal structure of the agglomerate in point 3, it appears that it is FeOOH (molar ratio O:Fe = 2), but at this point the molar ratio of O:Fe = 4.4, is unreasonable. The presence of phosphorus at this point suggests the idea that calcium and/or potassium phosphate was preferentially absorbed from the solution in the crystalline agglomerate of FeOOH.
The analysis of the sample surface maintained for 30 days in acidic domestic water is illustrated in Figure 13.
In this sample, regardless of the analysed area, a molar ratio of O:Fe is found much higher than for any iron oxide or hydroxide (5.28; 2.52; 3.63). Due to the presence of phosphorus, chlorine sulphur, and potassium, it can be assumed that in this case also the oxy-hydroxide (FeOOH) was formed but also on the graphite nodule’s chemical components from the solution are preferentially adsorbed.
In alkalised domestic water (DWW-3), the results are shown in Figure 14 points out that the majority of surface compounds are FeO (molar ratio O:Fe = 1, point 2 in the figure), while the crystalline deposits represent FeOOH (points 1 and 3). It is assumed that in the alkaline environment there is no adsorption or absorption of the compounds from the solution.

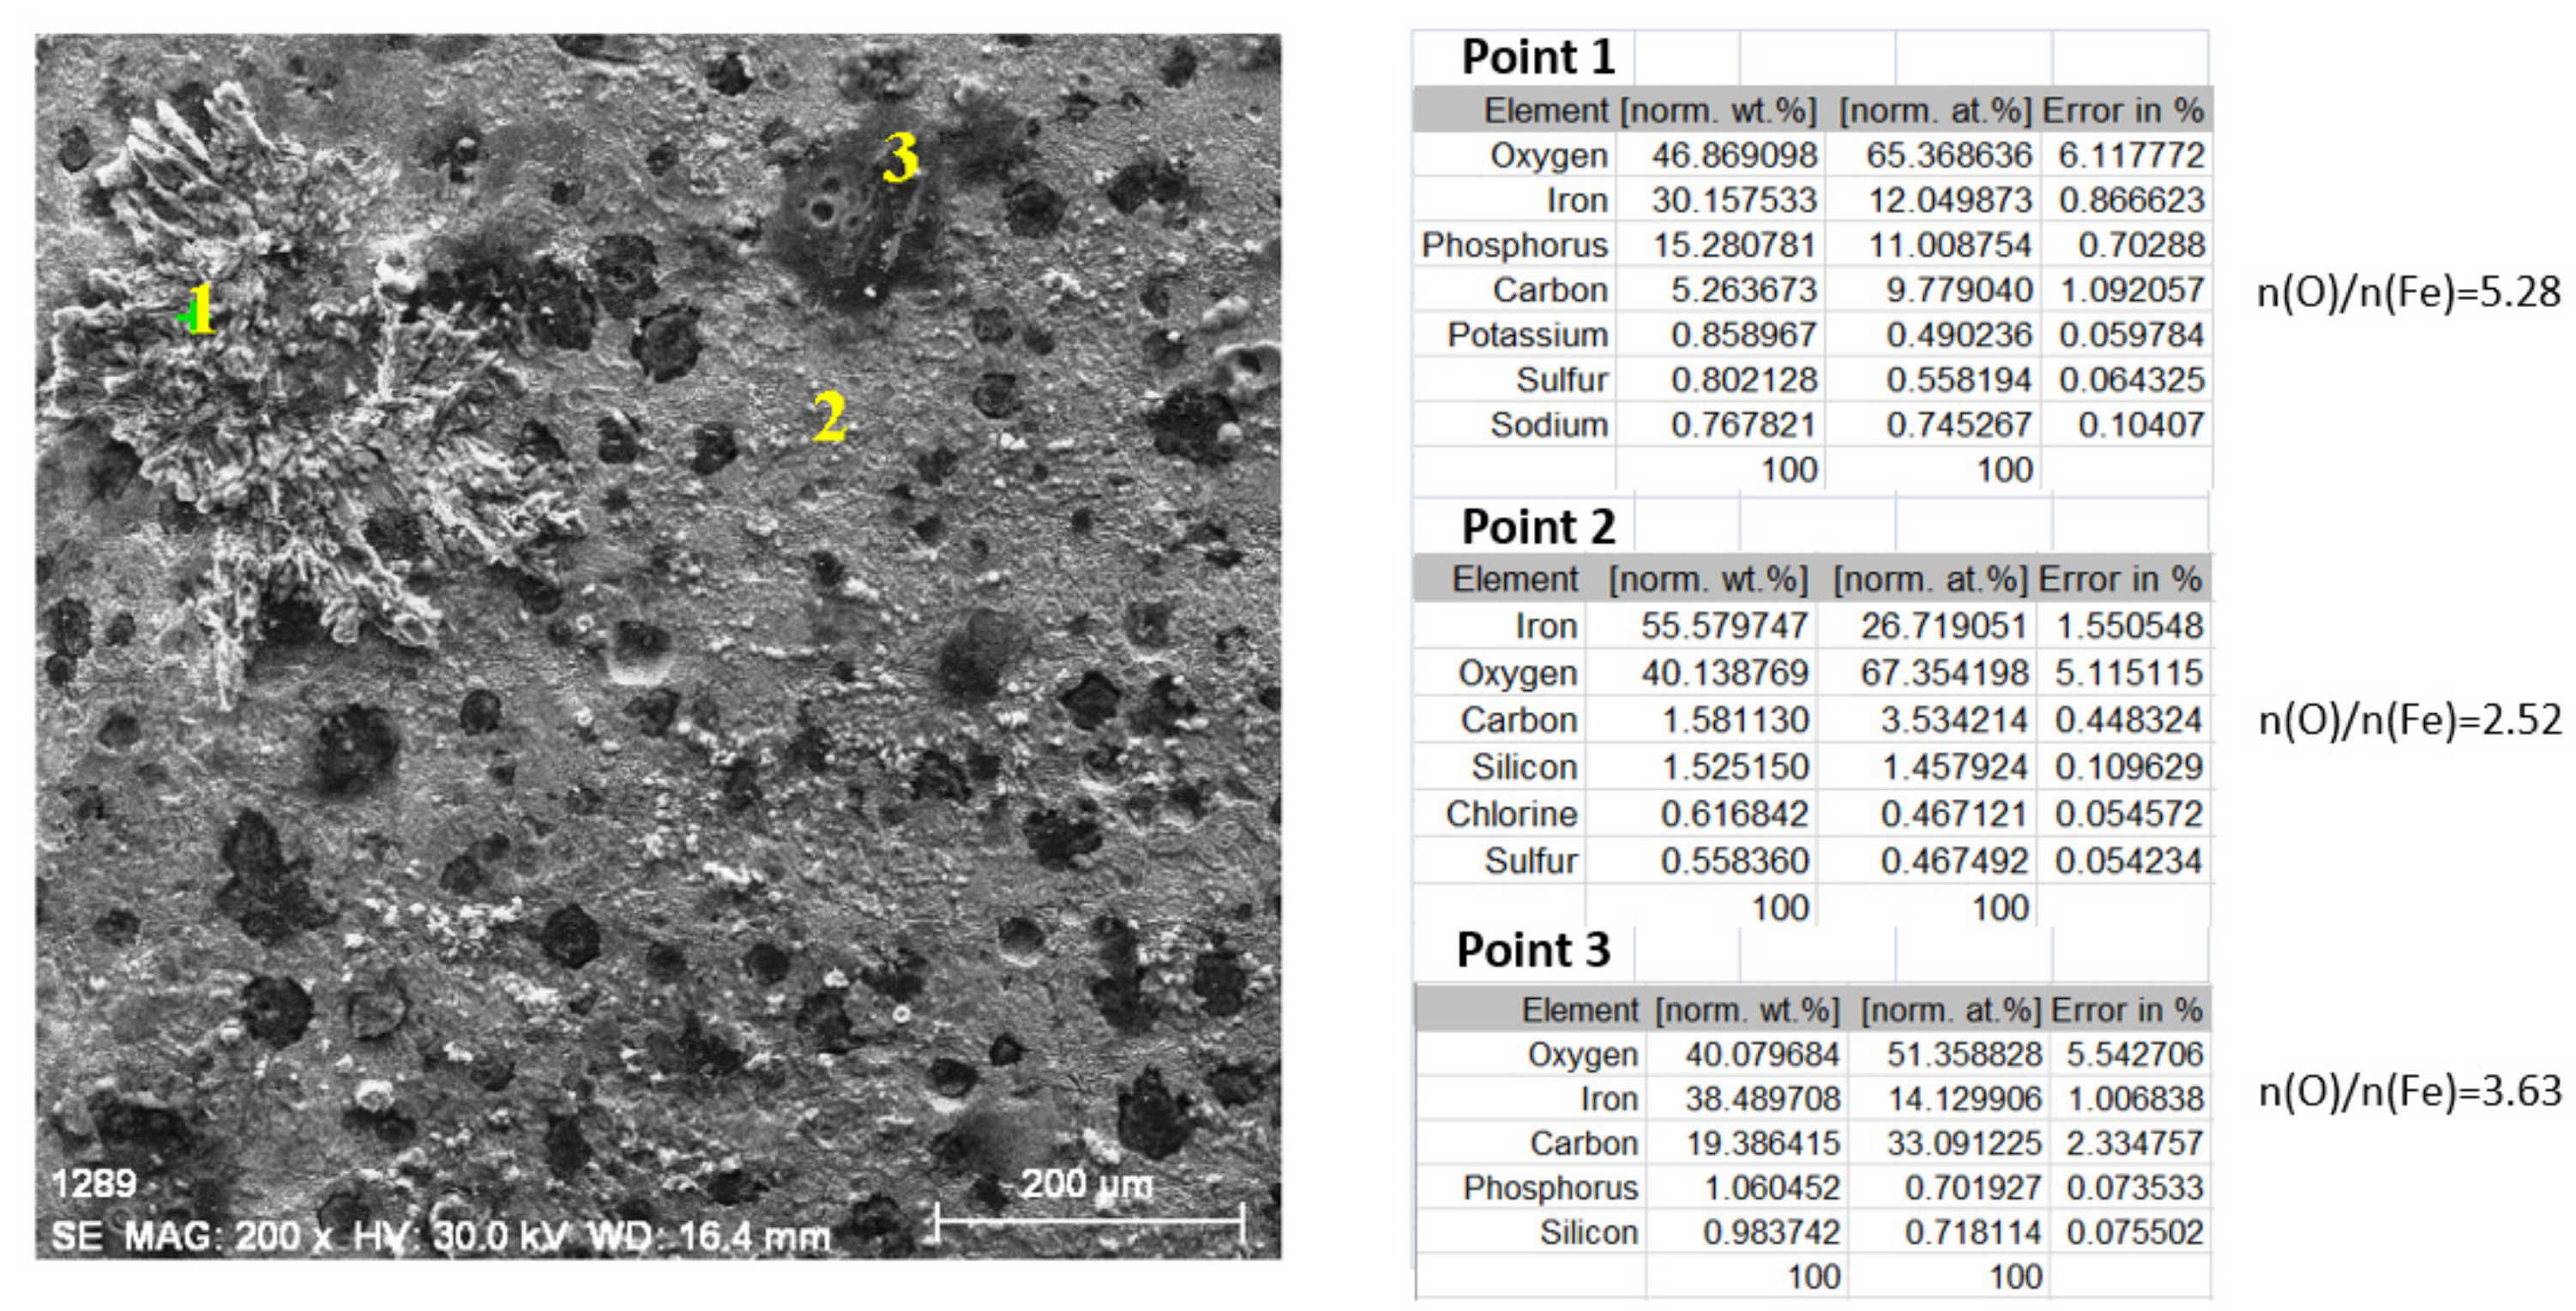
3.2.3. Study of Nodular Cast Iron Samples Immersed for 65 Days in Solution

For the modelling of the Electrochemical Impedance Spectroscopy data of the immersed samples for 65 days, a circuit equivalent with three-time constants was used, the scheme of which is shown in Figure 15.
According to this model, after 65 days of immersion in corrosion media, the surface of the alloy is covered with a protective crust consisting of two layers, a compact outer layer, and an inner layer, porous and uneven. These are deposited over the indissoluble electrical double layer bound to the metal surface [8]. The inner layer is formed in the initial stages of corrosion (probably in the first 30 days of immersion); it is a thin layer, loose, uneven, and easily removable from the surface of the alloy. In the corrosion process, the ferrous ion (Fe II) is formed, which later oxidises to Fe (III) with the formation of Fe3O4, which is a ferro-ferric oxide, a good conductor of electrons. Subsequently, magnetite oxidises to α-FeOOH (Goethite) and γ-FeOOH (Lepidocrocyte). All these transformations take place in the inner layer, which is why De Marco and Pejcic [34] called it a deficient modified layer in Fe. The Boukamp circuit elements parameter values for the sample maintained for 65 days in the three corrosion environments are presented in Table 8.
The exponent frequency values in the expression of the constant phase element (CPE), very close to the value ½, indicate that in the three solvents this circuit element is a diffusion impedance. The ion transfer through the inner layer is controlled by diffusion.
The values of the resistance of solution (Rs) decrease, this is due to the significant increase in the strength of the outer layer compared to the values of the Rext for the samples immersed for 30 days in wastewaters (for DWW-1 from 325 Ω·cm2 to 351 Ω·cm2, for DWW-2 from 32.45 Ω·cm2 to 34 Ω·cm2 and DWW-3 from 31.76 Ω·cm2 to 33.1 Ω·cm2).
After immersion for 65 days in DWW-1 (neutral domestic wastewater), the pH of the corrosion medium decreased from 6.5 to 6.0, and reddish-brown flakes of reaction are to be found in the solution. On a part of the surface of the sample, there is a thick layer of product, which can be easily detached. The appearance of the sample after removal from the solution and drying is shown in Figure 16a. Some of the crust on the surface of the sample came off during handling. Details in Figure 16b,c illustrate the aspects of the respective uncovered covered areas, increased by 200×.
The covered area, including the corrosion product passed in solution, consists exclusively of FeOOH, while on the surface from which the solid deposit came off, a thin layer of FeOOH remained surrounding the graphite nodules. Calcium acid phosphate from the solution is preferentially adsorbed on this surface (see Figure 17).
The de-alloying tendency is also noticeable, due to the more accentuated corrosion around the nodules. Probably in addition to the different compositions in the alloy/node contact area, the effect of galvanic corrosion also plays an important role in this process.
The cast iron sample immersed for 65 days in the DWW-2 solution is completely covered with a thick layer of reaction product (Figure 18a). There are a lot of reddish-brown flakes in the storage solution and the pH of the solution has increased from 3 to 5.5. The appearance of the product layer covering the sample at various magnifications is shown in Figure 18b,c.
The energy spectrum, appearance, and composition of the product on the sample surface maintained for 65 days in the acid solution are shown in Figure 19.
The oxygen/Fe molar ratio indicates that the solid reaction product deposited on the sample surface is most likely Fe2O3. It appeared by dehydroxylation of FeOOH formed in the initial stages, being favoured by the acidic environment of the solution. This probably explains also the corrosion medium pH increase.
For the sample immersed for 65 days in simulated alkaline domestic water (DWW-3; pH = 11), no product flakes were found in the solution and the surface of the sample was no longer covered with a compact, voluminous layer of reaction products. In this case, the surface of the sample shows areas with various types of products. Two such areas are shown in Figure 20 and Figure 21.
In area A, there is a compact deposition with cracks (which appeared after the sample has dried). At two points on the surface of this crust the molar ratio O:Fe is 1.80, so it can be assumed that the product is either FeOOH (n(O)/n(Fe) = 2) or Fe2O3 (n(O)/n(Fe) = 1.5), or a mixture of them. The formation of crust and its influence on the decreasing of corrosion rate were also confirmed by Nofal et al. [35].
However, it cannot be ruled out that the deposit is only Fe2O3, and the excess oxygen comes from adsorbed compounds, most likely phosphates, but also from adsorbed food components.
In area B, there is a crystalline agglomeration on which the composition was measured (in point 1), according to which the crystals represent Fe2O3 on which components of the solution are adsorbed. In the same area, on a carbon nodule, there is a significant amount of oxygen, which does not come from iron oxides (this being a very small amount on the node). Here, too, oxygen most likely comes from adsorbed substances. In point 3, in this area, the molar ratio O:Fe is very small (0.54), so the high percentage of oxygen comes again from the adsorbed substances, most likely from the absorbed organic compounds (the percentage of carbon in this region is big).

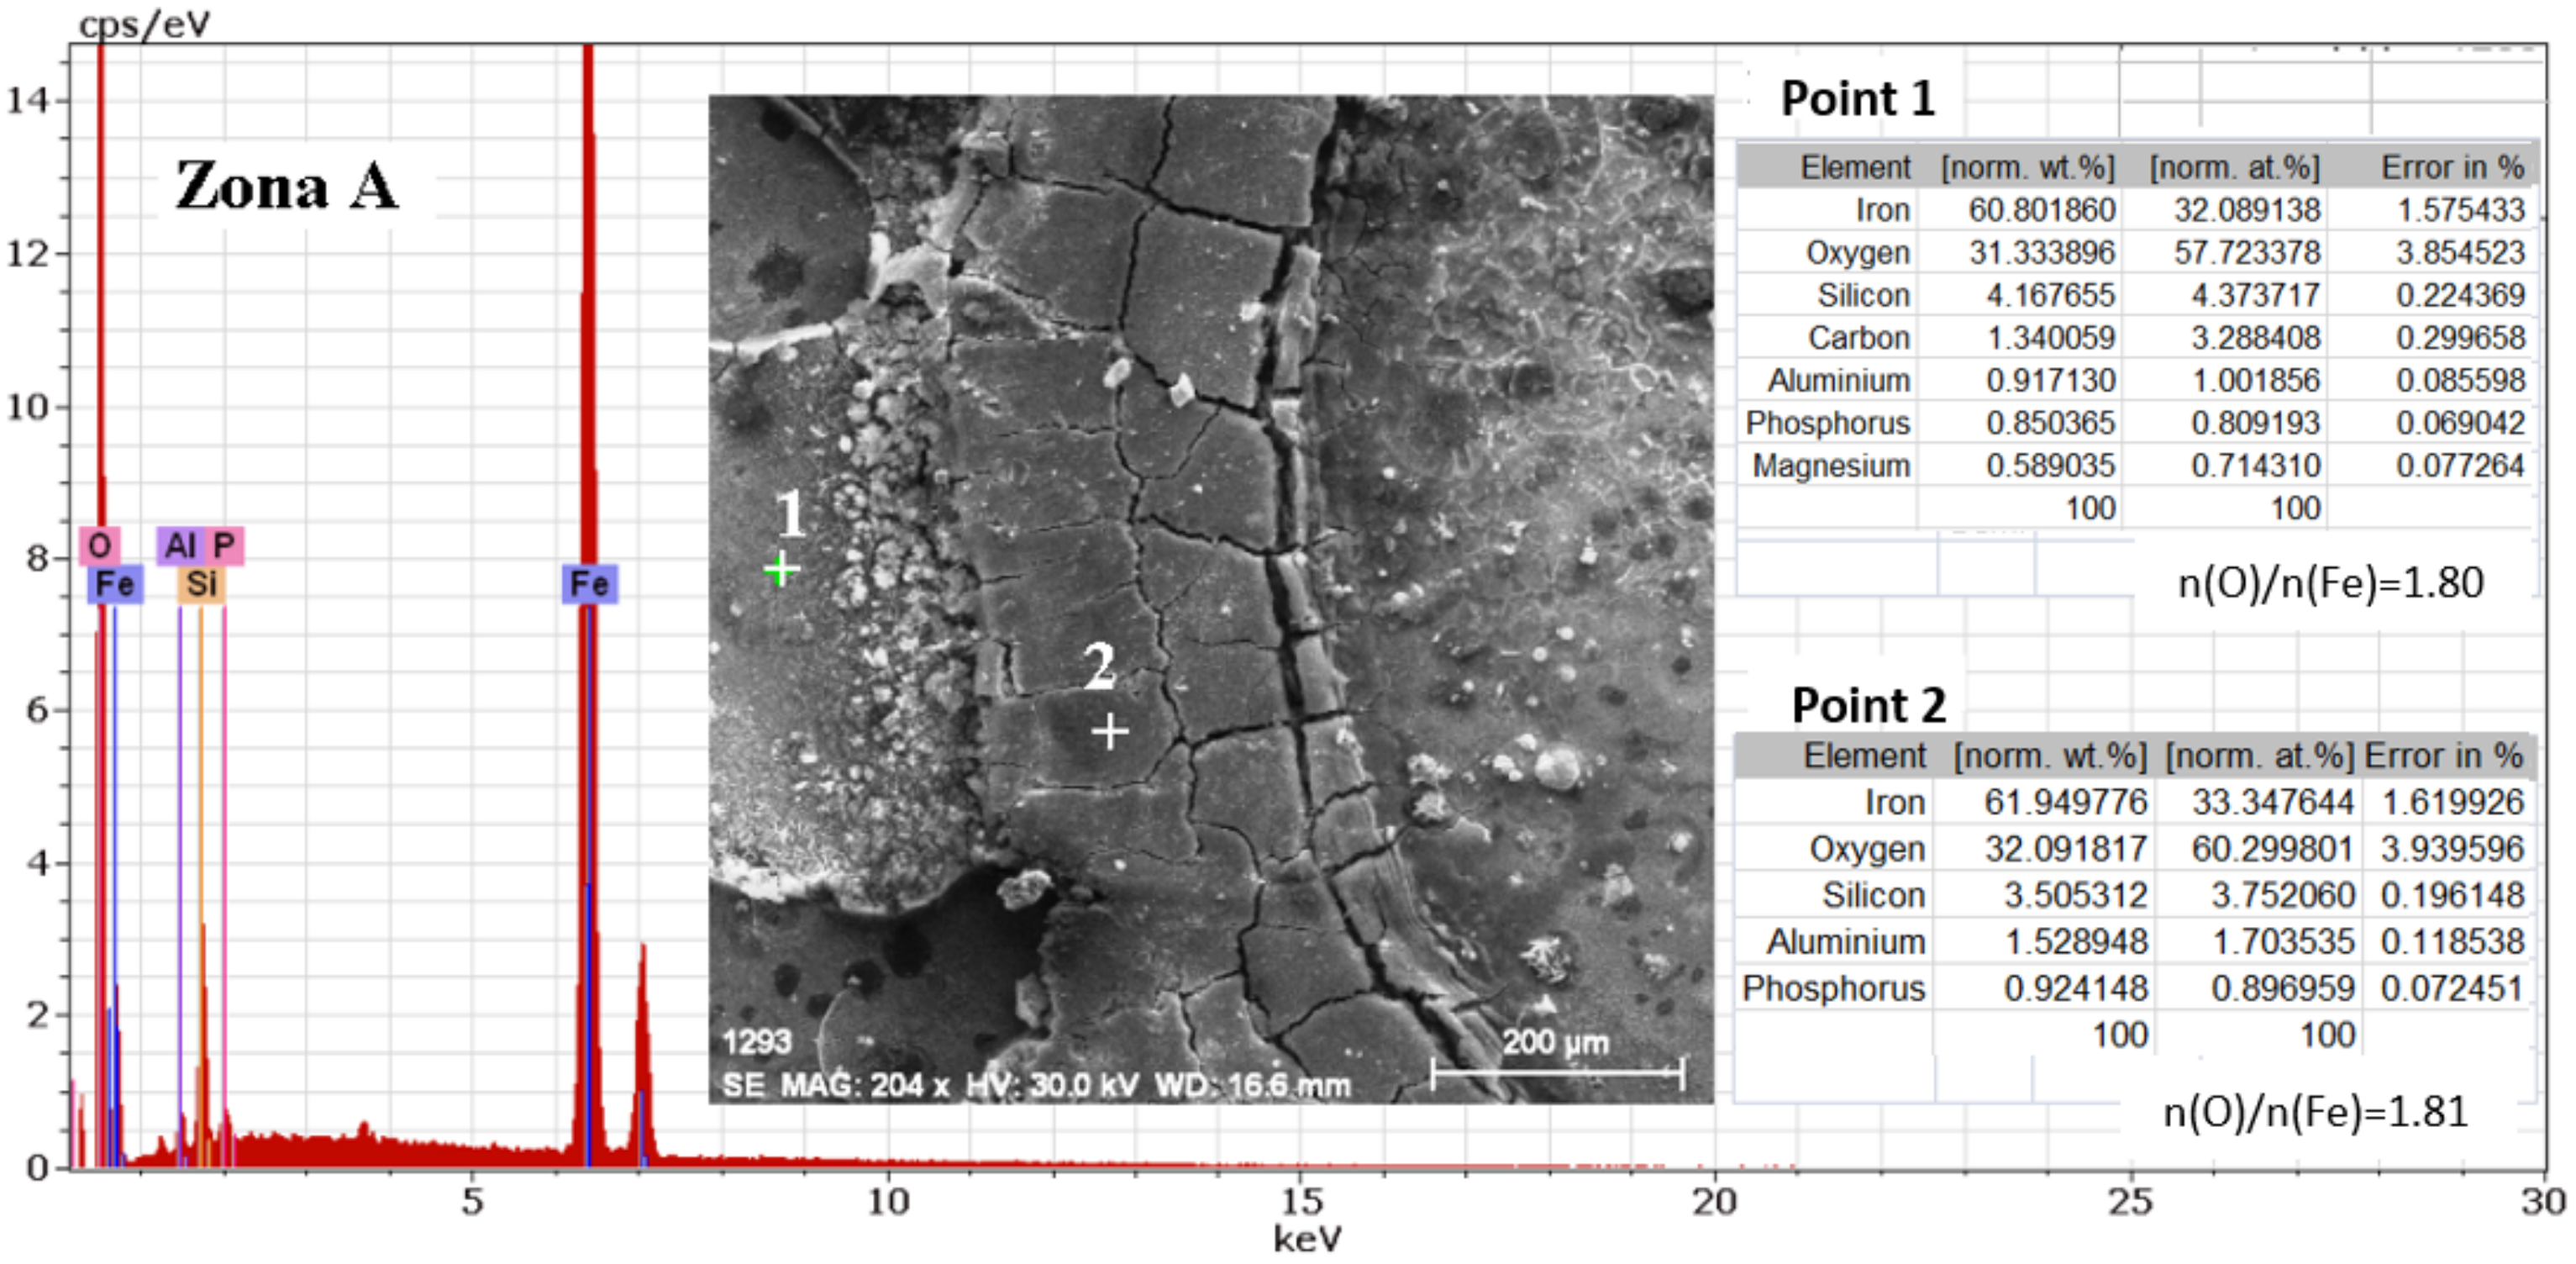
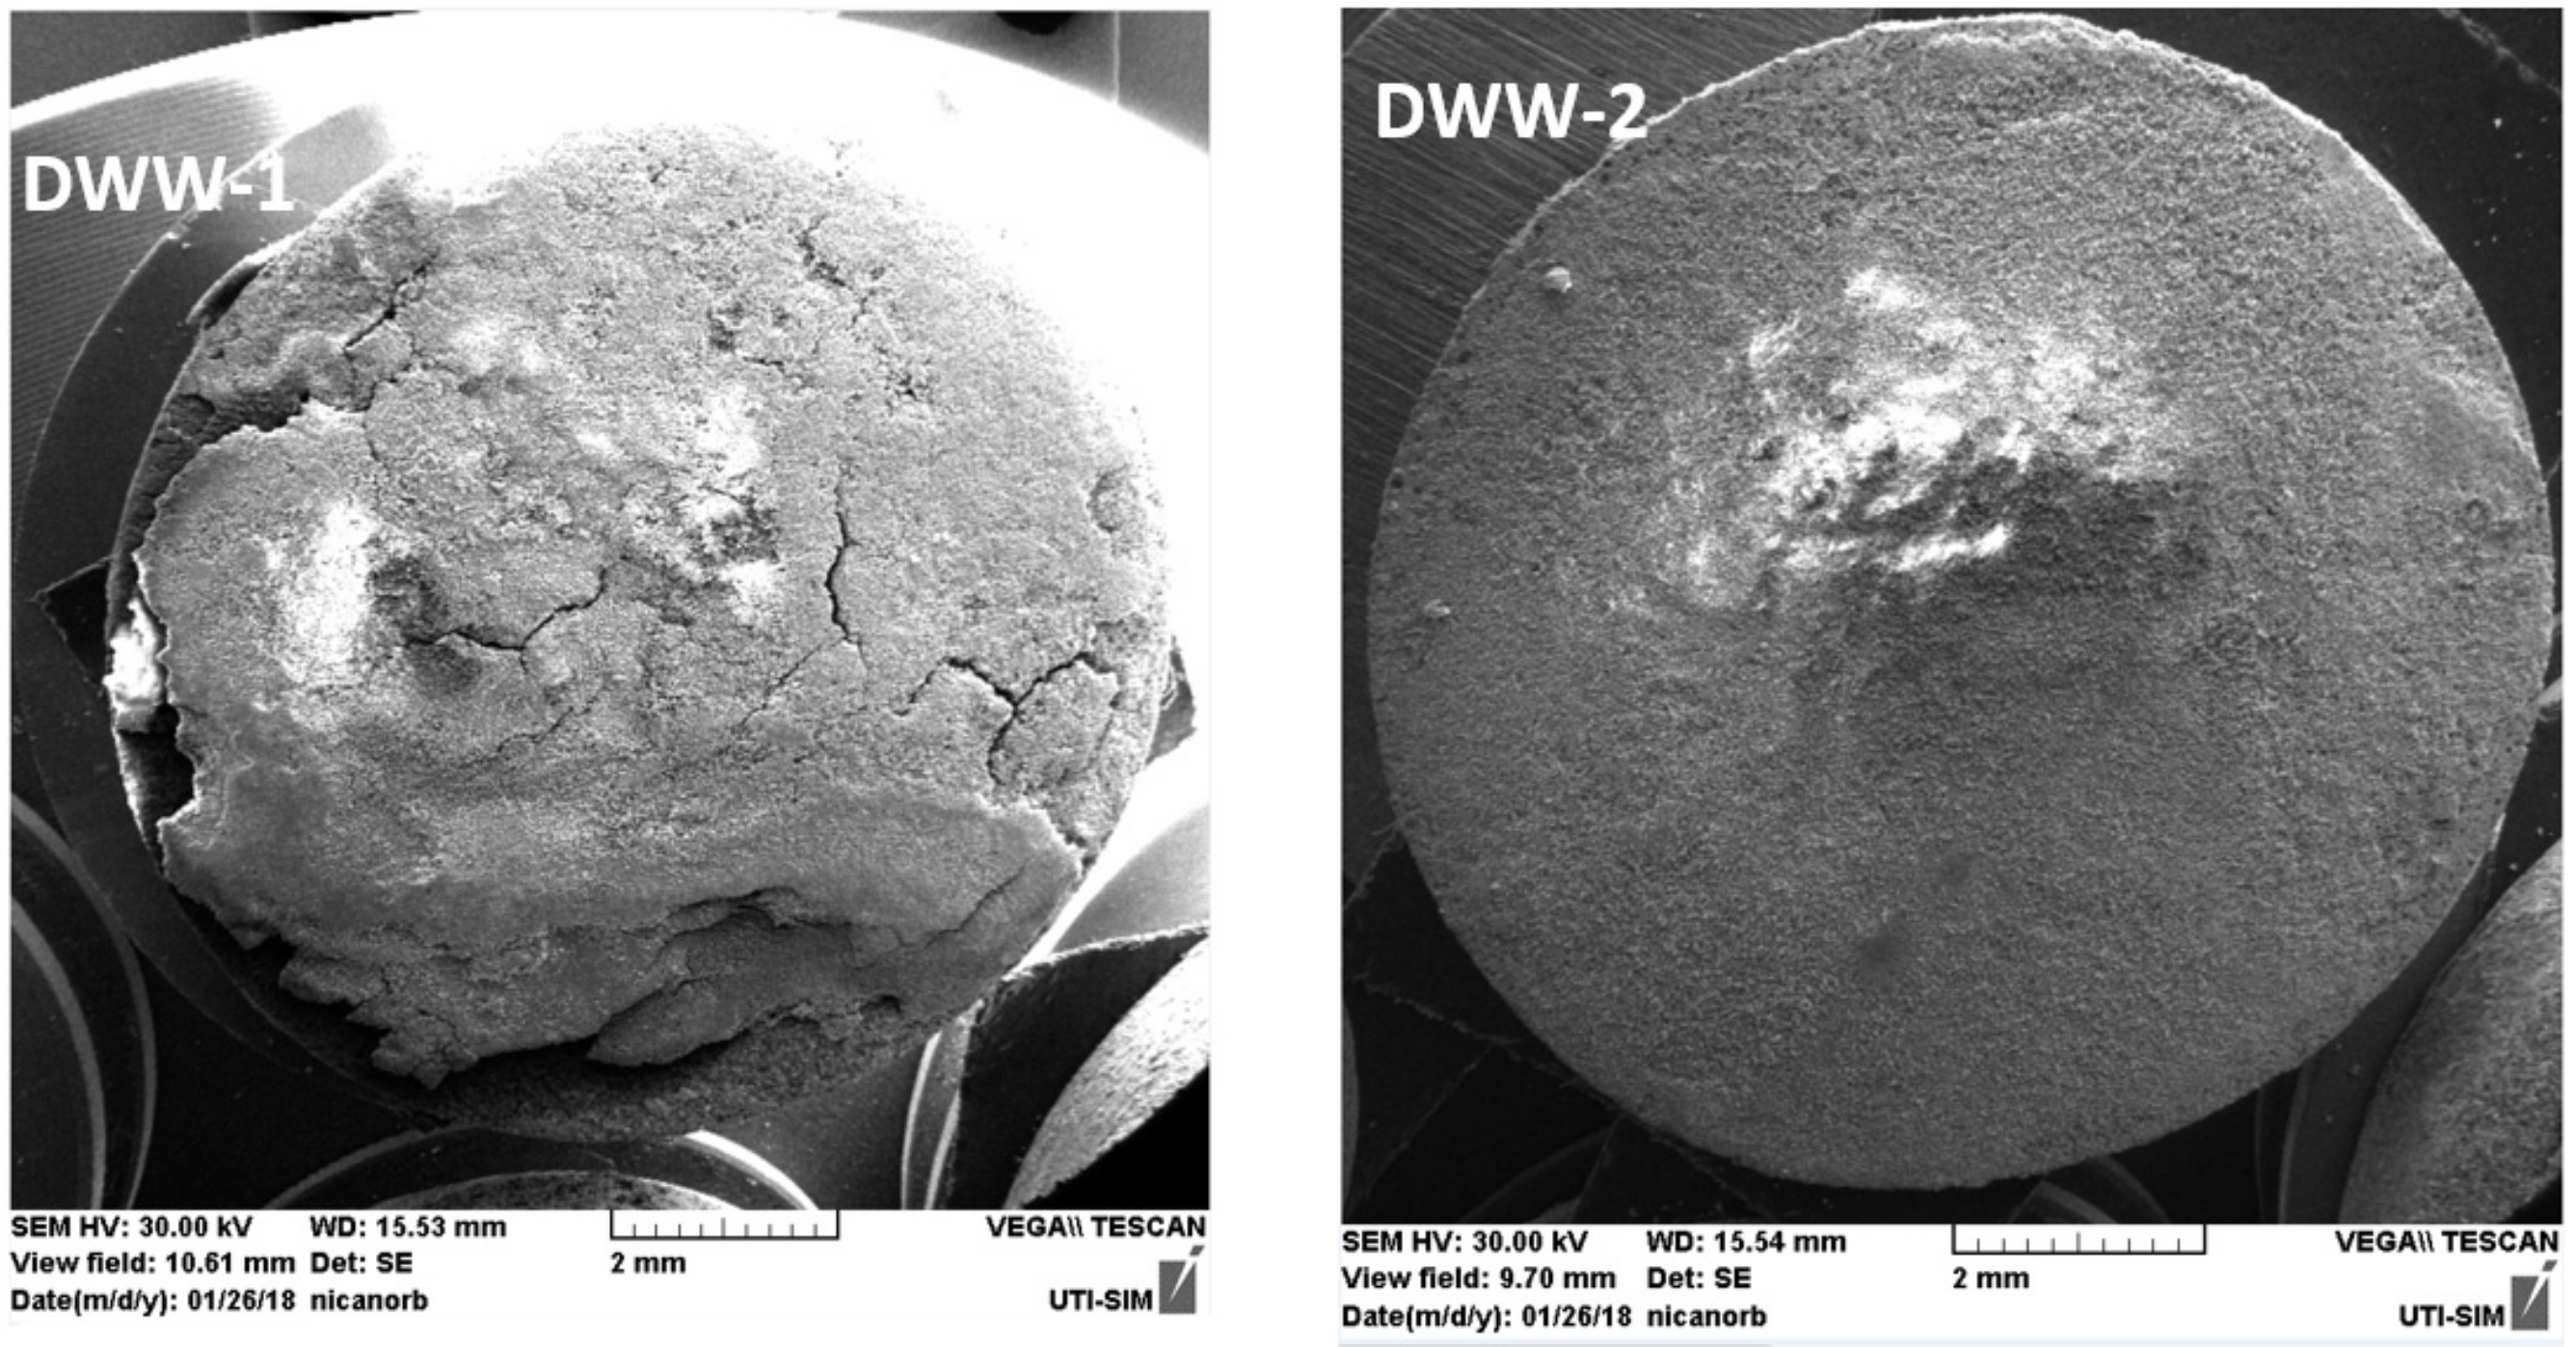
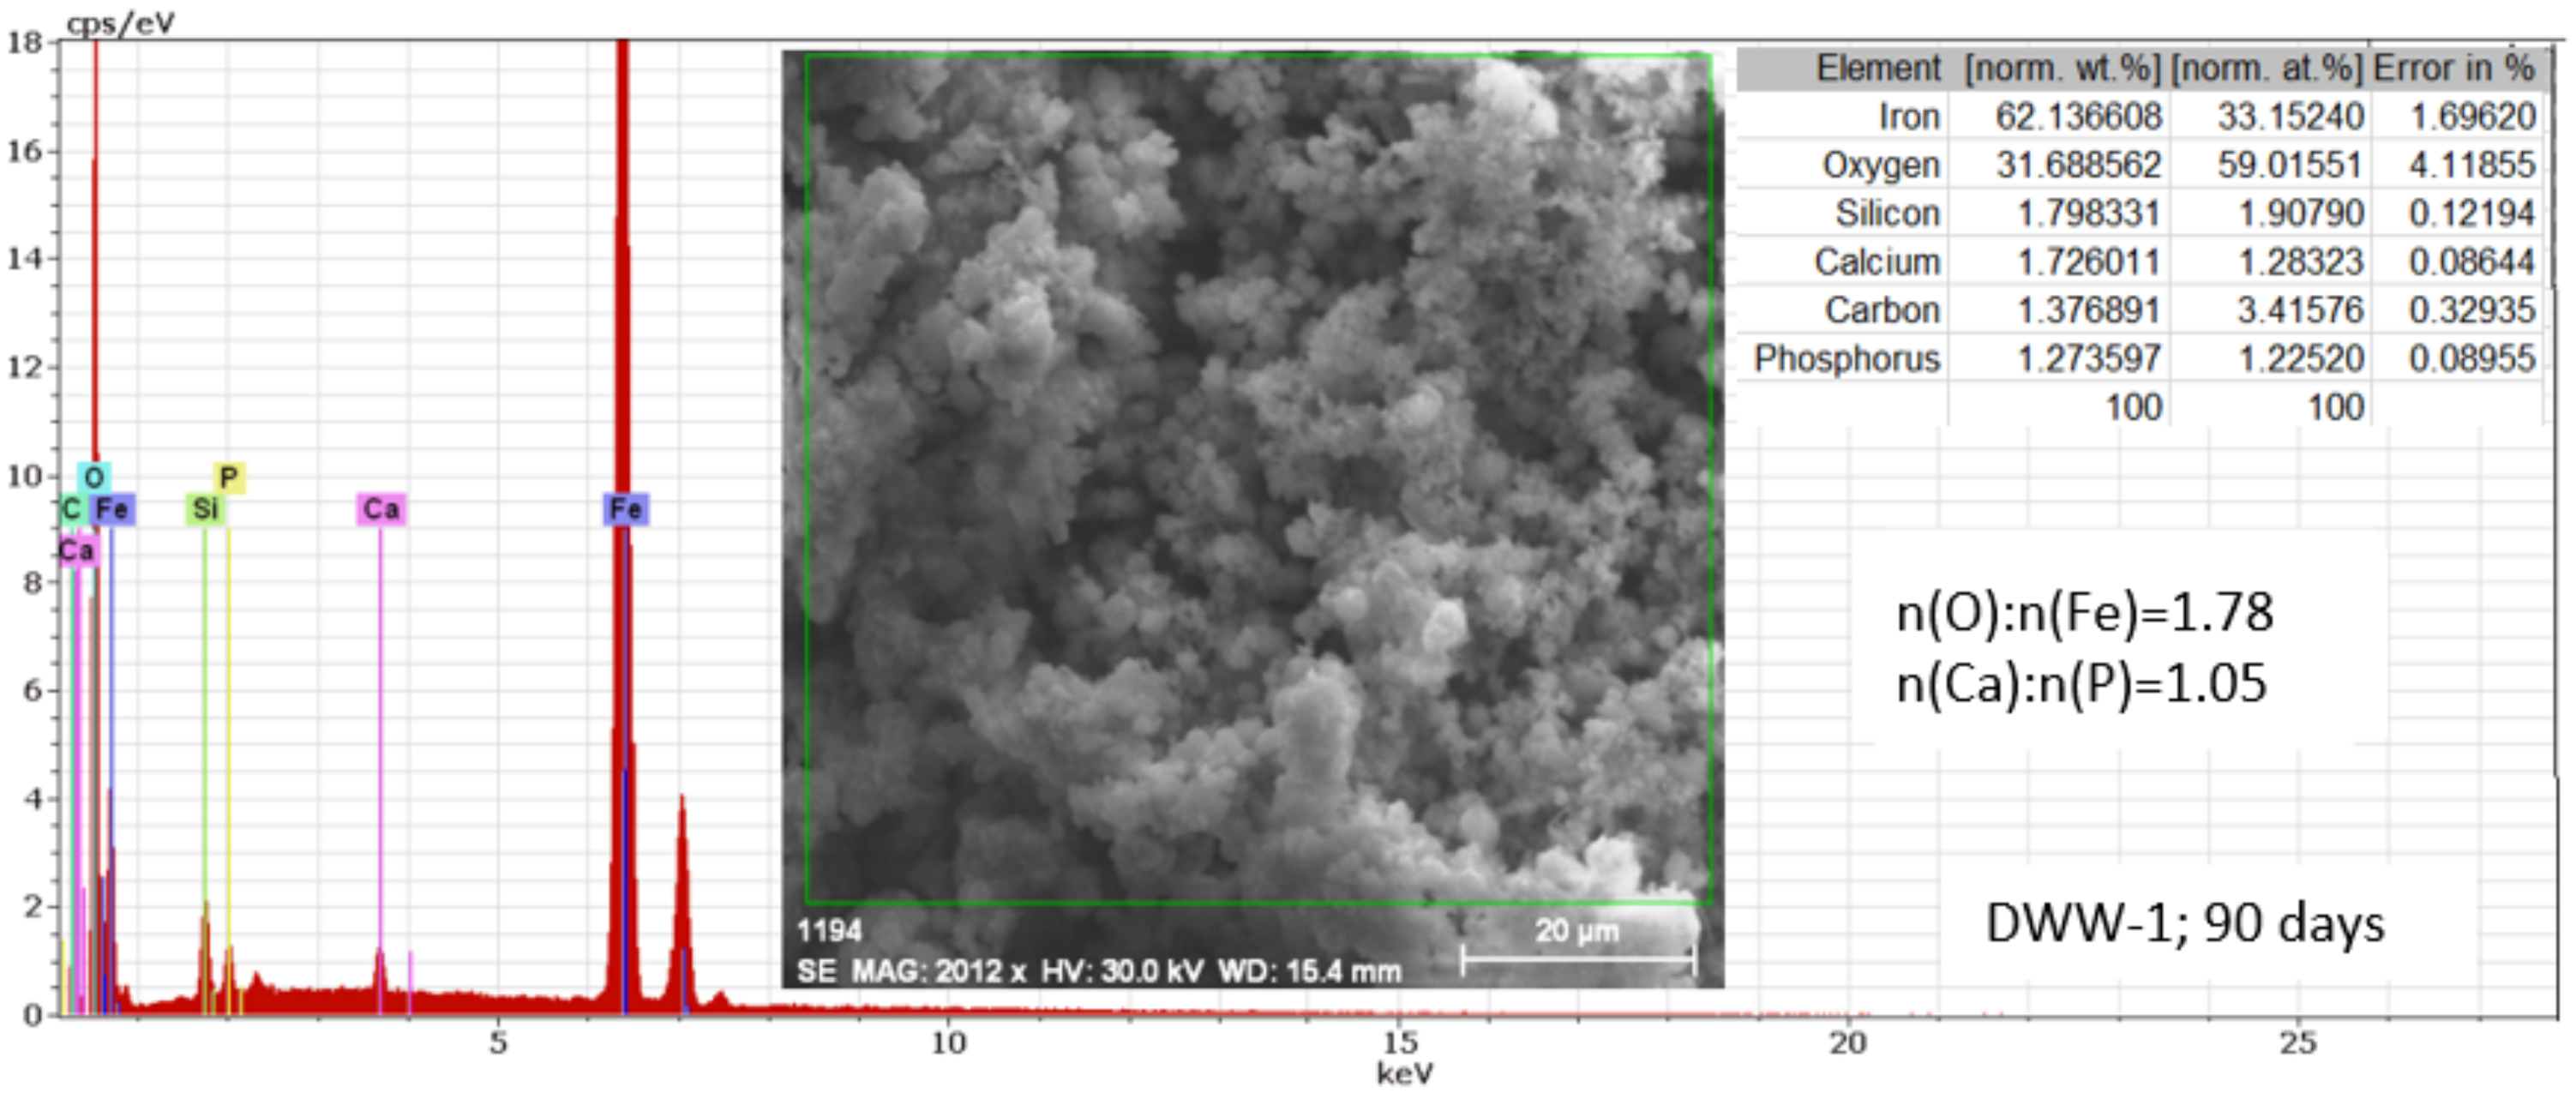
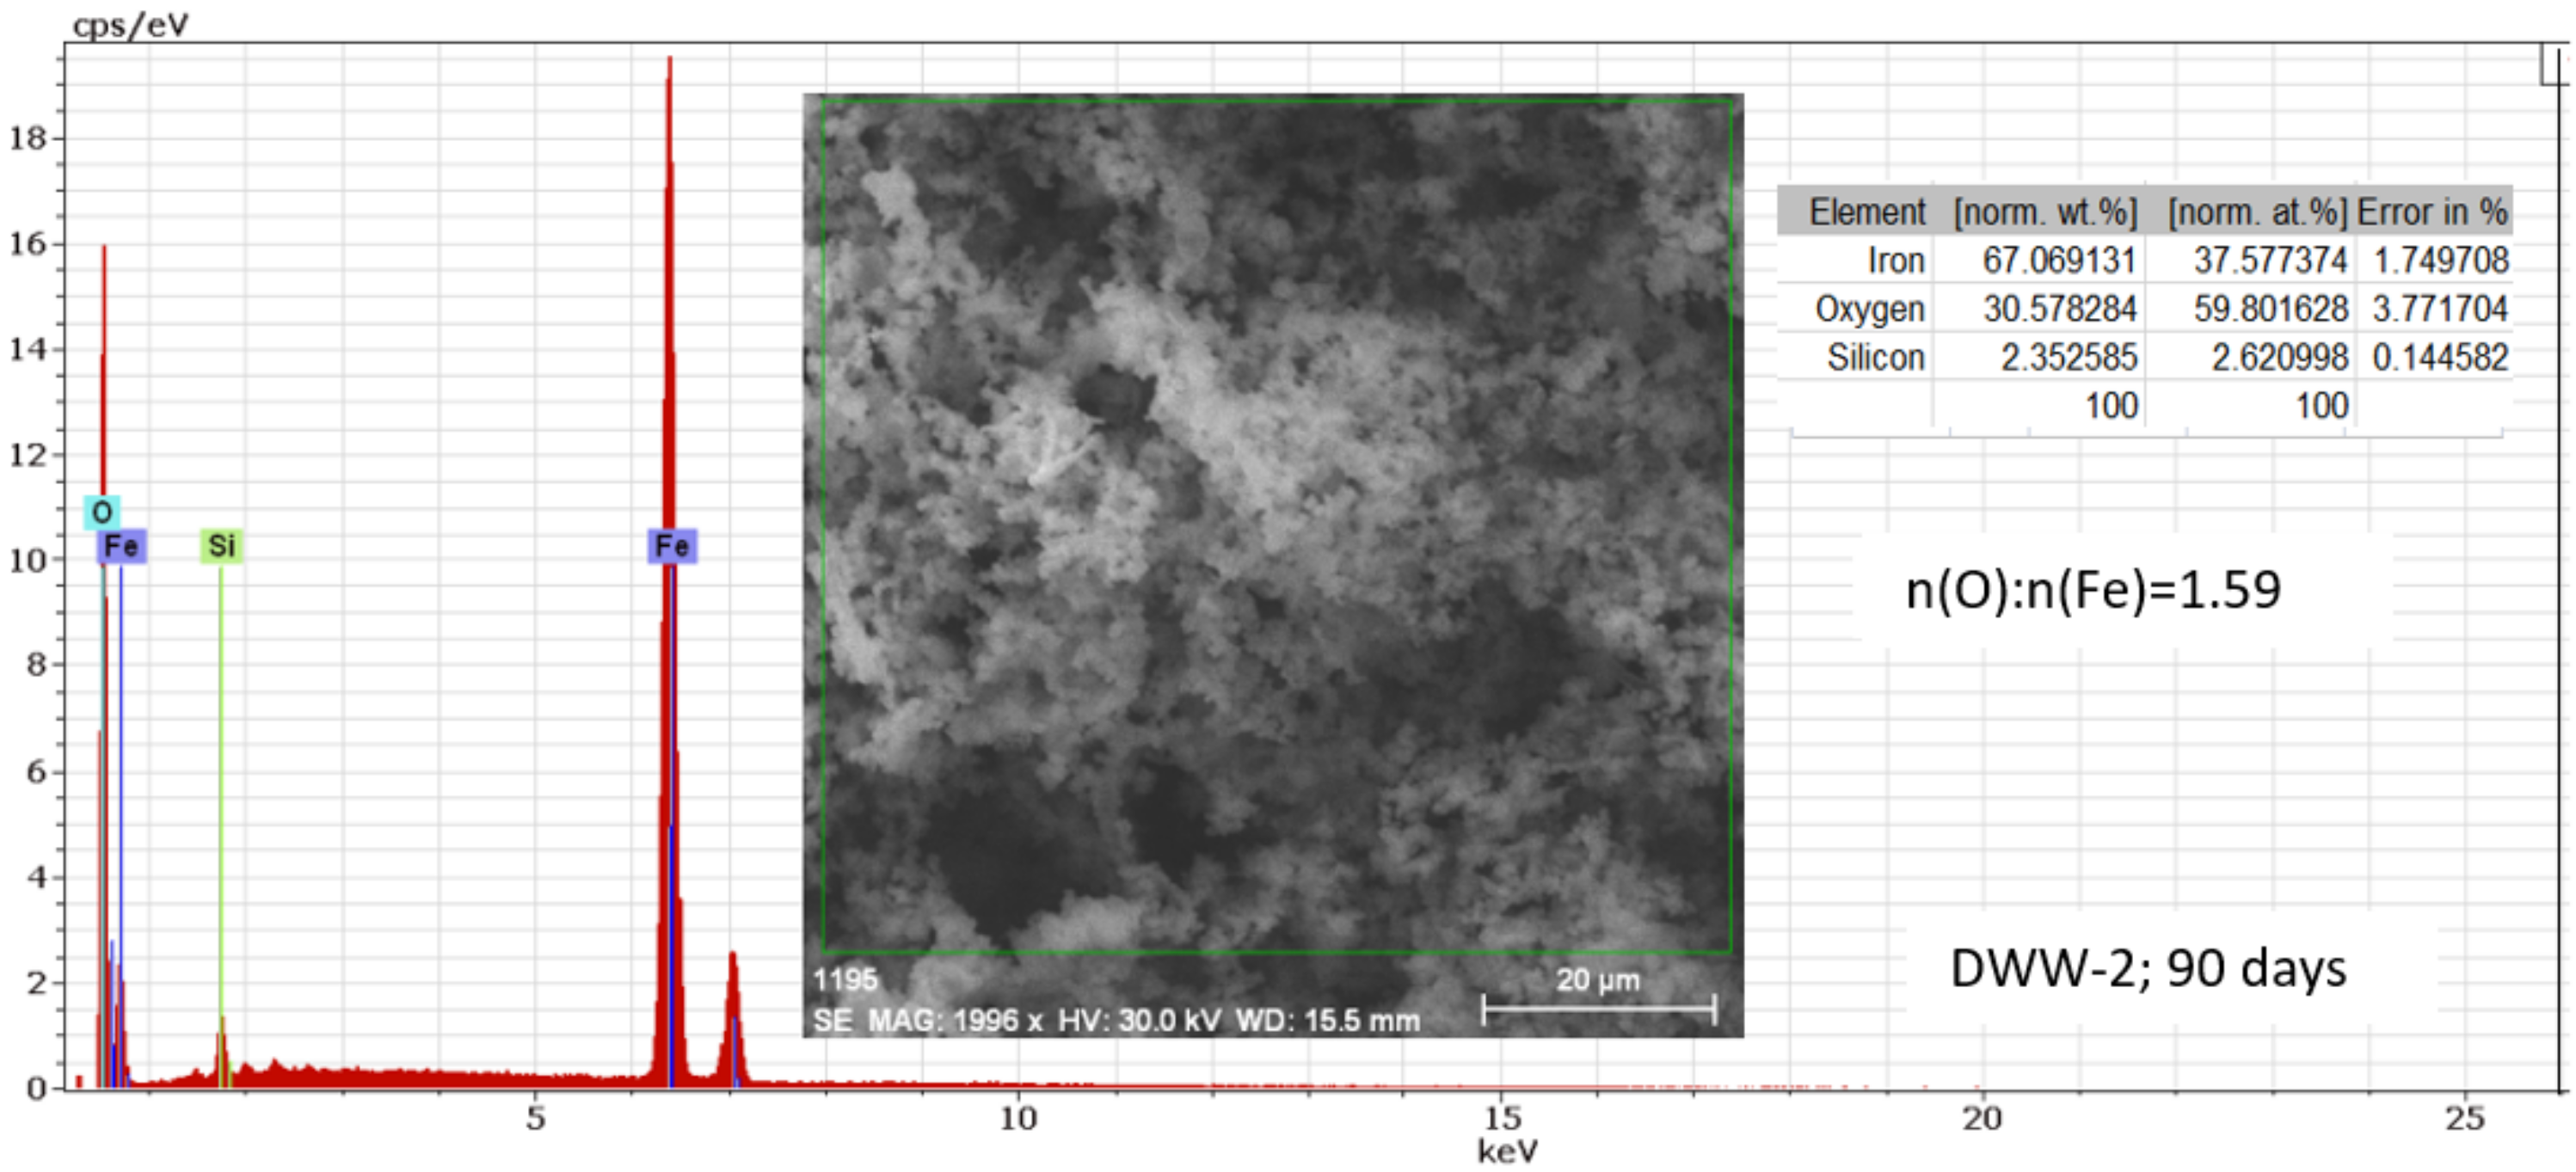
3.2.4. Study of Nodular Cast Iron Samples Immersed for 90 Days in Solution

For the modelling of the Electrochemical Impedance Spectroscopy data of the immersed samples for 90 days, a circuit equivalent was used, the scheme of which is shown in Figure 22, and the values of the circuit elements are presented in Table 9.
As in the case of samples immersed for 65 days in synthetic solutions, the surface structure of samples immersed for 90 days is a three-layer structure over the double-electric layer, with an inner layer containing ferrous and ferric oxides and oxy-hydroxides and an outer layer with ferric compounds and substances adsorbed from the solution. The outer layer is easily removable in both dry and wet environments, coming off very easily, especially when the liquid is moving.
Considering the values of outer layer resistance (Rext) and charge transfer resistance (Rct) can be observed that the least aggressive media is DWW-1. Also, considering the low values of the W constant, from the expression of the diffusion impedance, we can conclude that the diffusion impedance is high and opposes the Rct, which conducts with a reducing corrosion rate over time.
After immersing the cast iron samples for 90 days in DWW-1, the pH of the solution decreased from 6.5 to 6.0, and a large amount of reddish-brown gel was found in the solution. In the case of the sample immersed in DWW-2, the pH of the solution increased from 3.0 to 5.0 and reddish-brown flakes were found in the solution.
Nodular cast iron samples immersed in DWW-1 and DWW-2 corrosion media were coated with corrosion products in the form of a compact crust spread over the entire surface (Figure 23), and those immersed in DWW-3 were not covered. With a compact crust, on the surface, there are irregular crystalline agglomerates of different colours.
The surface aspect after drying the immersed samples at higher magnification is shown in Figure 24.
The sample crust composition immersed for 90 days in DWW-1 simulated domestic water is illustrated in Figure 25.
The molar ratio O: Fe = 1.78 confirms that the corrosion product is a mixture of oxy-hydroxide (FeOOH) and ferric oxide (Fe2O3) in which calcium phosphate is absorbed (molar ratio Ca: P = 1). The composition of the crust deposited on the nodular cast iron sample immersed for 90 days in DWW-2 is shown in Figure 26.
As in the case of the sample immersed in DWW-1, the crust of products covering the surface of this sample also forms Fe2O3, but, unlike the immersion in DWW-1, in the acidic environment, the absorption of CaHPO4 from the solution no longer takes place.
The condition of the sample surface immersed for 90 days in alkaline domestic water (DWW-3; pH = 11) is shown in Figure 27.
At both analysed points, the Oxygen/Iron molar ratio is much higher than that corresponding to any iron oxide. This allows us to state that in the crystalline agglomerates on which point 1 is placed, there is an iron oxide in which the inorganic components of the storage solution are absorbed, while on the darker deposit, on which point 2 is placed, the amount of oxide is lower but carbon-rich food compounds are preferentially adsorbed (at this point carbon is much higher than in alloy).
The evolution over time of the corrosion film for water with neutral pH was also studied by Lagunas et al. [36] for nodular graphite cast iron pipes covered with cement, observing a similarity of the types of oxides formed and the way it reacts chemically with the corrosive agent.

4. Conclusions

The interpretation of linear polarisation curves and electrochemical impedance spectra, the recording of SEM microphotographs, and the evaluation of surface micro compositions allow us to admit that in the corrosion process of nodular cast iron immersed for a long time in synthetic wastewater with different pHs, three stages can be distinguished.
The analysis of the obtained results allowed the highlighting of some important observations, as follows.
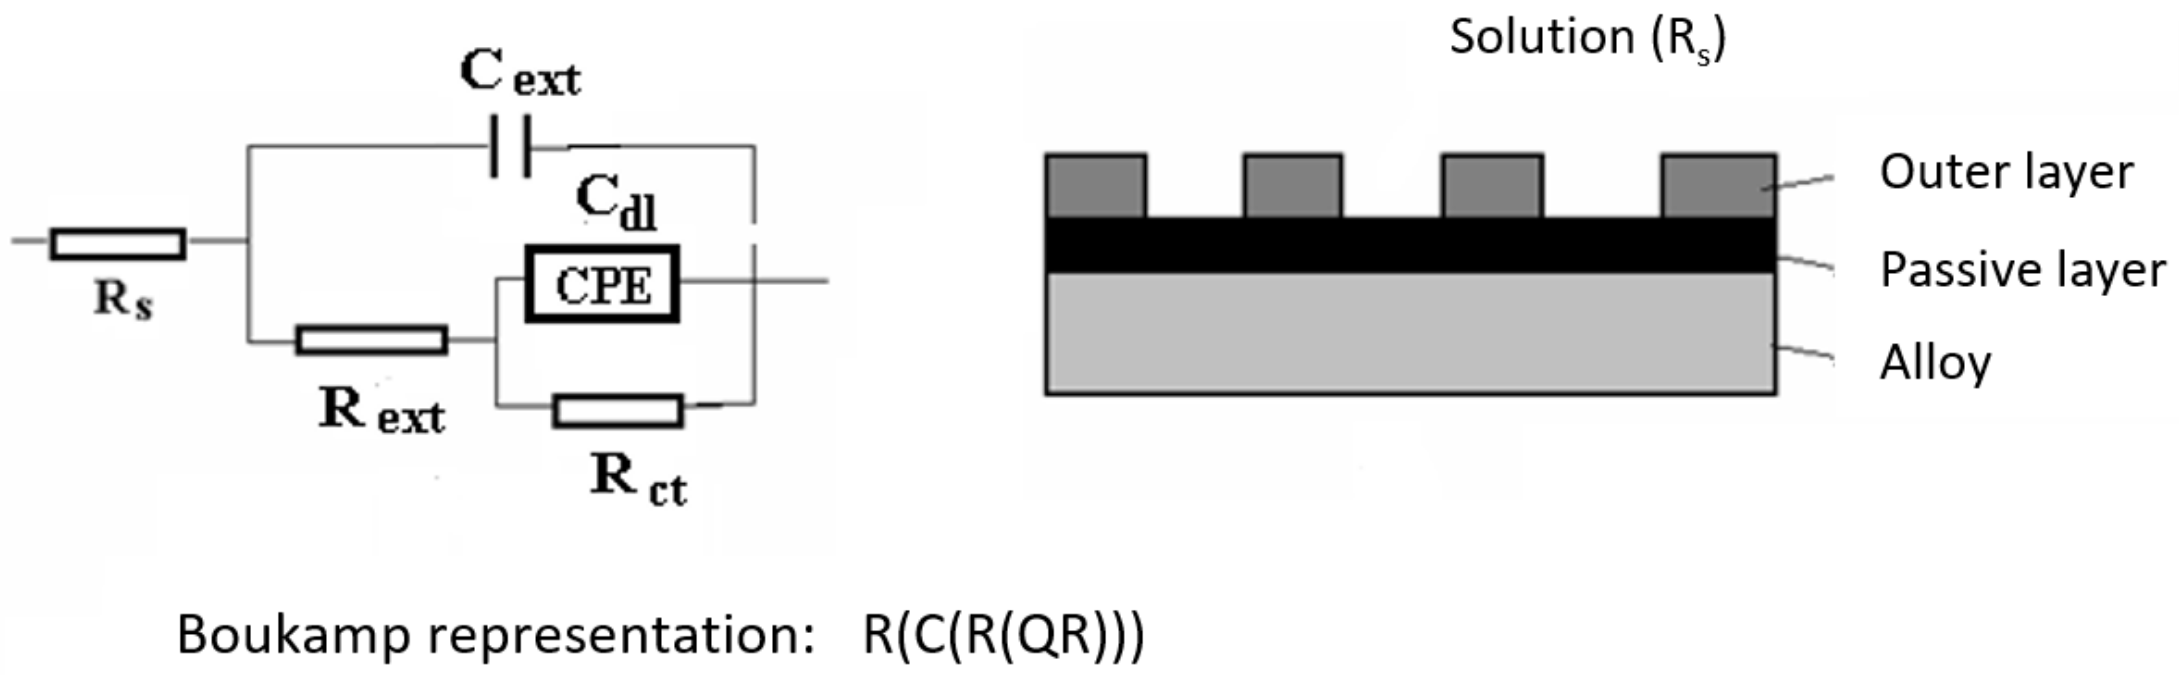
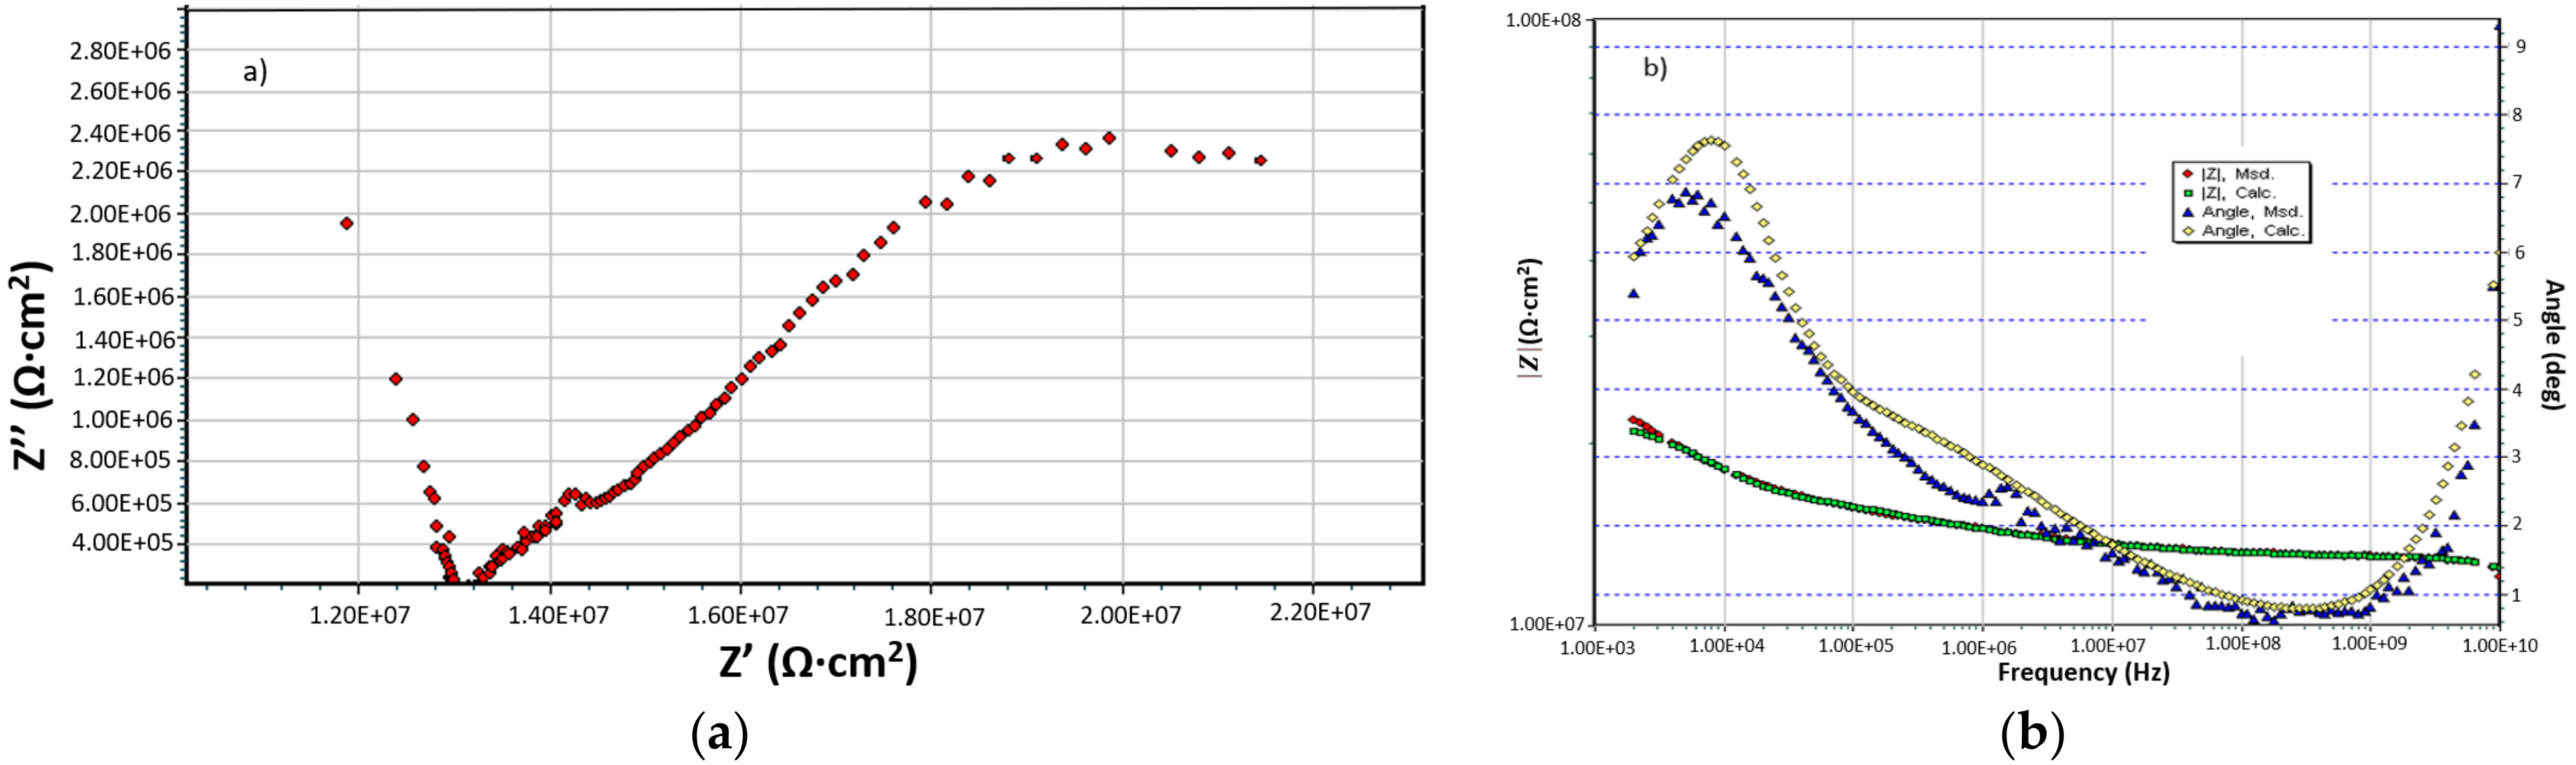
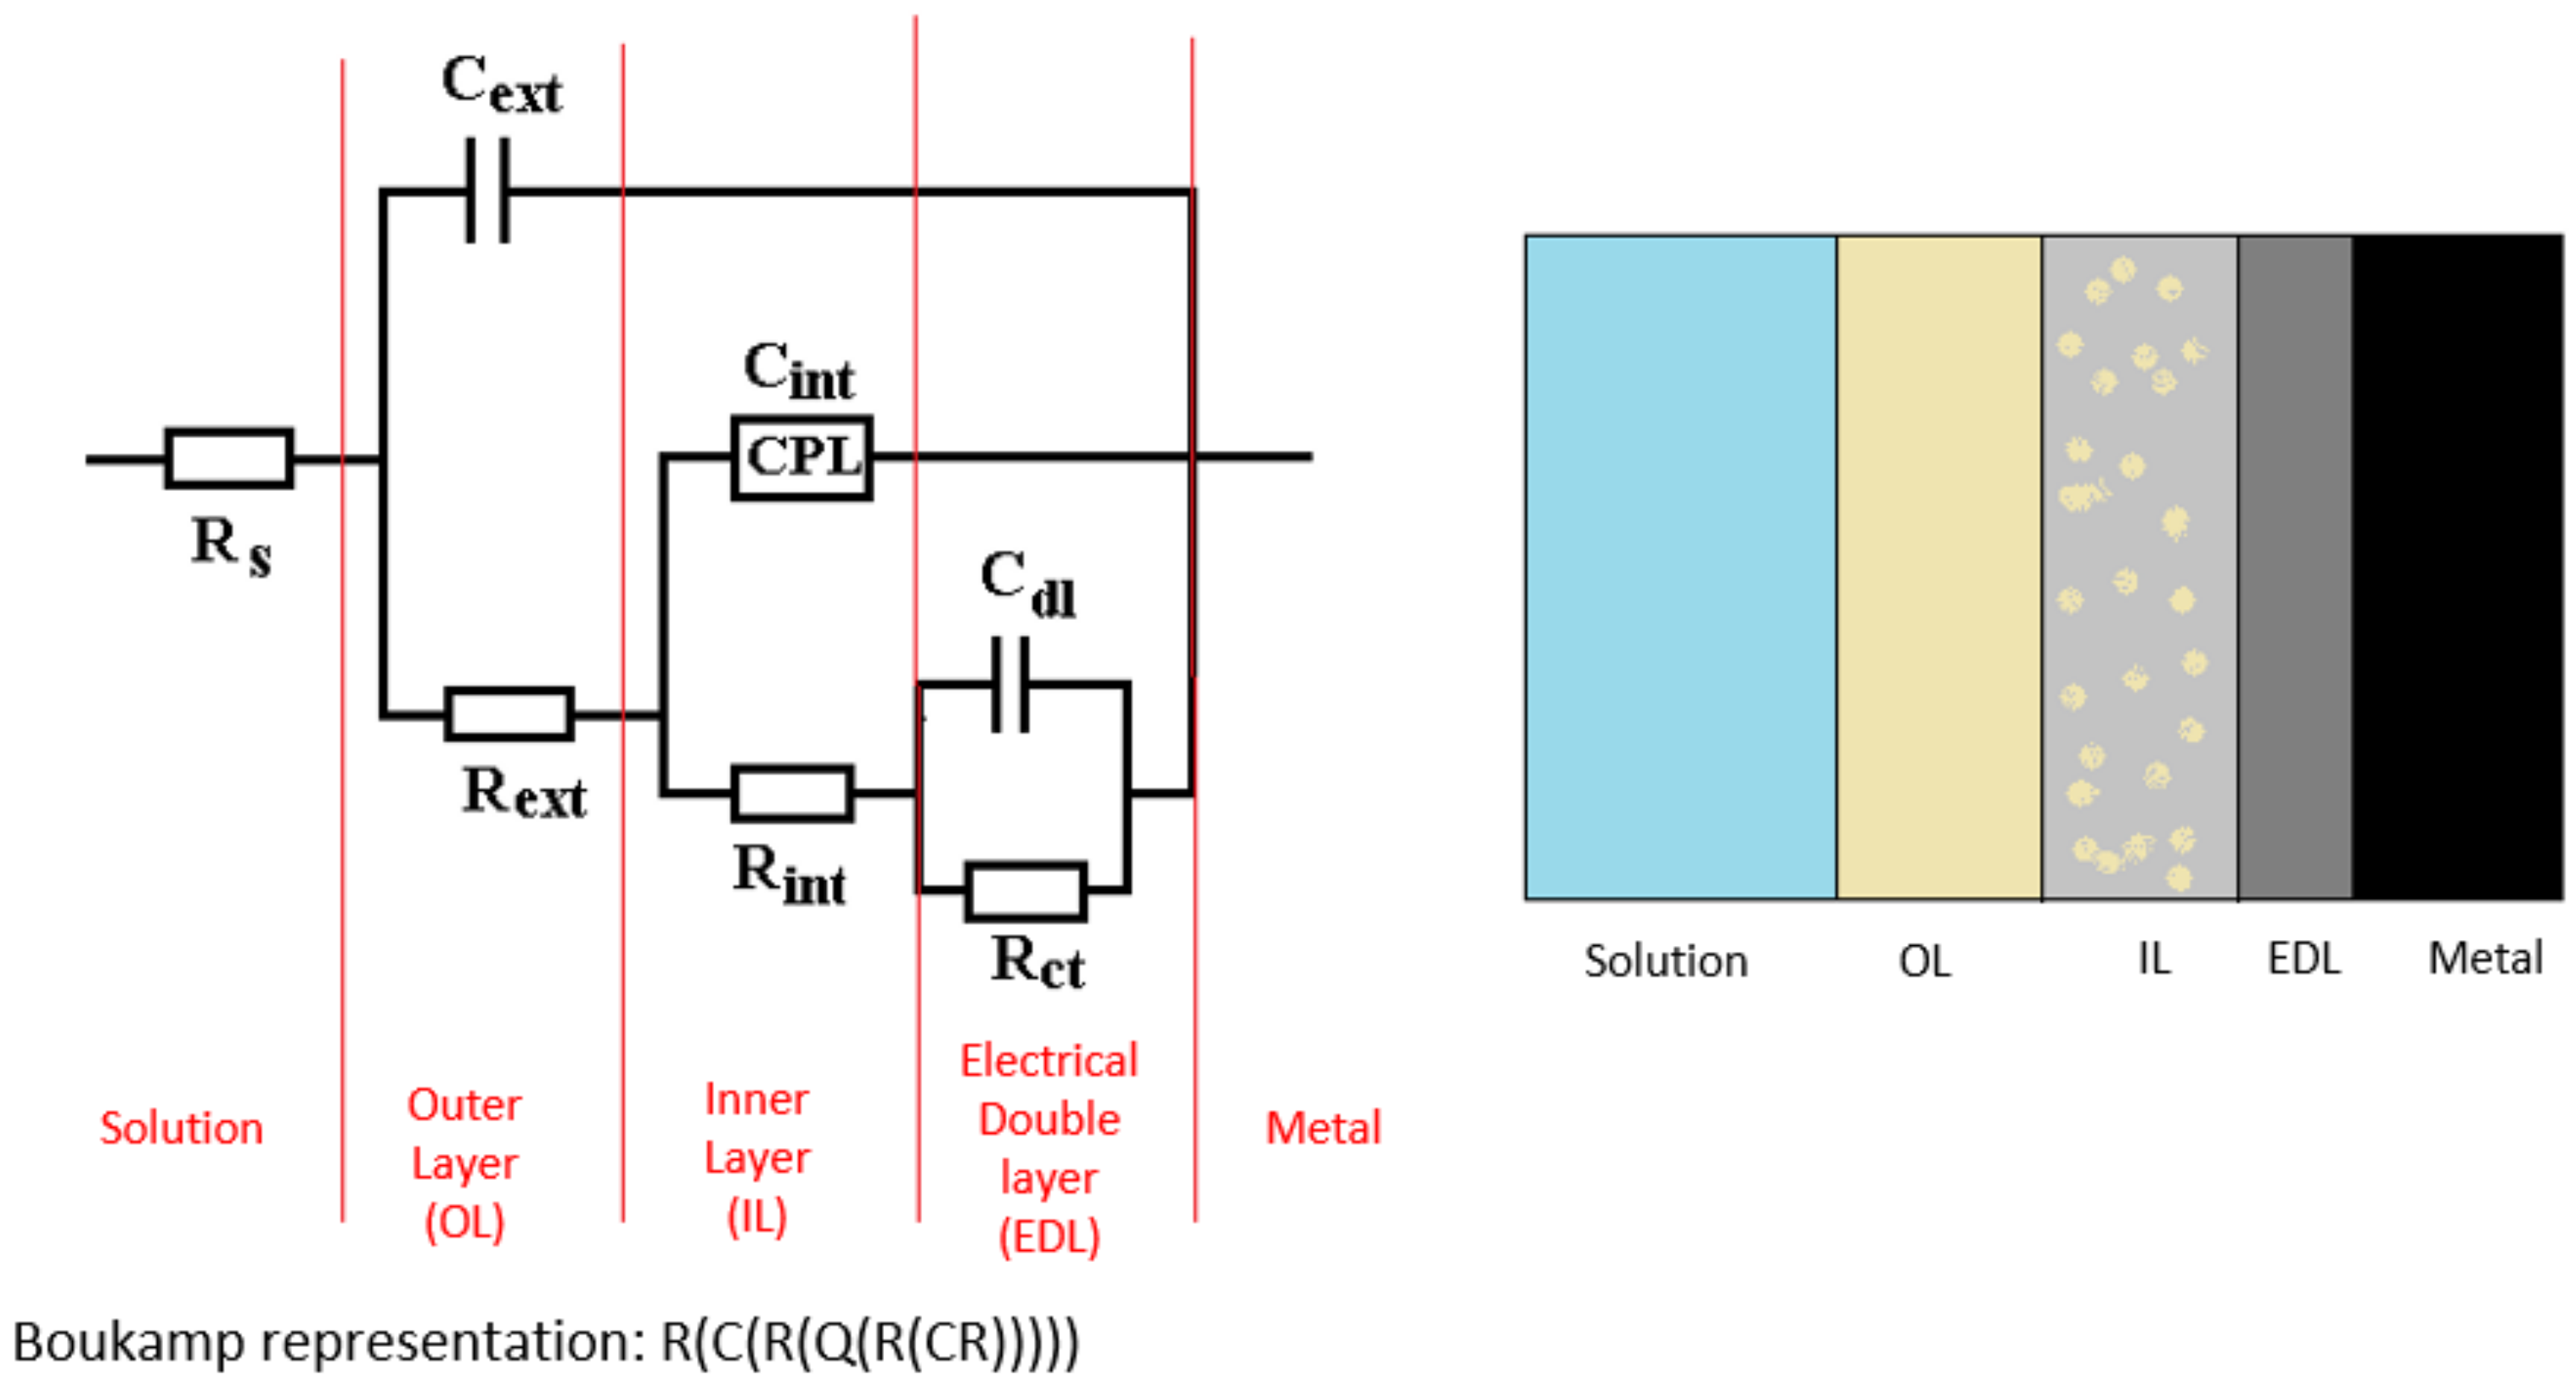
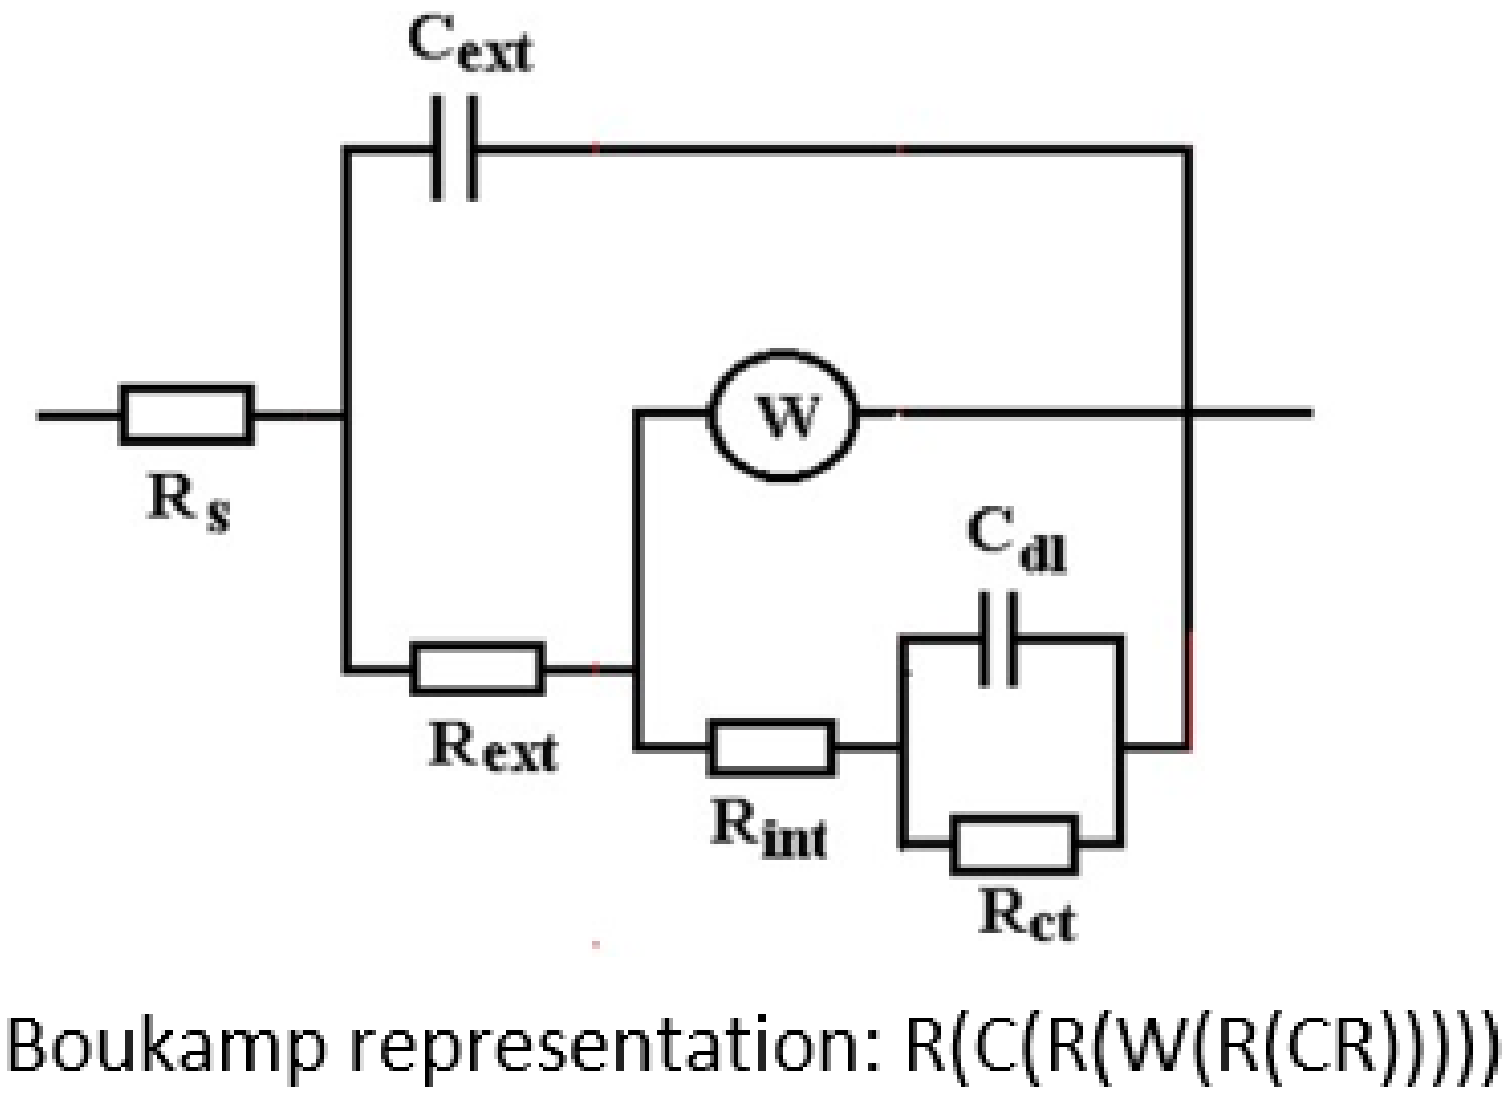
  • Comparing the values of polarisation resistance (Rp), corrosion rate (vcor), and current density (jcor) of the samples immersed in wastewaters it can be seen that the value of the polarisation resistance for DWW-1 is four times higher compared to the other two. Also, the values of corrosion rate and current density for DWW-1 are four times lower, indicating that the pH-neutral solution is the least aggressive. This is also supported by the EIS results (the values of Rs, Rext, and Rct) for all the samples immersed in different periods in all three wastewaters.
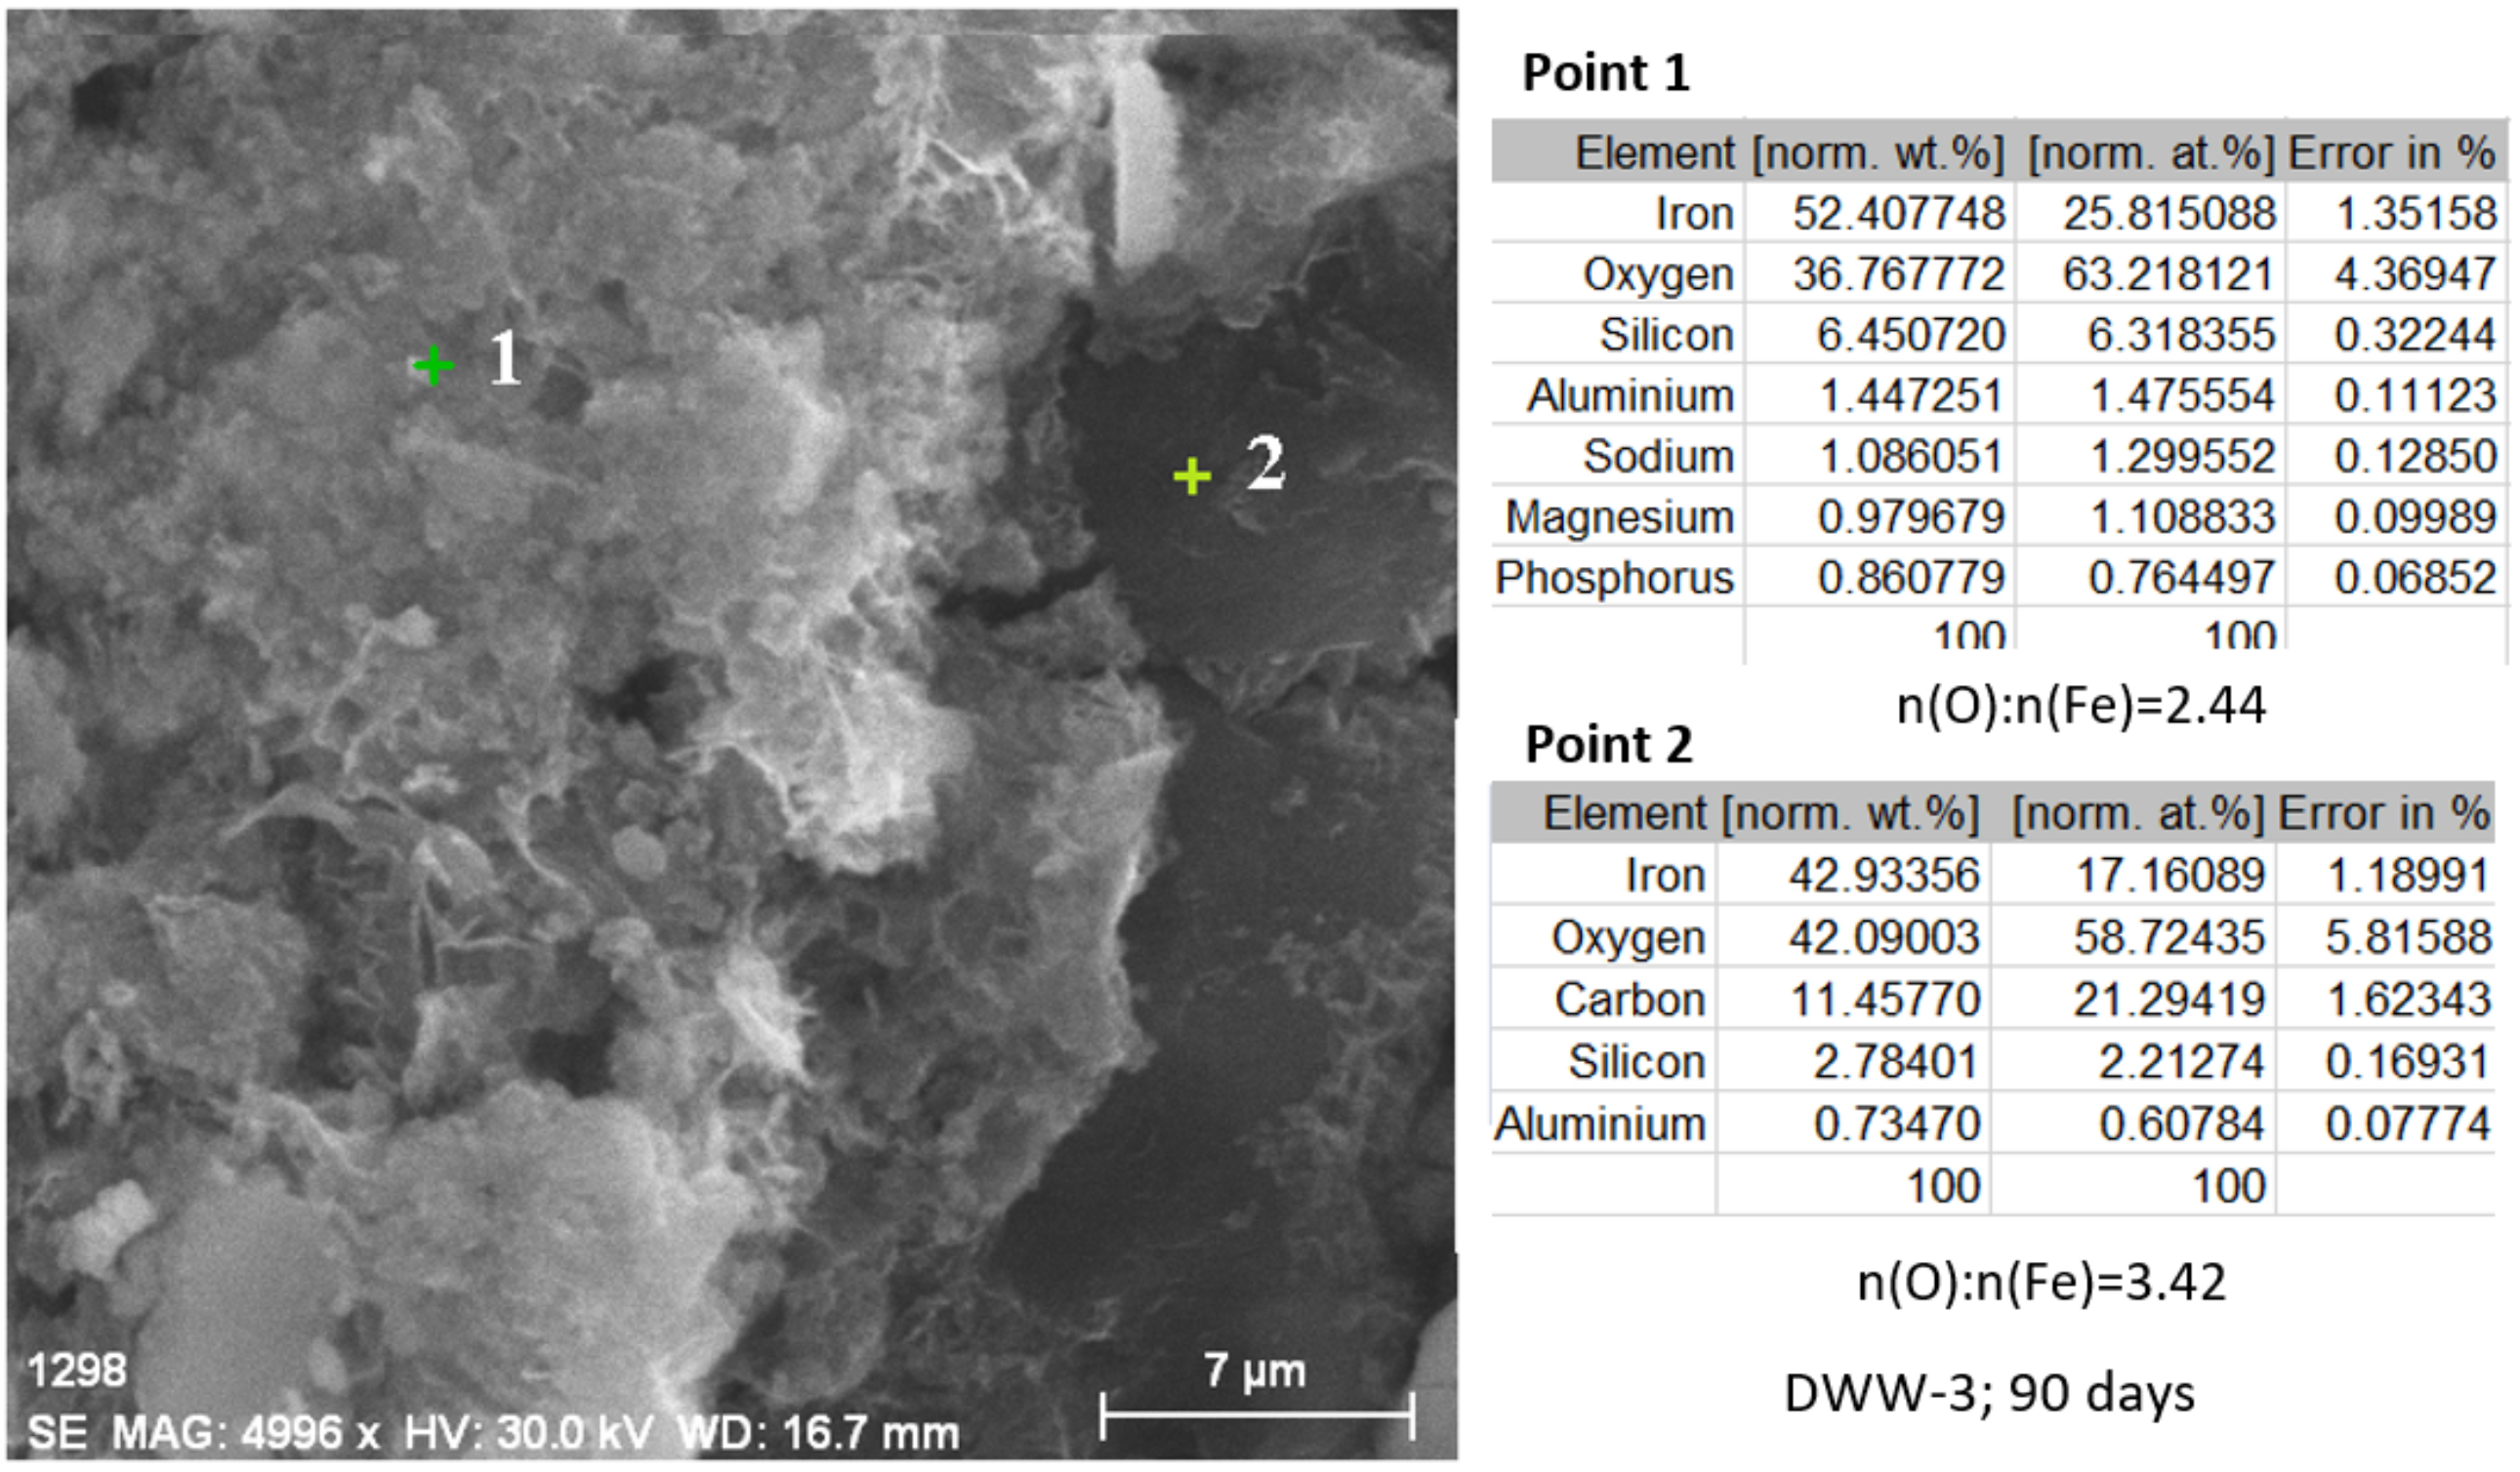
  • In the initial stage, ferrous ion (Fe2+) is formed, and by the transfer of dissolved oxygen from the solution to the metal surface, ferrous oxide (FeO) is formed. It is further oxidised to ferro-ferric oxide Fe3O4 (Magnetite). A thin phase layer rich in Fe(II) is formed at the metal/solution interface. As corrosion continues, the thickness of the oxide monolayer increases to form a double-layer crust (oxide film and electric double layer) that reduces the flow of oxygen to the metal surface and thereby decreases the corrosion rate. The product layer is porous and easily removable, especially if the liquid is moving (as in pipes or pumps), so that under dynamic conditions the reaction rate does not decrease.
  • In the intermediate stages of development, because the dissolved oxygen in the solution is an electron acceptor, in addition to the transformation of FeO to Fe2O3, the formation of α -FeOOH (Goethite) and γ-FeOOH (Lepidocrocyte) takes place. This forms a compact crust on the metal surface, further reducing the flow at the metal-crust interface and decreasing the corrosion rate.
  • In the final stage by the oxidation of magnetite to FeOOH, which takes place in the initial layer, the thickness of the layer of ferric compounds (mainly FeOOH) increases, forming a compact crust. Thus, the final structure of the product layer is that of a tri-layer: the double-electric layer directly connected to the metal surface, an inner layer consisting of ferrous compounds and ferric compounds, and an outer layer, a compact crust formed of ferric compounds. Anions, cations, and non-dissociated compounds (food compounds) from corrosion environments are absorbed in both the outer and inner layers. As the thickness of the product crust increases, there is a slow decrease in the corrosion rate. The inner layer controls the diffusion of oxygen to the metal interface with the crust and thereby controls the reaction rate. The product crust is easily removable from both wet and dry metal.
Due to the importance of the cast iron in the pumping system as a material for rotors manufacturing and also for its properties, we consider that it is important to improve the corrosion resistance of the material using advanced coatings like conversion coatings [33], which can improve not only the corrosion behaviour but also the wear resistance.

Supplementary Materials

The following supporting information can be downloaded at: https://www.mdpi.com/article/10.3390/coatings12070911/s1, Figure S1: The Nyquist and Bode diagram after 1 h of immersion in DWWW-1; Figure S2: The Nyquist and Bode diagram after 1 h of immersion in DWWW-2; Figure S3: The Nyquist and Bode diagram after 1 h of immersion in DWWW-3; Figure S4: The Nyquist and Bode diagram after 30 days of immersion in DWWW-1; Figure S5: The Nyquist and Bode diagram after 30 days of immersion in DWWW-2; Figure S6: The Nyquist and Bode diagram after 30 days of immersion in DWWW-3; Figure S7: The Nyquist and Bode diagram after 65 days of immersion in DWWW-2; Figure S8: The Nyquist and Bode diagram after 65 days of immersion in DWWW-3; Figure S9: The Nyquist and Bode diagram after 65 days of immersion in DWWW-1; Figure S10: The Nyquist and Bode diagram after 90 days of immersion in DWWW-2; Figure S11: The Nyquist and Bode diagram after 90 days of immersion in DWWW-3.

Author Contributions

Conceptualisation, writing, and investigation C.N.; Writing an original draft, project administration, and scientific supervision, M.A.; Methodology, investigation, data curation and validation, M.C.P.; Data curation, validation, and writing—reviewing and editing, D.-P.B.-N.; Resources, investigation, and formal analysis C.B. All authors have read and agreed to the published version of the manuscript.

Funding

This work was supported by Gheorghe Asachi Technical University of Iaşi—TUIASI- Romania, Scientific Research Funds, FCSU-2022.

Institutional Review Board Statement

Not applicable.

Informed Consent Statement

Not applicable.

Data Availability Statement

Not applicable.

Conflicts of Interest

The authors declare no conflict of interest.

References

  1. Nedeff, V.; Bejenariu, C.; Lazar, G.; Agop, M. Generalized lift force for complex fluid. Powder Technol. 2013, 235, 685–695. [Google Scholar] [CrossRef]
  2. Karassik, I.J.; Messina, J.P.; Cooper, P.; Heald, C.C.; San, N.Y.; Washington, F.; Auckland Bogotá, D.C.; Lisbon, C.; Madrid, L.; City, M.; et al. Pump Handbook; McGraw-Hill: New York, NY, USA, 2001. [Google Scholar]
  3. Pantazopoulos, G.A. A Process-Based Approach in Failure Analysis. J. Fail. Anal. Prev. 2014, 14, 551–553. [Google Scholar] [CrossRef] [Green Version]
  4. Dargahi, A.; Barzoki, H.R.; Vosoughi, M.; Mokhtari, S.A. Enhanced electrocatalytic degradation of 2,4-Dinitrophenol (2,4-DNP) in three-dimensional sono-electrochemical (3D/SEC) process equipped with Fe/SBA-15 nanocomposite particle electrodes: Degradation pathway and application for real wastewater. Arab. J. Chem. 2022, 15, 103801. [Google Scholar] [CrossRef]
  5. Tabandeh, L.; Shams Khorramabadi, G.; Karami, A.; Atafar, Z.; Sharafi, H.; Dargahi, A.; Amirian, F. Evaluation of Heavy Metal Contamination and Scaling and Corrosion Potential in Drinking Water Resources in Nurabad City of Lorestan, Iran. Int. J. Pharm. Technol. 2016, 8, 13137–13154. [Google Scholar]
  6. Fuseini, M.; Zaghloul, M.M.Y.; Elkady, M.F.; El-Shazly, A.H. Evaluation of Synthesized Polyaniline Nano-fibres as Corrosion Protection Film Coating on Copper Substrate by Electrophoretic Deposition. J. Mater. Sci. 2022, 57, 6085–6101. [Google Scholar] [CrossRef]
  7. Zaghloul, M.M.Y.; Zaghloul, M.Y.M.; Zaghloul, M.M.Y. Experimental and modeling analysis of mechanical-electrical behaviors of polypropylene composites filled with graphite and MWCNT fillers. Polym. Test. 2017, 63, 467–474. [Google Scholar] [CrossRef]
  8. Zaghloul, M.M.Y.; Mohamed, Y.S.; El-Gamal, H. Fatigue and tensile behaviors of fiber-reinforced thermosetting composites embedded with nanoparticles. J. Compos. Mater. 2018, 53, 709–718. [Google Scholar] [CrossRef]
  9. Zaghloul, M.M.Y.; Steel, K.; Veidt, M.; Heitzmann, M.T. Wear behaviour of polymeric materials reinforced with man-made fibres: A comprehensive review about fibre volume fraction influence on wear performance. J. Reinf. Plast. Compos. 2021, 41, 215–241. [Google Scholar] [CrossRef]
  10. Zaghloul, M.M.Y.M. Mechanical properties of linear low-density polyethylene fire-retarded with melamine polyphosphate. J. Appl. Polym. Sci. 2018, 135, 46770. [Google Scholar] [CrossRef]
  11. Zaghloul, M.Y.M.; Zaghloul, M.M.Y.; Zaghloul, M.M.Y. Developments in polyester composite materials—An in-depth review on natural fibres and nano fillers. Compos. Struct. 2021, 278, 114698. [Google Scholar] [CrossRef]
  12. Akhtar, M.; Khan, M.; Khan, S.; Afzal, A.; Subbiah, R.; Ahmad, S.; Husain, M.; Butt, M.; Othman, A.; Bakar, E. Determination of Non-Recrystallization Temperature for Niobium Microalloyed Steel. Materials 2021, 14, 2639. [Google Scholar] [CrossRef]
  13. Sharath, B.; Venkatesh, C.; Afzal, A.; Aslfattahi, N.; Aabid, A.; Baig, M.; Saleh, B. Multi Ceramic Particles Inclusion in the Aluminium Matrix and Wear Characterization through Experimental and Response Surface-Artificial Neural Networks. Materials 2021, 14, 2895. [Google Scholar] [CrossRef]
  14. Lin, C.-H.; Lee, J.R.; Teng, P.J. Effect of Thermal Conditions on Corrosion Behavior of Ductile Cast Iron. Int. J. Electrochem. Sci. 2019, 14, 10032–10042. [Google Scholar] [CrossRef]
  15. Akinribide, O.J.; Akinwamide, S.O.; Ajibola, O.O.; Obadele, B.A.; Olusunle, S.O.O.; Olubambi, P.A. Corrosion behavior of ductile and austempered ductile cast iron in 0.01M and 0.05M NaCl Environments. Procedia Manuf. 2019, 30, 167–172. [Google Scholar] [CrossRef]
  16. Masters, S.; Wang, H.; Pruden, A.; Edwards, M.A. Redox gradients in distribution systems influence water quality, corrosion, and microbial ecology. Water Res. 2015, 68, 140–149. [Google Scholar] [CrossRef]
  17. Wang, H.; Masters, S.; Falkinham, I.J.O.; Edwards, M.A.; Pruden, A. Distribution System Water Quality Affects Responses of Opportunistic Pathogen Gene Markers in Household Water Heaters. Environ. Sci. Technol. 2015, 49, 8416–8424. [Google Scholar] [CrossRef]
  18. Sancy, M.; Gourbeyre, Y.; Sutter, E.; Tribollet, B. Mechanism of corrosion of cast iron covered by aged corrosion products: Application of electrochemical impedance spectrometry. Corros. Sci. 2010, 52, 1222–1227. [Google Scholar] [CrossRef]
  19. Rios, J.; Calderón, J.; Nogueira, R. Electrochemical Behavior of Metals Used in Drinking Water Distribution Systems: A Rotating Cylinder Electrode’s Study. Corrosion 2013, 69, 875–885. [Google Scholar] [CrossRef]
  20. Fabbricino, M.; Korshin, G.V. Changes of the corrosion potential of iron in stagnation and flow conditions and their relationship with metal release. Water Res. 2014, 62, 136–146. [Google Scholar] [CrossRef]
  21. Zou, Y.; Wang, J.; Zheng, Y.Y. Electrochemical Techniques for Determining Corrosion Rate of Rusted Steel in Seawater. Corros. Sci. 2011, 53, 208–216. [Google Scholar] [CrossRef]
  22. Sadeghi, A.; Moloodi, A.; Golestanipour, M.; Shahri, M.M. An investigation of abrasive wear and corrosion behavior of surface repair of gray cast iron by SMAW. J. Mater. Res. Technol. 2017, 6, 90–95. [Google Scholar] [CrossRef] [Green Version]
  23. Liu, C.; Tian, Y.; Zhang, R.; Liu, X.; Guo, H.; Song, Y.; Peng, S. Corrosion of Ductile Cast Iron Pipeline in a Water Supply Network Based on the Flow Field Changing. Int. J. Electrochem. Sci. 2018, 13, 9110–9130. [Google Scholar] [CrossRef]
  24. Guo, H.; Chen, H.; Zhang, H.; Liu, X.; Chen, Y.; Tian, Y.; Yin, J. Study on Growth of Corrosion Scale on Various Iron Based Materials (Grey cast iron/Carbon steel/Ductile Iron) in Water Distribution Systems. Int. J. Electrochem. Sci. 2020, 15, 8479–8497. [Google Scholar] [CrossRef]
  25. Ogundare, O.; Babatope, B.; Adetunji, A.R.; Olusunle, S.O.O. Atmospheric Corrosion Studies of Ductile Iron and Austenitic Stainless Steel in an Extreme Marine Environment. J. Miner. Mater. Charact. Eng. 2012, 11, 914–918. [Google Scholar] [CrossRef]
  26. Song, Y.; Jiang, G.; Chen, Y.; Zhao, P.; Tian, Y. Effects of chloride ions on corrosion of ductile iron and carbon steel in soil environments. Sci. Rep. 2017, 7, 1–13. [Google Scholar] [CrossRef]
  27. Roman, T.; Asavei, R.; Karkalos, N.E.; Roman, C.; Virlan, C.; Cimpoesu, N.; Istrate, B.; Zaharia, M.; Markopoulos, A.P.; Kordatos, K.; et al. Synthesis and adsorption properties of nanocrystalline ferrites for kinetic modeling development. Int. J. Appl. Ceram. Technol. 2018, 16, 693–705. [Google Scholar] [CrossRef]
  28. Zaharia, M.G.; Stanciu, S.; Cimpoesu, R.; Ionita, I.; Cimpoesu, N. Preliminary results on effect of H 2 S on P265GH commercial material for natural gases and petroleum transportation. Appl. Surf. Sci. 2018, 438, 20–32. [Google Scholar] [CrossRef]
  29. Burduhos-Nergis, D.-P.; Vizureanu, P.; Sandu, A.V.; Bejinariu, C. Phosphate Surface Treatment for Improving the Corrosion Resistance of the C45 Carbon Steel Used in Carabiners Manufacturing. Materials 2020, 13, 3410. [Google Scholar] [CrossRef]
  30. Liu, Y.; Tian, Y.; Zhang, R.; Guo, H.; Zhao, W.; Huang, J. Corrosion behavior and mechanism of ductile iron with different degrees of deterioration of cement mortar lining in reclaimed water pipelines. RSC Adv. 2020, 10, 39627–39639. [Google Scholar] [CrossRef]
  31. Cottis, R.; Turgoose, S.; NACE International. Electrochemical Impedance and Noise; NACE International: Houston, TX, USA, 1999; ISBN 9781575900933. [Google Scholar]
  32. Zoltowski, P. On the electrical capacitance of interfaces exhibiting constant phase element behaviour. J. Electroanal. Chem. 1998, 443, 149–154. [Google Scholar] [CrossRef]
  33. Burduhos-Nergis, D.-P.; Vasilescu, G.D.; Burduhos-Nergis, D.-D.; Cimpoesu, R.; Bejinariu, C. Phosphate Coatings: EIS and SEM Applied to Evaluate the Corrosion Behavior of Steel in Fire Extinguishing Solution. Appl. Sci. 2021, 11, 7802. [Google Scholar] [CrossRef]
  34. De Marco, R.; Pejcic, B. Electrochemical Impedance Spectroscopy and X-ray Photoelectron Spectroscopy Study of the Response Mechanism of the Chalcogenide Glass Membrane Iron(III) Ion-Selective Electrode in Saline Media. Anal. Chem. 2000, 72, 669–679. [Google Scholar] [CrossRef] [PubMed]
  35. Nofal, A.; Ahmed, A.S.; Ghanem, W.A.; Hussein, W.; Mohamed, N.K. Evaluation of Corrosion Behavior of Different Grades of Cast Iron Insodium Chloride Solutions. Key Eng. Mater. 2020, 835, 223–228. [Google Scholar] [CrossRef]
  36. Lagunas, C.; Gonzalez, S.; Velasco, M.; Muller, C. Evaluation of electrochemical impedance spectroscopy (EIS) for inline monitoring of internal corrosion in ductile iron water distribution pipes. Int. J. Emerg. Technol. Adv. Eng. 2014, 4, 413–419. [Google Scholar]
Figure 1. Polarisation curves for nodular cast-iron immersed at various time intervals in DWW-1.
Coatings 12 00911 g001
Figure 2. Polarisation curves for nodular cast-iron immersed at various time intervals in DWW-2.
Coatings 12 00911 g002
Figure 3. Polarisation curves for nodular cast-iron immersed in various time intervals in DWW-3.
Coatings 12 00911 g003
Figure 4. Nodular cast iron immersed for 65 days in DWW-2: (a) Nyquist plot and (b) Bode plot.
Coatings 12 00911 g004
Figure 5. Equivalent circuit and physical surface model representation for samples immersed for 1 h and 30 days in wastewaters.
Coatings 12 00911 g005
Figure 6. Microphotographs of samples immersed for 1 h, after recording the polarization curves and electrochemical impedance spectra, in the used corrosive media.
Coatings 12 00911 g006
Figure 7. Chemical compositions and EDS spectra for the sample immersed for 1 h in DWW-1, (A) Zone A and (B) Zone B.
Coatings 12 00911 g007
Figure 8. Morphology and chemical composition on various areas of the studied sample surface immersed in DWW-2: (A) Zone A, (B) Zone B and (C) Zone C.
Coatings 12 00911 g008
Figure 9. Elemental distribution of the areas presented in Figure 8: (A) Zone A, (B) Zone B and (C) Zone C.
Coatings 12 00911 g009
Figure 10. The surface structure of nodular cast iron after immersion for 1 h in DWW-3.
Coatings 12 00911 g010
Figure 11. SEM microphotographs for samples immersed for 30 days in artificial domestic wastewater.
Coatings 12 00911 g011
Figure 12. Punctual EDS microanalysis of the sample surface immersed for 30 days in DWW-1.
Coatings 12 00911 g012
Figure 13. Punctual EDS microanalysis of the sample surface immersed for 30 days in DWW-2.
Coatings 12 00911 g013
Figure 14. Punctual EDS microanalysis of the sample surface immersed for 30 days in DWW-3.
Coatings 12 00911 g014
Figure 15. Equivalent circuit, surface physical model, and Boukamp representation for modelling SIE data obtained for samples immersed for 65 days in corrosion environments.
Coatings 12 00911 g015
Figure 16. SEM microphotographs of the nodular cast iron surface after immersion for 65 days in DWW-1: (a) 25× magnification, (b) and (c) 200× magnification.
Coatings 12 00911 g016
Figure 17. EDS results for the sample immersed for 65 days in DWW-1.
Coatings 12 00911 g017
Figure 18. SEM micrographs for cast iron samples were maintained for 65 days in DWW-2.
Coatings 12 00911 g018
Figure 19. EDS results for the sample immersed for 65 days in DWW-2.
Coatings 12 00911 g019
Figure 20. EDS, corrosion zone A, and point composition on the surface of the nodular cast iron immersed for 65 days in DWW-3.
Coatings 12 00911 g020
Figure 21. EDS, corrosion zone B, and point compositions on the nodular cast iron surface immersed for 65 days in DWW-3.
Coatings 12 00911 g021
Figure 22. Equivalent circuit, surface physical model, and Boukamp representation for modelling EIS data obtained for samples immersed for 90 days in corrosion environments.
Coatings 12 00911 g022
Figure 23. SEM Images of samples after immersion for 90 days in DWW-1 and DWW-2.
Coatings 12 00911 g023
Figure 24. SEM micrographs of crusts at 1000× magnification.
Coatings 12 00911 g024
Figure 25. EDS results for the sample immersed for 90 days in DWW-1.
Coatings 12 00911 g025
Figure 26. EDS results for the sample immersed for 90 days in DWW-2.
Coatings 12 00911 g026
Figure 27. Punctual compositions on the sample surface immersed for 90 days in DWW-3.
Coatings 12 00911 g027
Table 1. The chemical composition and principal characteristics of nodular cast iron used for rotor manufacturing.
ElementWt, %CharacteristicsValues
Carbon (C)4.50Hardness160–210 N/mm3
Silicone (Si)2.28
Nickel (Ni)0.12
Magnesium (Mg)0.10
Manganese (Mn)0.09Thermal Expansion
Coefficient
0.0564%/°C
Phosphorus (P)0.05
Sulphur (S)0.04
Chrome (Cr)0.02
Titanium (Ti)0.02Tensile strength440 MPa
Aluminium (Al)0.01
Copper (Cu)0.01Tensile Elongation8%
Iron (Fe)balance
Table 2. The chemical composition of the base synthetic wastewater (DWW-1).
Chemical Componentsmg/LFood Componentsmg/LMetal TracesMg Metal/L
NH4Cl15Powdered milk118Cr(NO3)3·9H2O0.10
CH3COONa·3H2O142Yeast54CuCl2·2H2O0.20
MgSO4·7H2O32Starch122MnCl20.05
CaHPO420Soybean oil15NiSO4·7H2O0.08
K2HPO4·3H2O56 PbCl20.07
FeSO4·7H2O14
Urea15
Table 3. Instantaneous corrosion process parameters for samples immersed in DWW-1.
Parameter1 h30 Days65 Days90 Days
E(I = 0), mV−(633 ± 3)−(575 ± 5)−(544 ± 2)−(522 ± 22)
Rp, kΩ·cm21.053 ± 0.51.36 ± 0.111.12 ± 0.071.13 ± 0.03
Jcor, µA/cm230.47 ± 0.5721.19 ± 08720.71 ± 1.5614.38 ± 0.52
vcor, µm/an356.4 ± 6.8247.8 ± 20.3242.0 ± 1.5185.8 ± 6.2
ba, mV/decade179 ± 4178 ± 7166 ± 1186 ± 4
bc, mV/decade−(215 ± 6)−(170 ± 7)−(119 ± 4)−(152 ± 8)
Table 4. Instantaneous corrosion process parameters for samples immersed in DWW-2.
Parameter1 h30 Days65 Days90 Days
E(I = 0), mV−(545 ± 4)−(536 ± 1)−(591 ± 4)−(572 ± 1)
Rp, kΩ·cm2261.4 ± 1.7297 ± 12209.4 ± 3.2372 ± 9.62
Jcor, µA/cm2125.0 ± 2131.3 ± 2.3177.33 ± 2.4596.19 ± 2.95
vcor, µm/an1440 ± 401540 ± 302042 ± 301127 ± 370
ba, mV/decade144 ± 16205 ± 7214 ± 1211 ± 5
bc, mV/decade−(243 ± 8)−(339 ± 6)−(271 ± 1)−(245 ± 17)
Table 5. Instantaneous corrosion process parameters for samples immersed in DWW-3.
Parameter1 h30 Days65 Days90 Days
E(I = 0), mV−(657 ± 6)−(638 ± 6)−(622 ± 5)−(607 ± 7)
Rp, kΩ·cm2295.8 ± 2.3284.6 ± 0.1306.9 ± 8341.9 ± 11.6
Jcor, µA/cm2149.1 ± 1.76126.8 ± 3.9114.7 ± 4.7105.9 ± 3.0
vcor, µm/an1743 ± 171483 ± 271319 ± 151238 ± 35
ba, mV/decade196 ± 2199 ± 6192 ± 2197 ± 2
bc, mV/decade−(762 ± 36)−(319 ± 3)−(300 ± 7)−(300 ± 12)
Table 6. Equivalent circuit element values for nodular cast iron samples immersed for 1 h in neutral, acidic, and basic synthetic wastewater.
SampleRs
Ω·cm2
Cext
nF/cm2
Rext
Ω·cm2
CPERct
Ω·cm2
ε(Z) %104·χ2
Qdl
S·sn/cm2
n
DWW-13260.11410161.72 × 10−40.81411821.813.29
DWW-21586.1420.443.61 × 10−40.7532842.164.67
DWW-32054.1831.968.56 × 10−40.7405841.722.96
Table 7. Equivalent circuit element values for nodular cast iron samples immersed for 30 days in neutral, acidic, and basic synthetic wastewater.
SampleRs
Ω·cm2
Cext
nF/cm2
Rext
Ω·cm2
CPERct
Ω·cm2
ε(Z)
%
104·χ2
Qdl
S·sn/cm2
n
DWW-13470.3703251.42 × 10−40.81618251.812.58
DWW-2117511032.469.65 × 10−30.5493001.903.63
DWW-32054.2731.768.28 × 10−40.7435721.722.52
Table 8. Boukamp circuit elements parameter values R(C(R(Q(R(CR))))) for nodular cast iron samples immersed for 65 days in synthetic domestic waters.
SampleRs
Ω·cm2
Cext
nF/cm2
Rext
Ω·cm2
CPERint
Ω·cm2
Cdl
µF/cm2
Rct
Ω·cm2
ε(Z) %104·χ2
102·Q
S·sn/cm2
n
DWW-13290.3463512.630.53934195330.961.44
DWW-295.12.03734.01.170.3862.62520611.231.52
DWW-31322.76133.16.770.52164114931.511.12
Table 9. Boukamp circuit elements parameter values R(C(R(W(R(CR))))) for nodular cast iron samples immersed for 90 days in synthetic domestic waters.
SampleRs
Ω·cm2
Cext
nF/cm2
Rext
Ω·cm2
W
S·s1/2/cm2
Rint
Ω·cm2
Cdl
µF/cm2
Rct
Ω·cm2
ε(Z) %104·χ2
DWW-13080.3113470.17098.223902131.081.15
DWW-21284.01222.00.02711.410.042262.034.14
DWW-31484.85531.10.0811642471131.462.13
Publisher’s Note: MDPI stays neutral with regard to jurisdictional claims in published maps and institutional affiliations.

