
Synthesis of Zeolites from Fine-Grained Perlite and Their Application as Sorbents

 , , and
Abstract
:1. Introduction
2. Materials, Experimental and Methods
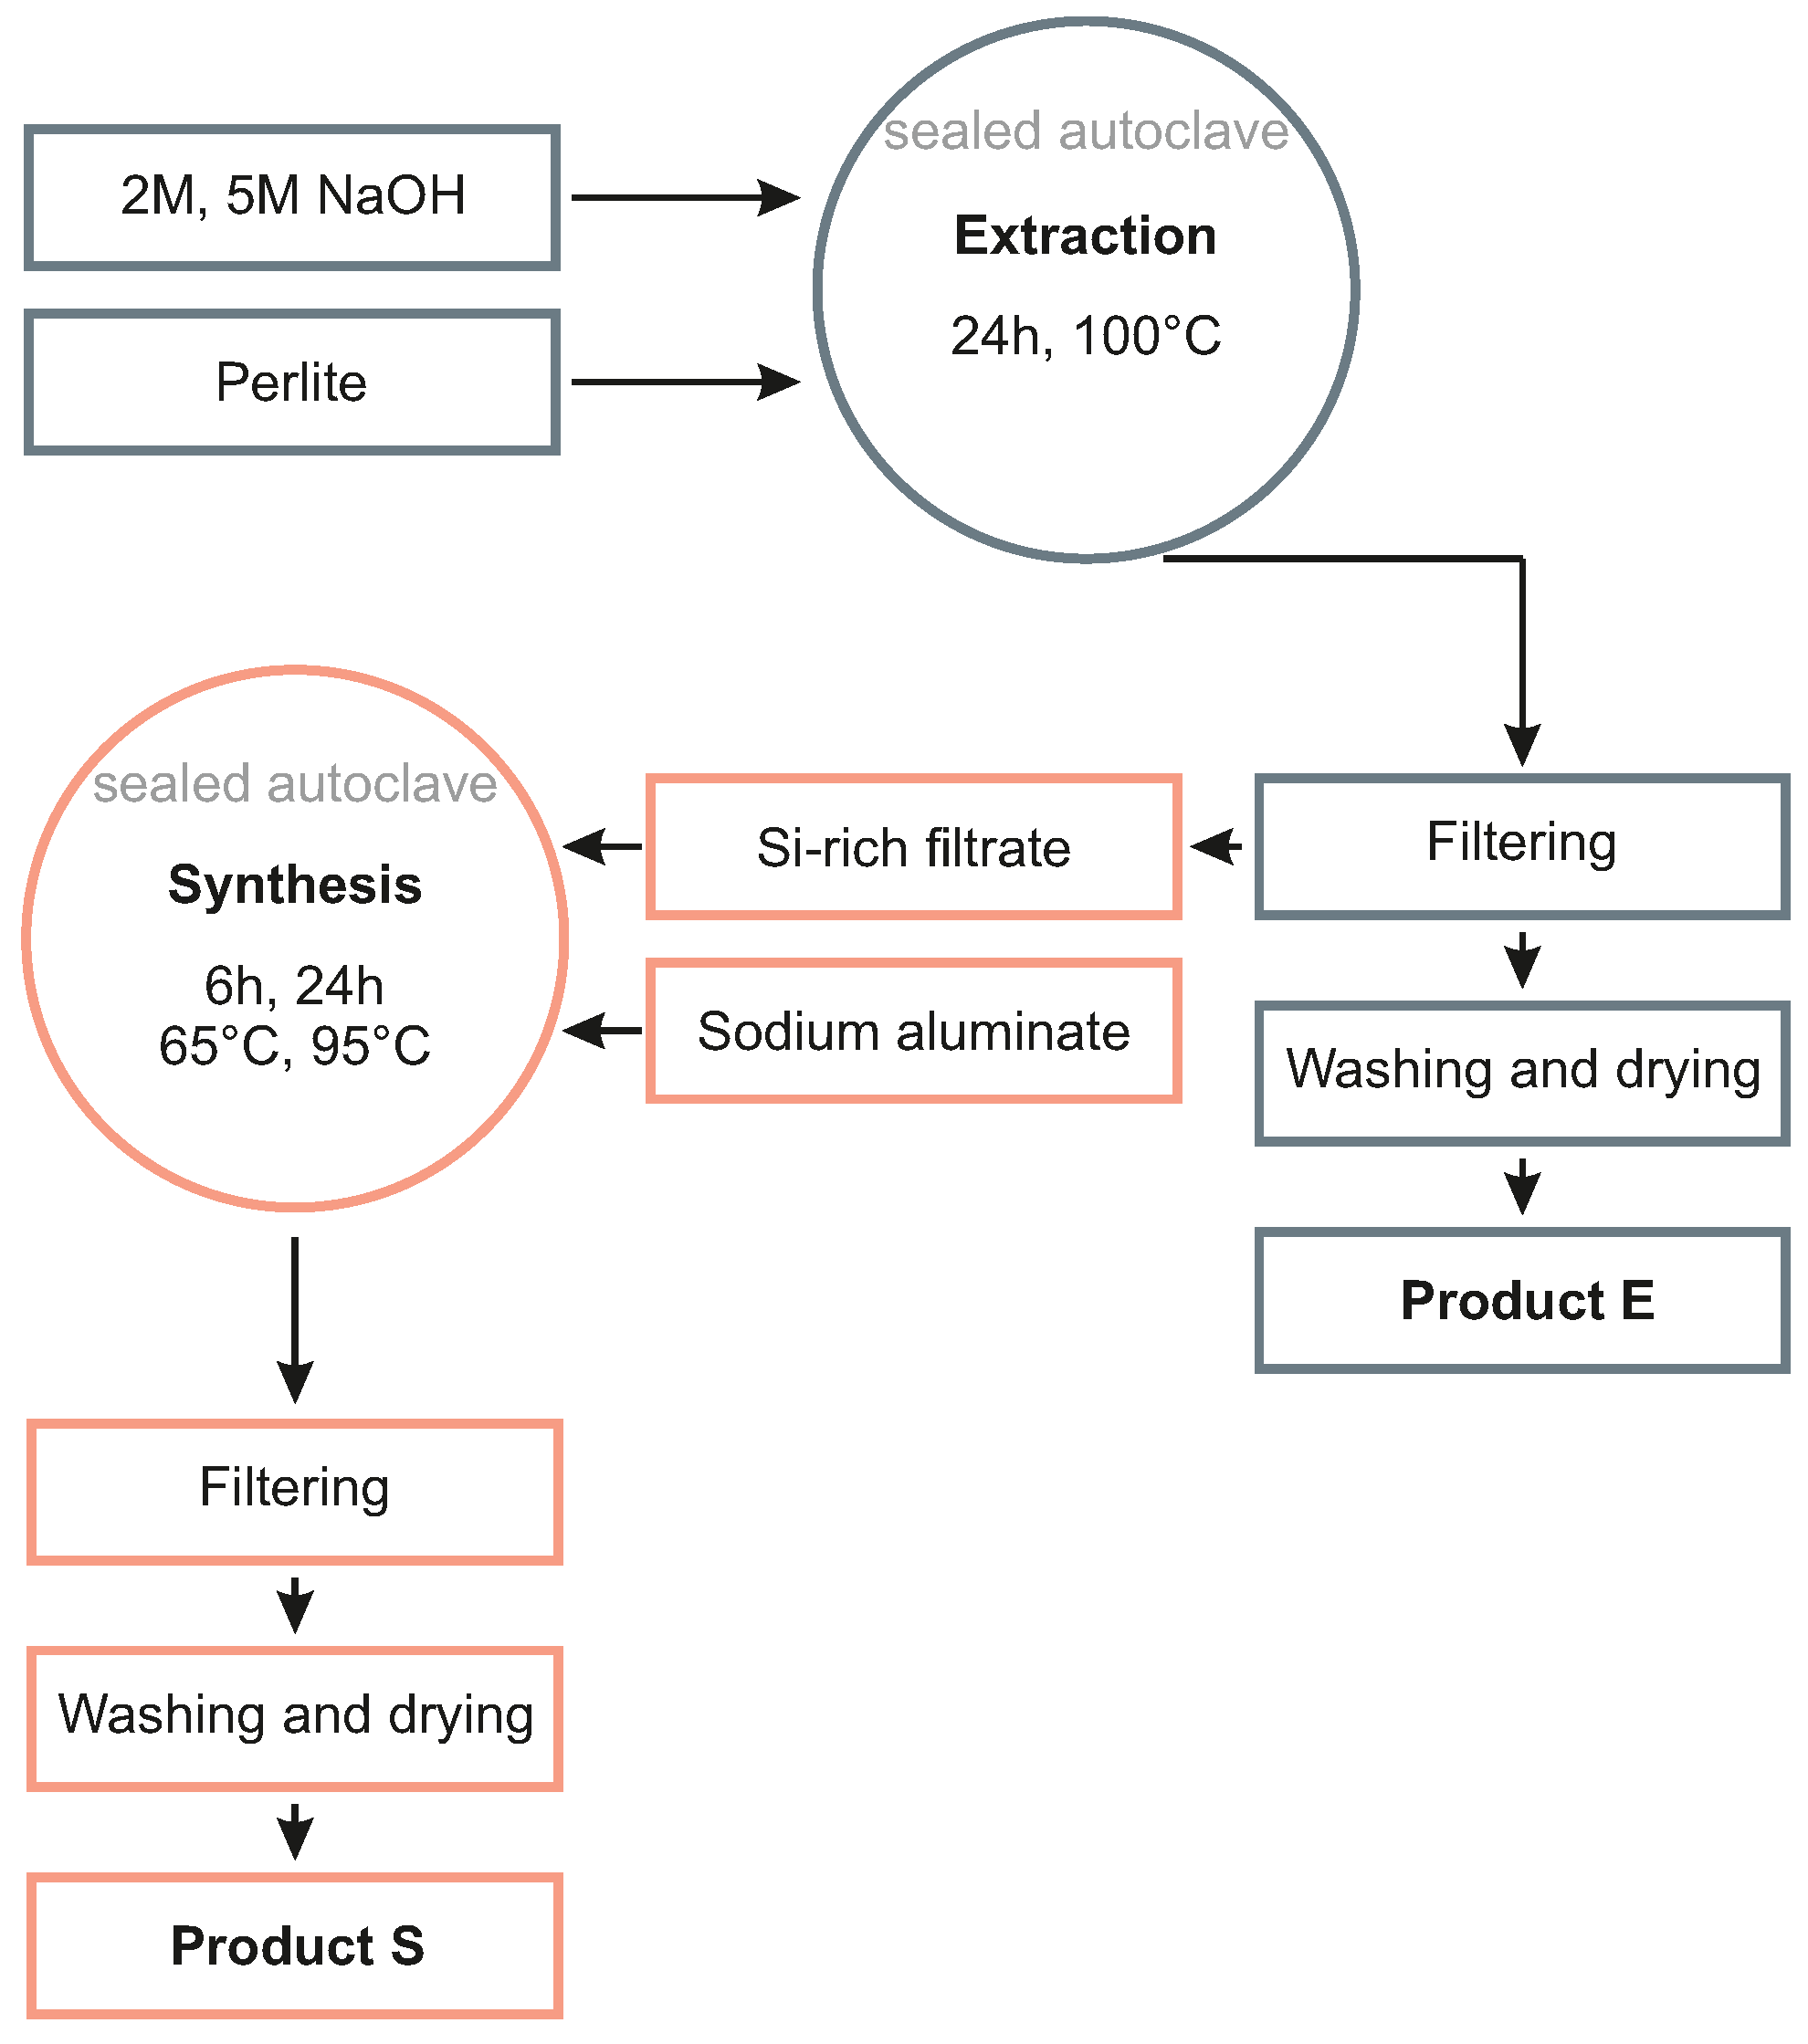
2.1. Materials
2.2. Zeolite Synthesis
2.3. Performance Tests
2.4. Analytical Methods
2.4.1. Fluid-Phase Characterization
2.4.2. Solid-Phase Characterization
3. Results and Discussion
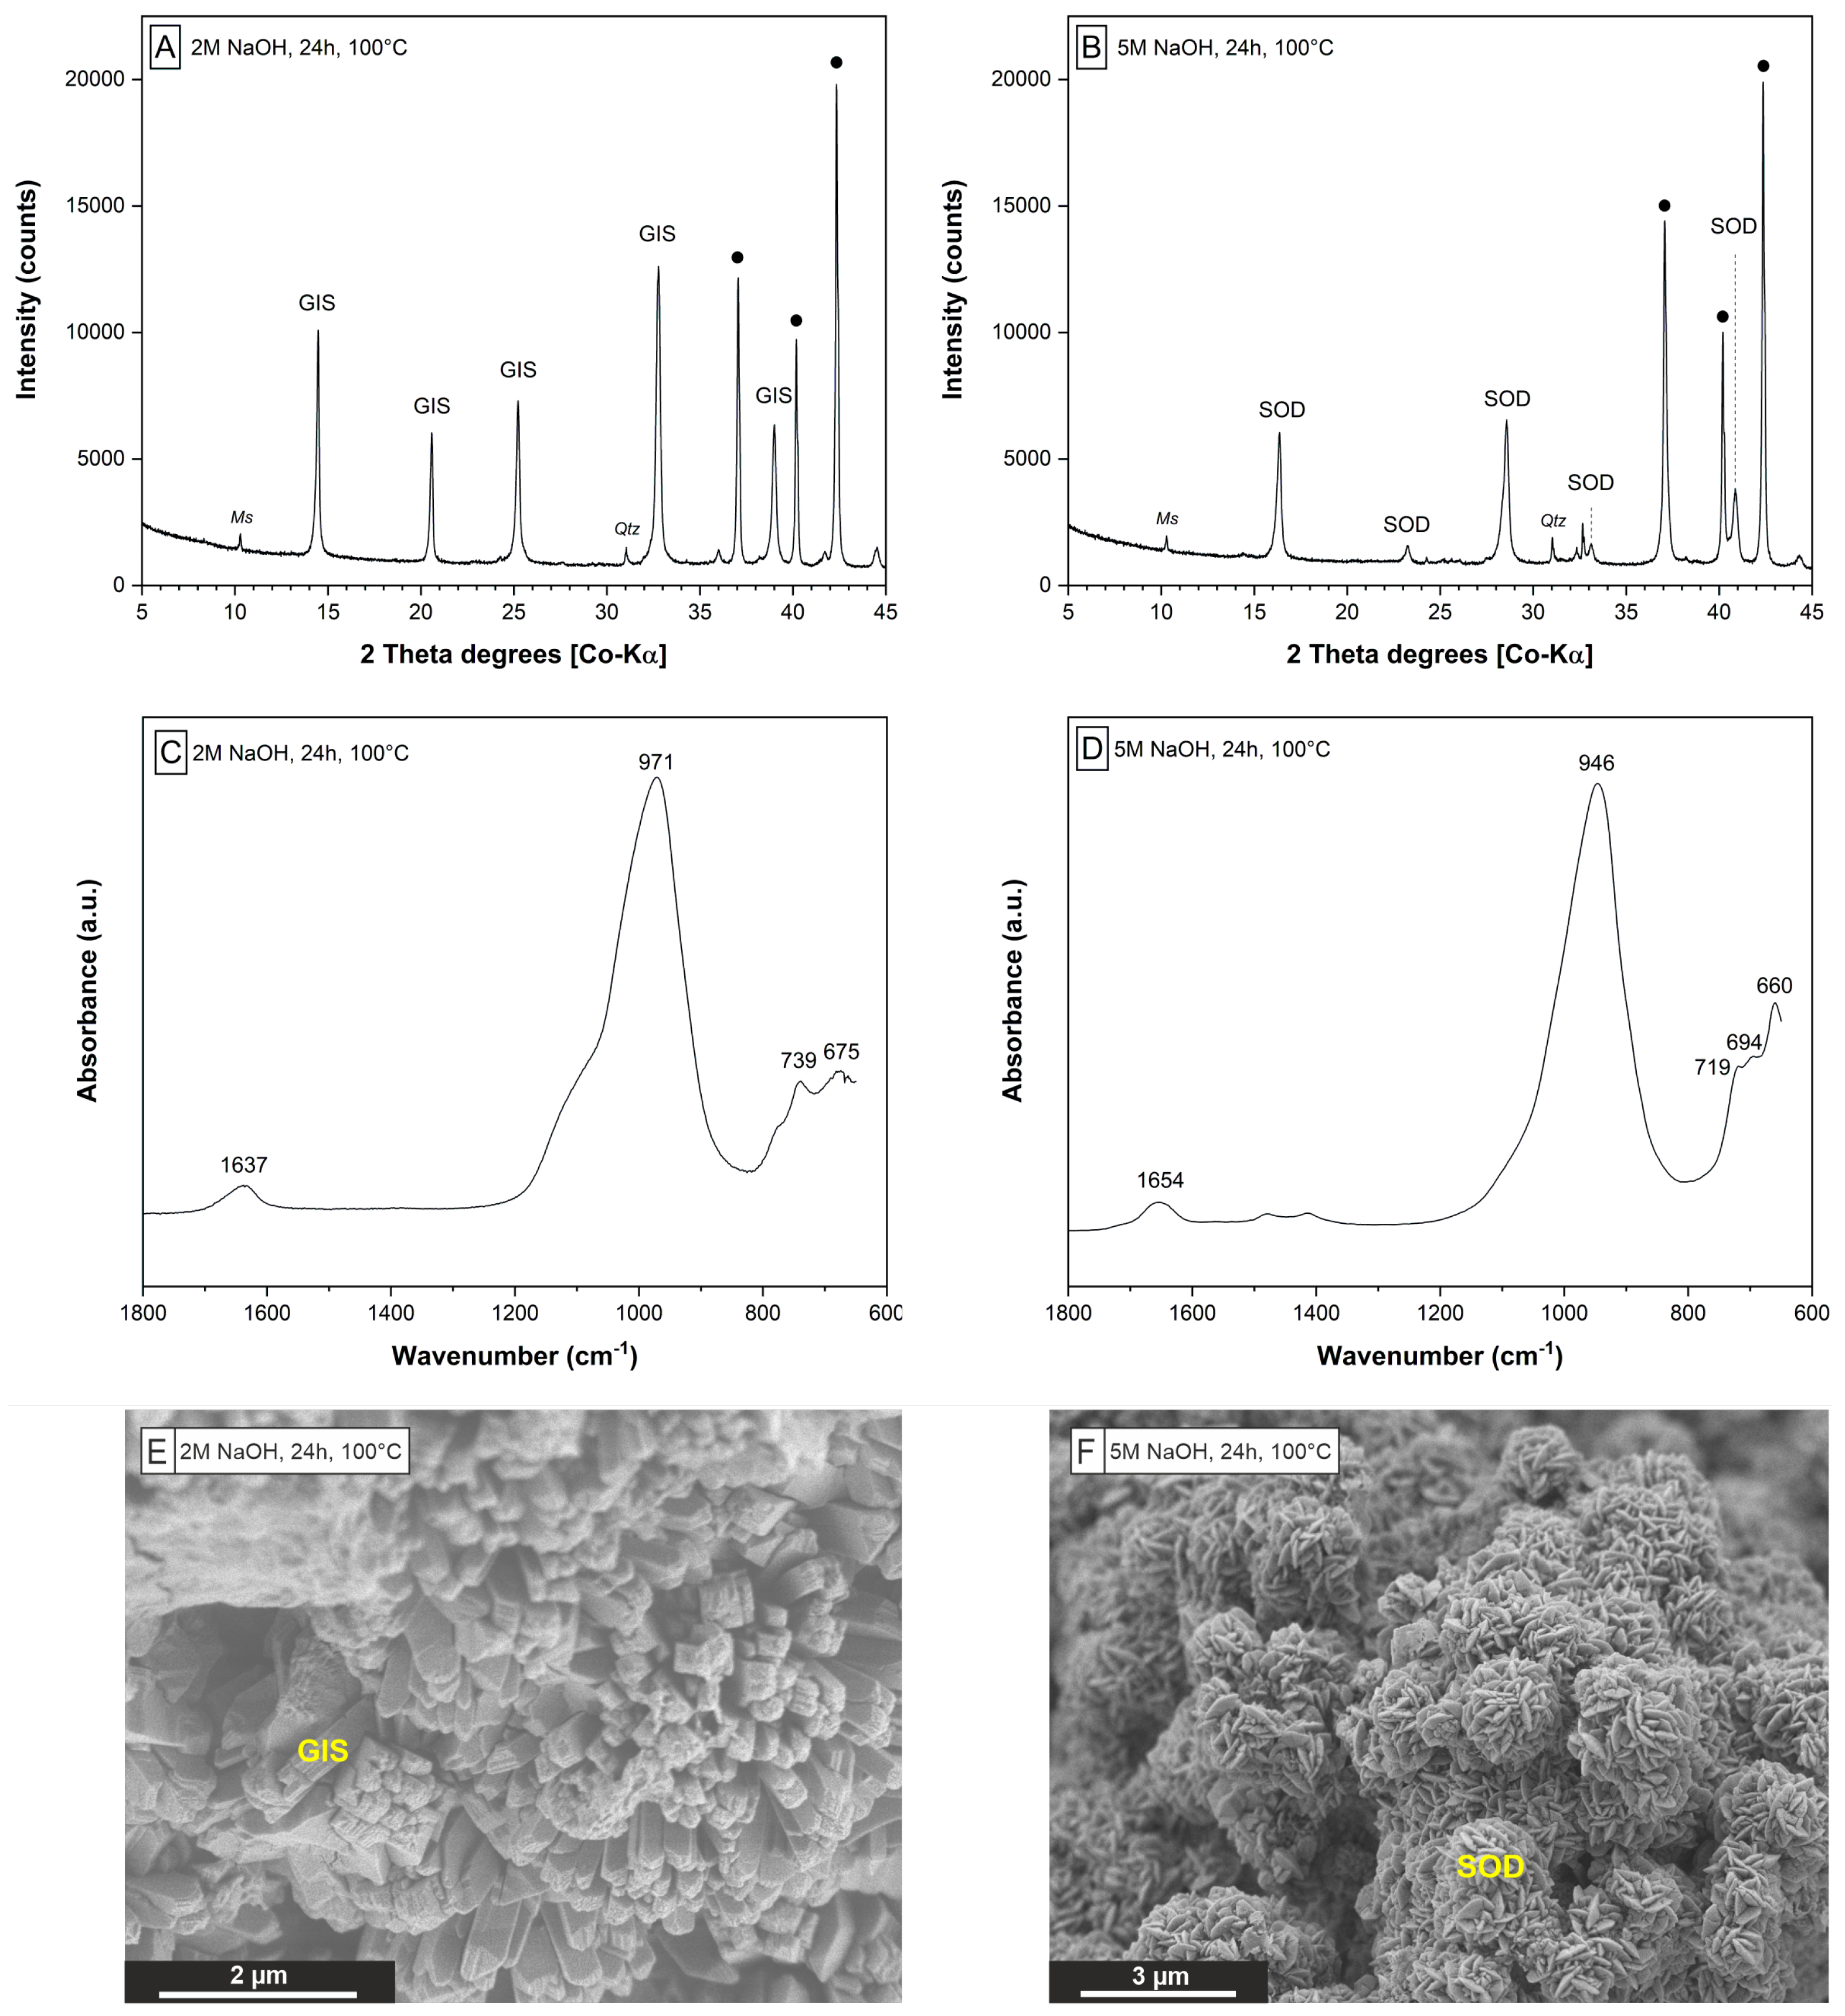
3.1. Hydrothermal Extraction Step
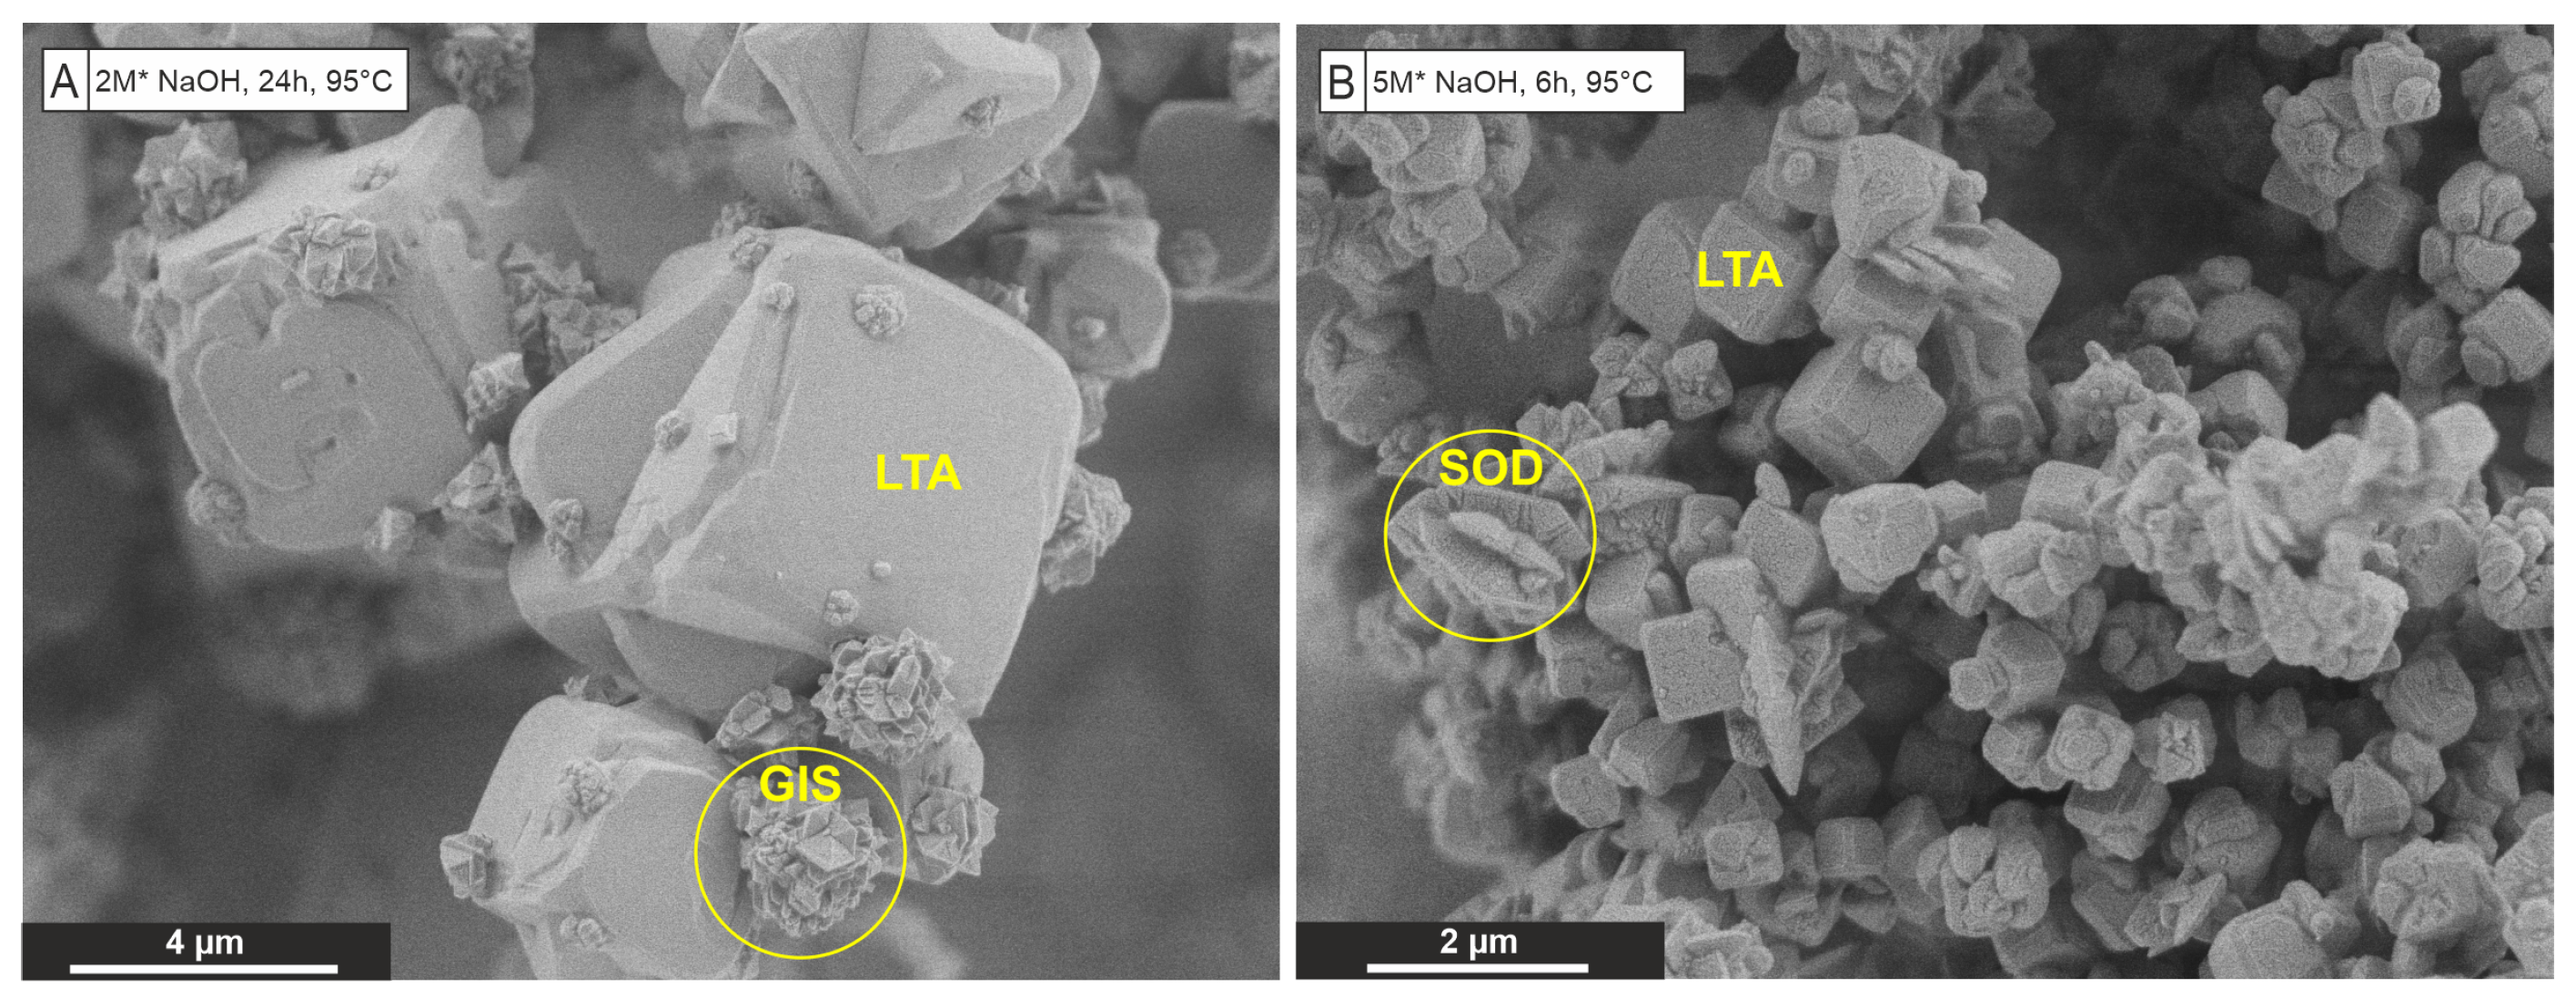
3.2. Hydrothermal Synthesis Step
3.3. Ion Sorption Performance
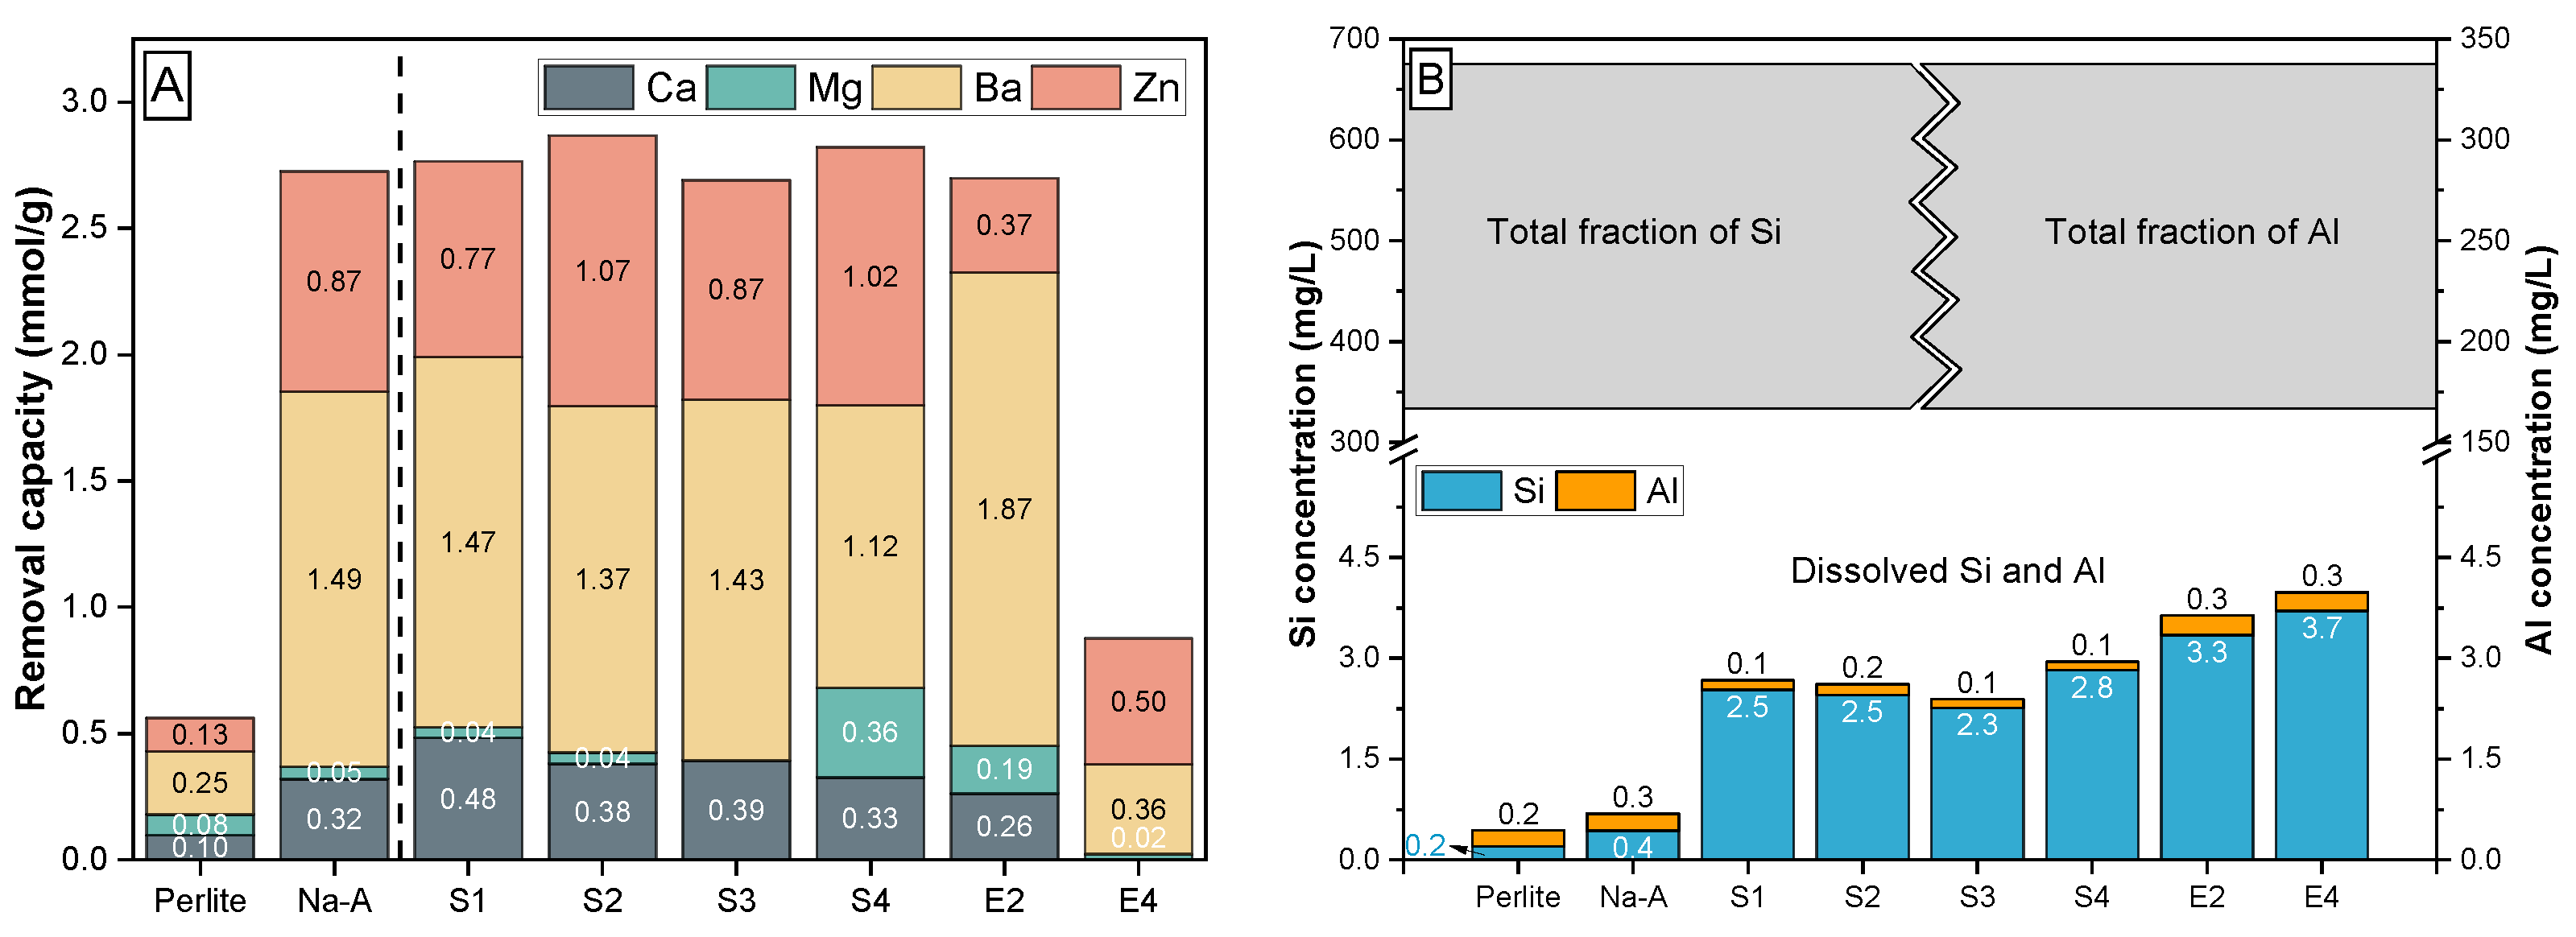
3.3.1. Competitive Me Ion Removal from Waste Solution

| Cation | Hydrated Radius | Ionic Radius | Hydration Energy |
|---|---|---|---|
| (Å) | (Å) | (kJ/mol) | |
| Na+ | 3.58 | 1.02 | −365 |
| K+ | 3.31 | 1.38 | −295 |
| Ca2+ | 4.12 | 1.00 | −1505 |
| Mg2+ | 4.28 | 0.72 | −1803 |
| Ba2+ | 4.04 | 1.36 | −1250 |
| Zn2+ | 4.30 | 0.75 | −1955 |
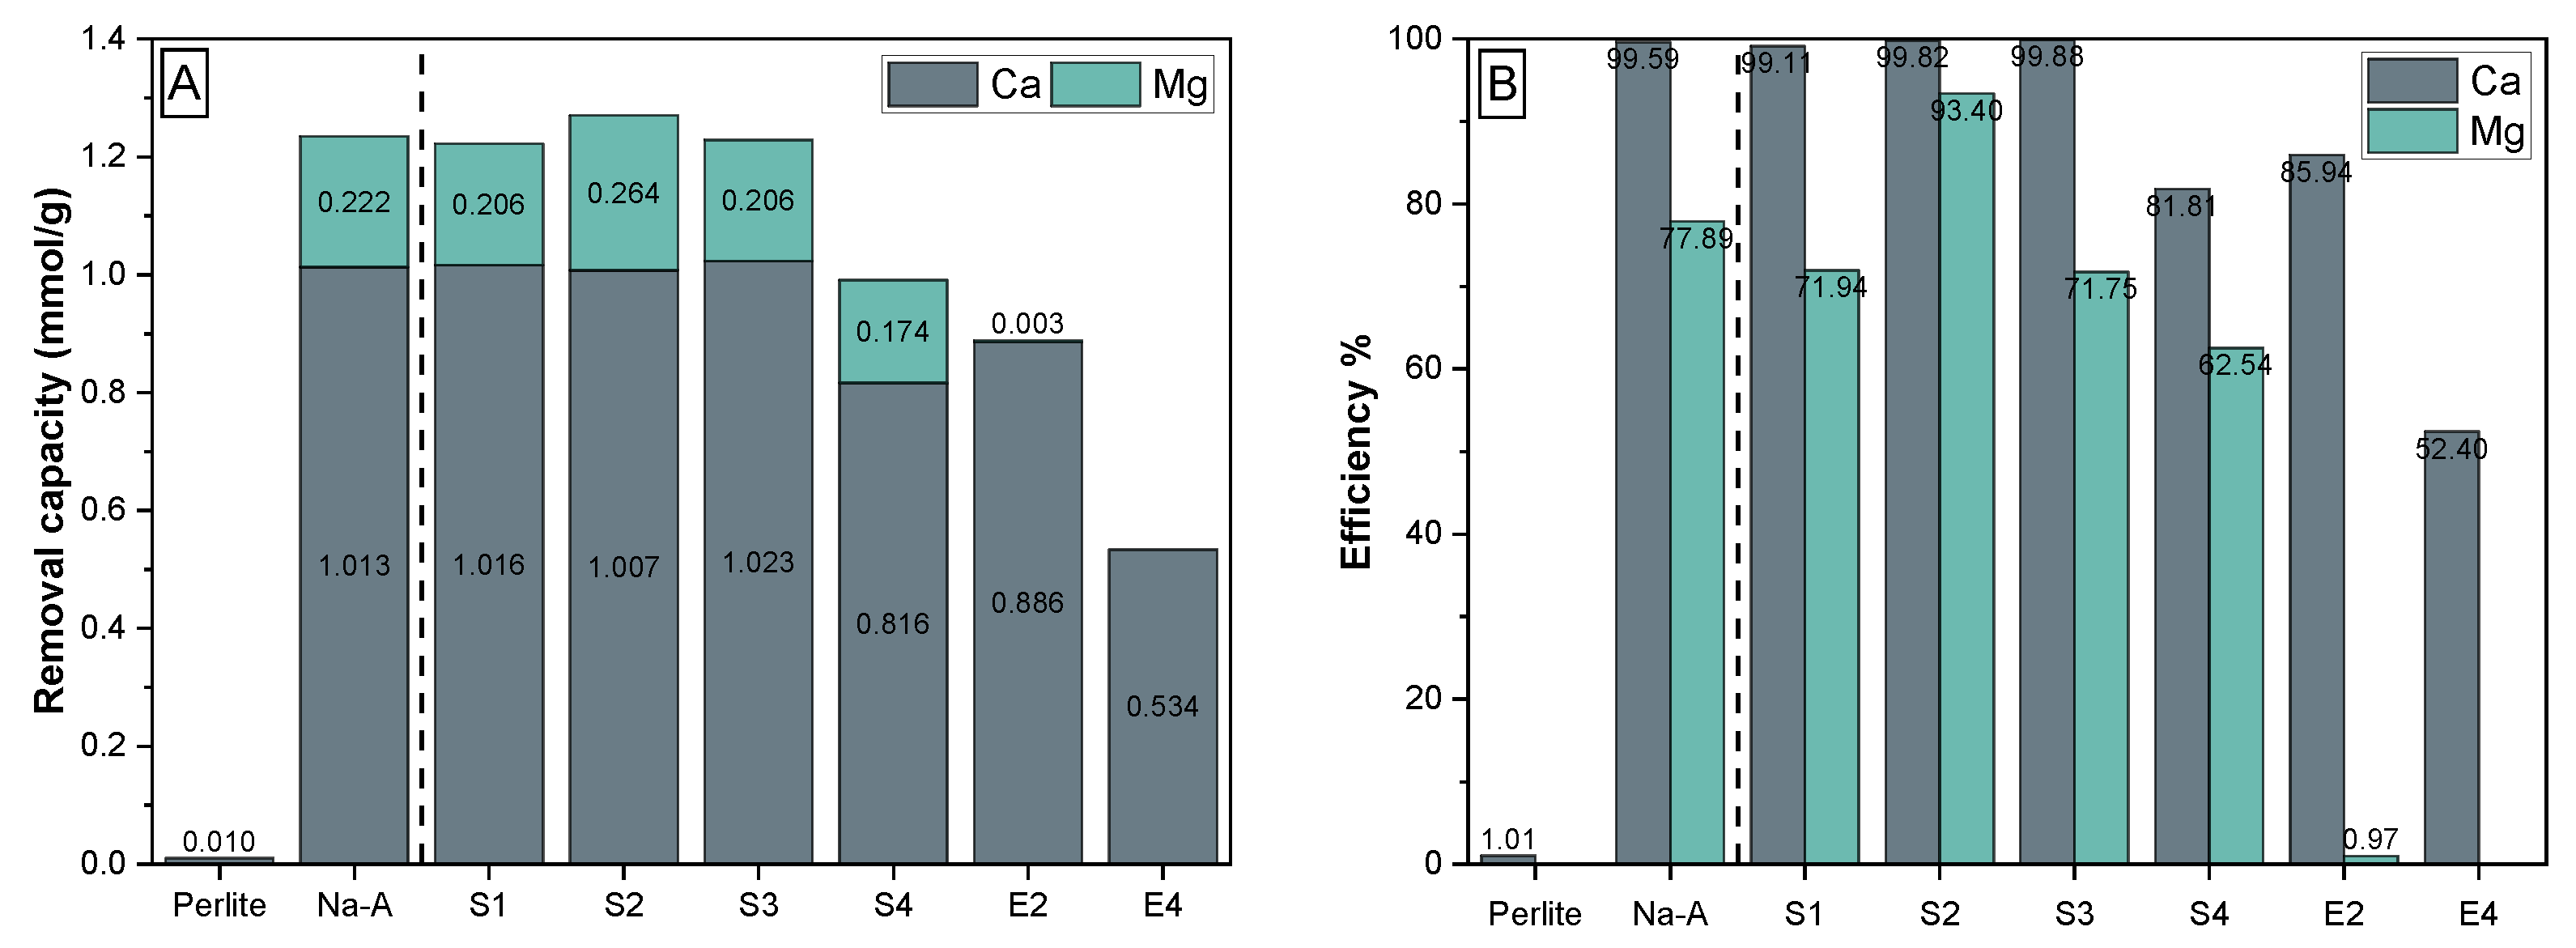
3.3.2. Ca and Mg Ion Removal for Water Softening
3.4. Comparison of Adsorbents
4. Conclusions
Author Contributions
Funding
Institutional Review Board Statement
Informed Consent Statement
Data Availability Statement
Acknowledgments
Conflicts of Interest
References
- Bacquart, T.; Frisbie, S.; Mitchell, E.; Grigg, L.; Cole, C.; Small, C.; Sarkar, B. Multiple inorganic toxic substances contaminating the groundwater of Myingyan Township, Myanmar: Arsenic, manganese, fluoride, iron, and uranium. Sci. Total Environ. 2015, 517, 232–245. [Google Scholar] [CrossRef] [PubMed]
- Malik, Q.; Khan, M. Effect on Human Health due to Drinking Water Contaminated with Heavy Metals. J. Pollut. Eff. Control 2016, 5, 1000179. [Google Scholar] [CrossRef] [Green Version]
- Chabukdhara, M.; Gupta, S.K.; Kotecha, Y.; Nema, A.K. Groundwater quality in Ghaziabad district, Uttar Pradesh, India: Multivariate and health risk assessment. Chemosphere 2017, 179, 167–178. [Google Scholar] [CrossRef] [PubMed]
- Baldermann, A.; Landler, A.; Mittermayr, F.; Letofsky-Papst, I.; Steindl, F.; Galan, I.; Dietzel, M. Removal of heavy metals (Co, Cr, and Zn) during calcium–aluminium–silicate–hydrate and trioctahedral smectite formation. J. Mater. Sci. 2019, 54, 9331–9351. [Google Scholar] [CrossRef] [Green Version]
- Araissi, M.; Ayed, I.; Elaloui, E.; Moussaoui, Y. Removal of barium and strontium from aqueous solution using zeolite 4A. Water Sci. Technol. J. Int. Assoc. Water Pollut. Res. 2016, 73, 1628–1636. [Google Scholar] [CrossRef]
- Dhingra, N.; Singh, N.S.; Parween, T.; Sharma, R. Heavy Metal Remediation by Natural Adsorbents. In Modern Age Waste Water Problems; Oves, M., Ansari, M.O., Zain Khan, M., Shahadat, M., M.I. Ismail, I., Eds.; Springer International Publishing: Cham, Switzerland, 2020; pp. 233–250. [Google Scholar] [CrossRef]
- Grba, N.; Kragulj-Isakovski, M.; Stojanović, M.; Šćiban, M.; Tenodi, S.; Dietzel, M.; Baldermann, A.; Krčmar, D.; Savić, M.; Dalmacija, B. Priority substances in the groundwater of the Neogene Middle Posavina region and proposal for nano-geopolymer-based remediation techniques. Int. J. Environ. Sci. Technol. 2021, 232, 39–52. [Google Scholar] [CrossRef]
- Fu, F.; Wang, Q. Removal of heavy metal ions from wastewaters: A review. J. Environ. Manag. 2011, 92, 407–418. [Google Scholar] [CrossRef]
- Carolin, C.F.; Kumar, P.S.; Saravanan, A.; Joshiba, G.J.; Naushad, M. Efficient techniques for the removal of toxic heavy metals from aquatic environment: A review. J. Environ. Chem. Eng. 2017, 5, 2782–2799. [Google Scholar] [CrossRef]
- Babel, S.; Kurniawan, T.A. Low-cost adsorbents for heavy metals uptake from contaminated water: A review. J. Hazard. Mater. 2003, 97, 219–243. [Google Scholar] [CrossRef]
- Mukai, H.; Hirose, A.; Motai, S.; Kikuchi, R.; Tanoi, K.; Nakanishi, T.M.; Yaita, T.; Kogure, T. Cesium adsorption/desorption behavior of clay minerals considering actual contamination conditions in Fukushima. Sci. Rep. 2016, 6, 21543. [Google Scholar] [CrossRef] [Green Version]
- Baldermann, A.; Grießbacher, A.; Baldermann, C.; Purgstaller, B.; Letofsky-Papst, I.; Kaufhold, S.; Dietzel, M. Removal of Barium, Cobalt, Strontium, and Zinc from Solution by Natural and Synthetic Allophane Adsorbents. Geosciences 2018, 8, 309. [Google Scholar] [CrossRef] [Green Version]
- Mukhopadhyay, R.; Bhaduri, D.; Sarkar, B.; Rusmin, R.; Hou, D. Clay-polymer nanocomposites: Progress and challenges for use in sustainable water treatment. J. Hazard. Mater. 2020, 383, 121125. [Google Scholar] [CrossRef] [PubMed]
- Baldermann, A.; Fleischhacker, Y.; Schmidthaler, S.; Wester, K.; Nachtnebel, M.; Eichinger, S. Removal of Barium from Solution by Natural and Iron(III) Oxide-Modified Allophane, Beidellite and Zeolite Adsorbents. Materials 2020, 13, 2582. [Google Scholar] [CrossRef]
- Abu-Danso, E.; Peräniemi, S.; Leiviskä, T.; Kim, T.; Tripathi, K.M.; Bhatnagar, A. Synthesis of clay-cellulose biocomposite for the removal of toxic metal ions from aqueous medium. J. Hazard. Mater. 2020, 381, 120871. [Google Scholar] [CrossRef]
- Kakaei, S.; Khameneh, E.S.; Rezazadeh, F.; Hosseini, M.H. Heavy metal removing by modified bentonite and study of catalytic activity. J. Mol. Struct. 2020, 1199, 126989. [Google Scholar] [CrossRef]
- Khajavi, S.; Jansen, J.C.; Kapteijn, F. Production of ultra pure water by desalination of seawater using a hydroxy sodalite membrane. J. Membr. Sci. 2010, 356, 52–57. [Google Scholar] [CrossRef]
- Golbad, S.; Khoshnoud, P.; Abu-Zahra, N. Hydrothermal synthesis of hydroxy sodalite from fly ash for the removal of lead ions from water. Int. J. Environ. Sci. Technol. 2017, 14, 135–142. [Google Scholar] [CrossRef]
- Cardoso, A.M.; Horn, M.B.; Ferret, L.S.; Azevedo, C.M.; Pires, M. Integrated synthesis of zeolites 4A and Na–P1 using coal fly ash for application in the formulation of detergents and swine wastewater treatment. J. Hazard. Mater. 2015, 287, 69–77. [Google Scholar] [CrossRef]
- Hashemian, S.; Hosseini, S.H.; Salehifar, H.; Salari, K. Adsorption of Fe(III) from Aqueous Solution by Linde Type-A Zeolite. Am. J. Anal. Chem. 2013, 4, 123–126. [Google Scholar] [CrossRef] [Green Version]
- Said, B.; Grandjean, A.; Barre, Y.; Tancret, F.; Fajula, F.; Galarneau, A. LTA zeolite monoliths with hierarchical trimodal porosity as highly efficient microreactors for strontium capture in continuous flow. Microporous Mesoporous Mater. 2016, 232, 39–52. [Google Scholar] [CrossRef]
- Lobo-Recio, M.Á.; Rodrigues, C.; Custódio Jeremias, T.; Lapolli, F.R.; Padilla, I.; López-Delgado, A. Highly efficient removal of aluminum, iron, and manganese ions using Linde type-A zeolite obtained from hazardous waste. Chemosphere 2021, 267, 128919. [Google Scholar] [CrossRef] [PubMed]
- Salimkhani, S.; Siahcheshm, K.; Kadkhodaie, A.; Salimkhani, H. Structural analysis and the effect of the chromium on LTA (Na) zeolite synthesized from kaolin. Mater. Chem. Phys. 2021, 271, 124957. [Google Scholar] [CrossRef]
- Xue, Z.; Li, Z.; Ma, J.; Bai, X.; Kang, Y.; Hao, W.; Li, R. Effective removal of Mg2+ and Ca2+ ions by mesoporous LTA zeolite. Desalination 2014, 341, 10–18. [Google Scholar] [CrossRef]
- Liu, Z.; Zhu, J.; Wakihara, T.; Okubo, T. Ultrafast synthesis of zeolites: Breakthrough, progress and perspective. Inorg. Chem. Front. 2019, 6, 14–31. [Google Scholar] [CrossRef]
- Rozhkovskaya, A.; Rajapakse, J.; Millar, G.J. Process engineering approach to conversion of alum sludge and waste glass into zeolite LTA for water softening. J. Water Process Eng. 2021, 43, 102177. [Google Scholar] [CrossRef]
- Kirschhock, C.E.A.; Feijen, E.J.P.; Jacobs, P.A.; Martens, J.A. Hydrothermal Zeolite Synthesis. In Handbook of Heterogeneous Catalysis; Wiley-VCH Verlag GmbH & Co. KGaA: Weinheim, Germany, 2008; Chapter 2.3.5; pp. 160–178. [Google Scholar] [CrossRef]
- Wenten, I.G.; Dharmawijaya, P.T.; Aryanti, P.T.P.; Mukti, R.R.; Khoiruddin, K. LTA zeolite membranes: Current progress and challenges in pervaporation. RSC Adv. 2017, 7, 29520–29539. [Google Scholar] [CrossRef] [Green Version]
- Ayele, L.; Pérez-Pariente, J.; Chebude, Y.; Diaz, I. Synthesis of zeolite A using kaolin from Ethiopia and its application in detergents. New J. Chem. 2016, 40, 3440–3446. [Google Scholar] [CrossRef]
- Ibrahim, H.S.; Jamil, T.S.; Hegazy, E.Z. Application of zeolite prepared from Egyptian kaolin for the removal of heavy metals: II. Isotherm models. J. Hazard. Mater. 2010, 182, 842–847. [Google Scholar] [CrossRef]
- Burriesci, N.; Corigliano, F.; Saija, L.; Zipelli, C.; Bart, J.C.J. Application in detergency of a low-grade zeolite-a derived from lipari pumice. J. Chem. Technol. Biotechnol. Chem. Technol. 1983, 33, 421–427. [Google Scholar] [CrossRef]
- Stafin, G.; Grzebielucka, E.C.; Antunes, S.R.M.; Borges, C.P.F.; de Andrade, A.V.C.; Alves, S.A.; Éder Carlos Ferreira de Souza. Synthesis of zeolites from residual diatomite using a microwave-assisted hydrothermal method. Waste Manag. 2021, 126, 853–860. [Google Scholar] [CrossRef]
- Hui, K.; Chao, C.; Kot, S. Removal of mixed heavy metal ions in wastewater by zeolite 4A and residual products from recycled coal fly ash. J. Hazard. Mater. 2005, 127, 89–101. [Google Scholar] [CrossRef] [PubMed]
- Christidis, G.; Paspaliaris, I.; Kontopoulos, A. Zeolitisation of perlite fines: Mineralogical characteristics of the end products and mobilization of chemical elements. Appl. Clay Sci. 1999, 15, 305–324. [Google Scholar] [CrossRef]
- Schlögl, S.; Diendorfer, P.; Baldermann, A.; Vollprecht, D. Use of industrial residues for heavy metals immobilization in contaminated site remediation: A brief review. Int. J. Environ. Sci. Technol. 2022. [Google Scholar] [CrossRef]
- Antonucci, P.; Crisafulli, M.; Giordano, N.; Burriesci, N. Zeolitization of perlite. Mater. Lett. 1985, 3, 302–307. [Google Scholar] [CrossRef]
- Christidis, G.; Galani, K.; Markopoulous, T. Synthesis of high added value zeolites from perlite and expanded perlite waste materials. In Industrial Minerals and Extractive Industry Geology; The Geological Society of London: London, UK, 2002. [Google Scholar]
- Osacký, M.; Pálková, H.; Hudec, P.; Czímerová, A.; Galusková, D.; Vítková, M. Effect of alkaline synthesis conditions on mineralogy, chemistry and surface properties of phillipsite, P and X zeolitic materials prepared from fine powdered perlite by-product. Microporous Mesoporous Mater. 2020, 294, 109852. [Google Scholar] [CrossRef]
- Christidis, G.; Papantoni, H. Synthesis of FAU Type Zeolite Y from Natural Raw Materials: Hydrothermal SiO2-Sinter and Perlite Glass. Open Mineral. J. 2008, 2, 1–5. [Google Scholar] [CrossRef]
- Baerlocher, C.; McCusker, L.B. Database of Zeolite Structures. Available online: http://www.iza-structure.org/databases/ (accessed on 30 January 2022).
- Roulia, M.; Mavromoustakos, T.; Vassiliadis, A.A.; Mali, G. Distinctive Spectral and Microscopic Features for Characterizing the Three-Dimensional Local Aluminosilicate Structure of Perlites. J. Phys. Chem. C 2014, 118, 26649–26658. [Google Scholar] [CrossRef]
- Giordano, N.; Recupero, V.; Pino, L.; Bart, J. Zeolitization of perlite. A prospective route. Ind. Miner. 1987, 9, 83–95. [Google Scholar]
- Baldermann, A.; Mittermayr, F.; Bernasconi, S.M.; Dietzel, M.; Grengg, C.; Hippler, D.; Kluge, T.; Leis, A.; Lin, K.; Wang, X.; et al. Fracture dolomite as an archive of continental palaeo-environmental conditions. Commun. Earth Environ. 2020, 1, 35. [Google Scholar] [CrossRef]
- Baldermann, A.; Dietzel, M.; Reinprecht, V. Chemical weathering and progressing alteration as possible controlling factors for creeping landslides. Sci. Total Environ. 2021, 778, 146300. [Google Scholar] [CrossRef]
- Ma, B.; Lothenbach, B. Synthesis, characterization, and thermodynamic study of selected Na-based zeolites. Cem. Concr. Res. 2020, 135, 106111. [Google Scholar] [CrossRef]
- Fan, W.; Li, R.; Ma, J.; Fan, B.; Dou, T.; Cao, J. Crystallization mechanism study on ZSM-48 in the system Na2O-Al2O3-SiO2-H2N(CH2)6NH2. Microporous Mater. 1997, 8, 131–140. [Google Scholar] [CrossRef]
- Sadrara, M.; Khanmohammadi Khorrami, M.; Towfighi Darian, J.; Bagheri Garmarudi, A. Rapid determination and classification of zeolites based on Si/Al ratio using FTIR spectroscopy and chemometrics. Infrared Phys. Technol. 2021, 116, 103797. [Google Scholar] [CrossRef]
- Król, M.; Mozgawa, W.; Morawska, J.; Pichór, W. Spectroscopic investigation of hydrothermally synthesized zeolites from expanded perlite. Microporous Mesoporous Mater. 2014, 196, 216–222. [Google Scholar] [CrossRef]
- Król, M.; Morawska, J.; Mozgawa, W. Low-temperature synthesis of zeolite from perlite waste—Part I: Review of methods and phase compositions of resulting products. Mater. Sci.-Pol. 2014, 32, 503–513. [Google Scholar] [CrossRef] [Green Version]
- Auepattana-aumrung, C.; Suriye, K.; Jongsomjit, B.; Panpranot, J.; Praserthdam, P. Inhibition effect of Na+ form in ZSM-5 zeolite on hydrogen transfer reaction via 1-butene cracking. Catal. Today 2020, 358, 237–245. [Google Scholar] [CrossRef]
- Wahono, S.K.; Stalin, J.; Addai-Mensah, J.; Skinner, W.; Vinu, A.; Vasilev, K. Physico-chemical modification of natural mordenite-clinoptilolite zeolites and their enhanced CO2 adsorption capacity. Microporous Mesoporous Mater. 2020, 294, 109871. [Google Scholar] [CrossRef]
- Dziedzicka, A.; Sulikowski, B.; Ruggiero-Mikołajczyk, M. Catalytic and physicochemical properties of modified natural clinoptilolite. Catal. Today 2016, 259, 50–58. [Google Scholar] [CrossRef]
- Oleksiak, M.; Rimer, J.D. Synthesis of zeolites in the absence of organic structure-directing agents: Factors governing crystal selection and polymorphism. Rev. Chem. Eng. 2014, 30, 1–49. [Google Scholar] [CrossRef]
- Muraoka, K.; Sada, Y.; Miyazaki, D.; Chaikittisilp, W.; Okubo, T. Linking synthesis and structure descriptors from a large collection of synthetic records of zeolite materials. Nat. Commun. 2019, 10, 4459. [Google Scholar] [CrossRef] [Green Version]
- Cubillas, P.; Stevens, S.M.; Blake, N.; Umemura, A.; Chong, C.B.; Terasaki, O.; Anderson, M.W. AFM and HRSEM Invesitigation of Zeolite A Crystal Growth. Part 1: In the Absence of Organic Additives. J. Phys. Chem. C 2011, 115, 12567–12574. [Google Scholar] [CrossRef]
- Auerbach, S.M.; Carrado, K.A.; Dutta, P.K. Handbook of Zeolite Science and Technology; M. Dekker: New York, NY, USA, 2003. [Google Scholar]
- Alaei Shahmirzadi, M.A.; Hosseini, S.S.; Luo, J.; Ortiz, I. Significance, evolution and recent advances in adsorption technology, materials and processes for desalination, water softening and salt removal. J. Environ. Manag. 2018, 215, 324–344. [Google Scholar] [CrossRef] [PubMed]
- Fernández-Reyes, B.; Morales-Jiménez, S.; Sánchez-Marrero, G.; Muñoz-Senmache, J.C.; Hernández-Maldonado, A.J. Hierarchical three-dimensionally ordered mesoporous carbon (3DOm) zeolite composites for the adsorption of Contaminants of emerging concern. J. Hazard. Mater. Lett. 2021, 2, 100017. [Google Scholar] [CrossRef]
- Motsi, T.; Rowson, N.A.; Simmons, M. Adsorption of heavy metals from acid mine drainage by natural zeolite. Int. J. Miner. Process. 2009, 92, 42–48. [Google Scholar] [CrossRef]
- Amarasinghe, B.; Williams, R.A. Tea waste as a low cost adsorbent for the removal of Cu and Pb from wastewater. Chem. Eng. J. 2007, 132, 299–309. [Google Scholar] [CrossRef]
- Khanmohammadi, H.; Bayati, B.; Rahbar- Shahrouzi, J.; Babaluo, A.A.; Ghorbani, A. Molecular simulation of the ion exchange behavior of Cu2+, Cd2+ and Pb2+ ions on different zeolites exchanged with sodium. J. Environ. Chem. Eng. 2019, 7, 103040. [Google Scholar] [CrossRef]
- Han, R.; Zou, W.; Wang, Y.; Zhu, L. Removal of uranium(VI) from aqueous solutions by manganese oxide coated zeolite: Discussion of adsorption isotherms and pH effect. J. Environ. Radioact. 2007, 93, 127–143. [Google Scholar] [CrossRef]
- Nightingale, E.R. Phenomenological Theory of Ion Solvation. Effective Radii of Hydrated Ions. J. Phys. Chem. 1959, 63, 1381–1387. [Google Scholar] [CrossRef]
- Marcus, Y. Thermodynamics of solvation of ions. Part 5.—Gibbs free energy of hydration at 298.15 K. J. Chem. Soc. Faraday Trans. 1991, 87, 2995–2999. [Google Scholar] [CrossRef]
- Noli, F.; Kapnisti, M.; Buema, G.; Harja, M. Retention of barium and europium radionuclides from aqueous solutions on ash-based sorbents by application of radiochemical techniques. Appl. Radiat. Isot. 2016, 116, 102–109. [Google Scholar] [CrossRef]
- Álvarez Ayuso, E.; García-Sánchez, A.; Querol, X. Purification of metal electroplating waste waters using zeolites. Water Res. 2003, 37, 4855–4862. [Google Scholar] [CrossRef] [PubMed]
- Izidoro, J.D.C.; Fungaro, D.A.; Abbott, J.E.; Wang, S. Synthesis of zeolites X and A from fly ashes for cadmium and zinc removal from aqueous solutions in single and binary ion systems. Fuel 2013, 103, 827–834. [Google Scholar] [CrossRef]


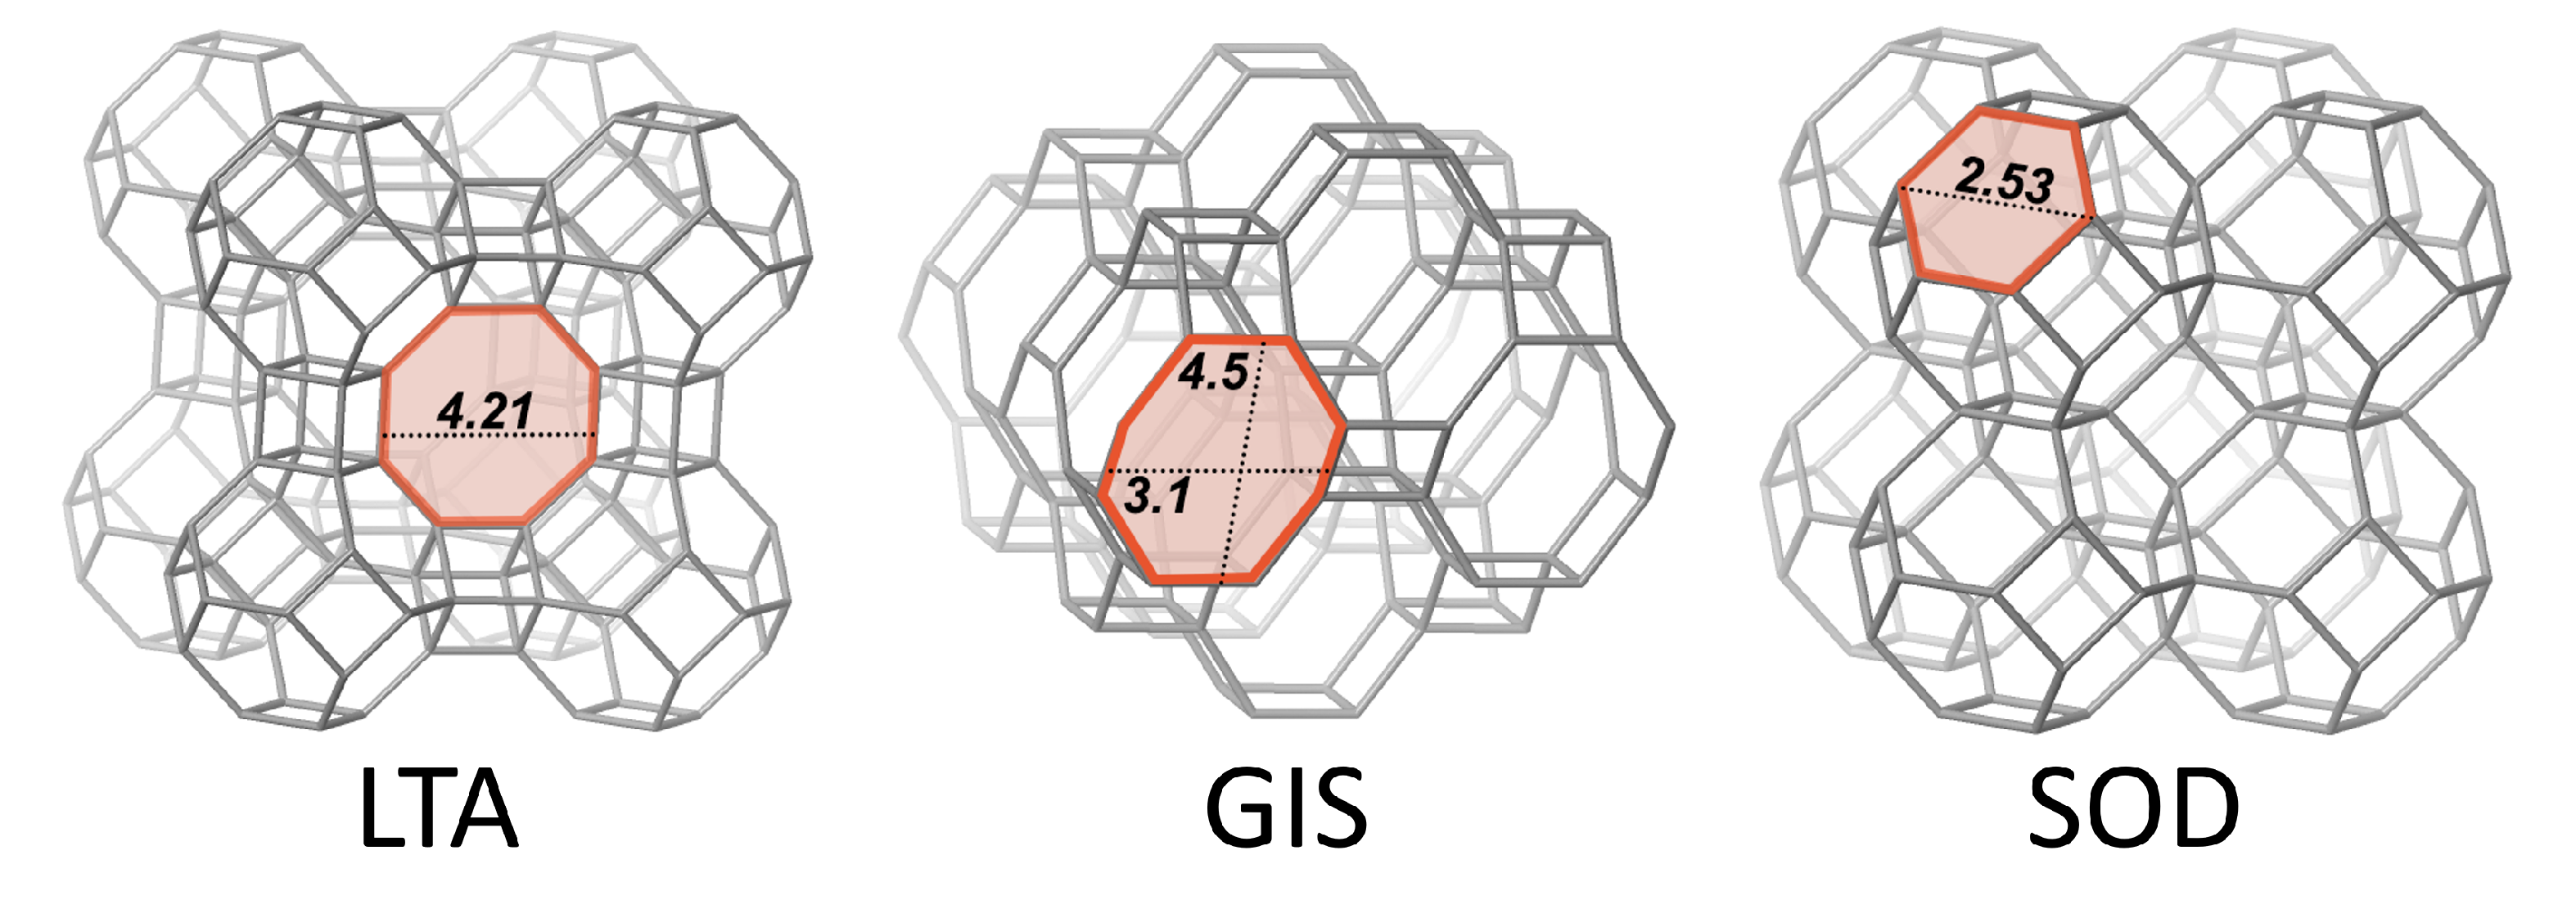
| Framework | CBU’s | Type Material | This Work | Framework Composition |
|---|---|---|---|---|
| LTA | d4r, sod, lta | Linde Type A | Zeolite A | [Al12Si12O48]8 |
| GIS | gis | Gismondine | Na-P1 | [Al6Si10O32] |
| SOD | sod | Sodalite | Hydro(xy)sodalite | [Al6Si6O24] |
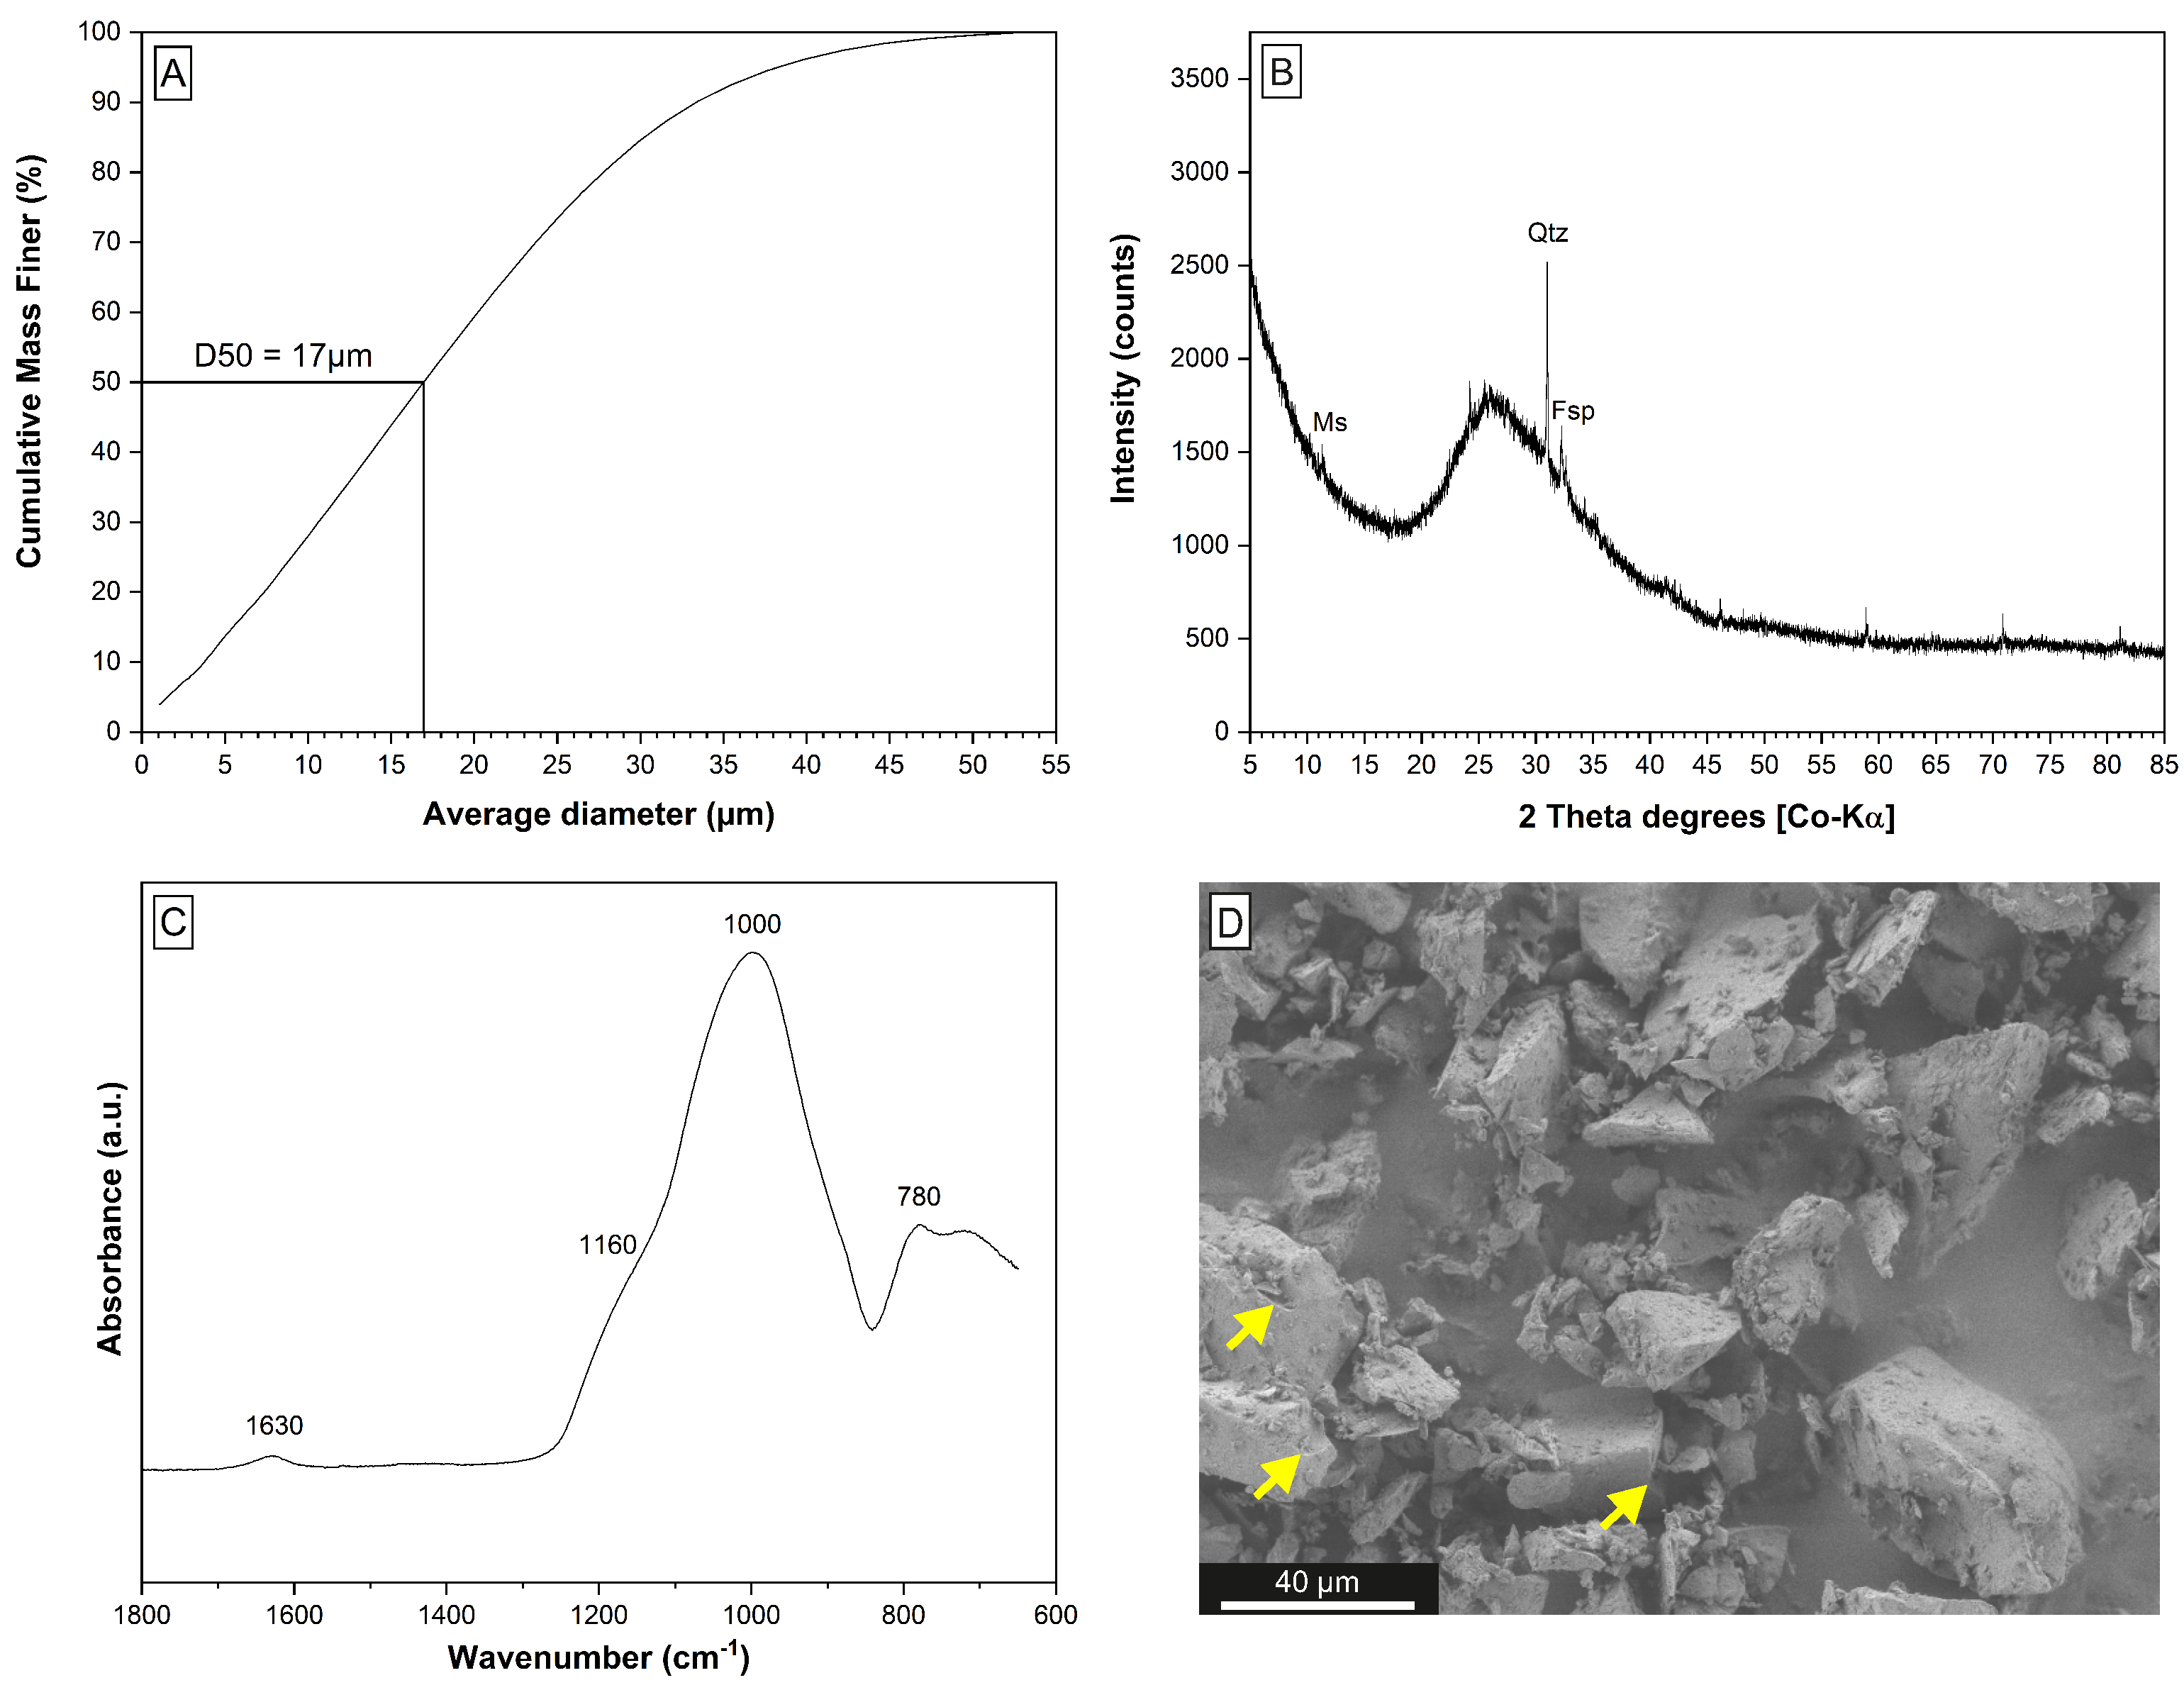
| Na2O | K2O | CaO | MgO | Fe2O3 | Al2O3 | SiO2 | P2O5 | LOI | SUM |
|---|---|---|---|---|---|---|---|---|---|
| 3.4 | 3.9 | 0.7 | <0.1 | 1.4 | 14.1 | 72.2 | 0.1 | 4.2 | 99.9 |
| Sample | c(NaOH) | Si:Al | Na:Al | Time | Temp. | Siaq | Alaq | Main | Silicates |
|---|---|---|---|---|---|---|---|---|---|
| (mol/L) | (mol) | (mol) | (h) | (°C) | % | % | Phase | ||
| E1 | 2 | 4.3 | 7.6 | 24 | 100 | 60.8 | 1.0 | GIS | Qtz,Ms |
| E2 | 2 | 4.3 | 7.5 | 24 | 100 | 53.4 | 0.9 | GIS | Qtz,Ms |
| E3 | 2 | 4.3 | 7.6 | 24 | 100 | 67.4 | 1.0 | GIS | Qtz,Ms |
| E4 | 5 | 4.3 | 18.3 | 24 | 100 | 73.3 | 3.5 | SOD | Qtz,Ms |
| E5 | 5 | 4.3 | 18.4 | 24 | 100 | 67.5 | 3.3 | SOD | Qtz,Ms |
| E6 | 5 | 4.3 | 18.4 | 24 | 100 | 77.2 | 3.9 | SOD | Qtz,Ms |
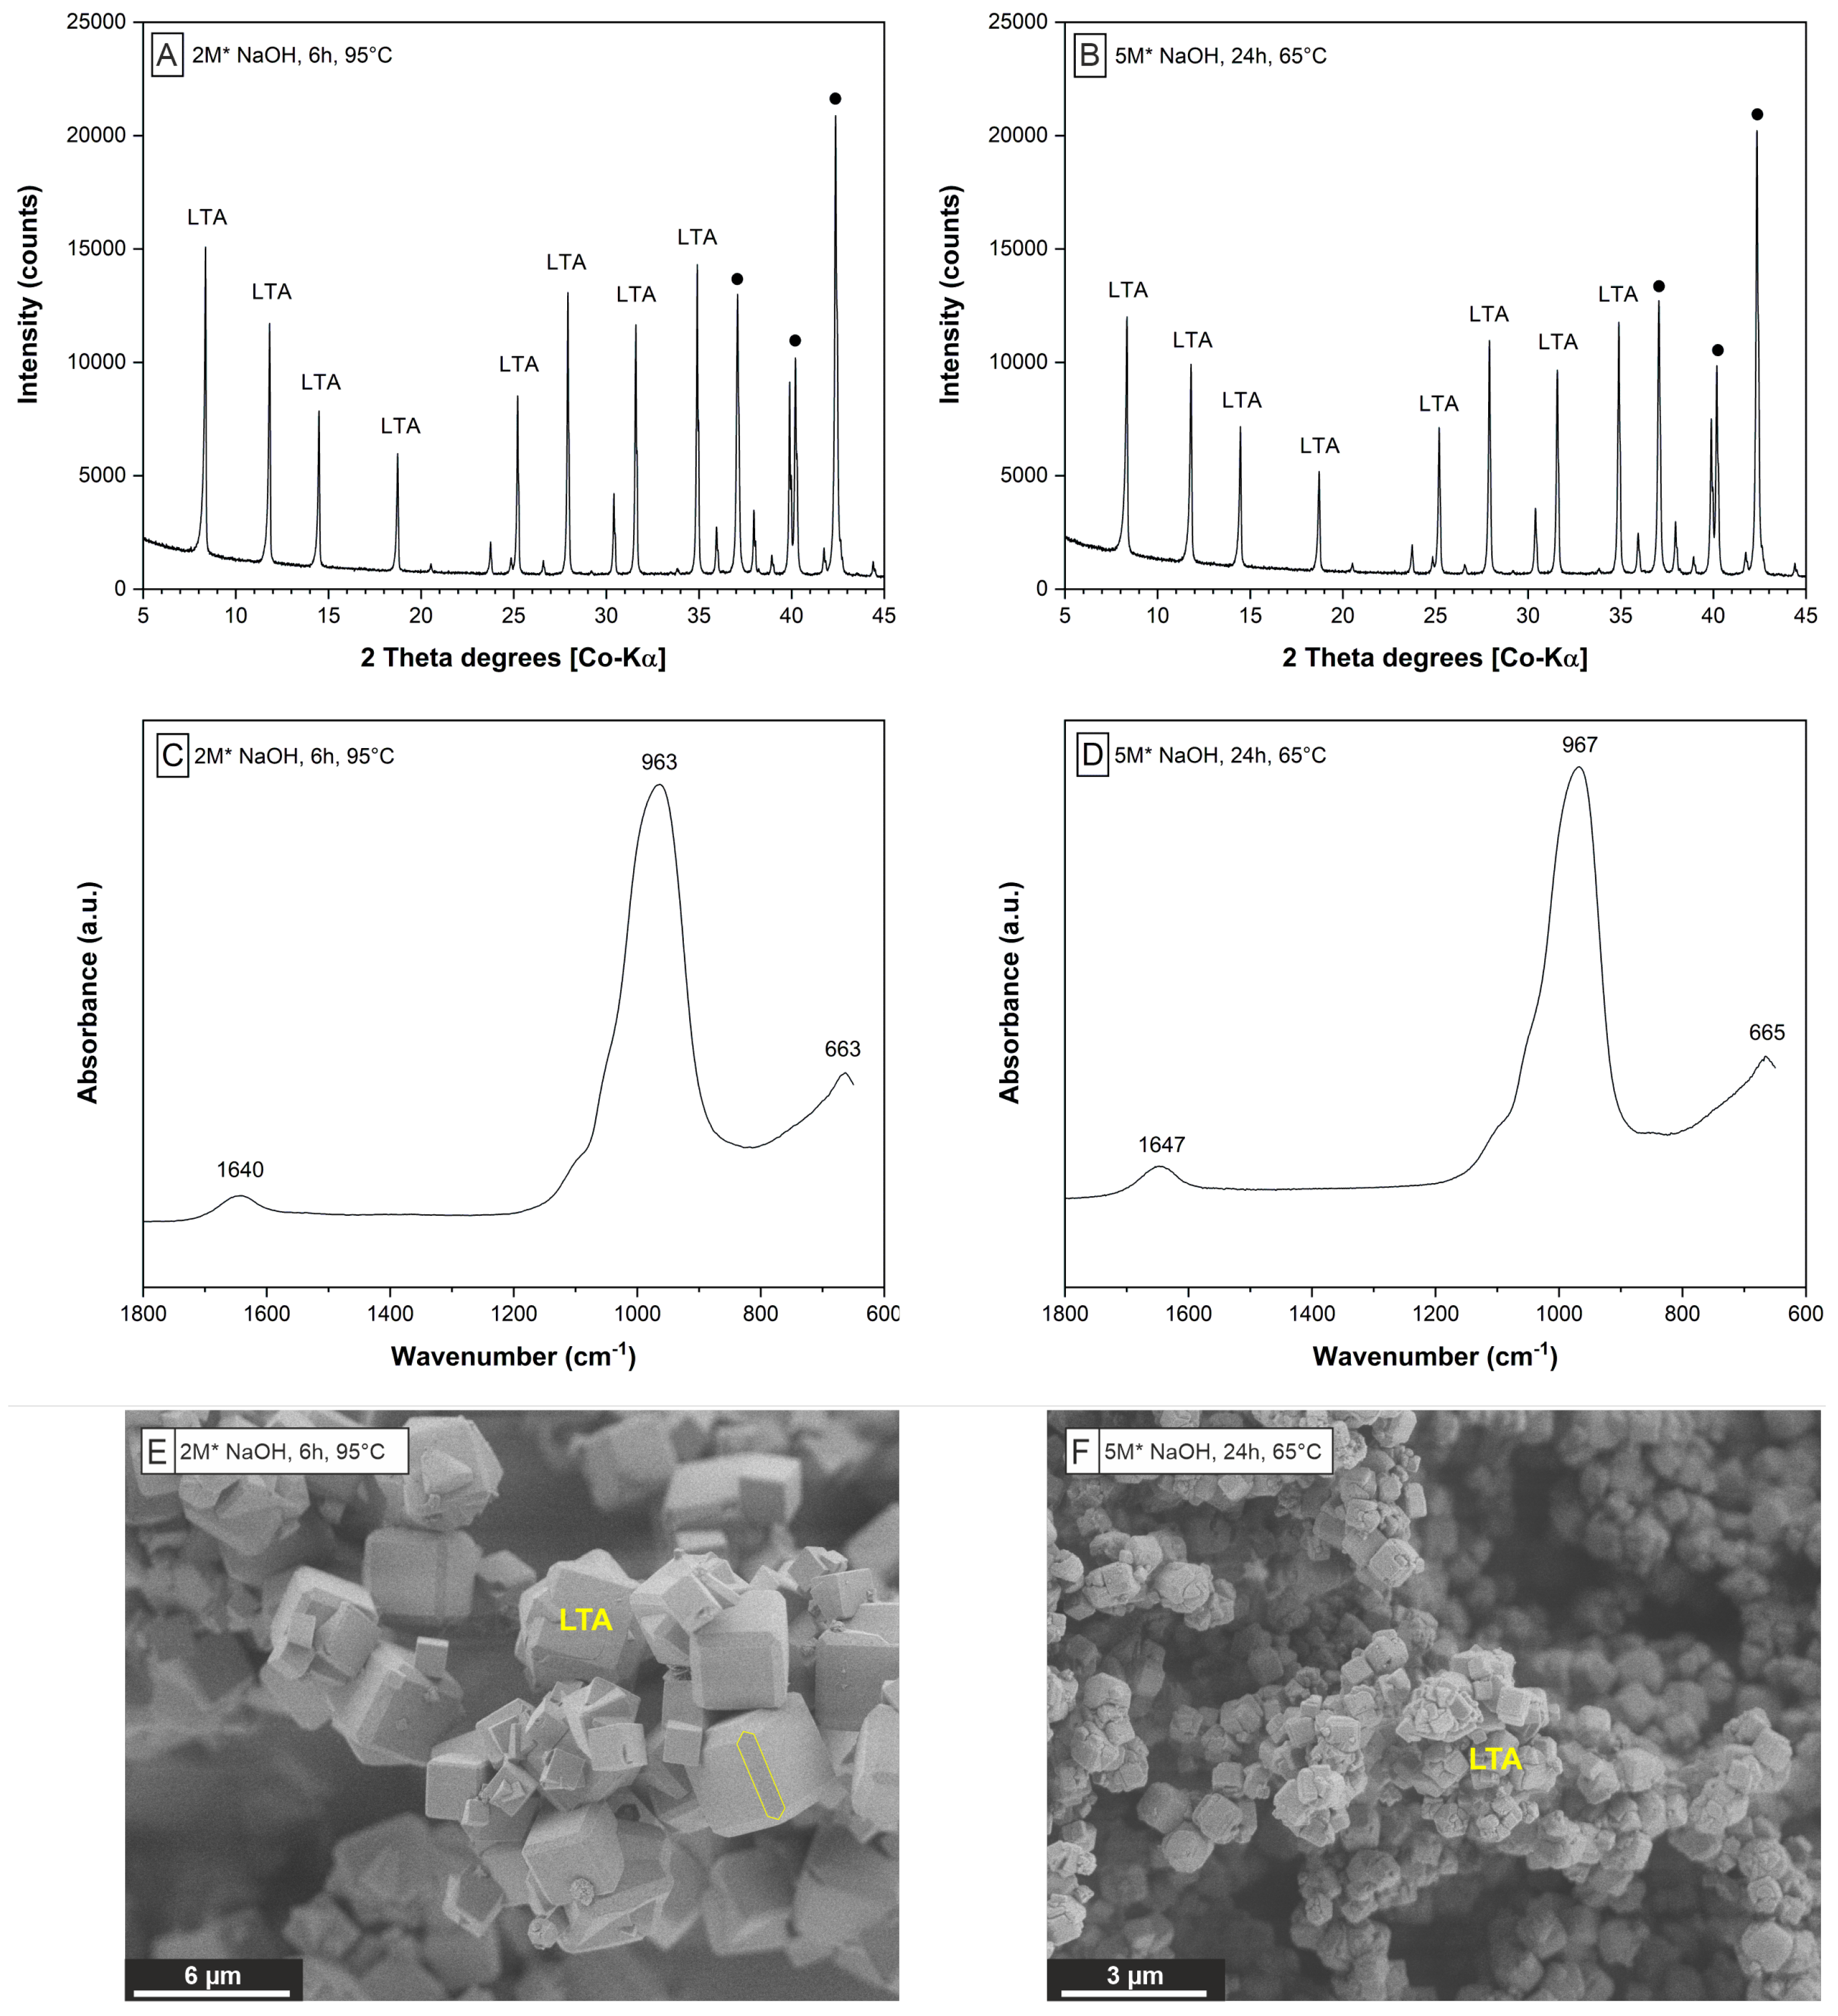
| Sample | Si:Al | Na:Al | Time | Temp. | Main | Impurities | ||
|---|---|---|---|---|---|---|---|---|
| (mol) | (mol) | (h) | (°C) | % | % | Phase | ||
| S1 | 1.2 | 4.4 | 6 | 95 | 87.4 | 98.7 | LTA | FAU |
| S2 | 0.7 | 3.1 | 6 | 95 | 99.4 | 79.6 | LTA | - |
| S3 | 1.1 | 4.2 | 24 | 95 | 96.7 | 97.0 | LTA | GIS |
| S4 | 0.9 | 5.7 | 24 | 65 | 96.5 | 94.5 | LTA | - |
| S5 | 0.8 | 5.4 | 6 | 95 | 97.0 | 93.9 | LTA | SOD |
| S6 | 1.0 | 6.2 | 24 | 95 | 93.9 | 98.0 | SOD | - |
| Adsorbent | Q (mg/g) | Operating Conditions | Ref. | ||||
|---|---|---|---|---|---|---|---|
| Ci (mg/L) | Time (h) | Temp. (°C) | (Optimum) pH | Dosage (g/mL) | |||
| commercial zeolite 4A | Ba: 309.0 Sr: 205.0 | 41–3433 26–2191 | 14 | 25 | 8.2–11.1 | 0.0075 | [5] |
| mesoporous zeolite LTA | Ca: 55.7 Mg: 9.2 | 160 97 | 0.7 | 35 | – | 0.001 | [24] * |
| LTA from alum. sludge | Ca: 65.5 | 99 | 72 | 30 | 7.2 | 0.003 | [26] * |
| zeolite A from kaolin | Cd: 71.4 Cu: 41.3 Pb: 182.3 Ni: 24.7 Zn: 28.8 | 100–400 | 0.5–1 | 25 | 7.5 | 0.008 | [30] |
| zeolite A from fly ash | Co: 13.5 Cu: 49.9 Cr: 41.6 Ni: 8.8 Zn: 27.0 | 300 | 4 | 25 | 3.0 | 0.005 | [33] * |
| zeolite A from fly ash | Cd: 185.1 Zn: 219.6 | 1121–3372 654–1961 | 24 | RT | 6.6–6.8 | 0.01 | [67] |
| Na-P1 from fly ash | Ni: 20.1 Zn: 32.6 | 10–200 | 6 | 22 | 6.0 | 0.0025 | [66] |
| Hydroxysodalite from fly ash | Pb: 153.0 | 100–1000 | 6 | 25 | 6.0 | 0.003 | [18] |
| zeolite Z90-4 from ash | Ba: 119.0 | 50–1000 | 0.5 | 50 | 4.0–5.0 | 0.005 | [65] |
| zeolite Z90-15 from ash | Ba: 117.7 | 50–1000 | 0.5 | 50 | 4.0–5.0 | 0.005 | [65] |
| natural Clinoptilolite | Ni: 2.0 Zn: 3.5 | 10–200 | 6 | 22 | 6.0 | 0.01 | [66] |
| S2 zeolite LTA | Ca: 40.4 Mg: 6.4 | 84 14 | 24 | 25 | 7.8 | 0.002 | this work * |
| S2 zeolite LTA | Ca: 15.3 Mg: 1.0 Ba: 188.3 Zn: 70.0 | 171 103 616 297 | 24 | 25 | 6.0 | 0.002 | this work * |
| E2 zeolite GIS | Ca: 10.5 Mg: 4.6 Ba: 257.4 Zn: 24.5 | 171 103 616 297 | 24 | 25 | 6.0 | 0.002 | this work * |
| E4 zeolite SOD | Ca: 0.0 Mg: 0.5 Ba: 48.9 Zn: 32.6 | 171 103 616 297 | 24 | 25 | 6.0 | 0.002 | this work * |
Publisher’s Note: MDPI stays neutral with regard to jurisdictional claims in published maps and institutional affiliations. |
© 2022 by the authors. Licensee MDPI, Basel, Switzerland. This article is an open access article distributed under the terms and conditions of the Creative Commons Attribution (CC BY) license (https://creativecommons.org/licenses/by/4.0/).
Share and Cite
Painer, F.; Baldermann, A.; Gallien, F.; Eichinger, S.; Steindl, F.; Dohrmann, R.; Dietzel, M. Synthesis of Zeolites from Fine-Grained Perlite and Their Application as Sorbents. Materials 2022, 15, 4474. https://doi.org/10.3390/ma15134474
Painer F, Baldermann A, Gallien F, Eichinger S, Steindl F, Dohrmann R, Dietzel M. Synthesis of Zeolites from Fine-Grained Perlite and Their Application as Sorbents. Materials. 2022; 15(13):4474. https://doi.org/10.3390/ma15134474
Chicago/Turabian StylePainer, Florian, Andre Baldermann, Florian Gallien, Stefanie Eichinger, Florian Steindl, Reiner Dohrmann, and Martin Dietzel. 2022. "Synthesis of Zeolites from Fine-Grained Perlite and Their Application as Sorbents" Materials 15, no. 13: 4474. https://doi.org/10.3390/ma15134474
APA StylePainer, F., Baldermann, A., Gallien, F., Eichinger, S., Steindl, F., Dohrmann, R., & Dietzel, M. (2022). Synthesis of Zeolites from Fine-Grained Perlite and Their Application as Sorbents. Materials, 15(13), 4474. https://doi.org/10.3390/ma15134474