Article

Relationship between Emotional Intelligence and Optimism According to Gender and Social Context (Urban vs. Rural)

by
David Molero
1,
Óscar Gavín-Chocano
1,
Esperanza Vargas-Cuevas
1 and
Inmaculada García-Martínez
2,*
1
Department of Pedagogy, University of Jaén, 23071 Jaén, Spain
2
Department of Didactics and Scholl Organization, University of Granada, 18071 Jaén, Spain
*
Author to whom correspondence should be addressed.
Soc. Sci. 2022, 11(7), 268; https://doi.org/10.3390/socsci11070268
Submission received: 6 February 2022 / Revised: 15 June 2022 / Accepted: 17 June 2022 / Published: 22 June 2022

Abstract

:
The aim of the present study was to evaluate the influence of Emotional Intelligence on optimistic–pessimistic attitudes in a sample of 177 people from the Autonomous Community of Andalusia (Spain). The sample consisted of 102 women (57.60%) and 75 men (42.40%), who live in different localities depending on the number of residents (urban and rural context). The instruments used in the study were: The Life Orientation Test Revised (LOT-R), Emotional Quotient Inventory (EQi-C), and Wong–Law Emotional Intelligence Scale (WLEIS-S). The results indicated that Emotional Intelligence was positively related to optimism and negatively related to pessimism (p < 0.01). In addition, pessimism was found to be significantly related to the rural context, but not to the urban context. The multigroup Structural Equations model was developed for the gender variable, and it had good structural validity (χ2 = 96.485; RMSEA = 0.056; GFI = 0.901; CFI = 0.900; IFI = 0.907), which was greater for the female gender. The practical consequences of this study help to understand the usefulness of EQ on optimism–pessimism as an attribute between urban vs. rural areas and the effect of living in socio-culturally different environments.

1. Introduction

Over the past few years, socio-economic planning efforts have focused on the development of urban areas rather than rural ones, which provokes an alarming impact in terms of the daily routines and emotional well-being of the population living in these rural areas. The rural areas have become increasingly reliant on large cities, posing challenges in terms of access to resources and services.
The urban context is defined as the set of characteristics linked to a locality or region. In other words, it refers mainly to the presence of a high demographic density, an industrial economy, and a service economy (more than 10,000 residents); a rural area is defined as the set of characteristics associated with a locality or region, such as a low demographic density, and the development of primary sector economic activities (less than 10,000 residents). The European Union and the Organisation for Economic Co-operation and Development (OECD) take this into account when defining urban and rural areas, with a maximum population density of 150 inhabitants/km2, by combining the population rate to classify the degree of urbanisation by region.
In this regard, there are many studies that have shown that the backgrounds in which individuals live generate significant differences in their results on standardised tests about emotional features (Alonso-Ferres et al. 2018; López-Gullón et al. 2017; Sanín-Posada et al. 2018).
These conditions are related to the characterisation of a cognitive process through which the individual determines the attributes of their identity, related to the context in which they distinguish themselves from others (Weiner 2000). This process allows for an evaluation of the alternatives for and consequences of actions, promoting emotional reactions according to social and environmental cultural expectations (Anderson and Weiner 1992).
Specifically, there are studies that have analysed the influence of socio-demographic characteristics on psychosocial factors such as emotional intelligence. An example of this is the paper written by Harrod and Scheer (2005), who analysed the EI level of 200 teenagers according to gender, age, location, and residence. They found that their location had no influence on the emotional development of the teenagers. Similar results were found in the study of Shanwal et al. (2006), where location reported no significant differences in EI, but other factors such as family type or parental education had. Moreover, other studies have found a connection between background and emotional intelligence. In particular, the study conducted by Herrera et al. (2015) with 1451 schoolchildren found that the children’s background affected all the dimensions of their social-emotional intelligence. This connection has been found in other studies with students (Herrera et al. 2017; Nayak 2014).
In the last few years, EI has positioned itself as a necessary mechanism underlying the identification, management, and the use of emotional information in adaptive processes, which can promote positive behaviours (Salovey et al. 1995). This concept was developed theoretically in 1990, as a personal ability to perceive, understand, and regulate one’s own and others’ emotions adaptively (Mayer et al. 2016; Salovey and Mayer 1990). EI is considered as a multidimensional construct that is related to cognitive and emotional activity in parallel. This fact has led to the emergence of different models to explain EI and that guide its connection to peoples’ performance of everyday activities in different contexts (Alonso-Ferres et al. 2018; Gavín-Chocano and Molero 2019), and models that help to evaluate the types of emotional and intellectual qualities people possess (Extremera et al. 2020).
Nowadays, EI distinguishes between the ability EI model, measured through peak performance tests, and the mixed EI model that is measured through self-report questionnaires (Pérez-González et al. 2007). In relation to the ability model (Mayer and Salovey 1997), it has been noticed that the model is focused on the ability to process information through emotions for adaptive conflict resolution (Fernández-Berrocal et al. 2018). In this case, its relevant description is derived in the understanding of internal processes and the acquisition of emotional competences (Gebler et al. 2020; Mayer et al. 2016; MacCann et al. 2020). A second approach, the mixed model (Bar-On 1997; Petrides and Furnham 2001), combines mental abilities with personality traits. EI is defined as the set of emotional capacities, personal, and interpersonal motivations that affect the form of interaction against external demands and pressures (Petrides et al. 2018). This research adheres to the mixed model, as it is one of the measures that has demonstrated greater theoretical and empirical soundness over the years. Among the most widely accepted assessment instruments in this model is the Emotional Quotient Inventory, or EQ-i (Bar-On 1997). Its abbreviated version is the Emotional Quotient Inventory Short Form EQ-i: S (Parker et al. 2011), from which different adaptations have been made to Spanish for young people: EQ-i: YV (Bar-On and Parker 2000) and EQi-C (López-Zafra et al. 2014).
Another instrument used in this model, which considers EI as a trait, is the Wong and Law Emotional Intelligence Scale WLEIS instrument (Wong and Law 2002), based on the design of Mayer and Salovey (1997). It incorporates the dimension of emotional regulation, designed as a brief measure of EI for use in research within organizations, along with other variables such as a disposition to optimism and job satisfaction (Fiori and Vesely-Maillefer 2018). Thus, it is composed of four dimensions: the appraisal of one’s own emotions, the appraisal of others’ emotions, the use of emotions, and emotional regulation.
According to the two models proposed, this study is interested in the differential effect between the EI assessment instruments (EQi-C and WLEIS-S) and other psychological variables associated with people’s emotional wellbeing (See Figure 1), linked to people’s attitudes about future events, whereas emotional information processing is conditioned according to the background, whether urban or rural, being fundamental in interpersonal relations and ways of living together (Gómez-Baya et al. 2017).
The complementary use of these instruments will be conditioned by different validation studies of the Emotional Quotient Inventory (EQ-i; Bar-On 1997) and Emotional Quotient Inventory: Young Version (EQ-i: YV; Bar-On and Parker 2000), obtaining incomplete results about the structural validity of the impact of emotional competencies in relation to background (Merino-Soto et al. 2016). According to these studies, a greater perception and emotional regulation is found in a rural context and a greater emotional understanding in an urban context, depending on the availability of resources. However, EI indicators are greater in urban populations (Alonso-Ferres et al. 2018; Herrera et al. 2015). Other studies discovered instrument complementarity (EQi-C and WLEIS-S) when they were linked to other variables, such as dispositional optimism (Gavín-Chocano and Molero 2019).
That is, individuals with high levels of EI will be characterised by their effective use of cognitive and emotional competencies, and it is as a result of this that they will be more optimistic (Carver and Scheier 2014). In contrast, individuals with low levels of EI will be more pessimistic and their emotional growth will be slower (Vizoso-Gómez and Arias-Gundín 2018). That is why variables such as optimism–pessimism are relevant in different studies on the increase of emotional resources as predictors of greater wellbeing and life satisfaction (Gavín-Chocano and Molero 2019; Vera-Villarroel et al. 2017), higher quality of life (Urzúa et al. 2016), and physical and psychological health (Millstein et al. 2019).
From a theoretical perspective, the concepts of optimism–pessimism have been analysed from two different approaches. The first one is called Pessimistic–Optimistic Explanatory Style (Peterson and Seligman 1984). It defines pessimistic behavior as an internal cause or the tendency to explain negative daily circumstances with a generalized effect extensible to all aspects of life, which is stable over time. Additionally, optimistic behavior states that negative events are determined by external causes, in a specific domain, and which are unstable over time (Carver and Scheier 2014). A second approach is defined Dispositional Optimism (Scheier and Carver 1985), or an attitude towards achieving future goals and objectives. It considers that pessimistic people are making the least effort to achieve these goals and it is measured through the Life Orientation Test Revised (LOT-R) developed by Scheier et al. (1994).
However, there have been differences in the measurement of this instrument’s one-dimensionality or two-dimensionality. Some authors, such as Bandeira et al. (2002), Sanin and Salanova-Soria (2016), or Zenger et al. (2013), considered the LOT-R as unidimensional and bipolar, where the optimism and pessimism are two opposite poles of the same construct. Moreover, other authors considered that there were two different dimensions. Some studies, such as the one conducted by Ferrando et al. (2002), found that the LOT-R had a structure with two independent dimensions. Vera-Villarroel et al. (2009) also found that the LOT-R has two dimensions. Similarly, in the Portuguese context, Ribeiro et al. (2012) conducted a study to verify the usefulness of the LOT-R and to determine whether the measure was unidimensional or two-dimensional. Ottati and Noronha (2017) found that the two-dimensional model was more suitable. Gaibor-González and Moreta-Herrera (2020) found a factor structure of the LOT-R, where the two-dimensional solution obtained the best results (Barrientos Oradini et al. 2019).
This study aims to provide relevant information on the incidence of EI in the optimistic vs. pessimistic attitudes in populations depending on their location (rural vs. urban) in the Andalusian Community (Spain). It related these variables through a multigroup structural equation model in relation to gender based on the criteria established in the study by Zenger et al. (2013) on the analysis of the LOT-R in a Colombian sample of 1500 adults from various regions of that country. Through confirmatory factor analysis, they concluded that there are two dimensions of the scale, where optimism and pessimism are seen as independent variables. However, in light of this last point, the following is an essential question that may arise: when is it appropriate to say that a certain model is adequate? Undoubtedly, it would not be easy to answer this question, and it is beyond the general scope of this study. However, two complementary perspectives are proposed to approximate its answer: one related to the elaboration of the model, and the other related to the comparative synergy itself when it comes to exemplifying the contrasted evidence. From this perspective, we start from the hypothesis in favor of developing a model that produces significant increases and allows for better predictions and explanations of the phenomena under study (Ondé-Pérez 2020).
Following the criteria of the European Union and the Organisation for Economic Co-operation and Development (OECD), two contexts have been considered in our study depending on the size of the localities where the study participants live. Localities with less than 10,000 residents are considered a rural context while participants who live in localities with more than 10,000 residents are considered an urban context. Some studies have addressed the influence of context (urban vs. rural) on emotional intelligence (Buitrago 2012; Buitrago et al. 2019).
Therefore, the general objectives of this research are: (a) To determine whether there are significant correlations between the factors of the EI assessment instruments (EQi-C and WLEIS-S) and optimism–pessimism (LOT-R); (b) To establish whether there are significant differences in the dimensions of the instruments considered (EQi-C, WLEIS-S and LOT-R), and the sociodemographic variables age and context; (c) To determine the effects of both the EI (EQi-C and WLEIS-S) and optimism–pessimism (LOT-R) variables and the sociodemographic variable gender, through a multigroup structural equation model.

2. Materials and Methods

This descriptive study is based on a non-experimental, quantitative, cross-sectional, and correlational analysis. Based on these criteria, longitudinal and comparative measures have been established and the reliability of the scores was calculated through the Cronbach’s alpha coefficient and Omega coefficient (McDonald 1999), which is also known as Jöreskog’s Rho (Stone et al. 2015).

2.1. Sample

Participants were selected non-probabilistically, based on their willingness to participate in the study. There are 177 participants from the Andalusian region (Spain), who live in two types of locations according to the number of their population: towns with less than 10,000 residents (rural context) and towns with more than 10,000 residents (urban context). A value of 88 participants belong to the urban context (49.7%) and 89 to the rural context (50.3%) of the total participants. The distribution of participants (n = 177) by gender is as follows: 102 are women (57.60%), of which 63% belonged to the urban context and 37% to the rural context; and 75 men (42.40%), of which 54% belonged to the urban context and 46% to the rural context. The age range was between 18 and 60 years, with a mean of 25.19 (±8.36), with 63% under 25 years old and 37% over 25 years old. A non-probabilistic convenience sample was developed with the sample obtained from those people who agreed to participate voluntarily.

2.2. Instruments

For the development of the study, three socio-demographic variables were included to collect relevant information according to age, context (rural vs. urban), and gender (men vs. women), with the purpose of analyzing the existence of significant differences according to these variables. The instruments were answered by the subjects who were invited to participate through the Google platform (Google forms, Google LLC).
Life Orientation Test Revised. The Life Orientation Test Revised -LOT-R- in its Spanish version (Remor et al. 2006) was used to assess optimism vs. pessimism. The test has ten items: three statements on optimism (items 1, 4, and 10), three on pessimism (items 3, 7, and 9), and four distractor items (2, 5, 6, and 8), whose scores are not computed. Subjects respond to each statement by indicating their level of agreement according to a seven-point Likert scale ranging from strongly disagree to strongly agree. As a scale that measures the degree of optimism and pessimism, it is estimated that high scores imply greater optimism, while lower scores for pessimism imply greater pessimism. The reliability of the scores in our study for optimism were α = 0.74 and ω = 0.70, and a Cronbach’s alpha value α = 0.69 and Omega coefficient ω = 0.65 for pessimism.
Emotional Quotient Inventory. The EQi-C scale (López-Zafra et al. 2014) was used to assess EI, using the Spanish adaptation of the EQ-i (Bar-On 1997). It is a self-report instrument made up of 28 items on a seven-point Likert scale. It assesses four dimensions: intrapersonal competencies, interpersonal competencies, stress management, and adaptability. The reliability values of the scores for each subscale of the EQi-C in our sample were α = 0.73 and ω = 0.75 for interpersonal, α = 0.77 and ω = 0.66 for adaptability, α = 0.83 and ω = 0.83 for stress management, and intrapersonal α = 0.79 and ω = 0.79.
Law Emotional Intelligence Scale. The Spanish version of the Wong–Law Emotional Intelligence Scale (WLEIS-S) (Extremera et al. 2019), based on the Wong and Law EI Scale (WLEIS) (Wong and Law 2002), was used to assess EI. This instrument consists of 16 items and 4 dimensions: intrapersonal perception (evaluation of one’s own emotions), interpersonal perception (evaluation of others’ emotions), assimilation (use of emotions), and emotional regulation. The scale is a 7-point Likert-type scale (1 to 7 points). In our study, the reliability values of the scores (α and ω) for each variable were: evaluation of own emotions α = 0.83 and ω = 0.77; evaluation of others’ emotions α = 0.68 and ω = 0.63; use of emotions α = 0.86 and ω = 0.73; and for emotional regulation α = 0.81 and ω = 0.74.

2.3. Procedure

Informed consent was obtained from each participant, as well as agreement for the application of the different instruments. The participants were informed of the process to be followed, confidentiality and anonymity of the information collected, all while adhering to personal data protection regulations. Likewise, the ethical standards and guidelines of the Declaration of Helsinki (AMM 2013) were followed. Each of the tests was administered individually through the platform Google® (Google forms, Google LLC, Mountain View Santa Clara, CA, USA).

2.4. Data Analysis

The data were transformed based on their factor loadings to achieve a better fit in each of the tests (Kline 2015). The descriptive statistics, calculation of the reliability of each instrument, and the Cronbach’s alpha and Omega coefficients were obtained by determining the weighted sum of each variable and thus overcoming the limitations that could affect the variance (Domínguez-Lara and Merino-Soto 2015), and the correlation between the scores of each dimension. A rank difference analysis was performed as a function of age and context with the Mann–Whitney U test for difference of means for unrelated samples. Non-parametric tests were used as the assumption of normality is not met in the Kolmogorov–Smirnov test (n > 50 cases), and the effect size was reported. Finally, a multigroup Structural Equation Model (SEM) was developed for gender, with the purpose of showing the existence of significant differences between each of the dimensions of the instruments. A 95% confidence level was used, using IBM SPSS Statistics 25.0 (IBM, Chicago, IL, USA) and AMOS 25, to obtain the results of the tests indicated above.

3. Results

3.1. Relationship between Optimism, Pessimism, and Emotional Intelligence

Table 1 shows the correlation matrix scores (Spearman’s Rho, since it is a non-normal distribution), descriptive statistics (mean and standard deviation), and reliability analysis (Cronbach’s alpha and Omega coefficient), which generally show an adequate level of the reliability of the scores.
The analysis of the dimensions shows a significant relationship between optimism and most of the variables of the EI instruments (WLEIS-S and EQi-C), where the highest correlation is established with the EI variable concerning use of emotions (r(177) = 0.44; p < 0.01). There is also a relationship between pessimism and the EI variables, with the highest correlation found with intrapersonal EI (r(177) = 0.46; p < 0.01). Similarly, there is a significant relationship between the EI variables of the WLEIS-S and EQi-C instruments, evaluation of the emotions of others and interpersonal (r(177) = 0.55; p < 0.01), evaluation of one’s own emotions and intrapersonal (r(177) = 0.51; p < 0.01), the use of emotions, and the intrapersonal (r(177) = 0.39; p < 0.01) and adaptive use of emotions (r(177) = 0.36; p < 0.01) . We highlight the significant inverse relationship between the EQi-C stress management dimension and the rest of the dimensions, with the greatest weight established with emotional regulation (r(177) = −0.53; p < 0.01).

3.2. Differences According to Socio-Demographic Variables

To analyse the differences according to the sociodemographic variable age (<25 years and >25 years), the non-parametric Mann–Whitney U test was used for two independent samples (see Table 2). The results indicated that there were no significant differences in any of the instrument dimensions in relation to age (Z < 2.0; p > 0.05 ns).
To calculate the effect size for this test, we obtained the value of r [r = Z/n]. The effect size is small in all cases (r < 0.2), according to Cohen’s (1988) criteria.
In relation to the sociodemographic variable context (See Table 3), there are no significant differences with the optimism variable (Z < 2.0; p > 0.05 ns). There are no significant differences in the EI dimensions based on context (Z < 2.0; p > 0.05 ns). We found significant differences in pessimism in relation to context (Z = −2.138; p > 0.05 ns); the effect was small in all cases.

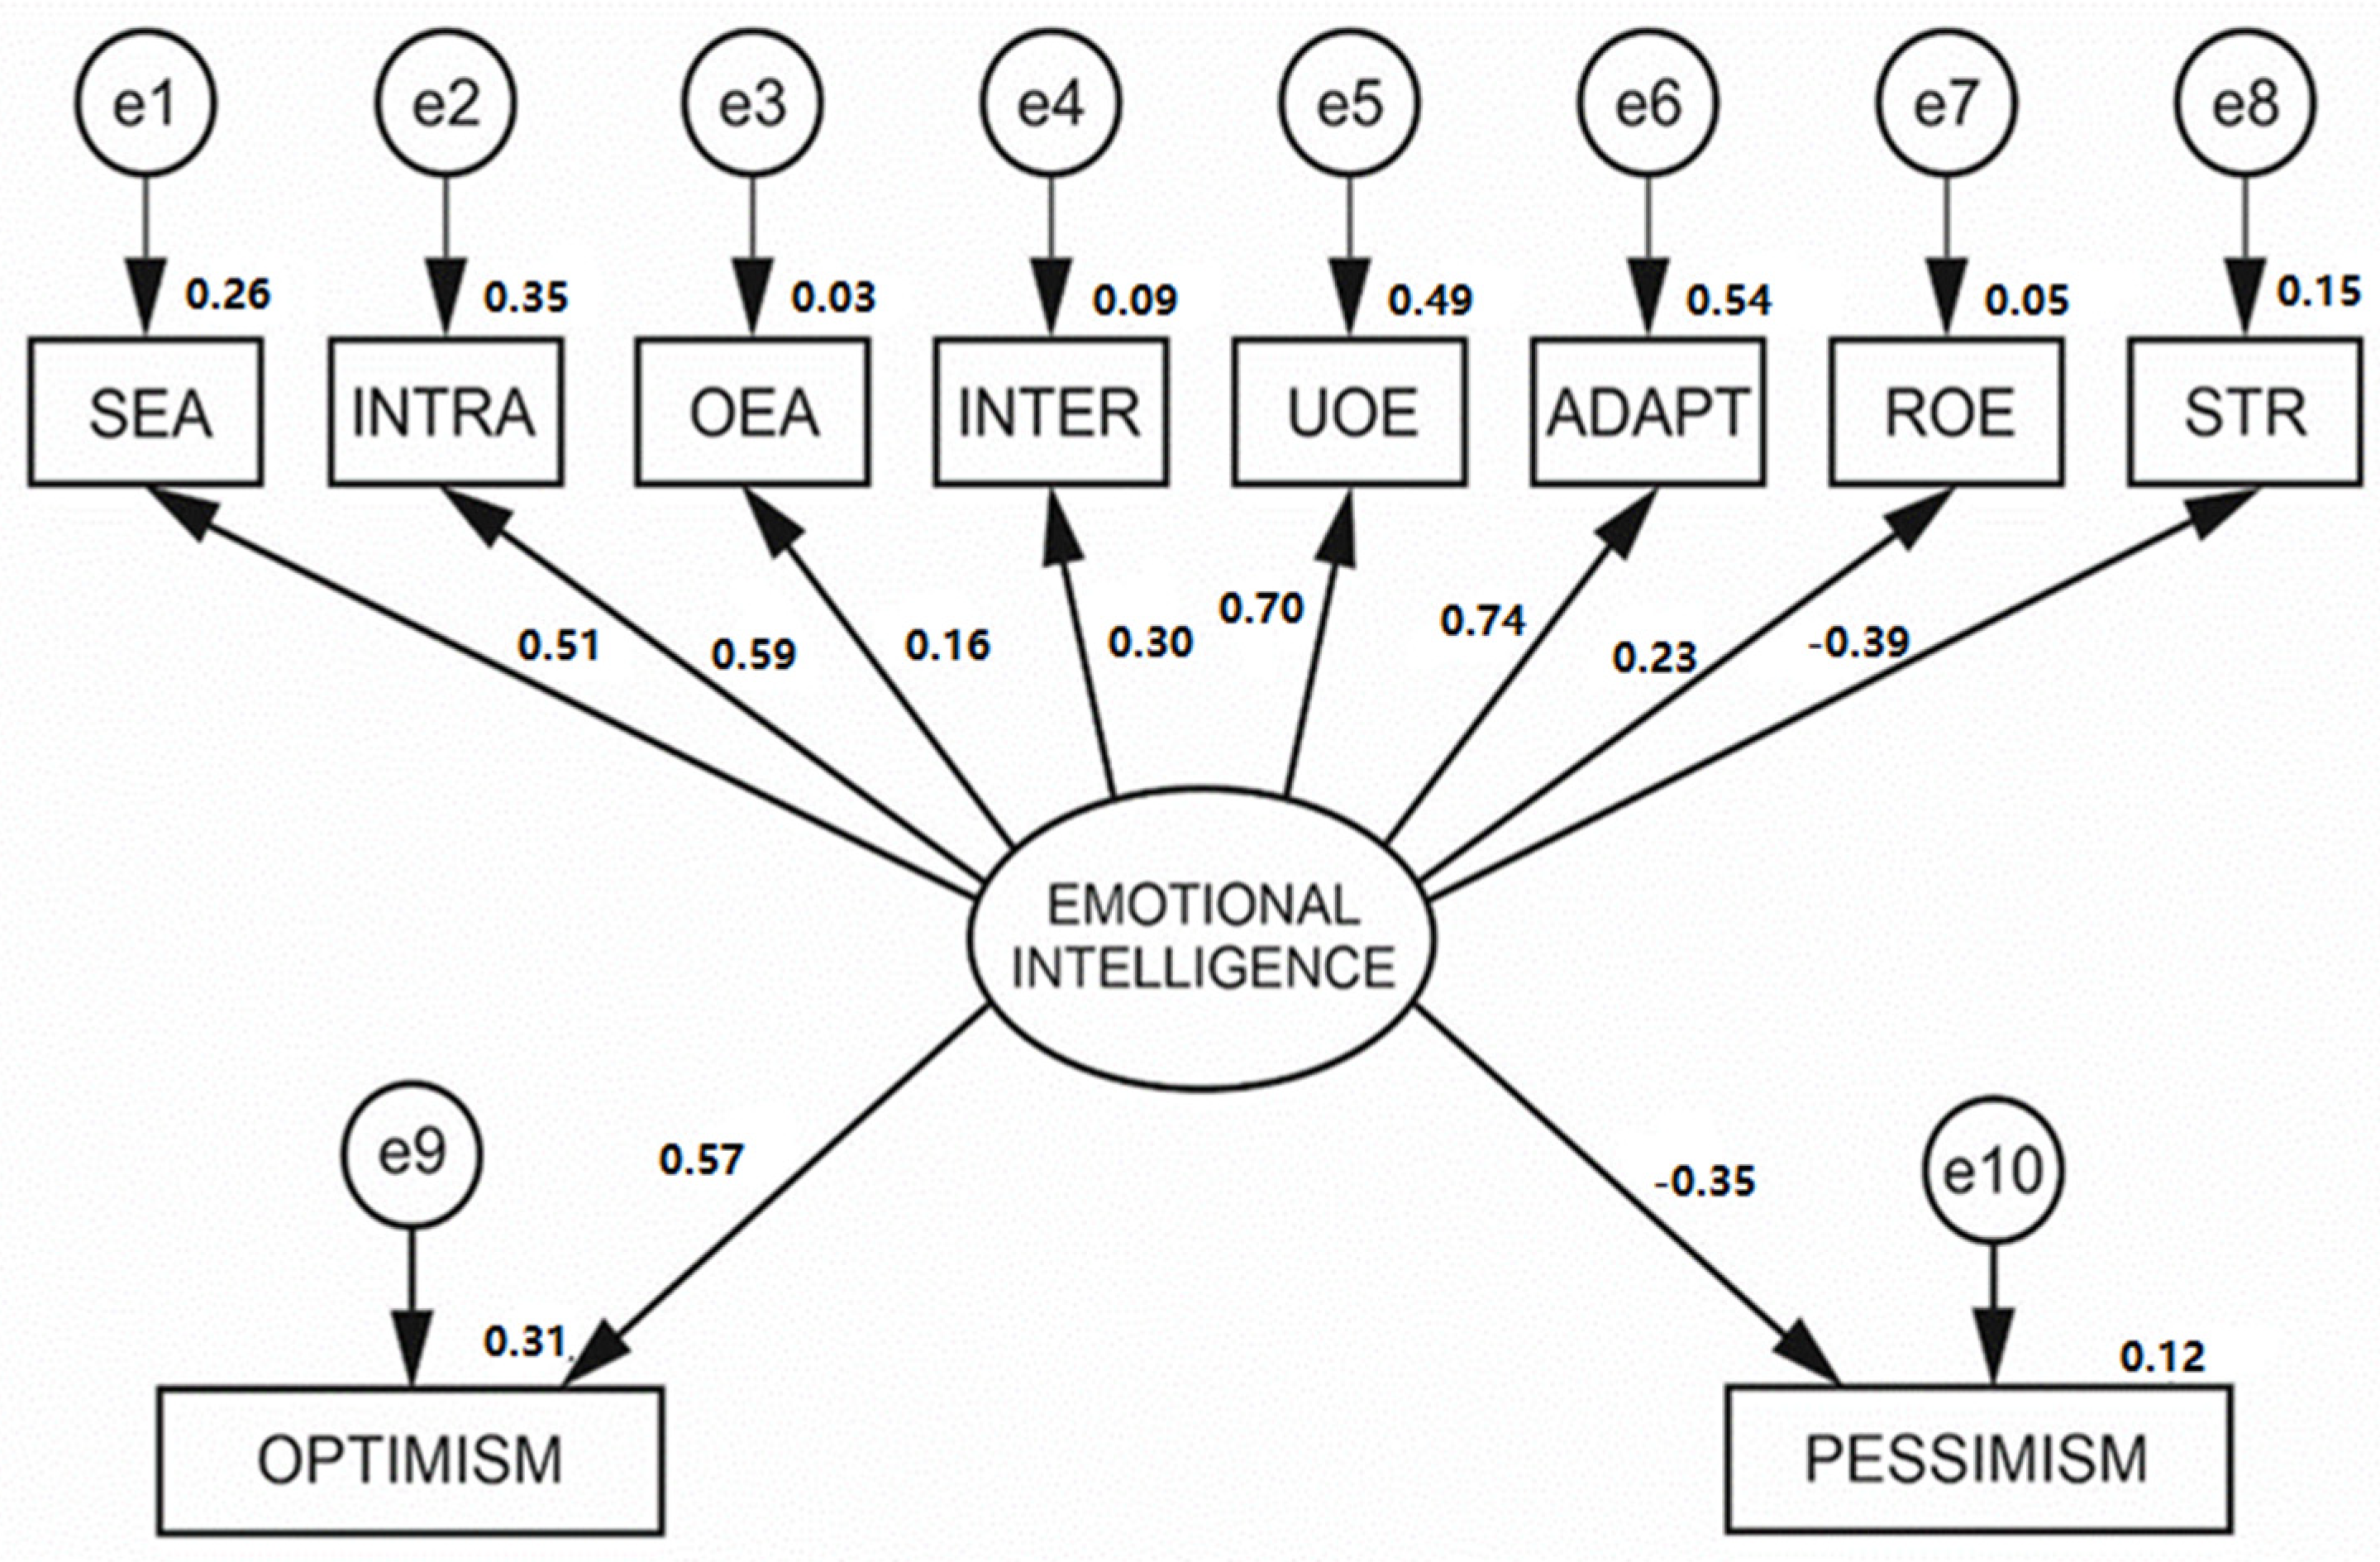
3.3. Multi-Group or Multi-Sample Structural Equation Modelling for Gender

As there is insufficient evidence for a relationship between the sociodemographic variables of age and context (urban and rural), a multigroup model will be required to establish the predictive value of emotional intelligence as an enhancing factor between men and women. Notwithstanding the number of studies on EI, precise knowledge about its prevalence in urban and rural areas is lacking. Despite this, there is a growing scientific interest in delving into sociodemographic knowledge, particularly in rural women, who are often relegated to domestic tasks, because EI would involve skills that lead to better levels of psychological adjustment and emotional wellbeing, the establishment of healthy social relationships, and the disappearance of sexist behavior, which would justify the predictive value of EI between men and women (Fernández-Berrocal and Extremera 2006). Firstly, the validity and fit of the established model was tested. It had a significant associated Chi-square (χ2) value (χ2 = 96.485; gl = 62; p = 0.003). However, this statistic is sensitive to sample size, and it should be interpreted with caution. Therefore, the literature suggests the use of other indicators to assess model fit (Hu and Bentler 1998). Among the most commonly used indicators, we may highlight the goodness-of-fit index (GFI), which has a value of 0.901. It indicates an acceptable model fit, as well as the comparative fit index (CFI) value, which obtains a value of 0.90. The incremental fit index (IFI) value obtains an acceptable value of 0.907.
The Adjusted Goodness of Fit Index (AGFI) has a value above 0.85, which also suggests a good fit. Finally, the root mean squared error of approximation (RMSEA) indicates an anticipated fit to the total population value. In this case, it is less than 0.08, which suggests a good fit (0.056) to the established parameters. Consequently, the model fit is relevant to the data obtained. Figure 2 shows the standardized weights between each of the variables for men, with a significance level of 0.05 (5% probability of error). The indicators with the highest regression weights for the variables below this value are available in Table 4, which corresponds to these EI variables: intrapersonal (4.129), adaptability (3.437), and use of emotions (3.357). Furthermore, there is a relationship between optimism and EI (3.366), while there is negative relationship between pessimism and EI (−2.384).
Figure 3 shows the standardized saturation weights corresponding to women, which establish the indicators with the highest regression weights for the EI variables (see Table 5): intrapersonal (6.138), use of emotions (4.574), and adaptability (2.804). Similarly, it found standardized saturation weights between optimism and EI (4.709), and it is negative between pessimism and EI (−3.368).
We may highlight the negative value for the EI variable Stress Management in both men and women, which is higher in women. Secondly, we discovered that women had higher positive values than men in the variables of intrapersonal EI, emotional evaluation of others, and use of emotions.
In the same way, we found higher values in men than in women in the variables of interpersonal EI and adaptability. Finally, we highlight the relationship between EI and optimism, which is slightly higher for women (Standardized Regression Weight: S.R.W. = 0.58) than for men (S.R.W. = 0.57).

4. Discussion and Conclusions

The main purpose of this study was to determine the influence of EI, using instruments (EQi-C and WLEIS-S), on optimism–pessimism as an attribute in people who reside in different contexts (urban and rural). In general, the findings are consistent with other studies related to the subject (Fiori and Vesely-Maillefer 2018; Gavín-Chocano and Molero 2019; Millstein et al. 2019; Petrides et al. 2018), which show the positive influence of EI on optimism and its negative influence on pessimism. In addition, the findings revealed differences depending on gender.
The reliability of each of the instruments was verified through the calculation of Cronbach’s alpha and subsequently the Omega coefficient. The last one is the most appropriate estimator when there is disparity in the factor loadings of each item (Tau-Equivalence), because it works with the weighted sum of each variable and overcomes the limitations that could affect the proportion of variance (Domínguez-Lara and Merino-Soto 2015; Ventura-León 2019). The CFA showed a better fit of the two-factor model (optimism–pessimism), so it was possible to test the relational value between both dimensions with EI, in agreement with other studies (Gavín-Chocano and Molero 2019; Sanín-Posada et al. 2018).
In terms of the first objective, the results revealed a statistically positive relationship between the optimism–pessimism dimensions. In line with other studies, the complementarity of the two dimensions is linked to the manifest perception of one pole over the other one (Vera-Villarroel et al. 2017). That is, being optimistic or pessimistic will be determined by the way in which each individual perceives what happens and how they develop attitudes to resolve different life events (López-Gullón et al. 2017). Regarding the correlational analysis between the optimism–pessimism variables and each of the EI dimensions, we highlight the positive relationship between some of the EI dimensions and optimism. In addition, there is an inverse relationship in the case of the pessimism variable. We agree with other authors that state the influence of most of the EI dimensions on achieving greater optimism (Fernández-Berrocal et al. 2018) and highlight the inverse relationship of the stress management variable (Vizoso-Gómez and Arias-Gundín 2018). In other words, people may have a positive outlook in some aspects of their lives, and present a negative prospective outlook in other circumstances, either due to external agents beyond the individual’s own control or temporary events (Barrientos Oradini et al. 2019).
In relation to the second objective, namely, to establish the existence of significant differences between the dimensions of the instruments considered and the socio-demographic variables, we found no significant differences between optimism–pessimism and age. Similarly, there were no significant differences between the variables of EI and age, where older people obtained slightly higher scores. Based on previous studies that corroborate these results (Velotti et al. 2017), we note that older people are better able to recognise their emotions and use them adaptively in everyday situations more optimistically (Gavín-Chocano and Molero 2019; Fernández-Berrocal et al. 2018). Regarding the relationship between optimism–pessimism and the context variable (rural vs. urban), a significant relationship was only found with the pessimism variable, which was in favour of people from the rural context. No significant differences were found with any of the EI variables with respect to the context. It is possible that the people in our study who come from rural areas, because of their geographical location, find it more difficult to access more resources and means, and thus their opportunities for development are limited (Alonso-Ferres et al. 2018).
No conclusive evidence has been found on the relationship between sociodemographic variables, age, and context. Finally, a multi-group analysis was carried out through structural equations to check if there were significant differences in each of the variables, which showed the good fit of the model. It revealed an unequal effect of EI on optimism–pessimism according to gender, with women performing slightly better than men. This is consistent with other contributions that indicate higher optimism scores in women in different environmental, cultural, and social contexts (Carver and Scheier 2014; Vizoso-Gómez and Arias-Gundín 2018). Similarly, the results showed differences in EI variables (evaluation of one’s own emotions and intrapersonal) in favour of women. Analysing previous papers that corroborate these data (Fiori and Vesely-Maillefer 2018), we can note that women are able to attend and recognize their emotions better in order to cope with everyday situations more effectively (Fernández-Berrocal et al. 2018). Additionally, the EI variables (use of emotions and adaptability) showed higher values in men than in women. This data could justify the stereotyped value that remains in some contexts, where women suppress and do not show their emotions openly (Alonso-Ferres et al. 2018). Likewise, it may be that the evidence is conditioned by the greater number of women in the sample, which would hinder the subsequent validity. In certain contexts, it is worthwhile to inquire about the significance of social roles between men and women in certain contexts (Gavín-Chocano and Molero 2019).
Finally, the results showed a negative value of the EI dimension stress management in both women and men. It is possible that there is a close relationship between successful coping with stressful situations and optimistic thinking. Conversely, greater dysfunctionality in coping with adverse situations is linked to pessimism, which agrees with other studies that analyse the positive association of optimism with adaptive coping strategies and the negative association with stress management (Millstein et al. 2019; Vera-Villarroel et al. 2017).
Throughout this research, the results obtained have been detailed, based on the bifactor structure (optimism–pessimism) and its relationship with each of the EI variables, by verifying the instrumental value of EI with other factors of an attributive nature. Based on these considerations, this proposal would be of great use, as it would allow us to examine the invariance in the structure of the proposed model. In addition, it considers different questions developed over time about the double dimensionality of the LOT-R instrument. In this regard, a study conducted by Ferrando et al. (2002) with a sample of 735 postgraduate students in Spain found that the instrument had two dimensions. The authors justified the results by considering the sample characteristics, graduate students, and the structure of the items. In the international context, authors such as Vera-Villarroel et al. (2009) have also pointed out the existence of two independent factors. The study was developed with 309 university students whose aim was to analyze the psychometric properties of the instrument. The internal consistency was (α = 0.65) and no significant differences were found in relation to gender. As for the factor analysis, the results indicated a two-dimensional solution, where optimism explained 32.11% of the variance and pessimism explained 23.43% of the variance. Other authors, such as Ribeiro et al. (2012), conducted a study to demonstrate the dual dimensionality of the instrument. Two different samples were used: one of 280 patients with a diagnosis of multiple sclerosis, aged between 16 and 70 years, with a majority of women (71.4%), and another with 615 people, randomly selected in different contexts (urban and rural), aged between 17 and 80 years, with 51.1% being women. The data on the factor structure of LOT-R was similar in both samples, where the bifactor solution was the best solution found. Zenger et al. (2013) analysed the properties of the LOT-R instrument (Scheier et al. 1994) in its Spanish version (Remor et al. 2006) in a Colombian sample of 1500 adults from different regions of their country. They reached the conclusion that there are two dimensions of the scale, where independence between the variables optimism and pessimism would be evidenced. According to these authors, the findings could be justified by the participants’ age and educational level. The contributions presented are useful in several ways. Firstly, to find out what psychological and emotional resources people hold in a given context (Sanín-Posada et al. 2018).
Secondly, to analyze the positive resources of the factors related to the use of emotional regulation and adaptive capacity as a basis for action aimed at promoting support processes and strengthening different skills to prevent risk behaviours (Extremera et al. 2020). Thirdly, evidencing the double dimensionality of optimism–pessimism may revive the debate on this issue. This perspective provides evidence for a point of reflection on the use of the LOT-R instrument. Further studies on the validity of the test, with different samples and other contexts, would be necessary. This point could open up further discussions and point to alternatives for improvement (Carver and Scheier 2014). Finally, we understand that EI may favour an optimistic attitude, thereby fostering creative solutions to adverse situations. Finally, these findings confirm that EI is a relevant indicator of wellbeing in life, which is why it would be innovative to incorporate it in non-formal educational contexts (Alonso-Ferres et al. 2018).
Among the main conclusions of this study, we can highlight that we have verified the fulfilment of the aims and objectives of the research, whose results have already been discussed previously. The existence of significant correlations between the dimensions of the instruments used, an absence of significant differences according to age in the variables considered, and significant differences according to context only in dispositional pessimism, with people from rural contexts being more pessimistic, were all presented in this research. A structural equation analysis revealed the unequal effect of EI with respect to optimism–pessimism according to gender, with the result being moderately higher for women than for men. Despite the reported evidence, some limitations should be noted. The subjective functionality of self-report instruments may affect the data through social desirability biases. Furthermore, the sample size’s heterogeneity and the study’s limitation to a single geographical area do not enable the generalization of the results to other contexts. It would be appropriate in future research to explore the factorial invariance of the assessment instruments to verify whether they are cross-cultural measures (López-Gullón et al. 2017). The sample size also implies that the evidence obtained should be treated with caution, and the fact that the type of sampling is non-probabilistic implies limitations in the evaluation of the results. Due to this limitation, the findings presented here should be interpreted with caution until they are validated in other studies and contexts. The non-consideration of other socio-demographic variables such as economic status, family type, or parents’ level of education is another factor that will be considered in the future for an in-depth exploration of the impact of EI in the comparison between urban and rural populations.
Other limitations of this study include variables that were not measured, such as community integration, social support in the specific context, or available social resources.

Author Contributions

Conceptualization, D.M., Ó.G.-C. and E.V.-C.; methodology, D.M., Ó.G.-C. and I.G.-M.; software, Ó.G.-C.; validation, D.M., Ó.G.-C. and E.V.-C.; formal analysis, D.M., Ó.G.-C., E.V.-C. and I.G.-M.; investigation, D.M., Ó.G.-C., E.V.-C. and I.G.-M.; data curation, D.M. and Ó.G.-C.; writing-original draft preparation, D.M., Ó.G.-C., E.V.-C. and I.G.-M.; writing-review and editing, D.M., Ó.G.-C., E.V.-C. and I.G.-M.; visualization, D.M. and I.G.-M.; supervision, D.M., Ó.G.-C., E.V.-C. and I.G.-M.; project administration, D.M. and I.G.-M.; funding acquisition, D.M. All authors have read and agreed to the published version of the manuscript.

Funding

This research received no external funding.

Institutional Review Board Statement

The study was conducted according to the guidelines of the Declaration of Helsinki and approved by the Ethics Committee of University of Jaén (Reference: OCT.20/1.TES).

Informed Consent Statement

Informed consent was obtained from all subjects involved in the study.

Data Availability Statement

Data are available on justified request to the corresponding author.

Conflicts of Interest

The authors declare no conflict of interest.

References

  1. Alonso-Ferres, Marta, Emilio Berrocal de Luna, and Miguel Jiménez-Sánchez. 2018. Estudio sobre la inteligencia emocional y los factores contextuales en estudiantes de cuarto de educación primaria de la provincia de Granada. Revista de Investigación Educativa 36: 141–58. [Google Scholar] [CrossRef] [Green Version]
  2. AMM. 2013. Declaración de Helsinki de la Asociación Médica Mundial. Fortaleza: Asociación Médica Mundial. [Google Scholar]
  3. Anderson, Craig, and Bernard Weiner. 1992. Attribution and attributional process in personality. In Modern Personality Psychology: Critical Reviews and New Directions. Edited by Gian-Vittorio Caprara and Guss Van Heck. New York: Harvester-Wheatsheaf, pp. 295–324. [Google Scholar]
  4. Bandeira, Marina, Valentín Bekou, Keli Silva-Lott, Marcela Teixeira, and Sandra Silva-Rocha. 2002. Validaçao transcultural do Teste de Orientaçao da Vida (TOV-R). Estudos de Psicología 7: 251–58. [Google Scholar] [CrossRef] [Green Version]
  5. Bar-On, Reuven. 1997. The Emotional Quotient Inventory (EQ-i). A Test of Emotional Intelligence. Toronto: Multi-Health Systems. [Google Scholar]
  6. Bar-On, Reuven, and James Donald Parker. 2000. The Emotional Quotient Inventory: Youth Version (EQ-i:YV). Toronto: Multi-Health Systems. [Google Scholar]
  7. Barrientos Oradini, Nicolás, Luis Araya Castillo, Victor A. Veloso Salazar, and Claudia M. Herrera Ciudad. 2019. Optimismo disposicional en docentes de universidades privadas en región metropolitana en Chile. Revista Arbitrada Interdisciplinaria Koinonía 4: 168–84. [Google Scholar] [CrossRef] [Green Version]
  8. Buitrago, Rafael. 2012. Contexto Escolar e Inteligencia Emocional en Instituciones Educativas Públicas del Ámbito Rural y Urbano del Departamento de Boyacá (Colombia). Doctoral dissertation, University of Granada, Granada, Spain. [Google Scholar]
  9. Buitrago Bonilla, Rafael Enrique, Lucía Herrera Torres, and Ruth Nayibe Cárdenas Soler. 2019. Coeficiente emocional en niños y adolescentes de Boyacá, Colombia. Estudio comparativo. Praxis & Saber 10: 45–68. [Google Scholar] [CrossRef] [Green Version]
  10. Carver, Charles, and Michael Scheier. 2014. Dispositional optimism. Trends in Cognitive Sciences 18: 293–99. [Google Scholar] [CrossRef] [Green Version]
  11. Cohen, Jacob. 1988. Statistical Power Analysis for the Behavioral Sciences. Hillsdale: Lawrence Erlbaum Associates, Publishers. [Google Scholar]
  12. Domínguez-Lara, Sergio Alexis, and César Merino-Soto. 2015. Por qué es importante reportar los intervalos de confianza del coeficiente alfa de Cronbach? Revista Latinoamericana de Ciencias Sociales, Niñez y Juventud 13: 1326–28. [Google Scholar]
  13. Extremera, Natalio, Lourdes Rey, and Nicolás Sánchez-Álvarez. 2019. Validation of the Spanish version of Wong Law Emotional Intelligence Scale (WLEIS-S). Psicothema 31: 94–100. [Google Scholar]
  14. Extremera, Natalio, Nicolás Sánchez-Álvarez, and Lourdes Rey. 2020. Pathways between Ability Emotional Intelligence and Subjective Well-Being: Bridging Links through Cognitive Emotion Regulation Strategies. Sustainability 12: 2111. [Google Scholar] [CrossRef] [Green Version]
  15. Fernández-Berrocal, Pablo, and Natalio Extremera. 2006. La investigación de la inteligencia emocional en España. Ansiedad y estrés 12: 139–53. [Google Scholar]
  16. Fernández-Berrocal, Pablo, Desiré Ruiz-Aranda, Jose M. Salguero, Raquel Palomera, and Natalio Extremera. 2018. The Relationship of Botín Foundation’s Emotional Intelligence Test (TIEFBA) with Personal and Scholar Adjustment of Spanish. Revista de Psicodidáctica 23: 1–8. [Google Scholar] [CrossRef]
  17. Ferrando, Pere Joan, Eliseo Chico, and Josep Ma Tous. 2002. Psychometric properties of the Life Orientation Test (LOT). Psicothema 14: 673–80. [Google Scholar]
  18. Fiori, Marina, and Ashley Vesely-Maillefer. 2018. Emotional intelligence as an ability: Theory, challenges, and new directions. In Emotional Intelligence in Education. Edited by Kateryna Keefer, James D. Parker and Donald H. Saklosfke. New York: Springer Publishing. [Google Scholar]
  19. Gaibor-González, Ismael, and Rodrigo Moreta-Herrera. 2020. Optimismo disposicional, ansiedad, depresión y estrés en una muestra del Ecuador. Análisis inter-género y de predicción. Actualidades en Psicología 34: 17–31. [Google Scholar] [CrossRef]
  20. Gavín-Chocano, Óscar, and David Molero. 2019. Estudio sobre inteligencia emocional, satisfacción vital y optimismo disposicional en un centro de día ocupacional de personas con discapacidad intelectual. Siglo Cero 50: 47–65. [Google Scholar] [CrossRef] [Green Version]
  21. Gebler, Sarah, John Nezlek, and Astrid Schütz. 2020. Training emotional intelligence: Does training in basic emotional abilities help people to improve higher emotional abilities? The Journal of Positive Psychology 16: 1–10. [Google Scholar]
  22. Gómez-Baya, Diego, Ramón Mendoza, Susana Paino, and Margarida Gaspar Matos. 2017. Perceived emotional intelligence as a predictor of depressive symptoms during mid-adolescence: A two-year longitudinal study on gender differences. Personality and Individual Differences 104: 303–12. [Google Scholar] [CrossRef]
  23. Harrod, Nicholas R., and Scott D. Scheer. 2005. An exploration of adolescent emotional intelligence in relation to demographic characteristics. Adolescence 40: 503–12. [Google Scholar]
  24. Herrera, Lucia, Rafael E. Buitrago, and S. Cepero. 2017. Emotional intelligence in Colombian primary school children. Location and gender. Universitas Psychologica 16: 165–74. [Google Scholar] [CrossRef] [Green Version]
  25. Herrera, Lucía, Rafael E. Buitrago, Oswaldo Lorenzo, and Mihaela Badea. 2015. Socio-Emotional Intelligence in Colombian Children of Primary Education. An analysis in rural and urban settings. Procedia-Social and Behavioral Sciences 203: 4–10. [Google Scholar] [CrossRef] [Green Version]
  26. Hu, Li-tze, and Peter M. Bentler. 1998. Fit indices in covariance structure modeling: Sensitivity to underparameterized model misspecification. Psychological Methods 3: 424–53. [Google Scholar] [CrossRef]
  27. Kline, Rex B. 2015. Principles and Practice of Structural Equation Modeling. New York: Guilford Press. [Google Scholar]
  28. López-Gullón, José María, Alberto Martínez-Abellán, and Jesús García-Pallarés. 2017. Optimismo versus pesimismo precompetitivo en los deportes de combate olímpicos. Diferencias de género, ranking y campeones. Cuadernos De Psicología Del Deporte 17: 67–72. [Google Scholar]
  29. López-Zafra, Esther, Manuel Pulido-Martos, and Pilar Berrios. 2014. EQi Versión Corta (EQi-C). Adaptación y validación al español del EQ-i en universitarios. Boletín de Psicología 110: 21–36. [Google Scholar]
  30. MacCann, Carolyn, Yixin Jiang, Luke E. R. Brown, Kit S. Double, Micaela Bucich, and Amirali Minbashian. 2020. Emotional intelligence predicts academic performance: A meta-analysis. Psychological Bulletin 146: 150–86. [Google Scholar] [CrossRef] [PubMed]
  31. Mayer, John D., and Peter Salovey. 1997. What is emotional intelligence? In Emotional Development and Emotional Intelligence: Implications for Educators. Edited by Peter Salovey and David Sluyter. New York: Basic Books, pp. 3–31. [Google Scholar]
  32. Mayer, John D., David R. Caruso, and Peter Salovey. 2016. The Ability Model of Emotional Intelligence: Principles and Updates. Emotion Review 8: 290–300. [Google Scholar] [CrossRef]
  33. McDonald, Roderick P. 1999. Test Theory: A Unified Treatment. New York: Lawrence Erlbaum Associates, Inc. [Google Scholar]
  34. Merino-Soto, Cesar, Manuel Lunahuaná-Rosales, and Rabindra Kumar. 2016. Validación estructural del Wong-Law Emotional Intelligence Scale (WLEIS). Estudio preliminar en adultos. Liberabit 22: 103–10. [Google Scholar] [CrossRef] [Green Version]
  35. Millstein, Rachel A., Wei-Jean Chung, Bettina B. Hoeppner, Julia K. Boehm, Sean R. Legler, Carol A. Mastromauro, and Jeff C. Huffman. 2019. Development of the State Optimism Measure. General Hospital Psychiatry 58: 83–93. [Google Scholar] [CrossRef]
  36. Nayak, Mamata. 2014. Impact of culture linked gender and age on emotional intelligence of higher secondary school adolescents. International Journal of Advancements in Research and Technology 3: 64–79. [Google Scholar]
  37. Ondé-Pérez, Daniel. 2020. Revisión del concepto de causalidad en el marco del Análisis Factorial Confirmatorio. Revista Iberoamericana de Diagnóstico y Evaluación Psicológica 54: 103–17. [Google Scholar] [CrossRef]
  38. Ottati, Fernanda, and Ana Paula Noronha. 2017. Factor structure of the Life Orientation Test-Revised (LOT-R). Acta Colombiana de Psicología 20: 40–48. [Google Scholar] [CrossRef]
  39. Parker, James D. A., Kateryna V. Keefer, and Laura M. Wood. 2011. Toward a brief multidimensional assessment of emotional intelligence: Psychometric properties of the Emotional Quotient Inventory-Short Form. Psychological Assessment 23: 762–77. [Google Scholar] [CrossRef]
  40. Pérez-González, Juan Carlos, Kostantinos Petrides, and Adrián Furnham. 2007. La medida de la inteligencia emocional rasgo. In Manual de Inteligencia Emocional. Edited by José Mestre-Navas and Pablo Fernández Berrocal. Madrid: Pirámide, pp. 81–97. [Google Scholar]
  41. Peterson, Christopher, and Martin Seligman. 1984. Causal explanations as a risk factor for depression: Theory and evidence. Psychological Review 91: 347–74. [Google Scholar] [CrossRef]
  42. Petrides, Kostantinos, and Adrián Furnham. 2001. Trait emotional intelligence: Psychometric investigation with reference to established trait taxonomies. European Journal of Personality 15: 425–48. [Google Scholar] [CrossRef]
  43. Petrides, Kostantinos, María José Sanchez-Ruiz, Alex B. Siegling, Donald H. Saklofske, and Stella Mavroveli. 2018. Emotional intelligence as personality: Measurement and role of trait emotional intelligence in educational contexts. In Emotional Intelligence in Education: Integrating Research with Practice. Edited by Kateryna Keefer, James D. Parker and Donald Saklofske. Berlin: Springer, pp. 49–81. [Google Scholar]
  44. Remor, Eduardo, Montserrat Amorós, and Jose Antonio Carrobles. 2006. El optimismo y la experiencia de ira en relación con el malestar físico. Anales de Psicología 22: 37–44. [Google Scholar]
  45. Ribeiro, José Luis, Luisa Pedro, and Susana Marques. 2012. Dispositional optimism is unidimensional or bidimensional? The Portuguese Revised Life Orientation Test. The Spanish Journal of Psychology 15: 1259–71. [Google Scholar] [CrossRef] [Green Version]
  46. Salovey, Peter, and John D. Mayer. 1990. Emotional Intelligence. Imagination, Cognition y Personality 9: 185–211. [Google Scholar] [CrossRef]
  47. Salovey, Peter, John D. Mayer, Susan Lee Goldman, Carolyn Turvey, and Tibor P. Palfai. 1995. Emotional attention, clarity and repair: Exploring emotional intelligence using the Trait Meta-Mood Scale. In Emotion, Disclosure and Health. Edited by James W. Pennebaker. Washington, DC: American Psychological Association, pp. 125–54. [Google Scholar] [CrossRef]
  48. Sanin, Alejandro, and Marisa Salanova-Soria. 2016. Verificación de las condiciones psicométricas del Test de Orientación en la Vida (LOT-R) aplicado en población trabajadora Colombiana. Revista Interamericana de Psicología Ocupacional 35: 58–67. [Google Scholar] [CrossRef] [Green Version]
  49. Sanín-Posada, Alejandro, Marisa Salanova-Soria, and Pablo Vera-Villaroel. 2018. Happiness and Optimism Interventions at Work: Gender Differences. Open Access Library Journal 5: 1–16. [Google Scholar] [CrossRef]
  50. Scheier, Michael F., and Charles S. Carver. 1985. Optimism, coping, and health: Assessment and implications of generalized outcome expectancies. Health Psychology 4: 219–47. [Google Scholar] [CrossRef]
  51. Scheier, Michael F., Charles S. Carver, and Michael W. Bridges. 1994. Distinguishing optimism from neuroticism (and trait anxiety, self-mastery, and self-esteem): A reevaluation of the Life Orientation Test. Journal of Personality and Social Psychology 67: 1063. [Google Scholar] [CrossRef]
  52. Shanwal, Vinod, Gurpreet Kaur, S. B. Singh, and Sudeep Kumar. 2006. Emotional Intelligence in School Children: A Socio Demographic Study. Journal of Psychosocial Research 1: 1–13. [Google Scholar]
  53. Stone, Lisanne L., Jan M. Janssens, Ad A. Vermulst, Marloes Van Der Maten, Ruter C. Engels, and Roy Otten. 2015. The Strengths and Difficulties Questionnaire: Psychometric properties of the parent and teacher version in children aged 4–7. BMC Psychology 3: 4. [Google Scholar] [CrossRef] [Green Version]
  54. Urzúa, Alfonso, Alejandro Caqueo-Urízar, Claudia Araya, Paula Díaz, Milenka Rocha, and Paulina Valdivia. 2016. ¿Existe relación entre los optimismos estado y rasgo y la evaluación de la calidad de vida? Universitas Psychologica 15: 231–42. [Google Scholar] [CrossRef] [Green Version]
  55. Velotti, Patrizia, Carlo Garofalo, Federica Bottazzi, and Vincenzo Caretti. 2017. Faces of shame: Implications for self-esteem, emotion regulation, aggression, and well-being. The Journal of Psychology 151: 171–84. [Google Scholar] [CrossRef] [PubMed] [Green Version]
  56. Ventura-León, Jose Luis. 2019. ¿Es el final del alfa de Cronbach? Adicciones 31: 80–81. [Google Scholar] [CrossRef] [PubMed]
  57. Vera-Villarroel, Pablo, Alfonso Urzúa, Christian Beyle, Daniela Contreras, Sebastián Lillo, Francisco Oyarzo, and Alejandro Sanín-Posada. 2017. Relación entre optimismo y salud bajo la influencia de las creencias religiosas en dos muestras latinoamericanas. Revista Latinoamericana de Psicología 49: 213–21. [Google Scholar] [CrossRef]
  58. Vera-Villarroel, Pablo, Natalia Cordova-Rubio, and Karem Celis-Atenas. 2009. Optimism evaluation: Preliminary analysis of the Life Orientation Test Revised Version (LOT-R) in Chilean population. Universitas Psychologica 8: 61–67. [Google Scholar]
  59. Vizoso-Gómez, Carmen María, and Olga Arias-Gundín. 2018. Resiliencia, optimismo y burnout académico en estudiantes universitarios. European Journal of Education and Psychology 11: 47–59. [Google Scholar] [CrossRef]
  60. Weiner, Bernard. 2000. Attributional thoughts about consumer behaviour. Journal of Consumer Research 27: 382–87. [Google Scholar] [CrossRef]
  61. Wong, Chi-Sum, and Kenneth S. Law. 2002. The effects of leader and follower emotional intelligence on performance and attitude: An exploratory study. The Leadership Quarterly 13: 243–74. [Google Scholar] [CrossRef] [Green Version]
  62. Zenger, Markus, Carolyn Finck, Cristian Zanon, William Jimenez, Susanne Singer, and Andreas Hinz. 2013. Evaluation of the Latin American version of the Life Orientation Test-Revised. International Journal of Clinical and Health Psychology 13: 243–52. [Google Scholar] [CrossRef] [Green Version]
Figure 1. Proposed model of the relationship between EI and optimism–pessimism.
Socsci 11 00268 g001
Figure 2. Multi-group structural equation model for men.
Socsci 11 00268 g002
Figure 3. Multi-group structural equation model for women.
Socsci 11 00268 g003
Table 1. Internal consistency, means, standard deviation, and correlations (Spearman’s Rho) between the variables optimism, pessimism, and emotional intelligence.
DimensionαωM (SD)OPTPESSSEAOEAUOEROEINTERADAPSTRINTRA
OPT0.740.703.03 (±0.77)-0.55 **0.33 **0.020.44 **0.15 *0.070.24 **−0.20 **0.27 **
PESS0.690.652.71 (±0.81) -−0.23 **0.16−0.31 **−0.96−0.13−0.110.38 **0.46 **
SEA0.830.773.85 (±0.77) -0.18*0.38 **0.33 **0.120.36 **−0.30 **0.51 **
OEA0.680.634.14 (±0.62) -16 *0.040.55**0.18 *−0.030.20 **
UOE0.860.733.91 (±0.99) -0.22 **0.140.36 **−0.130.39 **
ROE0.810.743.40 (±0.86) -−0.040.21 **−0.53 **0.17 *
INTER0.730.754.97 (±0.42) -0.29 **−0.100.23 **
ADAP0.770.663.79 (±0.57) -−0.23 **0.18 *
STR0.830.832.73 (±0.82) -−0.39 **
INTRA0.790.793.08 (±0.71) -
Note: (1) Mean = M, Standard deviation = SD, Optimism = OPT, Pessimism = PESS, Self-Emotion Assessment = SEA, Other’s Emotions Assessment = OEA, Use of Emotions = UOE, Emotional regulation = ROE, Interpersonal Emotional Intelligence = INTER, Adaptability = ADAP, Stress management = STR, and Intrapersonal Emotional Intelligence = INTRA. (2) * = p < 0.05; ** = p < 0.01.
Table 2. Mean differences according to age (U of Mann–Whitney).
Dimension<25 Years
M (DT)
>25 Years
M (DT)
ZpEffect Size (r)
LOT-ROPT3.02 (±0.75)3.07 (±0.85)−0.7210.4710.054
PESS2.70 (±0.79)2.75 (±0.90)−0.1480.8820.011
WLEIS-SSEA3.85 (±0.75)3.83 (±0.83)−0.0690.9450.005
OEA4.10 (±0.62)4.27 (±0.58)−1.3690.1710.102
UOE3.91 (±0.95)3.91 (±1.15)−0.1530.8780.011
ROE3.37 (±0.84)3.51 (±0.93)−1.0280.3040.077
EQi-CINTER4.05 (±0.41)4.15 (±0.45)−1.3570.1750.102
ADAP3.77 (±0.55)3.86 (±0.65)−0.6100.5420.045
STR2.73 (±0.82)2.71 (±0.81)−0.1790.8580.013
INTRA3.09 (±0.68)3.07 (±0.82)−0.0260.9790.001
Note: (1) Mean = M, Standard deviation = SD, Optimism = OPT, Pessimism = PESS, Self-Emotion Assessment = SEA, Other’s Emotions Assessment = OEA, Use of Emotions = UOE, Emotional regulation = ROE, Interpersonal Emotional Intelligence = INTER, Adaptability = ADAP, Stress management = STR, and Intrapersonal Emotional Intelligence = INTRA.
Table 3. Differences according to the context (U of Mann-Whitney).
DimensionUrban
M (DT)
Rural
M (DT)
ZpEffect Size (r)
LOT-ROPT3.04 (±0.77)3.03 (±0.78)−0.2350.8140.071
PES2.58 (±0.80)2.84(±0.81)−2.1380.032 *0.160
WLEIS-SSEA3.73 (±0.83)3.95 (±0.69) −1.4790.1390.111
OEA4.12 (±0.52)4.16 (±0.70) −0.8160.4150.061
UOE3.90 (±1.02)3.92 (±0.97)−0.2860.7750.021
ROE3.42 (±0.87)3.38 (±0.86)−0.1350.8930.010
EQi-CINT4.10 (±0.42)4.05 (±0.43)−0.5810.5610.043
ADAP3.73 (±0.58)3.84 (±0.57)−1.3000.1940.097
EST2.75 (±0.83)2.71 (±0.81)−0.2570.7970.019
INTR3.05 (±0.7)3.12 (±0.64)−0.4520.6510.033
Note: (1) Mean = M, Standard deviation = SD, Optimism = OPT, Pessimism = PESS, Self-Emotion Assessment = SEA, Other’s Emotions Assessment = OEA, Use of Emotions = UOE, Emotional regulation = ROE, Interpersonal Emotional Intelligence = INTER, Adaptability = ADAP, Stress management = STR, and Intrapersonal Emotional Intelligence = INTRA. (2) * = p < 0.05.
Table 4. Regression weights and standardised regression weights for men.
Relationships between Variables EstimationsR.W.
E.E.
C.R.pS.R.W. Estimations
SEA<--<--EI1.0000.5924.129***0.505
INTRAEI2.4430.2141.1940.2330.592
OEA<--<--EI0.2560.3152.109***0.159
INTEREI0.6640.5653.357***0.298
UOE<--<--EI1.8950.473.437***0.703
ADAPTEI1.6160.1011.6820.0930.738
ROE<--<--EI0.170.73−2.615***0.23
STREI−1.9080.1543.366***−0.391
OPTIMISM<--<--EI0.5190.108−2.384***0.572
PESSIMISMIE−0.258 −0.347
Note: (1) Regression weights= R.W.; Standardized regression weights= S.R.W.; Error estimation= E.E.; Critical ratio= C.R. (2) Optimism = OPT, Pessimism = PESS, Self-Emotion Assessment = SEA, Other’s Emotions Assessment = OEA, Use of Emotions = UOE, Emotional regulation = ROE, Interpersonal Emotional Intelligence = INTER, Adaptability = ADAP, Stress management = STR, and Intrapersonal Emotional Intelligence = INTRA. (2) *** = p < 0.001.
Table 5. Regression weights and standardised regression weights for women.
Relationships between Variables EstimationsR.W.
E.E.
C.R.pS.R.W. Estimations
SEA<--<--EI1.000 0.789
INTRAEI1.8510.3026.138***0.714
OEA<--<--EI0.2890.1162.501***0.283
INTEREI0.3270.1492.193***0.247
UOE<--<--EI0.8030.1754.574***0.559
ADAPTEI0.3900.1392.804***0.324
ROE<--<--EI0.0750.0491.5210.1280.170
STREI−1.2350.316−3.905***−0.459
OPTIMISM<--<--EI0.2380.0504.709***0.580
PESSIMISM EI−0.1390.041-3.368***−0.388
Note: (1) Regression weights= R.W.; Standardized regression weights= S.R.W.; Error estimation= E.E.; Critical ratio= C.R. (2) Optimism = OPT, Pessimism = PESS, Self-Emotion Assessment = SEA, Other’s Emotions Assessment = OEA, Use of Emotions = UOE, Emotional regulation = ROE, Interpersonal Emotional Intelligence = INTER, Adaptability = ADAP, Stress management = STR, and Intrapersonal Emotional Intelligence = INTRA. (2) *** = p < 0.001.
Publisher’s Note: MDPI stays neutral with regard to jurisdictional claims in published maps and institutional affiliations.

