Abstract
The duration of dust days (DDD) is one of the most important parameters that may worsen the effects of the presence of dust in the affected areas. Persistent pollution over consecutive dusty days can have particularly negative effects on the human respiratory system. The present analysis was conducted in Central Iran, where the phenomenon of dust is one of the most important problems. In this study, using dust codes recorded at 35 synoptic stations, the homogeneity of DDD across the region was investigated using the L-moments method. Then, characteristics of DDD over the period 1999–2018 were calculated. The results showed that the region is statistically homogeneous. Furthermore, Zabol and Zahdan are the stations worst affected, with the longest durations of 22 and 21 days in 2014. Additionally, the values of DDD with return periods of 5, 10, 25, and 50 years were calculated using fitted statistical distributions and kriging and mapped. Finally, using the K nearest neighbor method the most important factor affecting DDD of the spatial characteristics, including longitude, latitude, elevation, average daily temperature (tm), dew point (td), wind altitude (u), maximum wind speed (ffmax), and direction of the fastest wind (ddmax), was determined. It was found that the southeastern parts of the study area are affected by the longest dust storm duration in all return periods; over longer return periods, long dust storms are also found in the central parts, especially the central desert of Iran. Therefore, these areas should be given priority in fighting and controlling wind erosion. Furthermore, the results showed that the maximum wind speed has the greatest effect on DDD.
1. Introduction
Atmospheric dust is a meteorological event that has adverse environmental effects and consequences, with a negative impact on the lives of humans and communities. Dust is a mass of small solid particles that are suspended in the atmosphere and may reduce the horizontal visibility to 1–2 km or less [1]. Assessments of the effects of aerosols on the climate and environment still feature large uncertainties, and a better understanding of the spatiotemporal variation in these effects is needed [2]. Dust particles can range in size from a few nanometers to 100 microns [3]. They can rise to the top of the troposphere and for a long distance laterally (4000 km from the source of emission) and may remain in the atmosphere for several weeks due to their small size [4,5]. Therefore, the effects of dust are not limited to the location of storms, which lift the parcels from the ground to the atmosphere, but their effects can be traced some miles away from the source, highlighting the global importance of these events. Mineral dust, as a major component of atmospheric aerosols, has a strong impact on the atmosphere. It affects the radiation budget of the earth’s atmosphere by scattering and absorbing solar radiation, alters cloud characteristics by providing cloud condensation nuclei or ice nuclei, and heats up the surrounding environment [6]. These particles can reduce air quality, favoring severe respiratory diseases, as well as destroy transportation infrastructure, reduce incoming solar radiation [7,8], induce negative effects on vegetation and agricultural fields, and so on [9]. One of the major factors in the formation of dust storms is the presence of strong wind flows associated with low-pressure systems in potential source areas [10]. Dust particles are effective in absorbing and reflecting the sun and earth radiation, especially in layers below 3000 m, affecting the incoming and outgoing radiation at the earth’s surface (atmospheric radiation balance). By increasing the absorption and reflection of sunlight towards space, they directly cool the underlying layers of the atmosphere and, on the other hand, warm the earth by trapping long wavelengths reflected from the earth’s surface [3,5,11,12,13,14,15]. Dust particles are harmful and dangerous to public health [16]. Dust storms can transmit a variety of pollutants and allergens such as spores, fungi, bacteria, pathogenic viruses, sediments, heavy metals as well as radioactive materials [17]. Breathing polluted air causes respiratory disorders including asthma, bacterial infection of the trachea and bronchi, pneumonia, and cardiovascular disorders including stroke and heart attack [18]. As well, dust also has a significant impact on global biochemical cycles, soil formation, atmospheric chemical composition, and air quality [19,20,21,22,23]. Therefore, dust may have irreversible harmful effects, and any area that has a high number of consecutive dust days will have more harmful effects. Dust is a dynamic phenomenon and research on it covers a wide range of time scales and variability in frequency and intensity [24,25,26]. Arid areas (deserts), semi-arid areas, seasonally dry coastal areas, lakes and wetlands, and areas with very low annual rainfall, very low soil moisture, abundant alluvial sediments, and poor vegetation are particularly prone to dust emission and hence to severe dust storms. In addition, dust storms can be worsened by human factors in the form of human intervention in land surface diversity, land use change through agriculture, deforestation, and overgrazing [4,27]. Poor land management, climate change, and drought caused by human activities, followed by land drying and desertification, poor management of water resources such as surface water diversion, multiple dams, and overuse of water, are contributors to dust supply. Many studies have been performed in the field of how dust days are affected by meteorological and land surface conditions in arid parts of Iran, [28]. Severe sandstorms raise dust during atmospheric instabilities under dry and windy conditions. In general, the main sources of dust storms are located in the arid and semi-arid regions of the world. In the Middle East, deserts in Iraq, Iran, Egypt, Israel, Syria, and the Arabian Peninsula are known to be the main sources of dust [29]. In recent years, dust events considered serious environmental hazards [3,11] have occurred with greater frequency and intensity in Asia [30]. Iran is located in a zone of southwest Asia where arid and semi-arid climate and sparse vegetation provide the conditions for dust storms, particularly in Central Iran, where the deserts of Loot and Kavir provide ideal conditions for this phenomenon. The Jazmourian, Gavkhoni, Hamoon wetlands in the central plateau of Iran, when dry and under influence of the regional winds, acting major dust sources, particularly in drought conditions.
The continuity of dust day duration (DDD) in the region, intensifies the human and environmental effects of this destructive phenomenon. The purpose of this study is to analyze periods of dust persistence and to identify the most affected areas. The return periods of different DDD values were calculated, and then these calculated values of this parameter were regionalized across the whole study area. One of the innovative aspects of this study is that no study has previously been performed on the persistence of dust days in the central plateau of Iran.
2. Materials and Methods
2.1. Study Area
The Central Plateau is Iran’s largest basin, consisting of nine sub-basins, including: Loot desert, Central Desert, Jazmoorian, Govkhooni, Salt Lake, Siahkoh Desert, Daranjir Desert, Abargho Desert, and Tashk Bakhtegan Maharloo. Rainfall in this area is very low, with an annual average of less than 100 mm, and locally just 25 mm. On the other side, the annual potential evaporation rate in this area is high, and in many cases reaches more than 4000 mm. As such, the potential evaporation rate can be as high as 40 to 80 times the annual precipitation, indicating extreme aridity. The average relative humidity of these plains is around 30–40% but declines to 15% during the warm season. The mean annual temperature varies between 15 and 30 °C, and the reported maximum and minimum temperatures are 51 and −18 °C, respectively. In Figure 1, the area is shown along with the synoptic stations that will be used here to identify the occurrence and frequency of long-duration dust storms in the region.
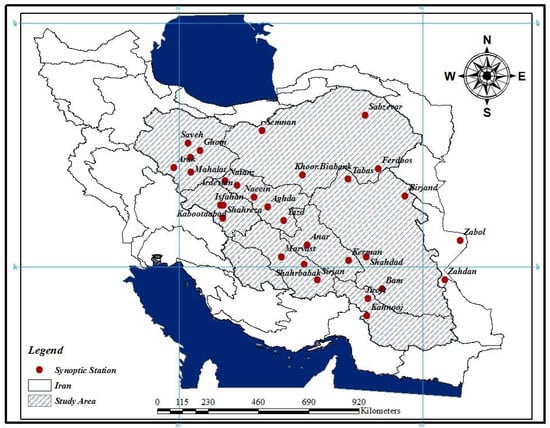
Figure 1.
Geographical location of the study area.
In this study, dust codes related to 35 synoptic stations located in the central plateau of Iran were used to determine DDD; the specifications of these stations are shown in Table 1. Figure 2 shows how the station data fit into the overall step-by-step plan of the research. In general, after taking the dust data and also the regional frequency analysis using L-moment, we calculate the probability value of DDD and obtain the return period of DDD values, and using interpolation the map of DDD at different return periods is obtained. Furthermore, using the k-NN classification method, the most important factor influencing the synoptic dust variability is determined.

Table 1.
Synoptic stations used in this study.
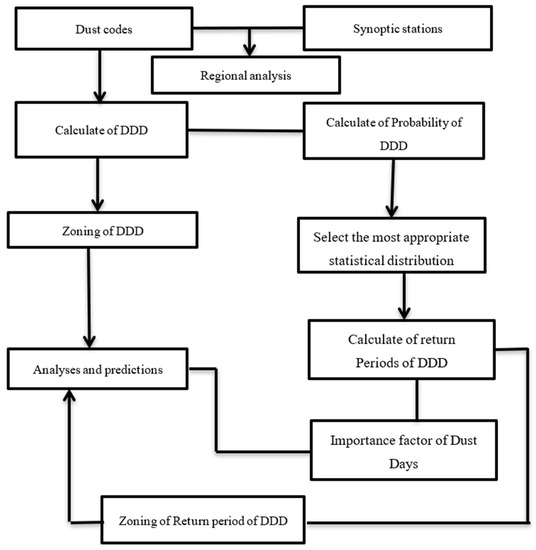
Figure 2.
Schematic of the presented research on dust day duration (DDD).
2.2. Homogeneity Testing of DDD
Discordancy Test
Hosking & Wallis [31] presented two statistical measures for regional homogeneity, which include the discordancy statistic D and the homogeneity statistic H.
The discordancy test identifies inconsistent locations within the whole group. It is not easy to choose a value for (discordancy or mismatch criterion at station (i)) as a decision criterion for a mismatched station. Ref. Hosking & Wallis [32] suggested that a station is awkward when the level is above a critical level. In large areas, stations with high are more likely to exist. However, it is still suggested that if a station has , that is considered a mismatch [31].
The discordancy statistic is defined as follows:
Here is the linear moment matrix at station i, N is the number of stations, and S is the sample covariance matrix [31,32]. The homogeneity test statistics include three criteria: H1, H2, and H3. If the value of this statistic is less than 1, the region is homogeneous; if it is between 1 and 2, the region is somewhat homogeneous; and if it is greater than 3, the region is completely discordant. In practice, it is stated that the H1 criterion is more appropriate for this test [33]. The value of this statistic is obtained from the following equation:
with
Here, is the sample size at station i, is the sample linear torque (L-CV), is the mean sample linear torque (L-CV), is the mean of values and is the standard deviation of the values [31,32]
To select the best distribution in an area, we can choose the one that gives the best value of a fit criterion. Tests that are used to select a distribution to fit data include the Chi-square test , Kolmogorov–Smirnov test, PPPC (Probability Plot Correlation Coefficient) test, correlation coefficient test (for example, normal distribution and normal log and Pearson type 3, Anderson–Darling test and linear moment curves) [31,33,34]. In this research, the statistics of Hosking and Wallis are used.
In this method, the test of the best fit of the regional distribution function is performed in order to select the best regional distribution function and includes the calculation of statistics. A distribution function that fits a set of data well will have . This selected function is known as the regional function and values of DDD with different return periods are obtained using it. The statistic is defined as follows:
Here, DIST means distribution, means linear community protruding moment (L-CK), is the mean regional linear torque of the sample protrusion, is the area oblique value of the above torque, is the regional deviation of the above torque, and Nsim is the number of simulated areas, which is equal to 500.
2.3. Statistical Analyses of Dust Days
The dust codes 06 (Suspended dust that has traveled long distances) and 07 (Dust or sand rising from the station to the atmosphere) of synoptic bulletins were obtained over the study period of 1999–2018 from Central Iran weather stations. Statistics relating to dust days in the region were calculated in Excel software. Dust phenomena that lasted only one day were discarded so that only dust events (horizontal visibility below 1000 m) that lasted for several days (more than one) were retained in each station.
Then, the average, minimum and maximum duration of dust events per year were extracted for each station and were mapped using kriging for spatial interpolation in GIS software, and maps of the range of dust cycles in the study area were drawn. Furthermore, in order to predict the maximum expected duration of dust days at different return periods, Easyfit software was used. EasyFit allows to automatically or manually fit a large number of distributions to data and select the best model in seconds. It can be used as a stand-alone application or with Microsoft Excel. EasyFit Professional software supports statistical distribution. Such as Normal, Bernoulli, Beta, Chi-square, Erlang, Exponential, Geometric, Gumble, Inverse Gaussian, Johnson, Logarithmic, Logistic, Normal, Gamma, Inverse Gamma, Pearson, T- Student, Weibull, and so on. After fitting the data to statistical distributions based on matching tests (Kolmogorov–Smirnov, Anderson–Darling, Chi-Squared) selects the most appropriate statistical distribution that is ranked 1st. In this study, maximum annual data were used for each station.
Using the annual DDD maximum values calculated in the previous step, the best statistical distribution function for each station was calculated. Finally, the inverse relationship with the probable values of DDD with return periods of 5, 10, 25, and 50 years was calculated, and, using GIS software, these DDD values were mapped across the region.
2.4. Importance of Factors Affecting Dust Duration using Synoptic Station Data
k-NN Classification
Neural networks, support vector machines, and k nearest neighbor (k-NN) are some of the classifiers that are commonly used for fitting functions to explain complex phenomena using multiple potential predictors. In the k-NN classifier, the distance between an experimental pattern and all patterns in the training set is calculated. The distance can be calculated using distances such as the Euclidean or Manhattan distance. The probable classes get the vote of each of the k patterns that are closest to the test pattern. The returned class is the one with the highest number of votes. If x is the test data, denote the set k of the nearest neighbor x as S_x. S_x is defined as:
(that is, every point in D but not in is at least as far away from x as the farthest point in ). The classifier h() can then be defined as a function that returns the most common tag in S_x:
where mode(⋅) means selecting the highest event tag [35]. (Note: In the event of a tie, a good solution is to redo k-NN with a smaller k and return that result.)
3. Results
3.1. Regional Homogeneity Test
For the regional homogeneity test in this study, the maximum annual duration of dust days of 35 synoptic stations in the central plateau of Iran was investigated and the maximum duration of dust days in each year was used for frequency analysis. The first step in regional frequency analysis is to identify homogeneous regions. In a homogeneous region, the set of stations should be approximately similar in terms of frequency distribution. The homogeneous region is the main unit of regional frequency analysis. In homogeneous areas, the area does not need to be geographically homogeneous, but the stations should have similar values. Figure 3 and Figure 4 show the linear moments and homogeneity diagrams of the area.
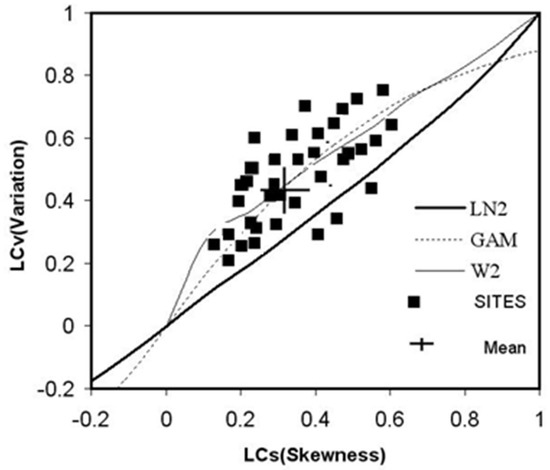
Figure 3.
Diagram of linear moments L−CV, L−CS of the studied stations, along with those expected from different candidate probability distributions.
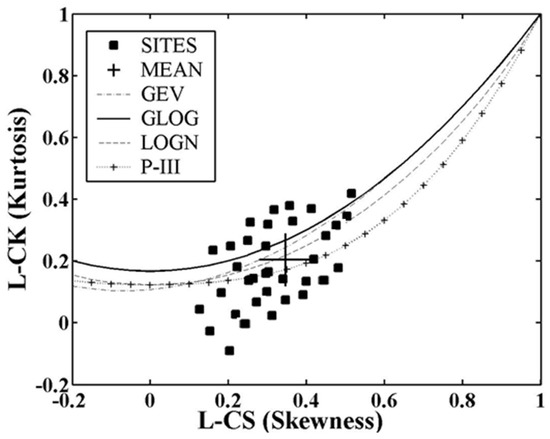
Figure 4.
Diagram of linear moments L−CK, L−CS of the studied stations.
Figure 3 and Figure 4 show the linear moments diagrams for the stations in the area. As shown, these moments have good dispersion around the mean.
Moreover, the D statistic was used to ensure the absence of heterogeneous stations in the region. Table 2 shows the calculations of descriptive statistics and sample linear moments for the stations under study. As shown in the table, the value of the D statistic in all stations is less than 3 and indicates that there is no heterogeneous station in the region. The value of the H statistic (less than 1) also supported the conclusion that the region is completely homogeneous.
Table 2.
Descriptive statistics and linear moments of station DDD.
3.2. Statistical Analysis of Dust Durability
Statistical analysis in the period 1999–2018 shows that the highest duration of dust days in 2014 occurred in Zabol stations with 22 and Zahdan with 21 consecutive days. Additionally, in Zabol and Zahdan stations, the minimum annual-maximum duration of dust days is 11 and 9 days. The diagram of annual-maximum DDD in these two stations during the period 1999–2018 is shown in Figure 5.
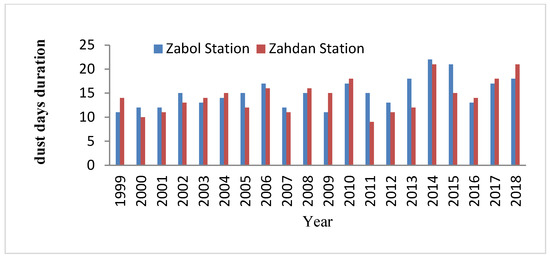
Figure 5.
Annual-maximum dust days duration in Zabol and Zahdan stations 1999–2018.
A seasonal survey of the index station of the region (Zabol and Zahdan stations) shows that the highest frequency of dust events occurs in summer, followed by spring; in particular, in Zahdan and Zabol stations about 52% and 48% of multiday dust storms occurred in summer; their diagrams are shown in Figure 6. The most important reasons for the high frequency of dusty days in this area in summer, include high temperatures that cause severe evaporation of water resources along with lack of rainfall in summer, all leading to reduced adhesion of soil particles due to lack of moisture. Dust emissions are worsened by the 120-day erosive winds of Sistan that blow in summer and strongly affect the eastern parts of Iran
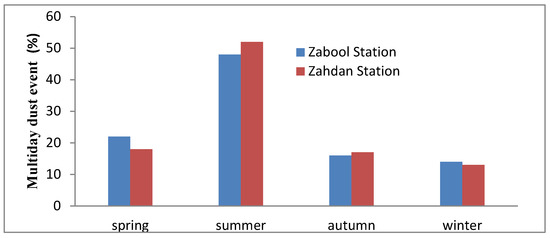
Figure 6.
Seasonal diagram of multiday dust events at Zabol and Zahdan station.
After Zabol station with 22 days and Zahdan with 21 days, the next longest DDD was recorded at Anar, Nain, and Saveh stations with 8 days, as shown in Figure 7.
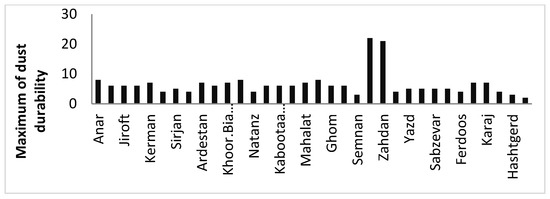
Figure 7.
Diagram of maximum DDD, 1999–2018, in the study area.
There is a big difference between the DDD values of Zahdan and Zabol stations and other stations in the study area. Although stations in the central deserts of Iran such as Khor, Biabank, Yazd, and Semnan, also have favorable climatic and edaphic conditions for wind erosion, the Zahdan and Zabol stations are the most affected by the 120-day winds of Sistan, known as the monsoon winds, that blow continuously over prolonged periods.
Furthermore, regarding the average annual-maximum dust day duration in the study area, Zabol station with an average of 15 days and Zahdan station with an average of 14.3 days had the highest values over the study period. On the other hand, Hashtgerd and Semnan stations with 0.98 and 1.25 days, respectively, had the lowest values in the area (Figure 8).
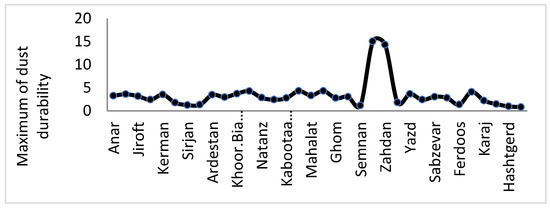
Figure 8.
Graph of average dust day durations by station in the study area.
Then, using GIS software and the kriging interpolation method, the maximum, minimum and average annual-maximum DDD over 1999–2018 were mapped in Figure 9, Figure 10 and Figure 11, respectively.
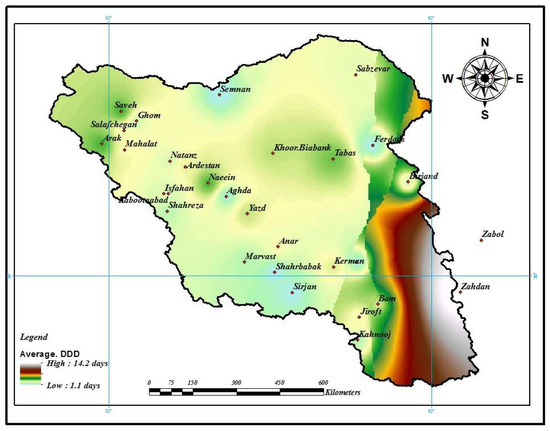
Figure 9.
Map of the average annual-maximum dust day duration in the study area.
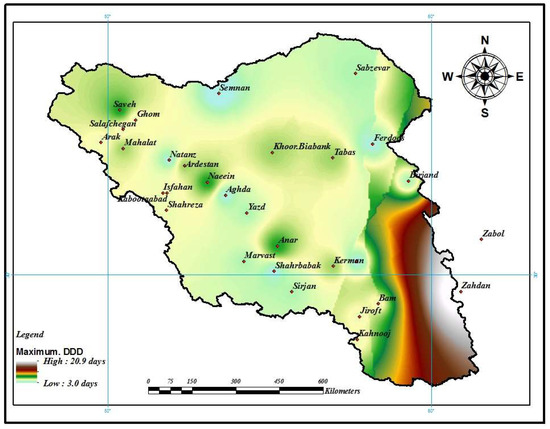
Figure 10.
Maximum dust day duration in the study area.
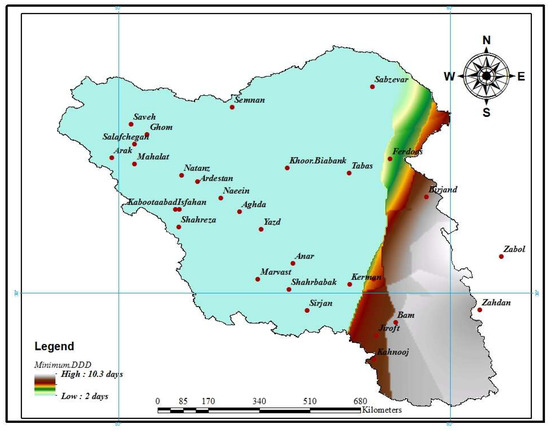
Figure 11.
Minimum annual-maximum dust day duration in the study area.
According to Figure 9, DDD is maximum in the east and southeast of the study area. Additionally, Saveh and Arak stations in the northwest of the region have a relatively high DDD.
3.3. Frequency Analysis of Duration of Dust Days
Easyfit software was used to calculate the duration of dust days for different return periods. First, the most appropriate statistical distribution of the station was identified, and, based on the fitted statistical distributions, the values of duration of dust days in the return periods of 5, 10, 25, and 50 years were calculated. These were then regionalized using GIS software and the range kriging interpolation method. DDD was plotted for different return periods as shown in Figure 12, Figure 13, Figure 14 and Figure 15.
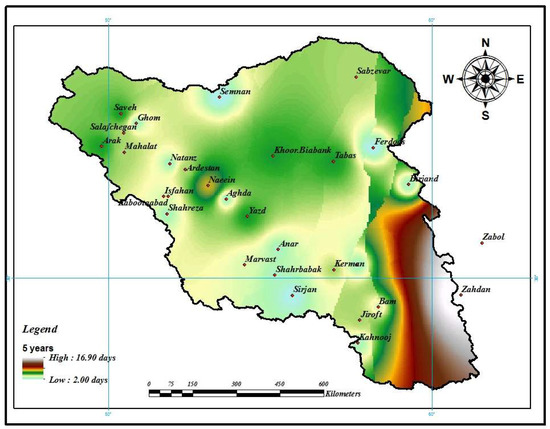
Figure 12.
Dust day duration with a 5-year return period in the study area.
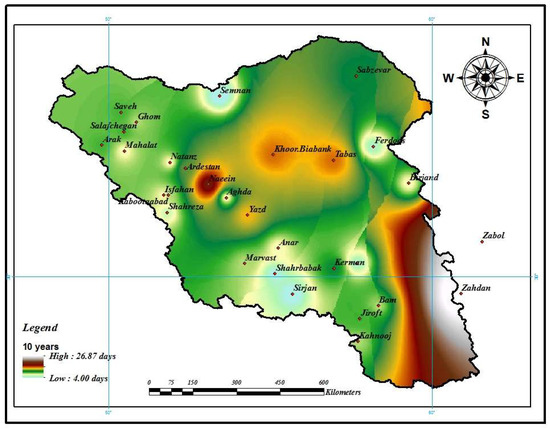
Figure 13.
Dust day duration in the 10-year return period in the study area.
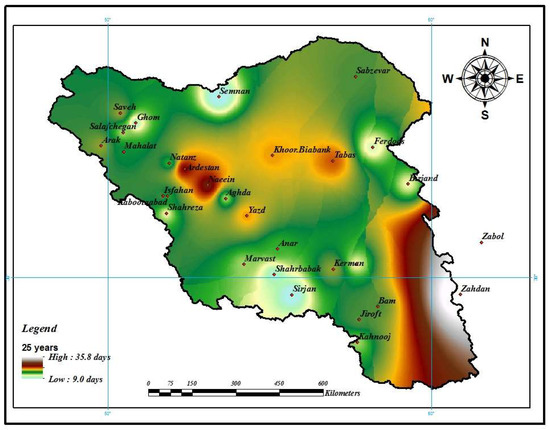
Figure 14.
Dust day duration in the 25-year return period in the study area.
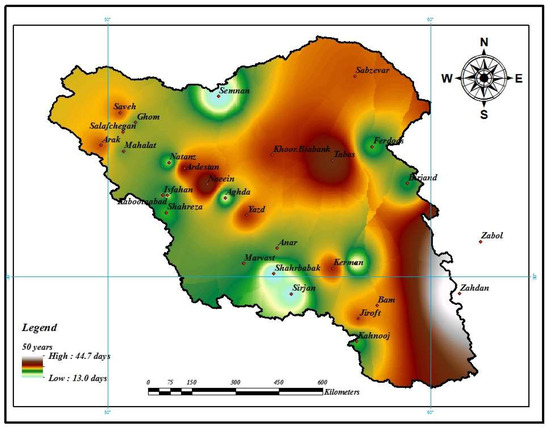
Figure 15.
Dust day duration in the 50-year return period in the study area.
Figure 12 shows that DDD with a return period of 5 years can vary from 2 to 16.9 days, whose maximum is concentrated in the eastern and southeastern parts of the study area. Additionally, parts of the northeast of the region and the center (Naein) have a high DDD.
Figure 13 shows the southeastern parts of the study area as well as the central desert of Iran (Dasht-e Kavir), where Nain, Tabas, and Khoro Biyabank stations are located, have DDD of up to 27 days during a 10-year return period. The range in the 10-year return period is between 4 and 26.9 days, with the highest value in the southeastern parts of the study area in the provinces of Sistan and Baluchestan and Kerman.
Figure 14 shows the range of DDD from 9 to 35.8 days per year with a 25-year return period in the study area. Similar to the other return periods, this shows that the southeastern parts, as well as the central parts of Central Iran, are at risk for longer DDD.
Figure 15 shows dust zoning over a 50-year return period, with variations between 13 and 44.7 days per year. Values near the peak are widespread over more than two-thirds of the study area. The southeastern parts still have the longest DDD at this return period; furthermore, the central parts of the study area as well as the northwestern parts (Saveh and Arak stations) have high values for this return period. It is necessary to mention that industrial areas are mostly located in the northwestern parts of the basin and the high DDD values in these areas (Saveh and Arak stations) are mainly due to industrial pollution.
3.4. Parameters Affecting Dust Day Duration
In order to investigate the most important parameter affecting the durability of dust, 8 different properties were used. These spatial characteristics of the stations included longitude, latitude, elevation, average daily temperature (tm), dew point (td), wind altitude (u), maximum wind speed (ff max), and direction of the fastest wind (dd max). As expected, each of the features used has a different importance in the k-NN classification, which is shown in Figure 16. ffmax (maximum wind speed) was by far the most important parameter associated with spatial variability in DDD, consistent with the key role of wind in lofting and transporting dust.
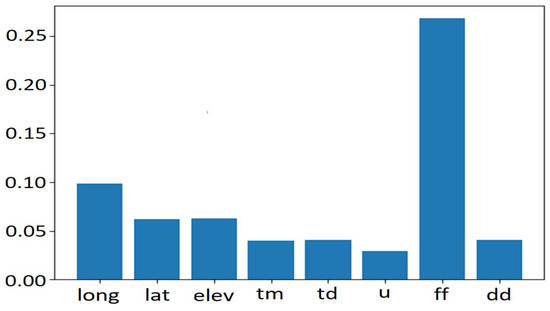
Figure 16.
Character significance diagram for the k-NN method.
4. Discussion
The phenomenon of dust is one of the most serious problems affecting the central plateau of Iran and this phenomenon has a very negative effect on the lives of the inhabitants of this region. One of the most important indicators determining the number of risks and damages of this phenomenon is its duration. A long duration of high dust concentration can have very detrimental effects on the respiratory system so a given level of dust can be very dangerous if accompanied by a long duration. Due to the presence of the main deserts of Iran (Loot Desert and Central Desert (Dasht-e Kavir)) in this region, the conditions for creating dust are very favorable. Ref. [36] also pointed to Middle East desert dust as an important risk factor for human health. That study found that the southeastern parts of the region, which are mostly located in the central Loot and Jazmourian basins, have the highest annual-maximum duration of dust days. Zabol and Zahdan are the stations having the highest duration of dust days in the region, being along the path of erosive winds such as the “120-day” Sistan storm pattern. Dry rivers and wetlands in this area, which includes the Helmand Basin, are considered the most important source of dust. Ref. [37] states that the southeastern region of Iran, which includes Sistan and Baluchestan provinces (Zahdan and Zabol stations), are the most important sources of dust in the central plateau of Iran. Ref. [38] also mentions this issue and states that the southeastern regions of Iran are affected by the deserts of Afghanistan and the Helmand Basin.
In order to predict the areas affected by the longest DDD, maximum expected DDD values at return periods of 5, 10, 25, and 50 years were determined for the stations and regionalized via kriging. It was determined that the southeastern part of Iran for all return periods is the area where the dust phenomenon is most concentrated. However, with longer return periods, the desert in the central parts of Iran also faces considerable risks of long dust events. Ref. [39] analyzed the frequency of dust days in the central plateau of Iran and states that the southeastern parts of the basin have a high frequency in all return periods. Ref. [40] also states that the eastern part of Iran, Zabol station, has a high frequency of dust, and the existence of the Helmand plain and the 120-day winds of Sistan are the most important factors responsible for that. Ref. [41] showed that so-called shamal, levar, and monsoon winds highly control the formation and dynamics of dust regimes. The 120-day winds of Sistan are from the monsoon winds and blow from the southeast, most strongly affecting the area around Zabol and Zahdan stations [42]. Mesbahzadeh [39] also found that Zabol station has the highest number of dust days in the region of the central plateau of Iran.
One of the most important factors that cause the movement of dust masses is the wind. Consistent with this, the results of this study also showed that the maximum wind speed has the greatest effect on the geographic distribution of dust duration across arid Central Iran. Windiness has also been postulated to be a key driver of interannual variability in dust day frequency in North Africa and China [40].
5. Conclusions
Dust storms are a major hazard faced by people in Central Iran, which can be worsened by human land and water management and by anthropogenic global warming. Here, we went beyond previous studies on the number of dust days per year across the region to examine dust day duration, as long spells of heavy dust concentration are particularly harmful to health and infrastructure. We found that, like the number of dust days, dust duration is worst in the southeast margin of this region, and that wind speed in the meteorological factor best correlates with the average annual-maximum dust day duration over this region. Understanding the temporal structure of dust events, for example in terms of the number of consecutive days, as well as their frequency can lead to better understanding and management of this destructive phenomenon.
Author Contributions
Conceptualization, T.M. and M.M.M.; methodology, T.M., F.S.S. and M.H.; software, F.S.S.; validation, T.M. and N.K.; formal analysis, T.M.; investigation, M.M.M.; resources, F.S.S.; data curation, F.S.S.; writing—original draft preparation, T.M.; writing—review and editing, N.K. and M.M.M.; supervision, M.M.M. All authors have read and agreed to the published version of the manuscript.
Funding
This research received no external funding.
Informed Consent Statement
Not applicable.
Conflicts of Interest
The authors declare no conflict of interest.
References
- Reed, L.; Nugent, K. The health effects of dust storms in the Southwest United States. Southwest Respir. Crit. Care Chron. 2018, 6, 42–46. [Google Scholar] [CrossRef] [Green Version]
- Zhou, T.; Xie, H.; Jiang, T.; Huang, J.; Bi, B.; Huang, Z.; Shi, J. Seasonal characteristics of aerosol vertical structure and autumn enhancement of non-spherical particle over the semi-arid region of Northwest China. Atmos. Environ. 2020, 244, 117912. [Google Scholar] [CrossRef]
- Rashki, A.; Kaskaoutis, D.; Rautenbach, C.J.d.W.; Eriksson, P. Changes of Permanent Lake Surface, and Their Consequences for Dust Aerosol and Air Quality: The Hamoun Lakes of the Sistan Area, Iran. In Atmospheric Aerosols: Regional Characteristics—Chemistry and Physics; IntechOpen: Rijeka, Croatia, 2012; Chapter 6; pp. 163–202. [Google Scholar] [CrossRef] [Green Version]
- Kok, J.F.; Parteli, E.J.R.; Michaels, T.I.; Bou Karam, D. The physics of wind-blown sand and dust. J. Rep. Prog. Phys. 2012, 75, 106901. [Google Scholar] [CrossRef] [PubMed] [Green Version]
- Zoljoodi, M.; Didevarasl, A.; Montazerzohor, Z. Application of the dust simulation models in the Middle East, and dust-dispertion toward the western/southwestern Iran (case study: 22–26 June 2010). J. Nat. Sci. 2013, 5, 818–831. [Google Scholar]
- Zhou, T.; Xie, H.; Bi, J.; Huang, Z.; Huang, J.; Shi, J.; Zhang, B.; Zhang, W. Lidar Measurements of Dust Aerosols during Three Field Campaigns in 2010, 2011 and 2012 over Northwestern China. Atmosphere 2018, 9, 173. [Google Scholar] [CrossRef] [Green Version]
- Sayer, A.M.; Hsu, N.; Bettenhausen, C.; Jeong, M.J. Validation and uncertainty estimates for MODIS Collection 6 “Deep Blue” aerosol data. J. Geophys. Res. Atmos. 2013, 118, 78647872. [Google Scholar] [CrossRef] [Green Version]
- Khoshsima, M.; Ali Akbari Bidokhti, A.; Givi, F. Evaluation of aerosol optical depth using visibility and remote sensing data in urban and semi urban areas in Iran. J. Earth Space Phys. 2013, 39, 163–174. [Google Scholar]
- Schepanski, K. Transport of mineral dust and its impact on climate. Geosciences 2018, 8, 151. [Google Scholar] [CrossRef] [Green Version]
- Novlan, D.J.; Hardiman, M.; Gill, T.E. A synoptic climatology of blowing dust events in El Paso, Texas from 1932–2005. In Proceedings of the of the 16th Conference on Applied Climatology, American Meteorological Society, San Antonio, TX, USA, 18 January 2007. [Google Scholar]
- Xie, J.; Yang, C.; Zhou, B.; Huang, Q. High-performance computing for the simulation of dust storms. J. Comput. Environ. Urban Syst. 2010, 34, 278–290. [Google Scholar] [CrossRef]
- Lin, C.A.; Sheng, Y.F.; Chen, W.W.; Wang, Z.; Kuo, C.H.; Chen, W.C.; Yang, T. The impact of channel effect on Asian dust transport dynamics: A case in southeastern Asia. J. Atmos. Chem. Phys. 2012, 12, 271–285. [Google Scholar] [CrossRef] [Green Version]
- Malakooti, H.; Babahosseini, S.; Azadi, M.; Nouhegar, A. Formation and Evolution of a heavy dust storm over Middle East: A Numerical Case Study. In Proceedings of the International Symposium on Advances in Science and Technology, Bandar-Abbas, Iran, 7–8 March 2013; Volume 7, Organized by Khavaran Institute of Higher Education. pp. 1–9. [Google Scholar]
- Cuevas, E. Establishing WMO Sand and Dust Storm Warning Advisory and Assessment System Regional Node for West Asia: Current Capabilities and Needs; World Meteorological Organization: Geneva, Switzerland, 2013; pp. 1–18. [Google Scholar]
- Kumar, R.; Barth, M.C.; Pfister, G.G.; Naja, M.; Brasseur, G.P. WRF-Chem Simulations of a typical pre-monsoon dust storm in northern India: Influences on aerosol optical properties and radiation budget. J. Atmos. Chem. Phys. 2014, 14, 2431–2446. [Google Scholar] [CrossRef] [Green Version]
- Mousavi, Z.; OmIdian, M.; Mapar, M.; Yaghoubi, R.; Shohani, S. Comparison of the number of referees with skin disarders to dermatologic clinics before and after dust stoum in Ahvaz. Jientashapir 2013, 3, 103–113. [Google Scholar]
- Goudie, A.S. Desert dust and human health disorders. Environ. Int. 2014, 63, 101–113. [Google Scholar] [CrossRef] [PubMed]
- Kim, K.H.; Kabir, E.; Kabir, S. Human health impact of airborne particulate matter. Environ. Int. 2015, 74, 136–143. [Google Scholar] [CrossRef] [PubMed]
- Chadwick, O.A.; Derry, L.A.; Vitousek, P.M.; Huebert, B.J.; Hedin, L.O. Changing sources of nutrients during four million years of ecosystem development. Nature 1999, 397, 491–497. [Google Scholar] [CrossRef]
- Reynolds, R.; Belnap, J.; Reheis, M.; Lamothe, P.; Luiszer, F. Aeolian dust in Colorado Plateau soils: Nutrient inputs and recent change in source. Proc. Natl. Acad. Sci. USA 2001, 98, 7123–7127. [Google Scholar] [CrossRef] [Green Version]
- Jickells, T.D.; An, Z.S.; Andersen, K.K.; Baker, A.R.; Bergametti, G.; Brooks, N.; Cao, J.J.; Boyd, P.W.; Duce, R.A.; Hunter, K.A.; et al. Global iron connections between desert dust, ocean biogeochemistry, and climate. Science 2005, 308, 67–71. [Google Scholar] [CrossRef] [Green Version]
- Li, J.; Okin, G.S.; Alvarez, L.; Epstein, H. Quantitative effects of vegetation cover on wind erosion and soil nutrient loss in a desert grassland of southern New Mexico, USA. Biogeochemistry 2007, 85, 317–332. [Google Scholar] [CrossRef]
- Cappell, A.; Sanderman, J.; Thomas, M.; Read, A.; Leslie, C. The dynamics of soil redistribution and the implications for soil organic carbon accounting in agricultural south-eastern Australia. Glob. Change Biol. 2012, 18, 2081–2088. [Google Scholar] [CrossRef]
- Goudie, A.S.; Middleton, N.J. The changing frequency of dust storms through time. Clim. Change 1992, 20, 197–225. [Google Scholar] [CrossRef]
- Moulin, C.; Lambert, C.E.; Dulac, F.; Dayan, U. Control of atmospheric export of dust from North Africa by the North Atlantic Oscillation. Nature 1997, 387, 691. [Google Scholar] [CrossRef]
- Shaffer, G.; Lambert, F. In and out of glacial extremes by way of dust—Climate feedbacks. Proc. Natl. Acad. Sci. USA 2018, 115, 2026–2031. [Google Scholar] [CrossRef] [PubMed] [Green Version]
- Alizadeh Choobari, O.; Zawar-Reza, P.; Sturman, A. The wind of 120 days and dust storm activity over the Sistan Basin. J. Atmos. Res. 2014, 143, 328–341. [Google Scholar] [CrossRef]
- Mohammadpour, K.; Sciortino, M.; Kaskaoutis, D.G.; Rashki, A. Classification of synoptic weather clusters associated with dust accumulation over southeastern areas of the Caspian Sea (Northeast Iran and Karakum desert). Aeolian Res. 2022, 54, 100771. [Google Scholar] [CrossRef]
- Shao, Y.; Wyrwoll, K.-H.; Chappell, A.; Huang, J.; Lin, Z.; McTainsh, G.H.; Mikami, M.; Tanaka, T.Y.; Wang, X.; Yoon, S. Dust cycle: An emerging core theme in Earth system science. Aeolian Res. 2011, 2, 181–204. [Google Scholar] [CrossRef]
- Aziz, G.; Shamsipour, A.; Miri, M.; Safarrad, T. Synoptic and remote sensing analysis of dust events in southwestern Iran. Nat. Hazards 2012, 64, 1625–1638. [Google Scholar]
- Hosking, J.R.M.; Wallis, J.R. Some statistical useful in regional frequency analysis. Water Resour. Res. 1993, 29, 271–281. [Google Scholar] [CrossRef]
- Hosking, J.R.M.; Wallis, J.R. Regional Frequency Analysis an Approach Based on L-Moment; Cambridge University: Cambridge, UK, 1997. [Google Scholar]
- Rao, A.R.; Hamed, K.H. Regional frequency analysis of Wabash river flood data by L-moments. J. Hydrol. Eng. 1997, 2, 169–179. [Google Scholar] [CrossRef]
- Boughton, W.C. Flood estimation from short records. J. Hydraul. Div. 1976, 102, 241–253. [Google Scholar] [CrossRef]
- Zhang, S.; Li, X.; Zong, M.; Zhu, X.; Wang, R. Efficient kNN Classification with Different Numbers of Nearest Neighbors. IEEE Trans. Neural Netw. Learn. Syst. 2018, 29, 1774–1785. [Google Scholar] [CrossRef]
- Shahsavani, A.; Tobías, A.; Querol, X.; Stafoggia, M.; Abdolshahnejad, M.; Mayvaneh, F.; Guo, Y.; Hadei, M.; Hashemi, S.S.; Khosravi, A.; et al. Short-term effects of particulate matter during desert and non-desert dust days on mortality in Iran. Environ. Int. 2020, 134, 105299. [Google Scholar] [CrossRef] [PubMed]
- Baghbanan, P.; Ghavidel, Y.; Farajzadeh, M. Spatial analysis of spring dust storms hazard in Iran. Theor. Appl. Clim. 2019, 139, 1447–1457. [Google Scholar] [CrossRef]
- Rezazadeh, M.; Irannejad, P.; Shao, Y. Dust emission simulation with the WRF-Chem model using new surface data in the Middle East region. J. Earth Space Phys. 2013, 39, 191–212. [Google Scholar]
- Mesbahzadeh, T.; Salajeghe, A.; Sardoo, F.S.; Zehtabian, G.; Ranjbar, A.; Krakauer, N.Y.; Miglietta, M.M.; Mirakbari, M. Climatology of dust days in the Central Plateau of Iran. Nat. Hazards 2020, 104, 1801–1817. [Google Scholar] [CrossRef]
- Middleton, N. Variability and trends in dust storm frequency on decadal timescales: Climatic drivers and human impacts. Geosciences 2019, 9, 261. [Google Scholar] [CrossRef] [Green Version]
- Mohammadpour, K.; Sciortino, M.; Kaskaoutis, D.G. Classification of weather clusters over the Middle East associated with high atmospheric dust-AODs in West Iran. Atmos. Res. 2021, 259, 105682. [Google Scholar] [CrossRef]
- Ebrahimi, Z.; Khosroshahi, M.; Roustaei, F.; Mirakbari, M. Spatial and seasonal variations of sand-dust events and their relation to atmospheric conditions and vegetation cover in semi-arid regions of central Iran. Geoderma 2020, 365, 114225. [Google Scholar] [CrossRef]
Publisher’s Note: MDPI stays neutral with regard to jurisdictional claims in published maps and institutional affiliations. |
© 2022 by the authors. Licensee MDPI, Basel, Switzerland. This article is an open access article distributed under the terms and conditions of the Creative Commons Attribution (CC BY) license (https://creativecommons.org/licenses/by/4.0/).