
UV-Vis Spectrophotometer as an Alternative Technique for the Determination of Hydroquinone in Vinyl Acetate Monomer

Abstract
:1. Introduction
2. Materials and Methods
2.1. Principle
2.2. Apparatus
- (i)
- Spectrophotometer, absorbance at 293 nm; UV 1800 Spectrophotometer (Shimadzu Corporation, Kyoto, Japan).
- (ii)
- Volumetric Flask, 50 mL and 100 mL capacity.
- (iii)
- Pipets or Auto-pipets, 1 mL or 2 mL.
- (iv)
- Quartz cuvette; Material: Q, Path Length: 10 mm, Match Code: 6 (Starna Scientific Ltd., Ilford, UK).
2.3. Reagents
2.4. Methods
2.4.1. Calibration
2.4.2. Solution for Validation
2.4.3. Determination of HQ
3. Result and Discussion
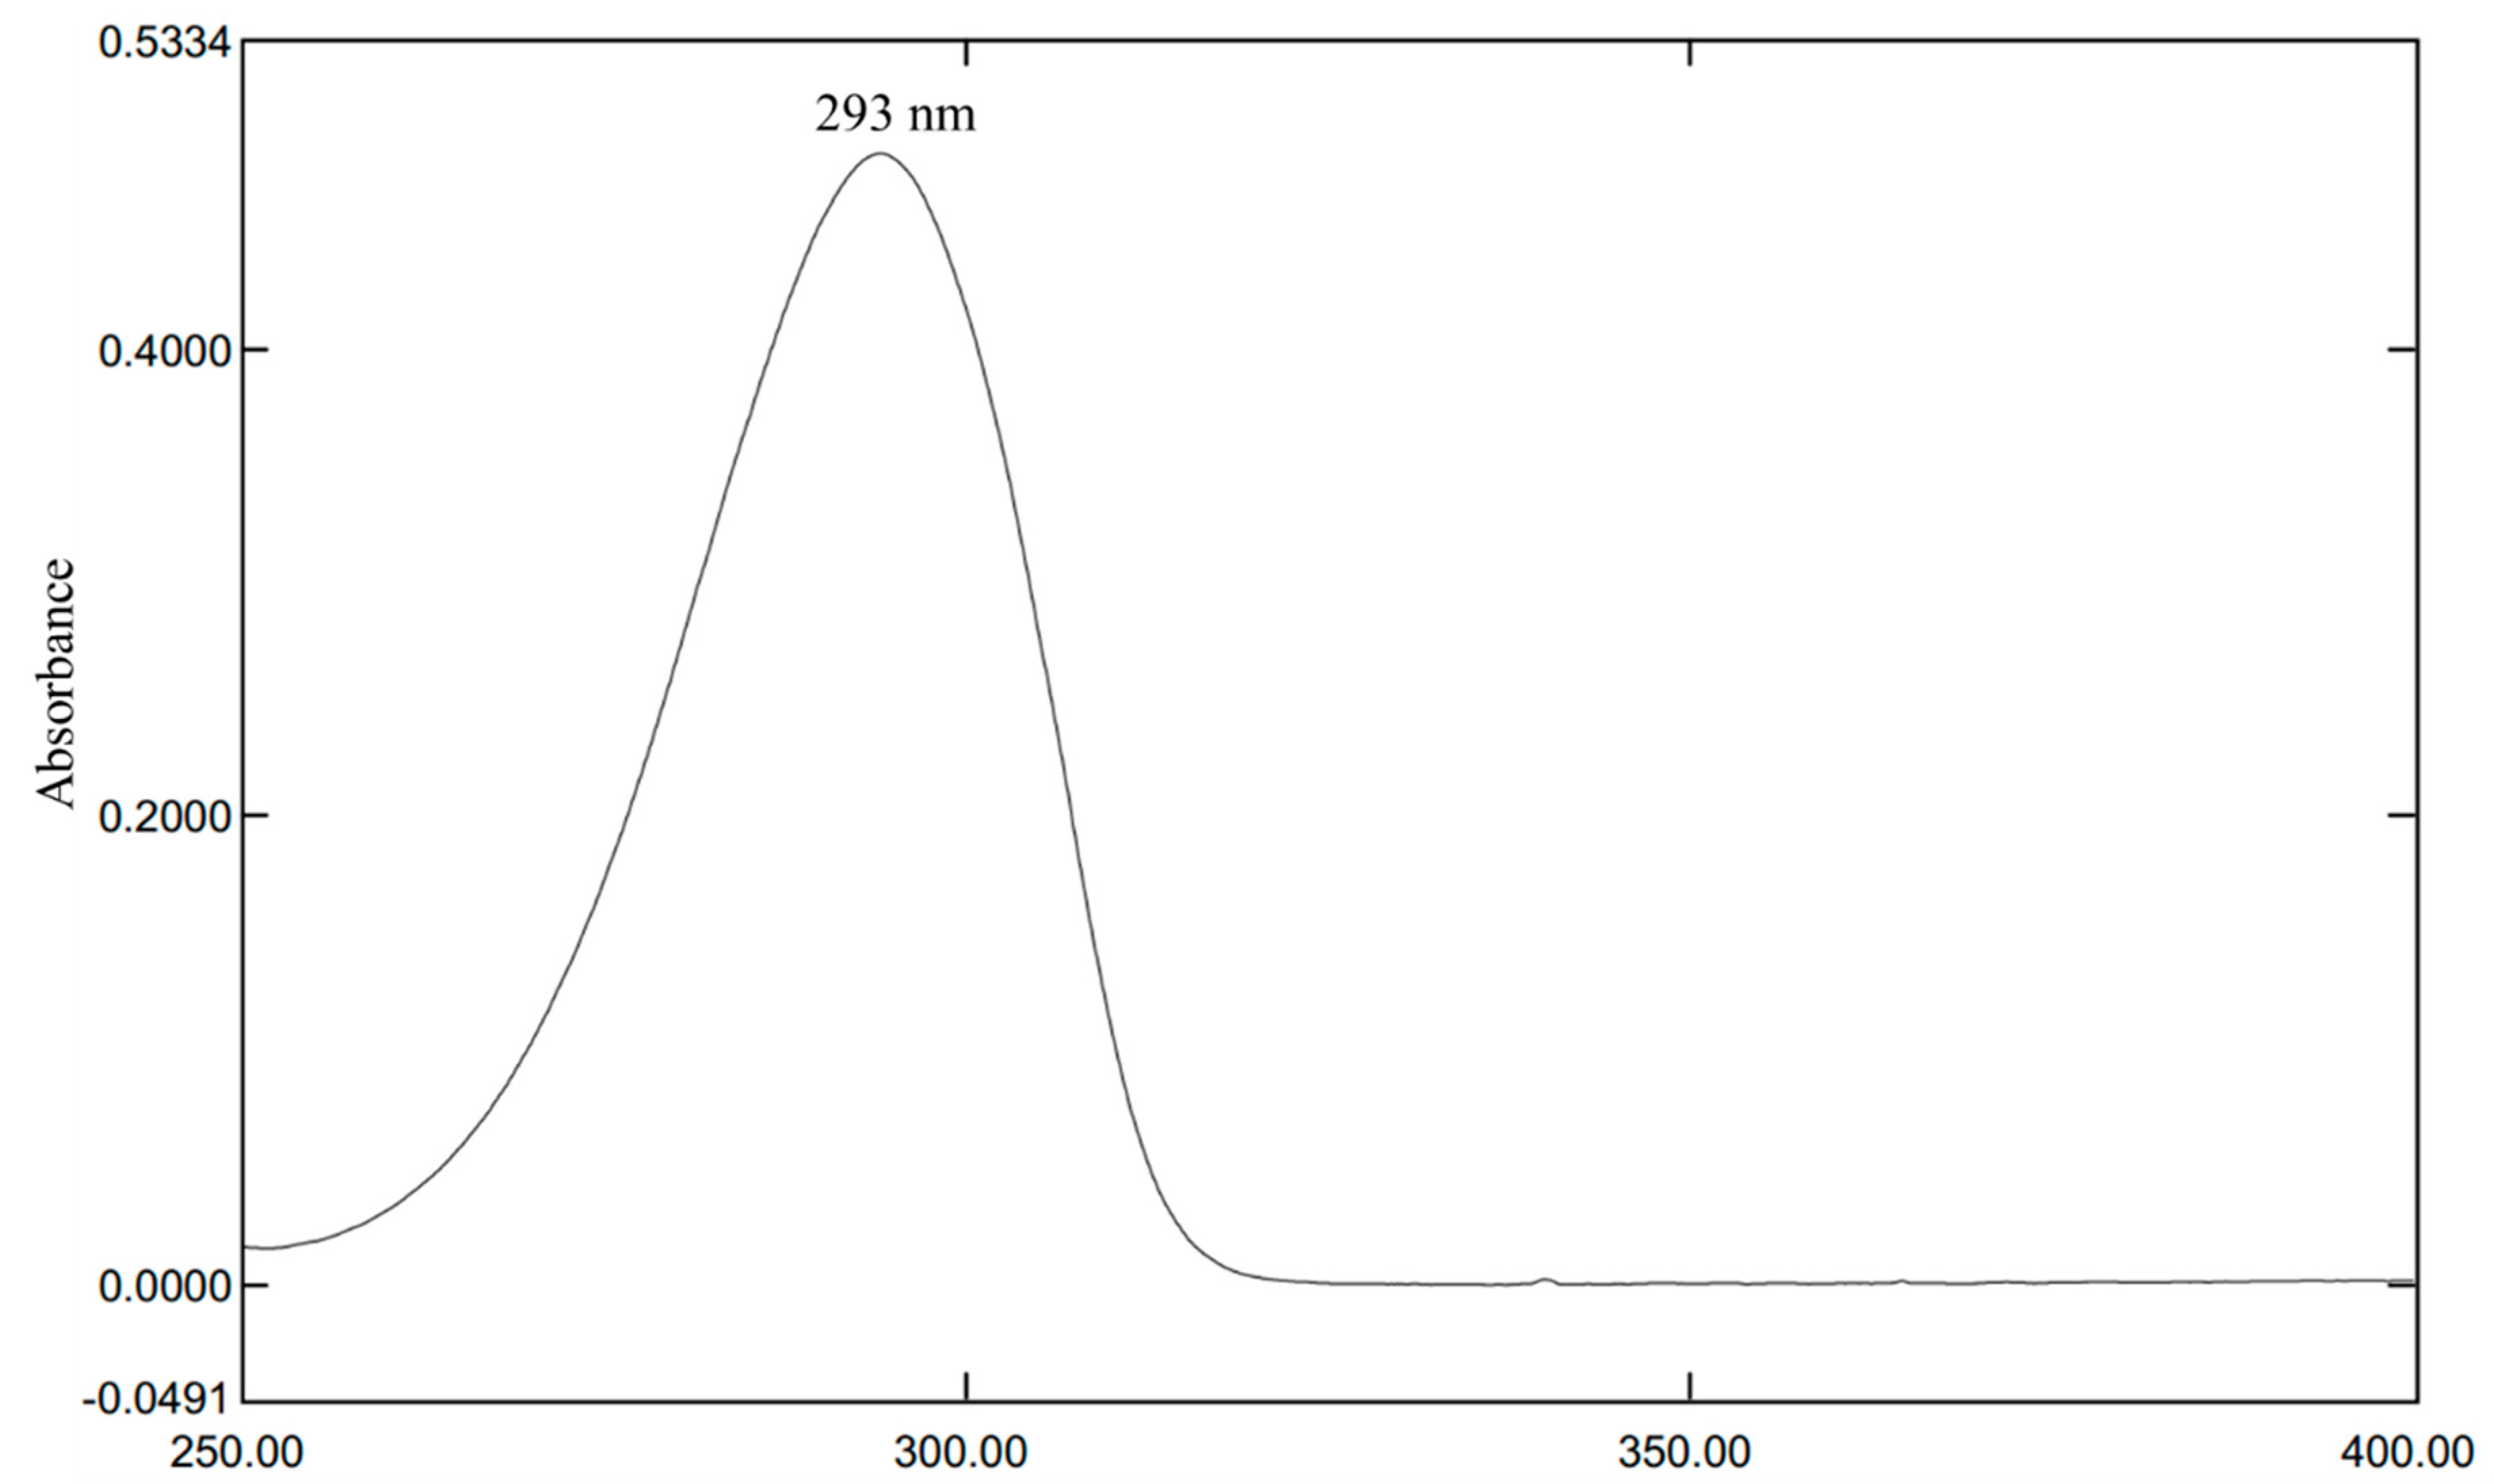
3.1. Determination of λmax of HQ
3.2. LOD (Limit of Detection)
= 0.126 + 3(0.017/√10) = 0.14 ppm
3.3. LOQ (Limit of Quantification)
= 0.293 + 10(0.022/√10) = 0.36 ppm
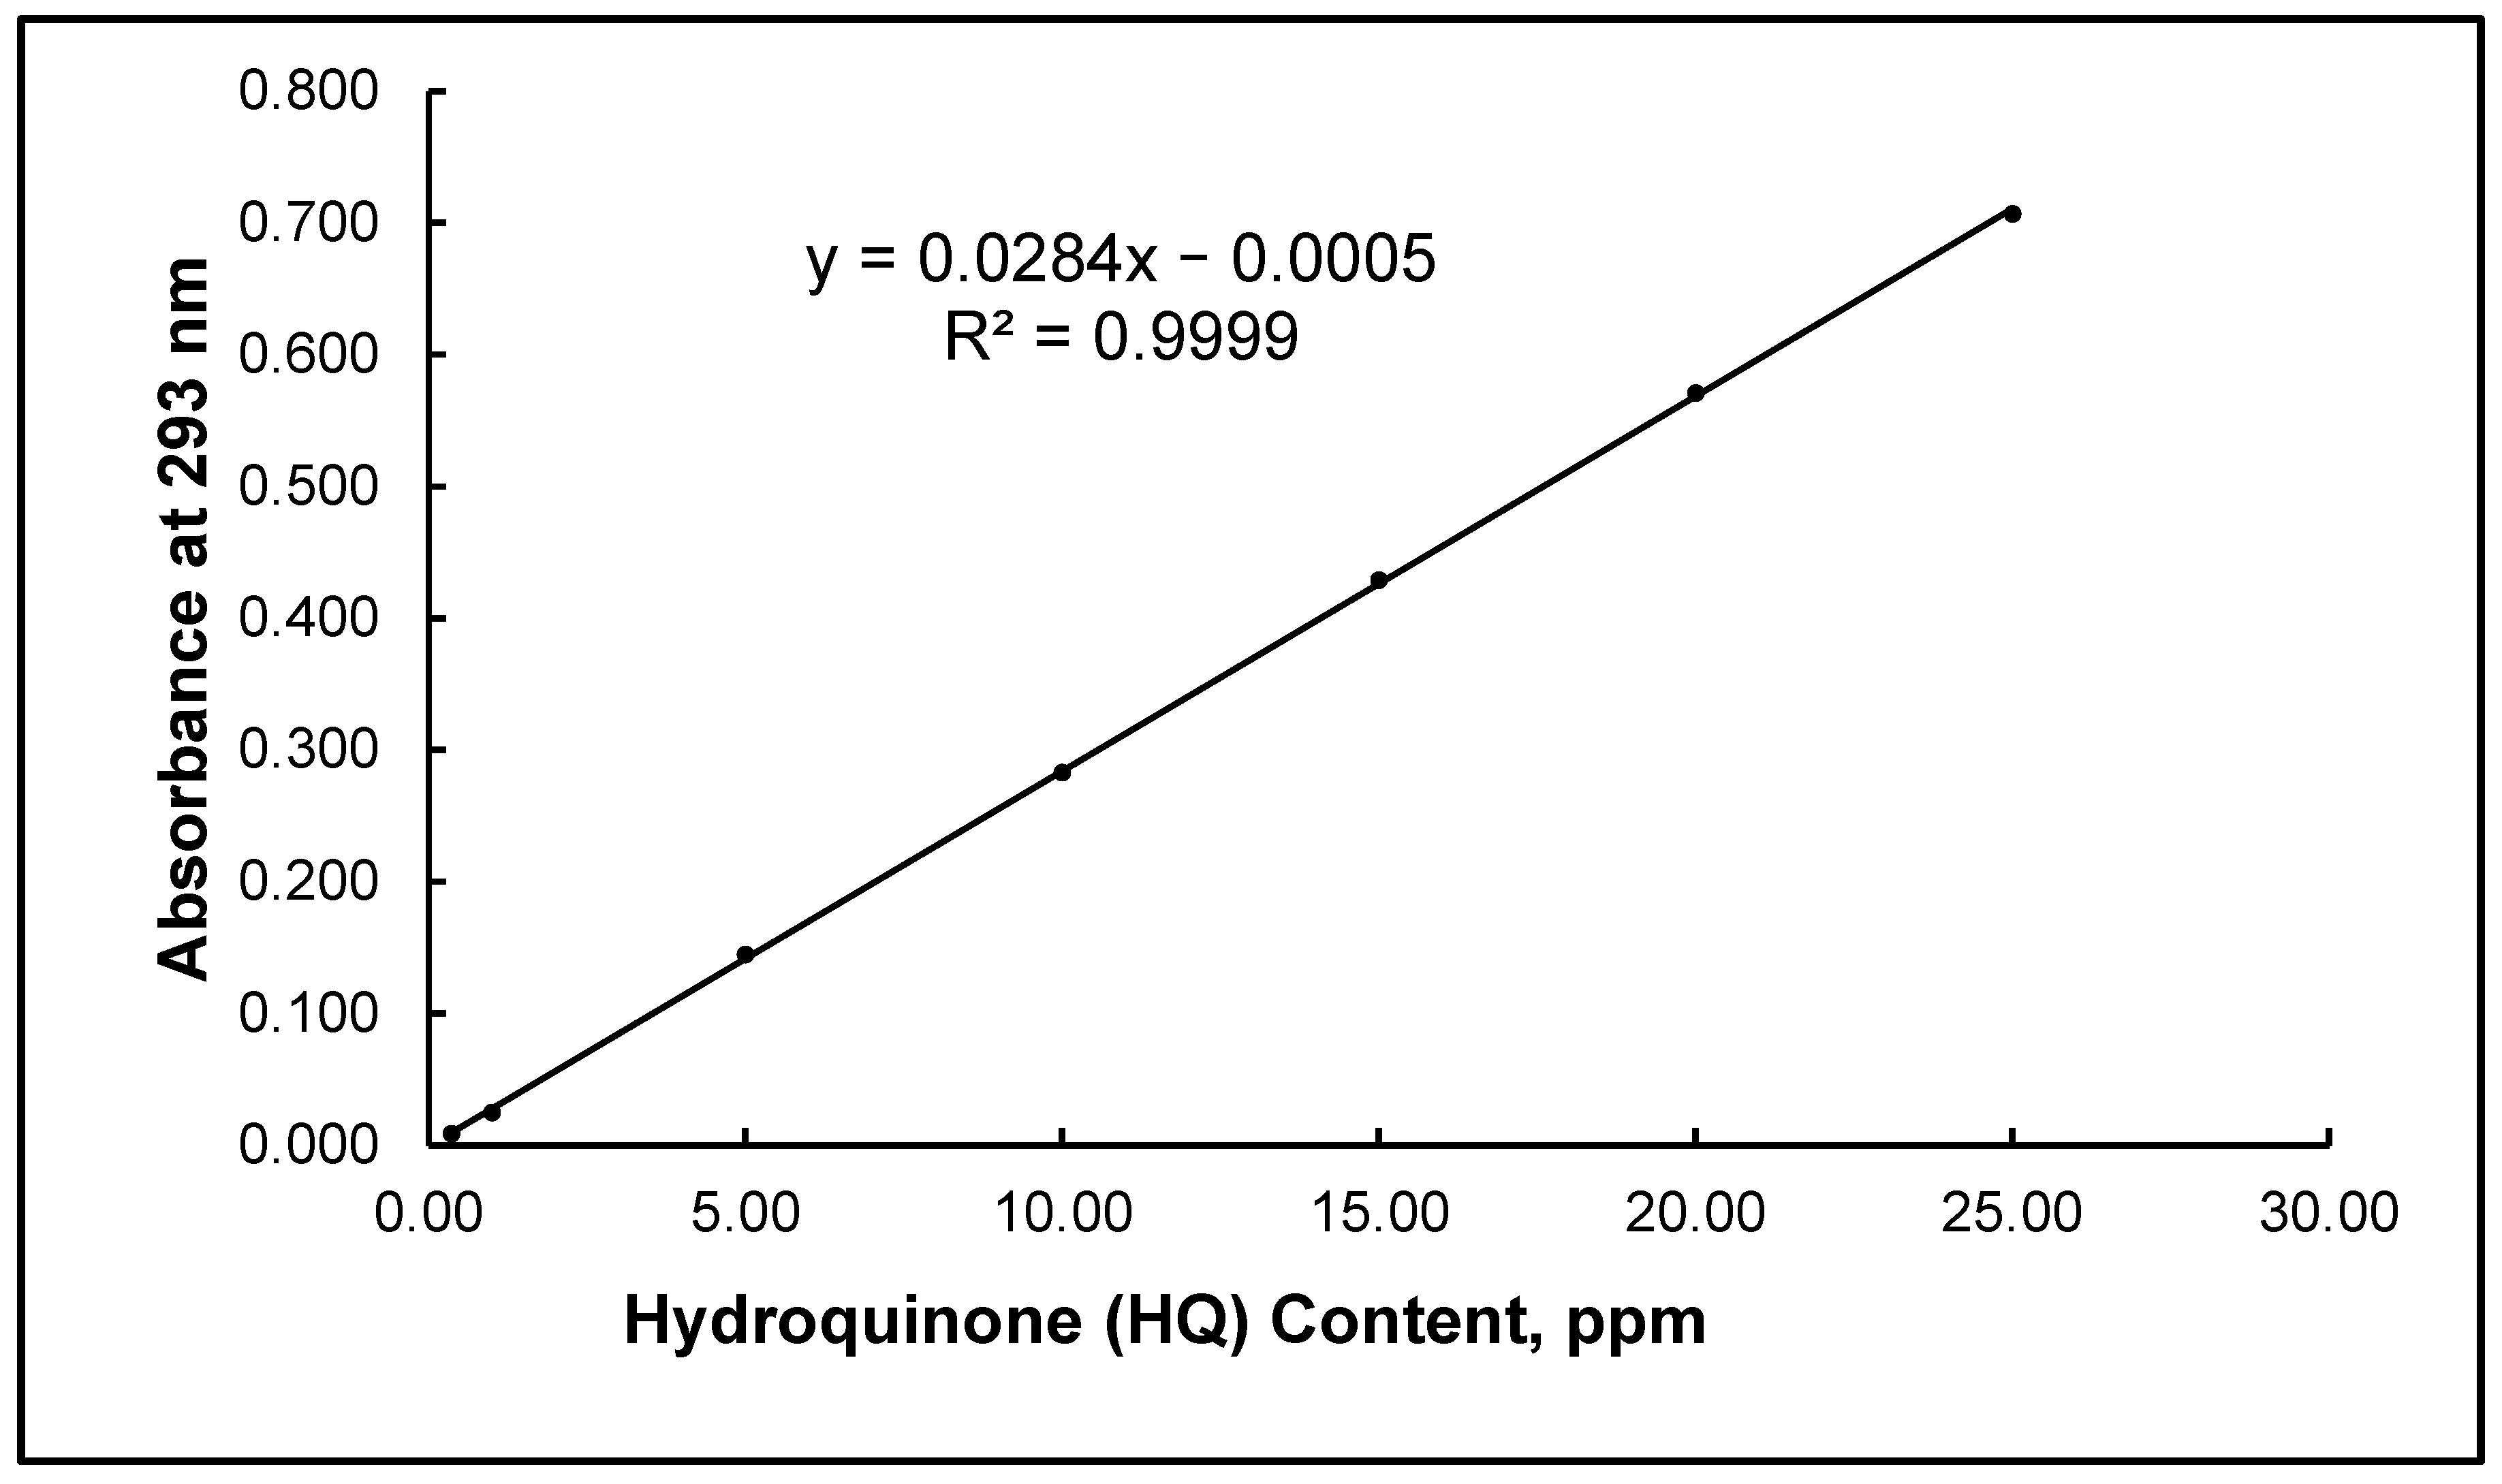
3.4. Calibration Curve (Linearity and Range)
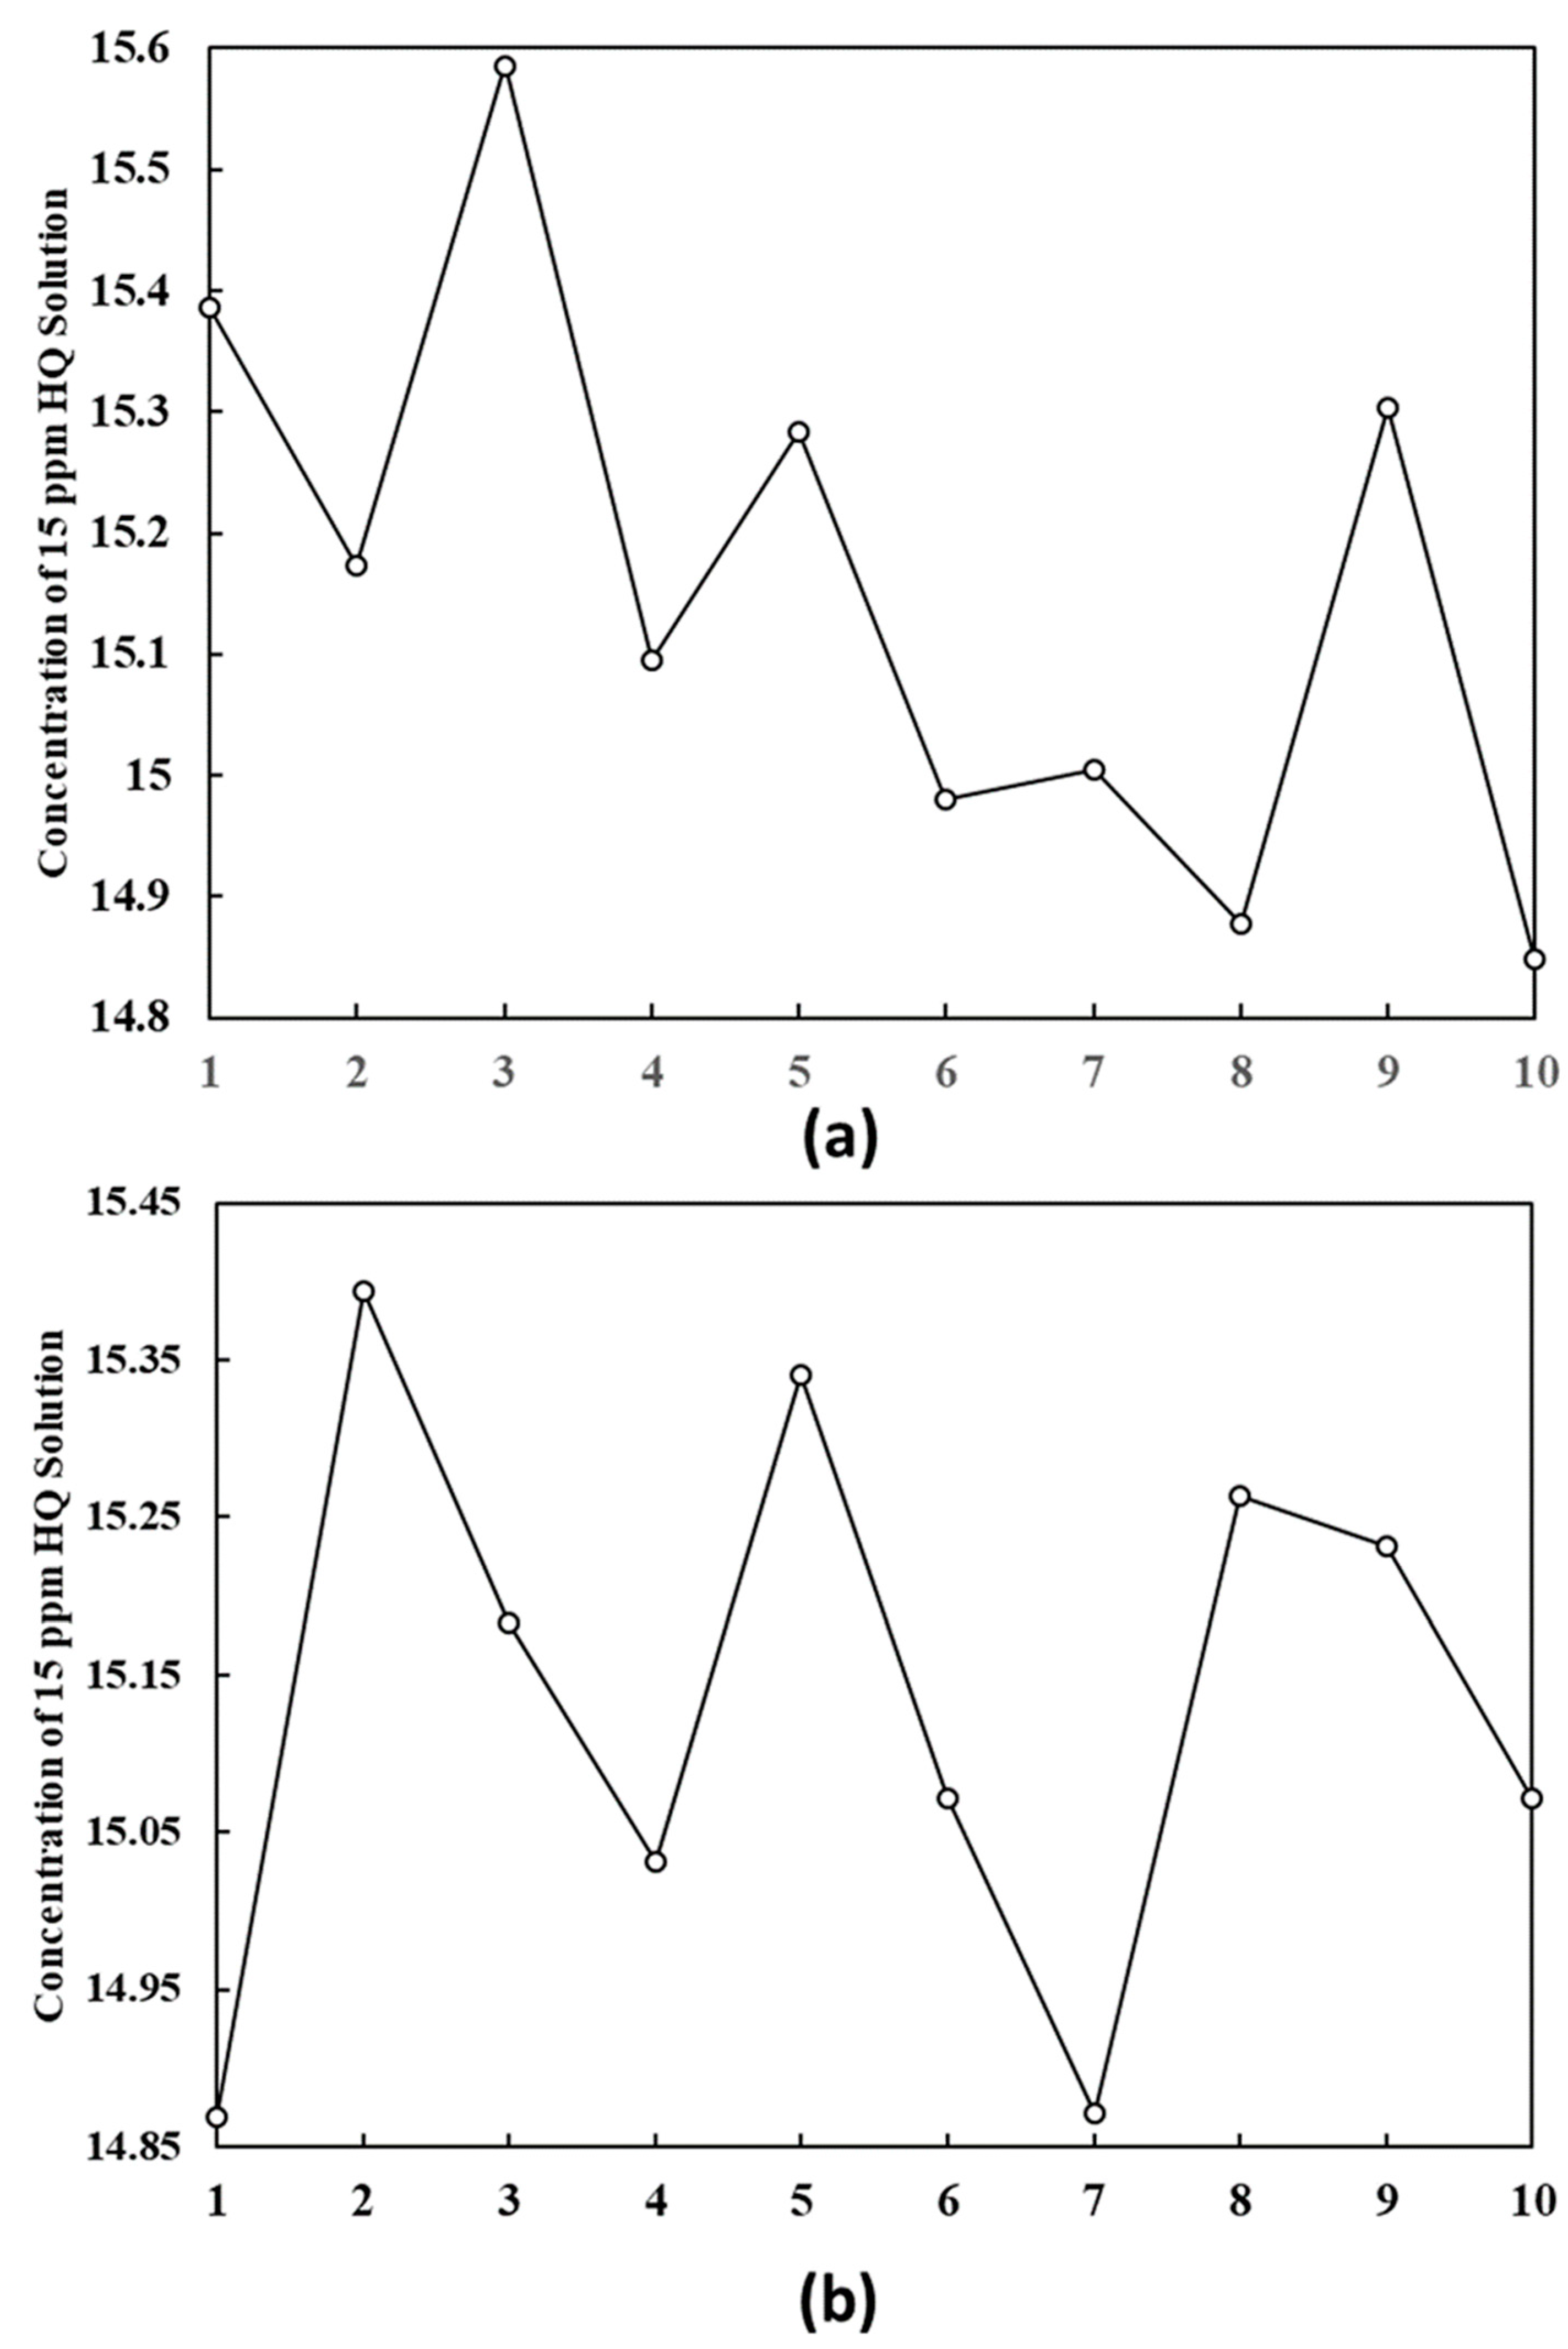
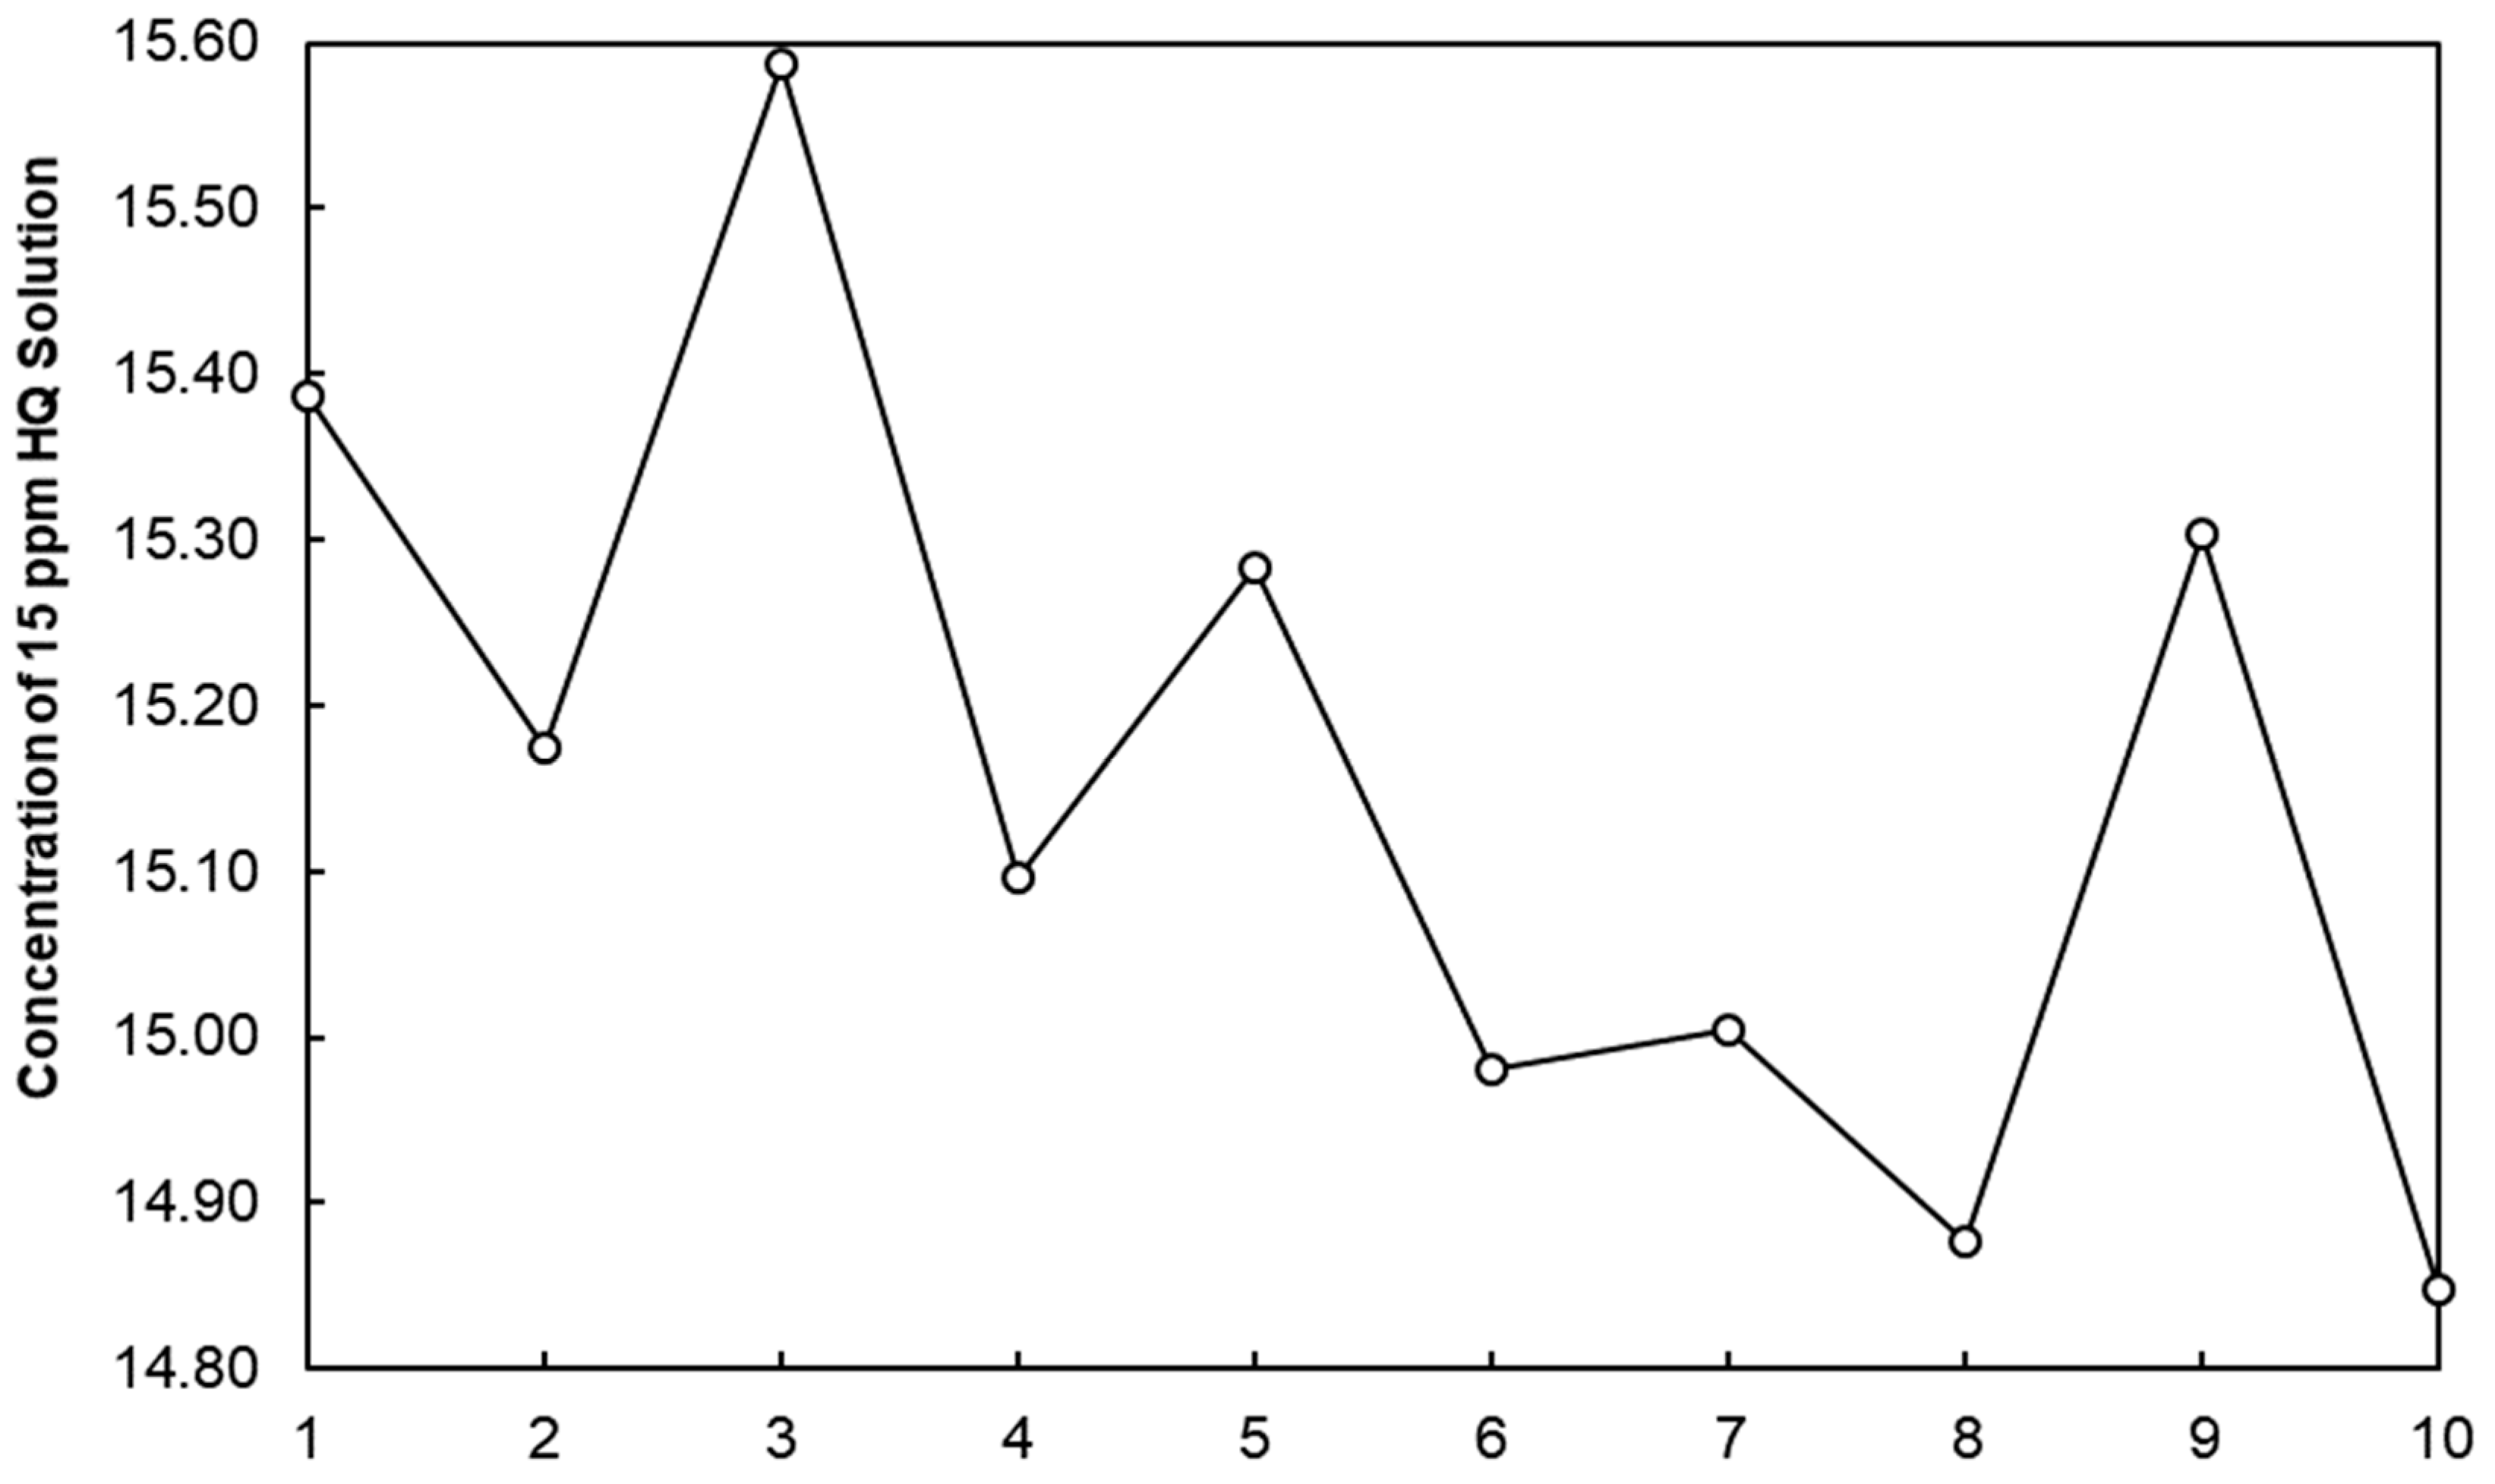
3.5. Precision
3.5.1. Repeatability Data and Intermediate Precision Data
3.5.2. Inter-Laboratory Comparison (Reproducibility Test)
3.6. Accuracy
3.6.1. Accuracy Data (Percentage of Spike Recovery)
3.6.2. Bias
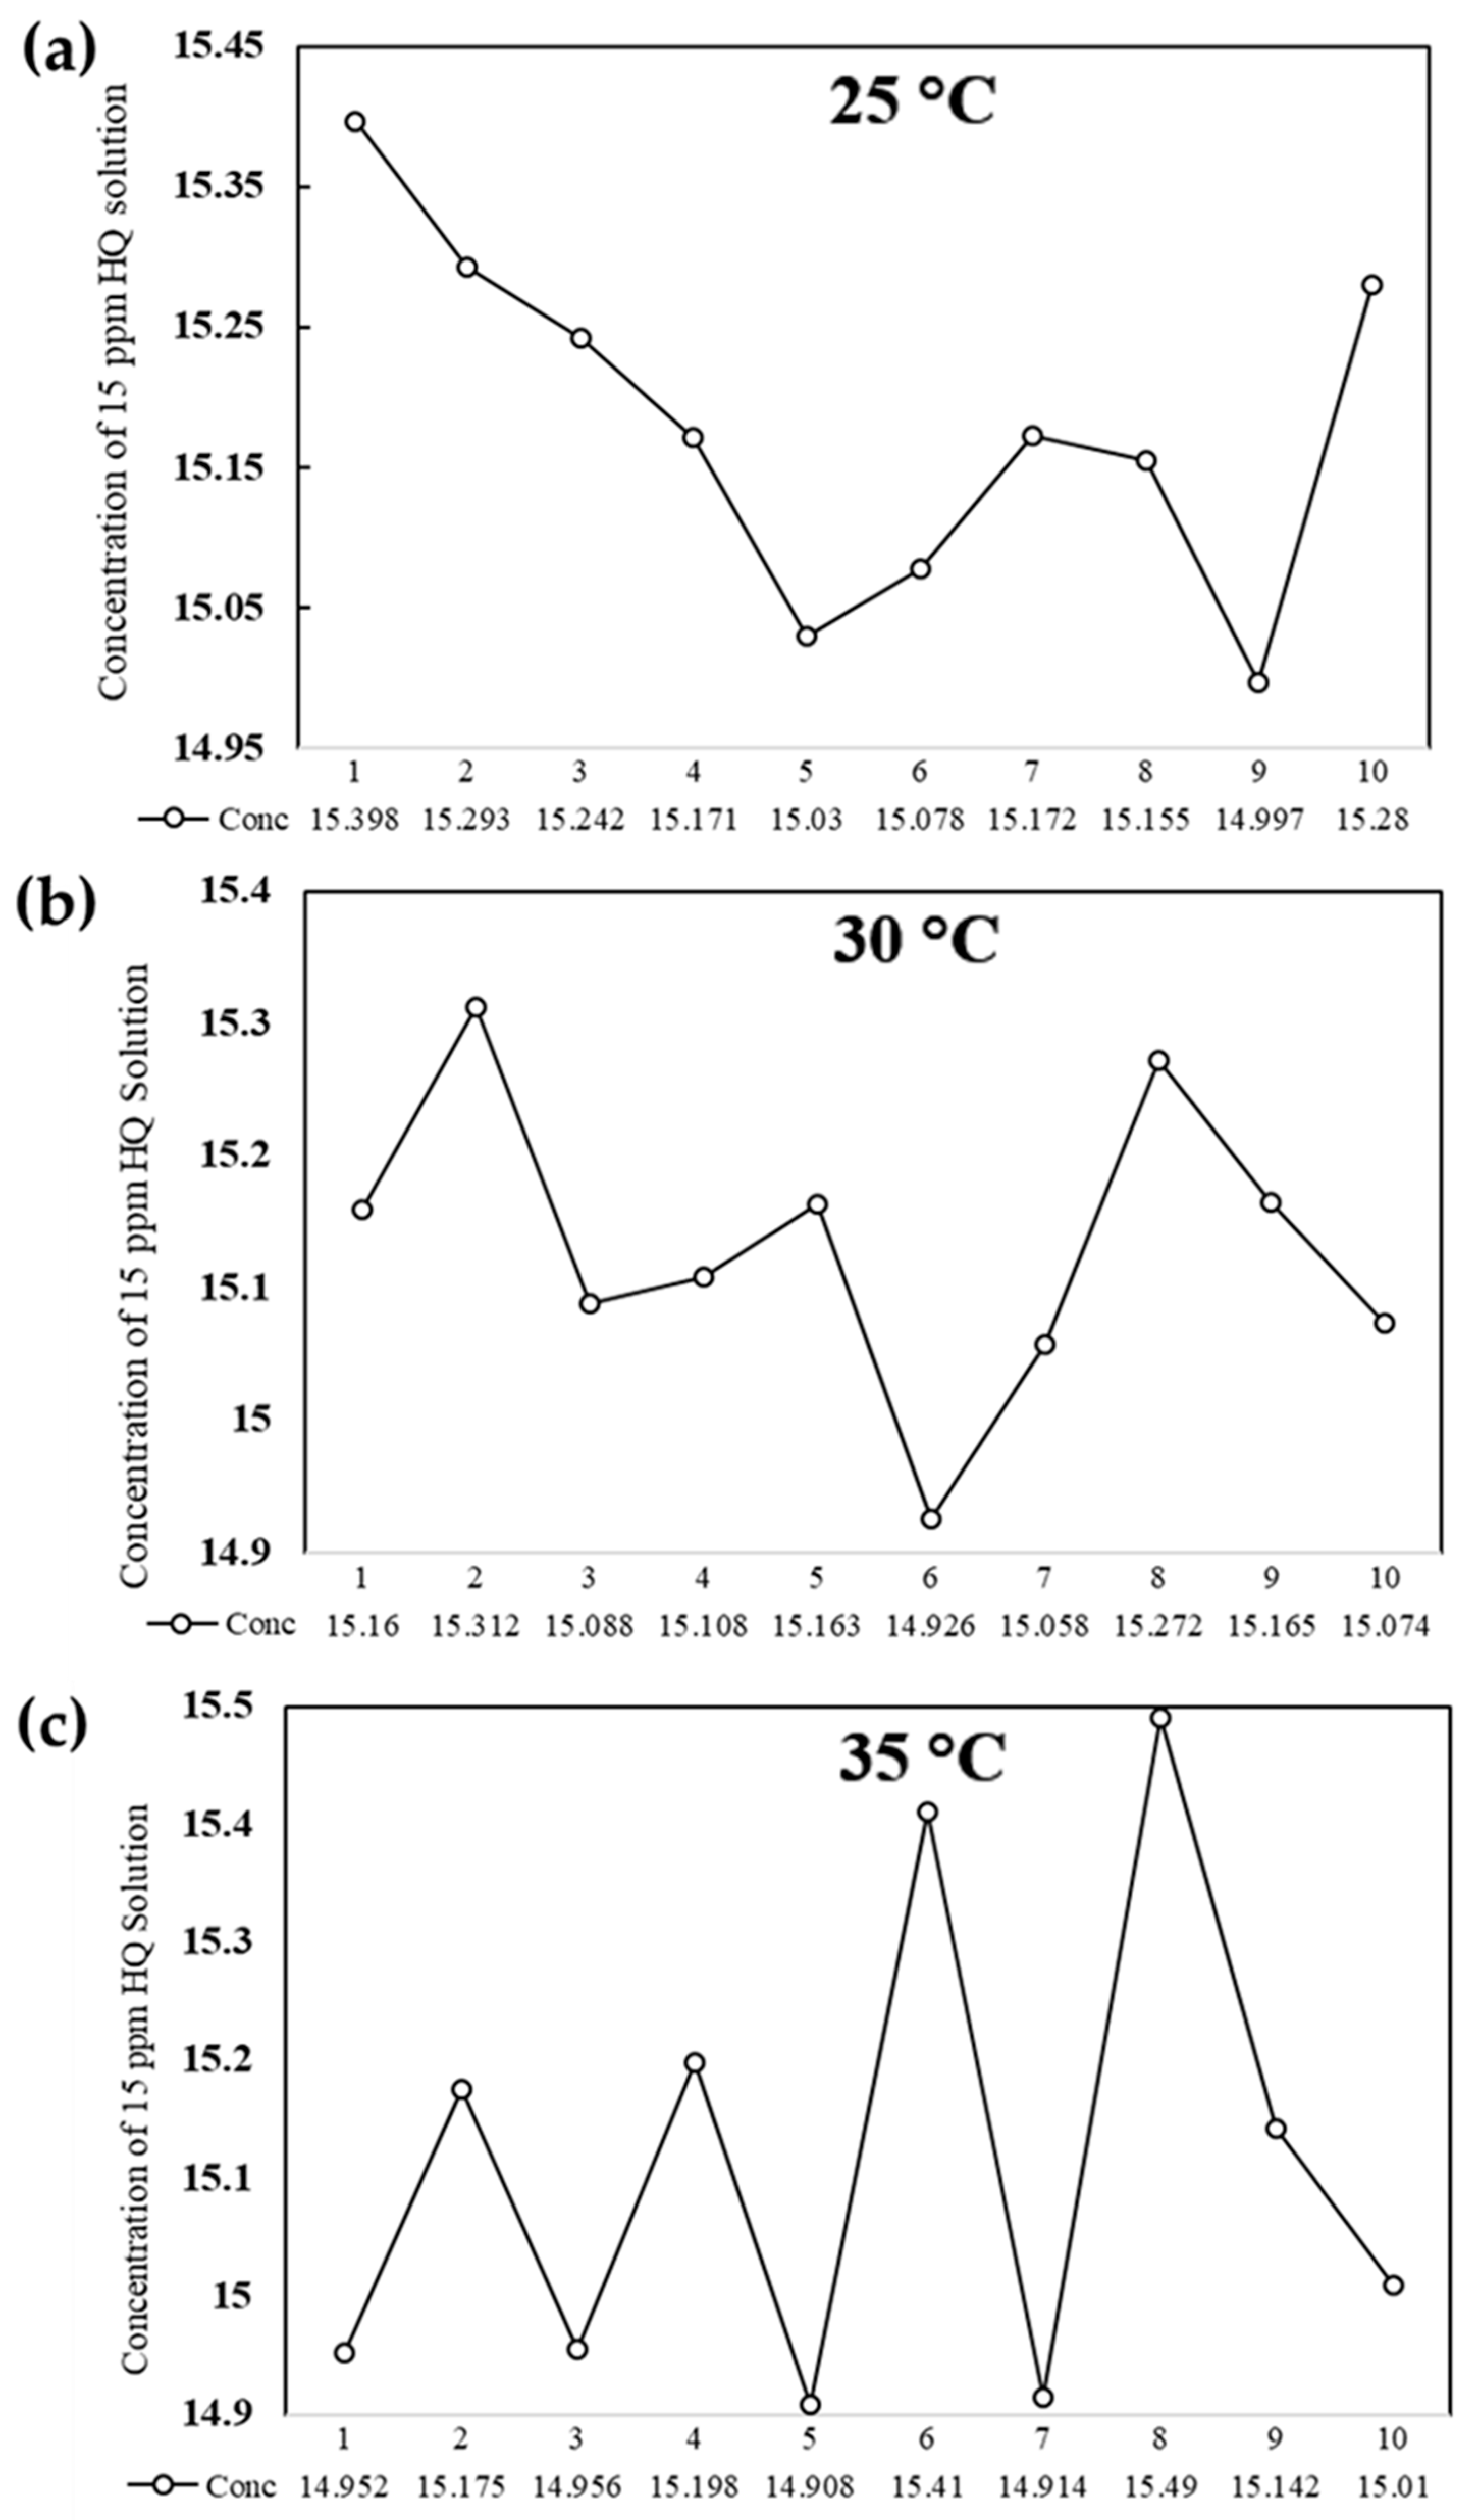
3.7. Robustness
3.8. Measurement Uncertainty (MU)
- −
- Balance (uncertainty: 0.0010 g)
- −
- Volumetric Flask (uncertainty: 0.0300 mL)
- −
- Pipette (uncertainty: 0.0004 mL)
- −
- Recovery (uncertainty: −0.5931)
- −
- − Certified reference material (uncertainty: 0.2887)
- −
- Calibration curve linearity (uncertainty: 1−0.9999 = 0.0001)
4. Conclusions
Author Contributions
Funding
Institutional Review Board Statement
Informed Consent Statement
Data Availability Statement
Acknowledgments
Conflicts of Interest
References
- Young, M.E.; Murray, M.; Cordiner, P. Stone Consolidants and Chemical Treatments in Scotland; Historic Scotland: Edinburg, TX, USA, 1999. [Google Scholar]
- Amann, M.; Minge, O. Biodegradability of Poly(vinyl acetate) and Related Polymers. Adv. Polym. Sci. 2012, 245, 137–172. [Google Scholar]
- Coggins, C.R.E.; Jerome, A.M.; Lilly, P.D.; McKinney, W.J.; Oldham, M.J. A comprehensive toxicological evaluation of three adhesives using experimental cigarettes. Inhal. Toxicol. 2013, 25, 6–18. [Google Scholar] [CrossRef] [PubMed]
- Van den Berg, G. Dutch-Type Cheeses. In Encyclopedia of Dairy Sciences; Roginski, H., Ed.; Elsevier: Oxford, UK, 2002; pp. 371–378. [Google Scholar]
- Staudinger, H.; Frey, K.; Starck, W. Hochmolekulare Verbindungen, 9. Mitteilung: Über Poly-vinylacetat und Poly-vinylalkohol. Ber. Dtsch. Chem. Ges. 1927, 60, 1782–1792. [Google Scholar] [CrossRef]
- Gustin, J.L.; Laganier, F. Understanding Vinyl Acetate Polymerization Accidents; Icheme Symposium 144. November 1998. Available online: https://www.icheme.org/media/10280/xiv-paper-30.pdf (accessed on 15 May 2022).
- Shaffei, K.A.; Moustafa, A.B.; Hamed, A.I. The Emulsion Polymerization of Each of Vinyl Acetate and Butyl Acrylate Monomers Using bis (2-ethylhexyl) Maleate for Improving the Physicomechanical Properties of Paints and Adhesive Films. Int. J. Polym. Sci. 2009, 2009, 731971. [Google Scholar] [CrossRef]
- Vinyl Acetate Council. Vinyl Acetate Safe Handling Guide. March 2019. Available online: www.lyondellbasell.com/globalassets/documents/chemicals-technical-literature/vam-safety-and-handling-guide-english-3293.pdf (accessed on 15 May 2022).
- U.S. Pharmacopeia. USP monograph- Hydroquinone and Determination of Hydroquinone in Cream. January 2007. Available online: www.pharmacopeia.cn (accessed on 15 May 2022).
- BP monograph- Tretinoin, Hydroquinone and Hydrocortisone Cream–BP 2018. Available online: https://www.pharmacopoeia.com (accessed on 15 May 2022).
- Elferjani, H.S.; Ahmida, N.H.S.; Ahmida, A. Determination of Hydroquinone in Some Pharmaceutical and Cosmetic Preparations by Spectrophotometric Method. Int. J. Sci. Res. 2017, 6, 2219. [Google Scholar]
- Agorku, E.; Waansa-Ansah, E.; Voegborlo, R.; Amegbletor, P. Is it possible to optimize the protein production yield by the generation of homomultimeric fusion enzymes? SpringerPlus 2016, 5, 316. [Google Scholar]
- Kaur, S.; Kaur, T.; Kaur, G.; Verma, S. Development and validation of a UV-spectrophotometric method for estimation of hydroquinone in bulk marketed cream and prepared NLC formulation. Int. J. Appl. Pharm. 2017, 9, 102–108. [Google Scholar] [CrossRef] [Green Version]
- Siddique, S.; Parveen, Z.; Ali, Z.; Zaheer, M. Qualitative and quantitative estimation of hydroquinone in skin whitening cosmetics. J. Cosmet. Dermatol. Sci. Appl. 2012, 2, 224–228. [Google Scholar] [CrossRef] [Green Version]
- Seokmin, J.; Yongseong, K. Analysis of hydroquinone and its ether derivatives by using micellar electrokinetic chromatography (MEKC). Bull. Korean Chem. Soc. 2005, 26, 819–822. [Google Scholar]
- Desiderio, C.; Ossicini, L.; Fanali, S. Analysis of hydroquinone and some of its ethers by using capillary electrochromatography. J. Chromatogr. A 2000, 887, 489–496. [Google Scholar] [CrossRef]
- Khoshneviszadeh, R.; Bazzaz, B.S.F.; Housaindokht, M.R.; EbrahimHabibi, A.; Rajabi, O. UV spectrophotometric determination and validation of hydroquinone in liposome. Iran. J. Pharm. Res. 2015, 14, 473–478. [Google Scholar] [PubMed]
- Jogarami, R.; Jain, P.; Sharma, S. Validated UV spectrophotometric method development for simultaneous estimation of tazarotene and hydroquinone in gel preparation. J. Pharm. Res. 2012, 5, 2273–2275. [Google Scholar]
- Metler Loledo Application Note: Hydroquinone in Cosmetics Using UV/VIS Spectroscopy. Available online: https://www.mt.com/kr/ko/home/supportive_content/ana_chem_applications/uvvis/M9113.html (accessed on 15 May 2022).
- British Pharmacopoeia Monograph. Tretinoin, Hydroquinone and Hydrocortisone Cream–BP 2018. Available online: https://www.pharmacopoeia.com/document/example-test-results?page=3&page-size=30&sort-by=issued-date (accessed on 15 May 2022).
- ASTM D2193-06; Standard Test Method for Hydroquinone in Vinyl Acetate. ASTM International: West Conshohocken, PA, USA, 2022.
- Swineharf, F. The Beer-Lambert Law. J. Chem. Educ. 1962, 39, 333. [Google Scholar] [CrossRef]
- Kocsis, L.; Herman, P.; Eke, A. The modified Beer–Lambert law revisited. Phys. Med. Biol. 2006, 51, N91. [Google Scholar] [CrossRef] [PubMed]
- Barwick, V. (Ed.) Planning and Reporting Method Validation Studies; A Supplement to Eurachem Guide on the Fitness for Purpose of Analytical Methods; Eurachem: Gembloux, Belgium, 2019. [Google Scholar]
- Magnusson, B.; Örnemark, U. (Eds.) Eurachem Guide: The Fitness for Purpose of Analytical Methods—A Laboratory Guide to Method Validation and Related Topics, 2nd ed.; Eurachem: Gembloux, Belgium, 2014; ISBN 978-91-87461-59-0. [Google Scholar]
- UNODC Guideline: Guidance for the Validation of Analytical Methodology and Calibration of Equipment used for Testing of Illicit Drugs in Seized Materials and Biological Specimens—ST/NAR/41; Laboratory and Scientific Section United Nations Office on Drugs and Crime: Vienna, Austria, 2009; ISBN 978-92-1-148243-0.
- ICH Guideline Validation of Analytical Procedures: Text and Methodology Q2 (R1). International Conference on Harmonization of Technical Requirements for Registration of Pharmaceuticals for Human Use, Version 4. 2005. Available online: https://www.scirp.org/(S(i43dyn45teexjx455qlt3d2q))/reference/ReferencesPapers.aspx?ReferenceID=1584467 (accessed on 15 May 2022).
- 2002/657/EC—Council Directive 96/23/EC concerning the performance of analytical methods and the interpretation of results. Off. J. Eur. Commun. 2002, 221, 8–36.


| Absorbance of Sample | Experimental Concentration of HQ, ppm |
|---|---|
| 0.005 | 0.142 |
| 0.006 | 0.167 |
| 0.005 | 0.106 |
| 0.005 | 0.116 |
| 0.005 | 0.131 |
| 0.005 | 0.115 |
| 0.005 | 0.118 |
| 0.005 | 0.125 |
| 0.005 | 0.123 |
| 0.005 | 0.120 |
| Mean | 0.126 |
| Standard Deviation (SD) | 0.017 |
| Absorbance of Sample | Experimental Concentration of HQ, ppm |
|---|---|
| 0.006 | 0.264 |
| 0.007 | 0.316 |
| 0.007 | 0.293 |
| 0.007 | 0.293 |
| 0.006 | 0.271 |
| 0.006 | 0.267 |
| 0.008 | 0.325 |
| 0.007 | 0.318 |
| 0.007 | 0.289 |
| 0.007 | 0.290 |
| Mean | 0.293 |
| Standard Deviation (SD) | 0.022 |
| Content | Result |
|---|---|
| Average Content of HQ (ppm) of 20 Nos | 15.14 |
| Standard Deviation (SD) of 20 Nos | 0.21 |
| %RSD of 20 Nos measurements | 1.36% |
| Participant Laboratory | Obtained Result, ppm | Z Score = (Lab Result—Mean)/SD | Remarks |
|---|---|---|---|
| LAB A | 15.44 | 0.167 | Satisfactory |
| LAB B | 15.75 | 0.906 | Satisfactory |
| LAB C | 14.92 | −1.073 | Satisfactory |
| Mean value | 15.37 | Acceptance Criteria: Z score ≤ 2.0 | |
| Standard Deviation | 0.4194 | ||
| Sample Details | Absorbance | Experimental Concentration | Mean Value | % Spiked Recovery * |
|---|---|---|---|---|
| Sample | 0.438 | 15.382 | 15.372 | Spike recovery of Hydroquinone = (17.399 − 15.372)/2 =101.35% |
| 0.438 | 15.381 | |||
| 0.437 | 15.366 | |||
| 0.437 | 15.371 | |||
| 0.437 | 15.363 | |||
| 0.438 | 15.372 | |||
| 0.437 | 15.370 | |||
| Spiked Sample | 0.492 | 17.287 | 17.399 | |
| 0.487 | 17.102 | |||
| 0.502 | 17.650 | |||
| 0.500 | 17.561 | |||
| 0.494 | 17.379 | |||
| 0.495 | 17.385 | |||
| 0.494 | 17.430 |
| Theoretical Concentration, ppm | Absorbance | Experimental Concentration, ppm | Mean Value | % Bias |
|---|---|---|---|---|
| 12 | 0.353 | 12.400 | 12.086 | 0.72% |
| 0.347 | 12.182 | |||
| 0.341 | 11.957 | |||
| 0.338 | 11.860 | |||
| 0.341 | 11.966 | |||
| 0.345 | 12.091 | |||
| 0.346 | 12.147 | |||
| 15 | 0.430 | 15.090 | 15.173 | 1.16% |
| 0.425 | 14.928 | |||
| 0.427 | 14.995 | |||
| 0.432 | 15.170 | |||
| 0.438 | 15.397 | |||
| 0.440 | 15.443 | |||
| 0.432 | 15.190 | |||
| 18 | 0.506 | 17.798 | 17.959 | −0.23% |
| 0.517 | 18.187 | |||
| 0.521 | 18.302 | |||
| 0.508 | 17.857 | |||
| 0.508 | 17.863 | |||
| 0.505 | 17.744 | |||
| 0.511 | 17.960 | |||
| Mean | 0.55% |
| Sources of Uncertainty | Standard Uncertainty, δ | Divisor, x | Relative Uncertainty |
|---|---|---|---|
| Repeatability | 0.0751 | 15.15 | 0.0050 |
| Volumetric Flask | 0.0300 | 50.00 | 0.0006 |
| Balance | 0.0010 | 0.0500 | 0.0200 |
| Auto Pipette | 0.0004 | 1.000 | 0.0004 |
| Purity of CRM | 0.2887 | 99.40 | 0.0029 |
| Recovery % | −0.5931 | 100.00 | −0.0059 |
| Linearity curve | 0.0001 | 1.00 | 0.0001 |
| combined relative uncertainty | 0.022 | ||
| expanded uncertainty | 0.656 | ||
| % expanded uncertainty | 4.33 | ||
Publisher’s Note: MDPI stays neutral with regard to jurisdictional claims in published maps and institutional affiliations. |
© 2022 by the authors. Licensee MDPI, Basel, Switzerland. This article is an open access article distributed under the terms and conditions of the Creative Commons Attribution (CC BY) license (https://creativecommons.org/licenses/by/4.0/).
Share and Cite
Rashid, M.A.M.; Rahman, M.; Mahmud, A.O.; Morshed, A.S.M.; Haque, M.M.; Hossain, M.M. UV-Vis Spectrophotometer as an Alternative Technique for the Determination of Hydroquinone in Vinyl Acetate Monomer. Photochem 2022, 2, 435-447. https://doi.org/10.3390/photochem2020030
Rashid MAM, Rahman M, Mahmud AO, Morshed ASM, Haque MM, Hossain MM. UV-Vis Spectrophotometer as an Alternative Technique for the Determination of Hydroquinone in Vinyl Acetate Monomer. Photochem. 2022; 2(2):435-447. https://doi.org/10.3390/photochem2020030
Chicago/Turabian StyleRashid, Md Al Mamunur, Mofizur Rahman, ASM Obaidullah Mahmud, Ali Shazzad Mohammad Morshed, Md Masudul Haque, and Md Mobarak Hossain. 2022. "UV-Vis Spectrophotometer as an Alternative Technique for the Determination of Hydroquinone in Vinyl Acetate Monomer" Photochem 2, no. 2: 435-447. https://doi.org/10.3390/photochem2020030
APA StyleRashid, M. A. M., Rahman, M., Mahmud, A. O., Morshed, A. S. M., Haque, M. M., & Hossain, M. M. (2022). UV-Vis Spectrophotometer as an Alternative Technique for the Determination of Hydroquinone in Vinyl Acetate Monomer. Photochem, 2(2), 435-447. https://doi.org/10.3390/photochem2020030