Next Article in Journal
Die Geschichte der Gesundheitsvorsorge
Previous Article in Journal
High-Density Lipoprotein Dysfunction as a New Therapeutic Target
 
 
Cardiovascular Medicine is published by MDPI from Volume 28 Issue 1 (2025). Previous articles were published by another publisher in Open Access under a CC-BY (or CC-BY-NC-ND) licence, and they are hosted by MDPI on mdpi.com as a courtesy and upon agreement with Editores Medicorum Helveticorum (EMH).
Article

Posterior Probabilities in Sequential Testing Improve Clinical Cardiovascular Risk Prediction Using Carotid Total Plaque Area and C-Statistics

by
Michel Romanens
1,*,
Franz Ackermann
2,
Matthias Schwenkglenks
3,
Thomas Szucs
4 and
J. David Spence
5
1
Cantonal Hospital, Olten, Switzerland
2
Vascular Risk Foundation, Olten, Switzerland
3
Institute of Social and Preventive Medicine, University of Zurich, Zurich, Switzerland
4
Institute of Pharmaceutical Medicine, University of Basel, Basel, Switzerland
5
Stroke Prevention & Atherosclerosis Research Centre, London, ON, Canada
*
Author to whom correspondence should be addressed.
Cardiovasc. Med. 2011, 14(2), 53; https://doi.org/10.4414/cvm.2011.01565
Submission received: 23 November 2010 / Revised: 23 December 2010 / Accepted: 23 January 2011 / Published: 23 February 2011

Abstract

Background: Risk prediction for myocardial infarction currently uses global risk assessment tools (PROCAM, SCORE or NCEP III). Their sensitivity is however low (about 33%). Emerging risk assessment tools are increasingly applied, but the incremental value is debated. Aims: To develop a risk prediction model based on posterior test probabilities (PTP) and to determine the statistical significance of the incremental gain using Receiver Operating Characteristic (ROC) curve comparison in combination with the Bayes theorem. Methods: In a primary care cohort, both NCEP III and total carotid plaque area (TPA) were used to calculate 10-year risk, and combined posttest risk probabilities for myocardial infarction (TPA-PTP) were combined by using Bayes theorem. ROC curves were compared for NCEP III, TPA, and TPA-PTP. Results: A total of 684 subjects with a mean age of 50 years were followed for 3.3 ± 1.8 years. Thirteen myocardial infarctions occurred. Sensitivity was 31% for NCEP III and 62% for TPA >0.55 cm2 and 39% for TPA-PTP; specificity was 89%, 75% and 79% respectively (all p = NS). AUC was 0.68 for NCEP III and 0.75 for TPA-PTP (p = 0.0034). Net reclassification improvement analysis yielded a result of +18.25%. Conclusions: ROC curve comparison is a conservative approach to estimating the value of emerging risk assessment tools in the primary prevention of myocardial infarction. Despite a limited number of individuals and few myocardial infarctions that occurred during follow-up, TPA-PTP yielded a statistically significant incremental value over NCEP III. This was due to the integration of posttest risk calculation into risk prediction. PTP risk estimates using published sensitivities and specificities of an emerging test may be used to compare ROC curves and improve the assessment of the clinical utility of new emerging risk assessment tools.

Background

Traditionally, the identification of high risk subjects has been based on single cardiovascular risk factors. More recently, the aggregation of these risk factors into global risk calculators, e.g., the PROCAM SCORE [1], the EU SCORE [2] or the NCEP III / ATP III risk calculator [3] has been recommended. Unfortunately these risk calculators tend to have a low sensitivity and may miss up to two thirds of subjects who will experience a vascular event during the next ten years, if current thresholds defining a high coronary risk are used [1]. Thus there is a need for new risk stratification tools that can identify high risk subjects otherwise missed by global risk charts. These new or emerging risk stratification tools should however add significant and clinically meaningful information over and above the knowledge derived from risk charts. Several new tests for cardiovascular risk have been proposed, e.g., hsCRP [4], coronary calcium scoring [5] or carotid intima-to-media thickness (IMT [6]). These tests should however be tested themselves for their performance in predicting risk over and above risk derived from risk charts. Basically there are three ways to test a test: c statistics and receiver operating characteristic curve (ROC) analysis [7], relative risks and odds ratios (ODDS [8]), and post-test risk calculation based on Bayes theorem [9]. While some feel that ROC analysis is too hard for a new test to pass [8], others find relative risk ratios to be a too easy test to pass. From an epidemiological perspective it is often argued that relative risks below 2.0 have low clinical relevance, but relative risks between 1.2–2.0 are often statistically significant.
In this paper we apply the third approach to testing a new test. We use the principle of sequential testing, where the information from an accepted first test (e.g., risk charts) is used as the pretest probability and posttest risk is calculated using Bayes theorem and involving the sensitivity and specificity of the new, additional test. Further, in order to obtain an impression of the ability of TPA-PTP to reclassify subjects correctly into higher or lower risk categories, we performed a “net reclassification improvement” analysis [11].

Methods

Patients

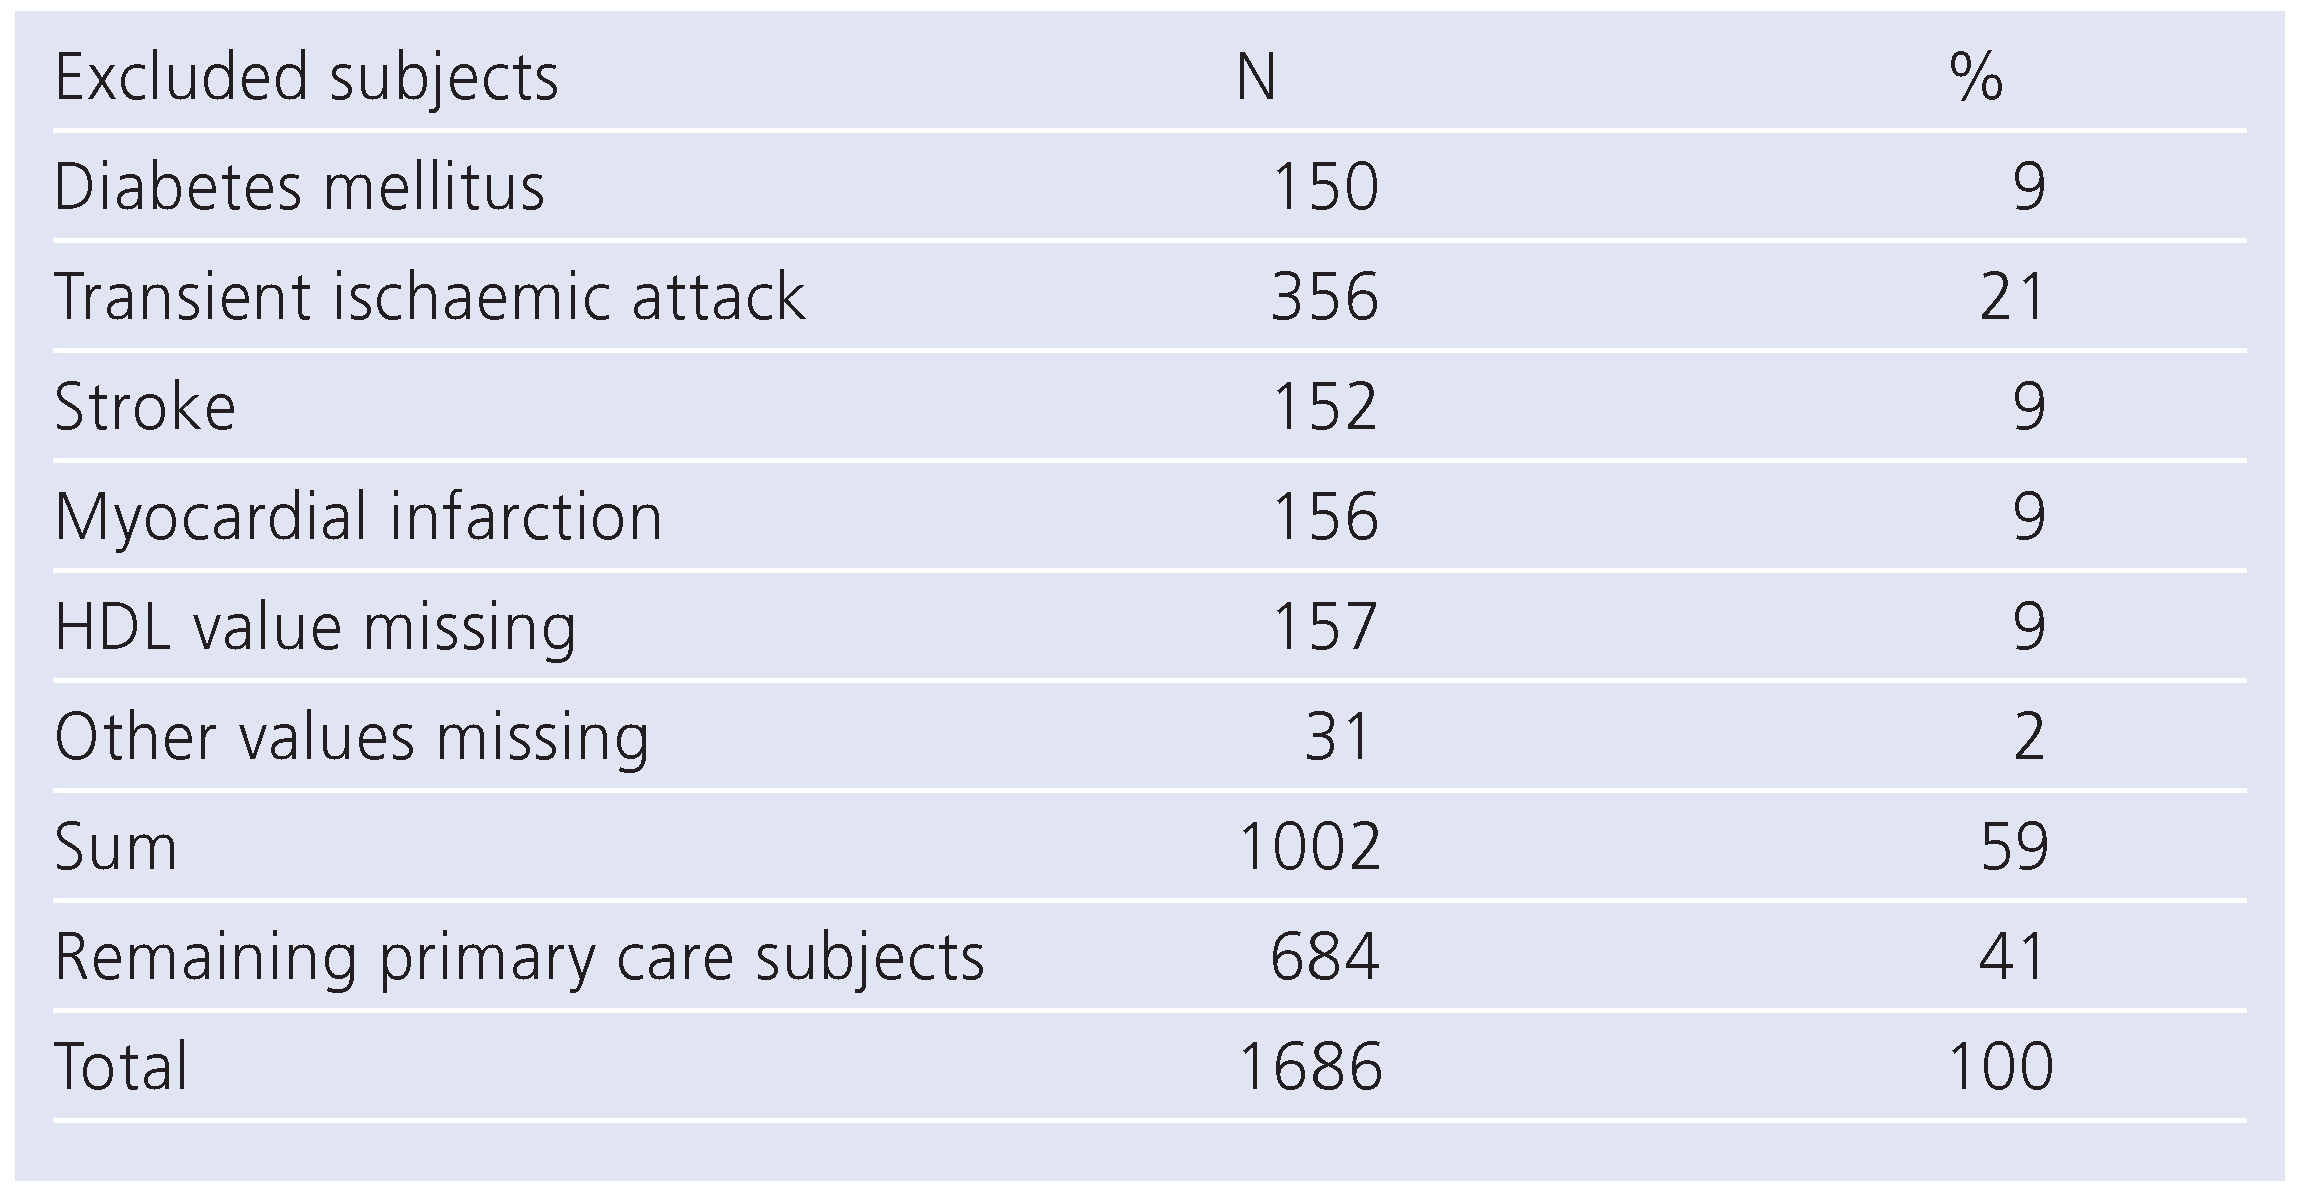
The patients for the London cohort were being followed up in the Premature Atherosclerosis Clinic and the Stroke Prevention Clinic of the University Campus of the London Health Sciences Center (London, Canada). The original London cohort consisted of 1686 subjects who were followed up for up to five years (mean, 2.5 ± 1.3 years [10]). From this cohort all subjects with known vascular disease, diabetes mellitus or missing laboratory values affecting the calculation of NCEP III-based risk were excluded (N = 1002, Table 1). The follow-up time for the non-excluded subjects (N = 684) was 3.3 ± 1.8 years.

Clinical and laboratory measurements

Blood lipids were measured after a 12-hour fast from whole blood samples using routine methods in the biochemistry laboratory of the London Health Science Center. Blood pressure was recorded in the sitting position using an automated device (DINAMAPP).

Risk assessment using NCEP III risk algorithm and outcome data

For each subject, NCEP III-based 10-year risk for myocardial infarction was calculated online (http://hp2010.nhlbihin.net/atpiii/calculator.asp?usertype=prof). The occurrence of myocardial infarction was either fatal or non-fatal and was assessed by death certificates or review of hospital records.

Imaging method and risk assessment using total plaque area of carotid arteries.

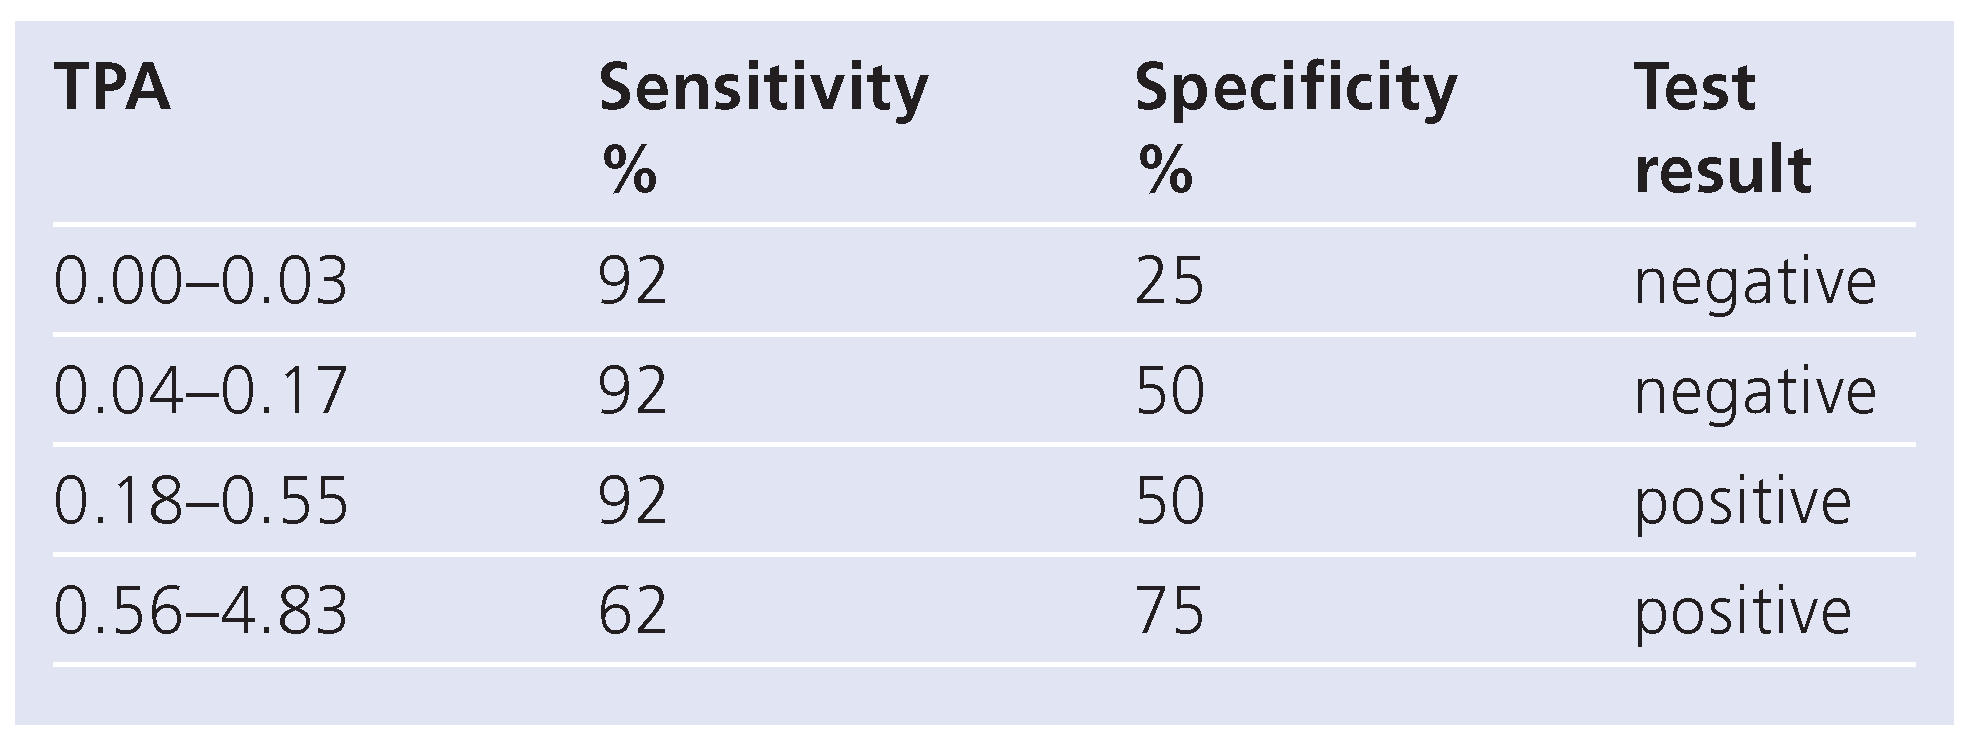
TPA is a measure of the total plaque burden found in both carotid arteries. Plaques are traced longitudinally, and the TPA is derived as the sum of all plaque areas detected during the imaging of both carotid arteries. (Example of a longitudinal plaque tracing: Figure 1). TPA showed an intraobserver and interobserver reliability (intraclass correlation) of K = 0.94 and K = 0.85 respectively [10]. The cutoff of the TPA test for being positive was set at ≥0.18 cm2. TPA 0.18–0.55 cm2 is the amount of TPA of the third quartile of the group observed (N = 684), TPA 0.56–4.83 cm2 is the 4th quartile. There was only one AMI in the 1st and 2nd quartile, so the use of our cutoff for positivity appears justified.

Statistical methods

We use the principle of sequential testing, where the information from an accepted first test (e.g., risk charts) is used as the pretest probability and posttest risk is calculated using Bayes theorem and involving the sensitivity and specificity of the new, additional test. We apply this approach to a prevention clinic setting, where a cohort of 684 originally healthy subjects from the London cohort [10] suffered 13 myocardial infarctions during a follow-up of 3.3 years. All subjects were tested with NCEP III risk charts (3) and with the total plaque area (TPA), a measure of carotid plaque burden. TPA posttest probabilities (TPA-PTP) were calculated.
Data were compiled in a Microsoft® Office Excel data sheet (Microsoft, Redmond, WA, USA) and further analysed with Analyze-itTM, Ltd, version 2.03. Posttest probabilities were calculated as follows: for each patient a pretest probability was calculated from NCEP III, which gave the 10-year risk for myocardial infarction in percent. Results of atherosclerosis imaging (TPA) were used to assess the level of sensitivity and specificity of these tests according to Table 2. Posttest risk was calculated as follows:
  • Incaseofanegativetest(TPA <0.18 cm2):
  • PTPneg:[PV x(1−SE)]/[PV x(1–SE)+SP x(1–PV)]
  • Incaseofapositivetest(TPA≥0.18cm2):
  • PTPpos:(PVxSE)/[PVxSE+(1–PV)x(1–SP)]
PTP pos = posttest probability for a disease if the test is positive [pathologic]; PTP neg = posttest probability for a disease if the test is negative [normal]; PV = pretest probability [or prevalence {PV}] for a disease; SE = sensitivity; SP = specificity.). Our posttest risk calculator is also available at http://scopri.ch/posttestcalculators1.html.
ROC curves for NCEP III, TPA, TPA-PTP were compared using the DeLong method for comparison of ROC curves [13]. Further, we used Net Reclassification Improvement to assess the clinical relevance of TPA posttest probability to reclassify subjects. For this purpose we counted in subjects with an event during follow-up a reclassification from a lower to a higher risk category (defined as 0–9.99% = low risk, 10–19.99% = intermediate risk, 20.00% and more = high risk) as +1, a reclassification from higher to lower risk as –1 and no reclassification as 0. Similarly, in subjects without an event, correct reclassification to a lower risk category using TPA posttest probability was counted as +1, upward reclassification into a higher risk category as –1 and no reclassification as 0.
For statistical analysis the level of significance was set at p <0.05.

Results

Patients

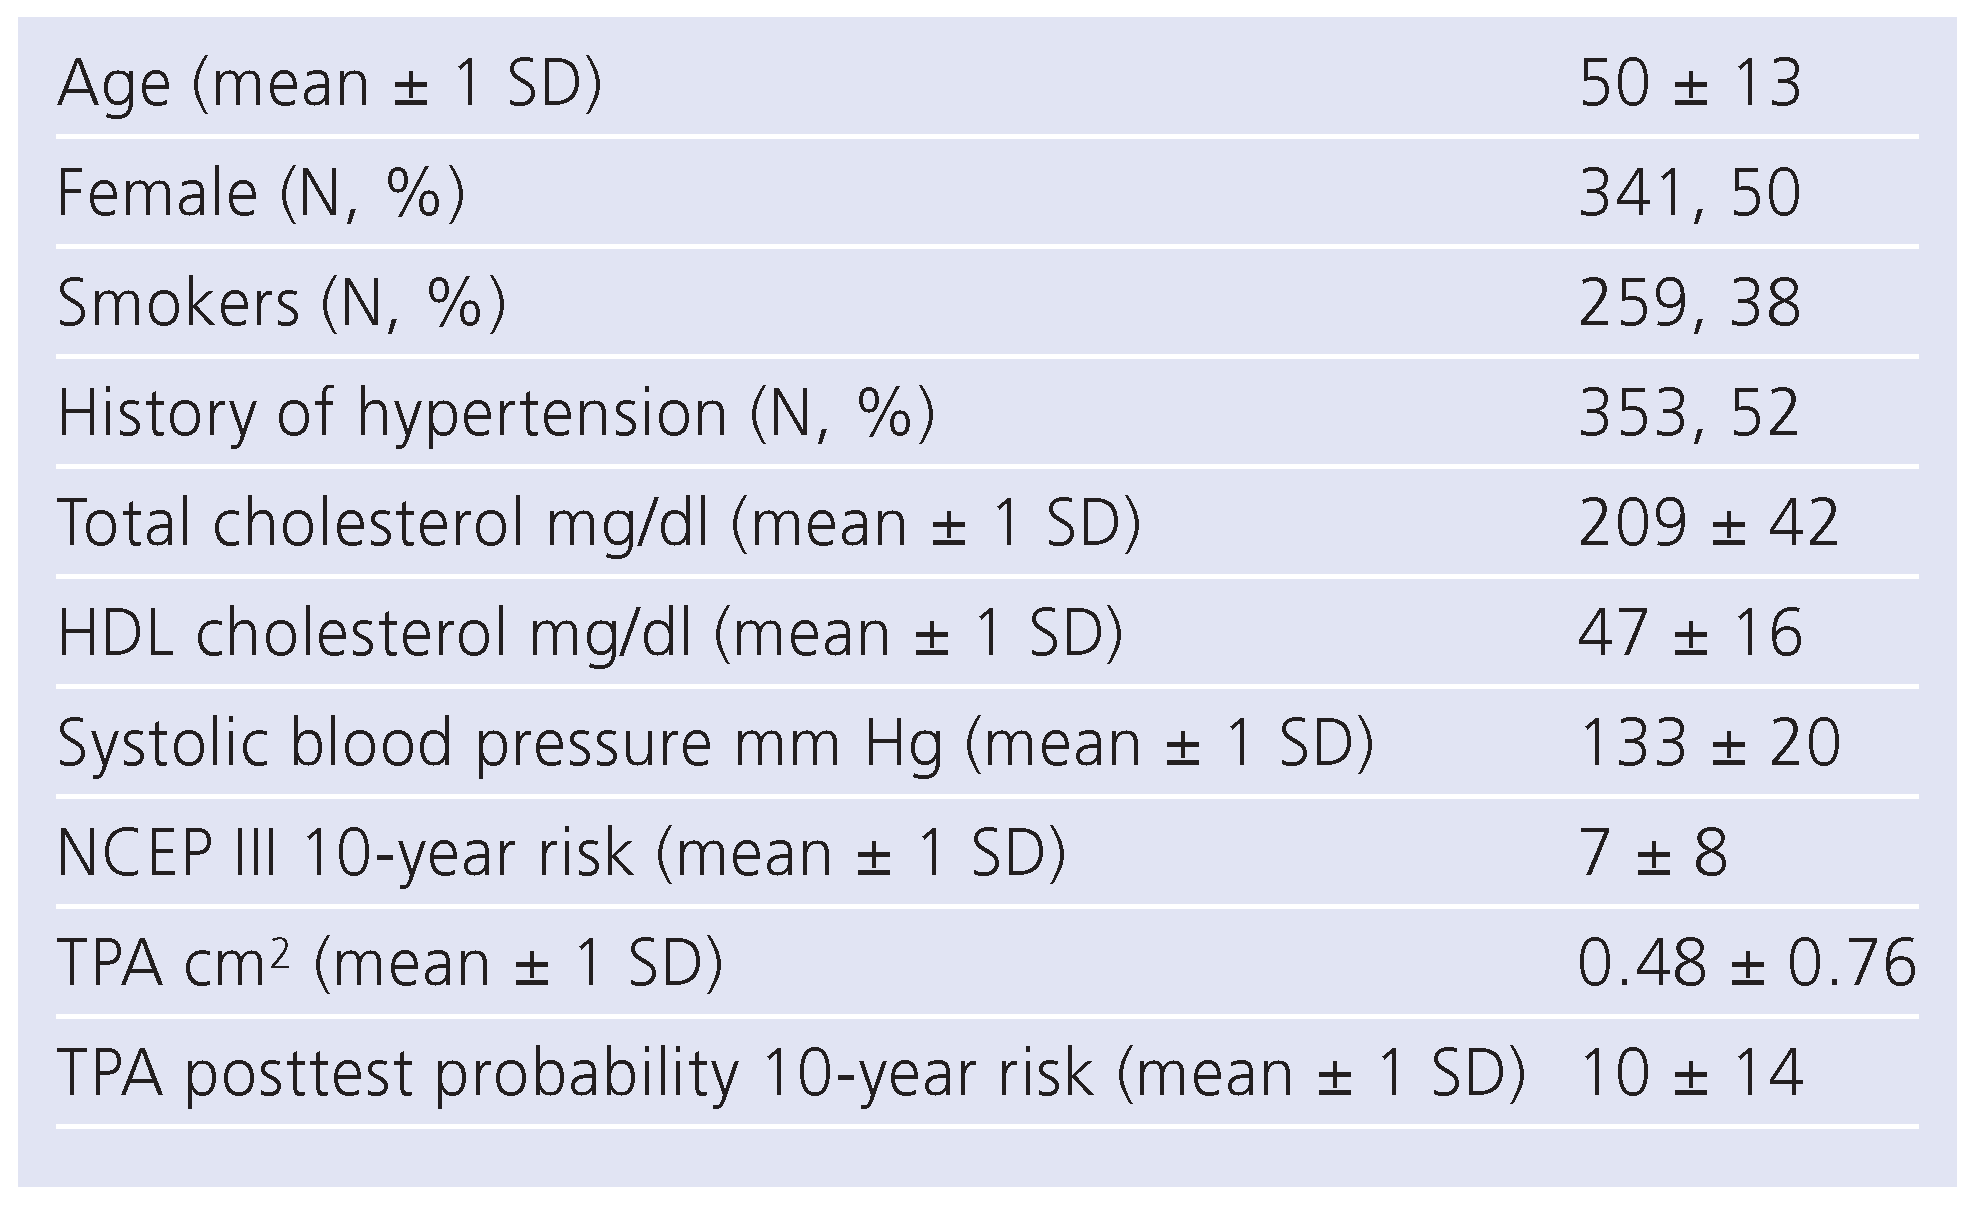
684 primary prevention subjects were available for further risk assessment (Table 3). In this group of primary prevention subjects, mean age was 50 ± 13 years and 50% were females; 38% were smokers and 52% had a history of hypertension. Mean follow-up ± standard deviation was 3.3 ± 1.8 years. A total of 13 myocardial infarctions occurred during follow-up. The NCEP III estimate for ten-year myocardial infarction incidence was 7%, the average total carotid plaque was 0.48 cm2 ± 0.76 cm2 and the posttest risk estimate for 10-year myocardial infarction incidence was 10%. The observed myocardial infarction incidence extrapolated to ten years was 6% for the entire primary care group.

Sensitivities and specificities of NCEP III, TPA and TPA-PTP

Using a cutoff of ≥20% ten-year risk for myocardial infarction, the sensitivity and specificity of NCEP III to detect 13 myocardial infarctions in 684 subjects followed up for an average of over 3.3 years was 31% and 89%, and was 39% and 79% for TPA-PTP respectively (p NS for all comparisons).
The sensitivities and specificities for various severities of TPA served to calculate posttest probabilities (TPA-PTP) and are outlined in Table 2. For lower TPA values, sensitivity was 92% at the cost of specificity (25%), whereas in subjects with a higher TPA (>0.55 cm2), specificity increased to 75% at the cost of sensitivity (62%).

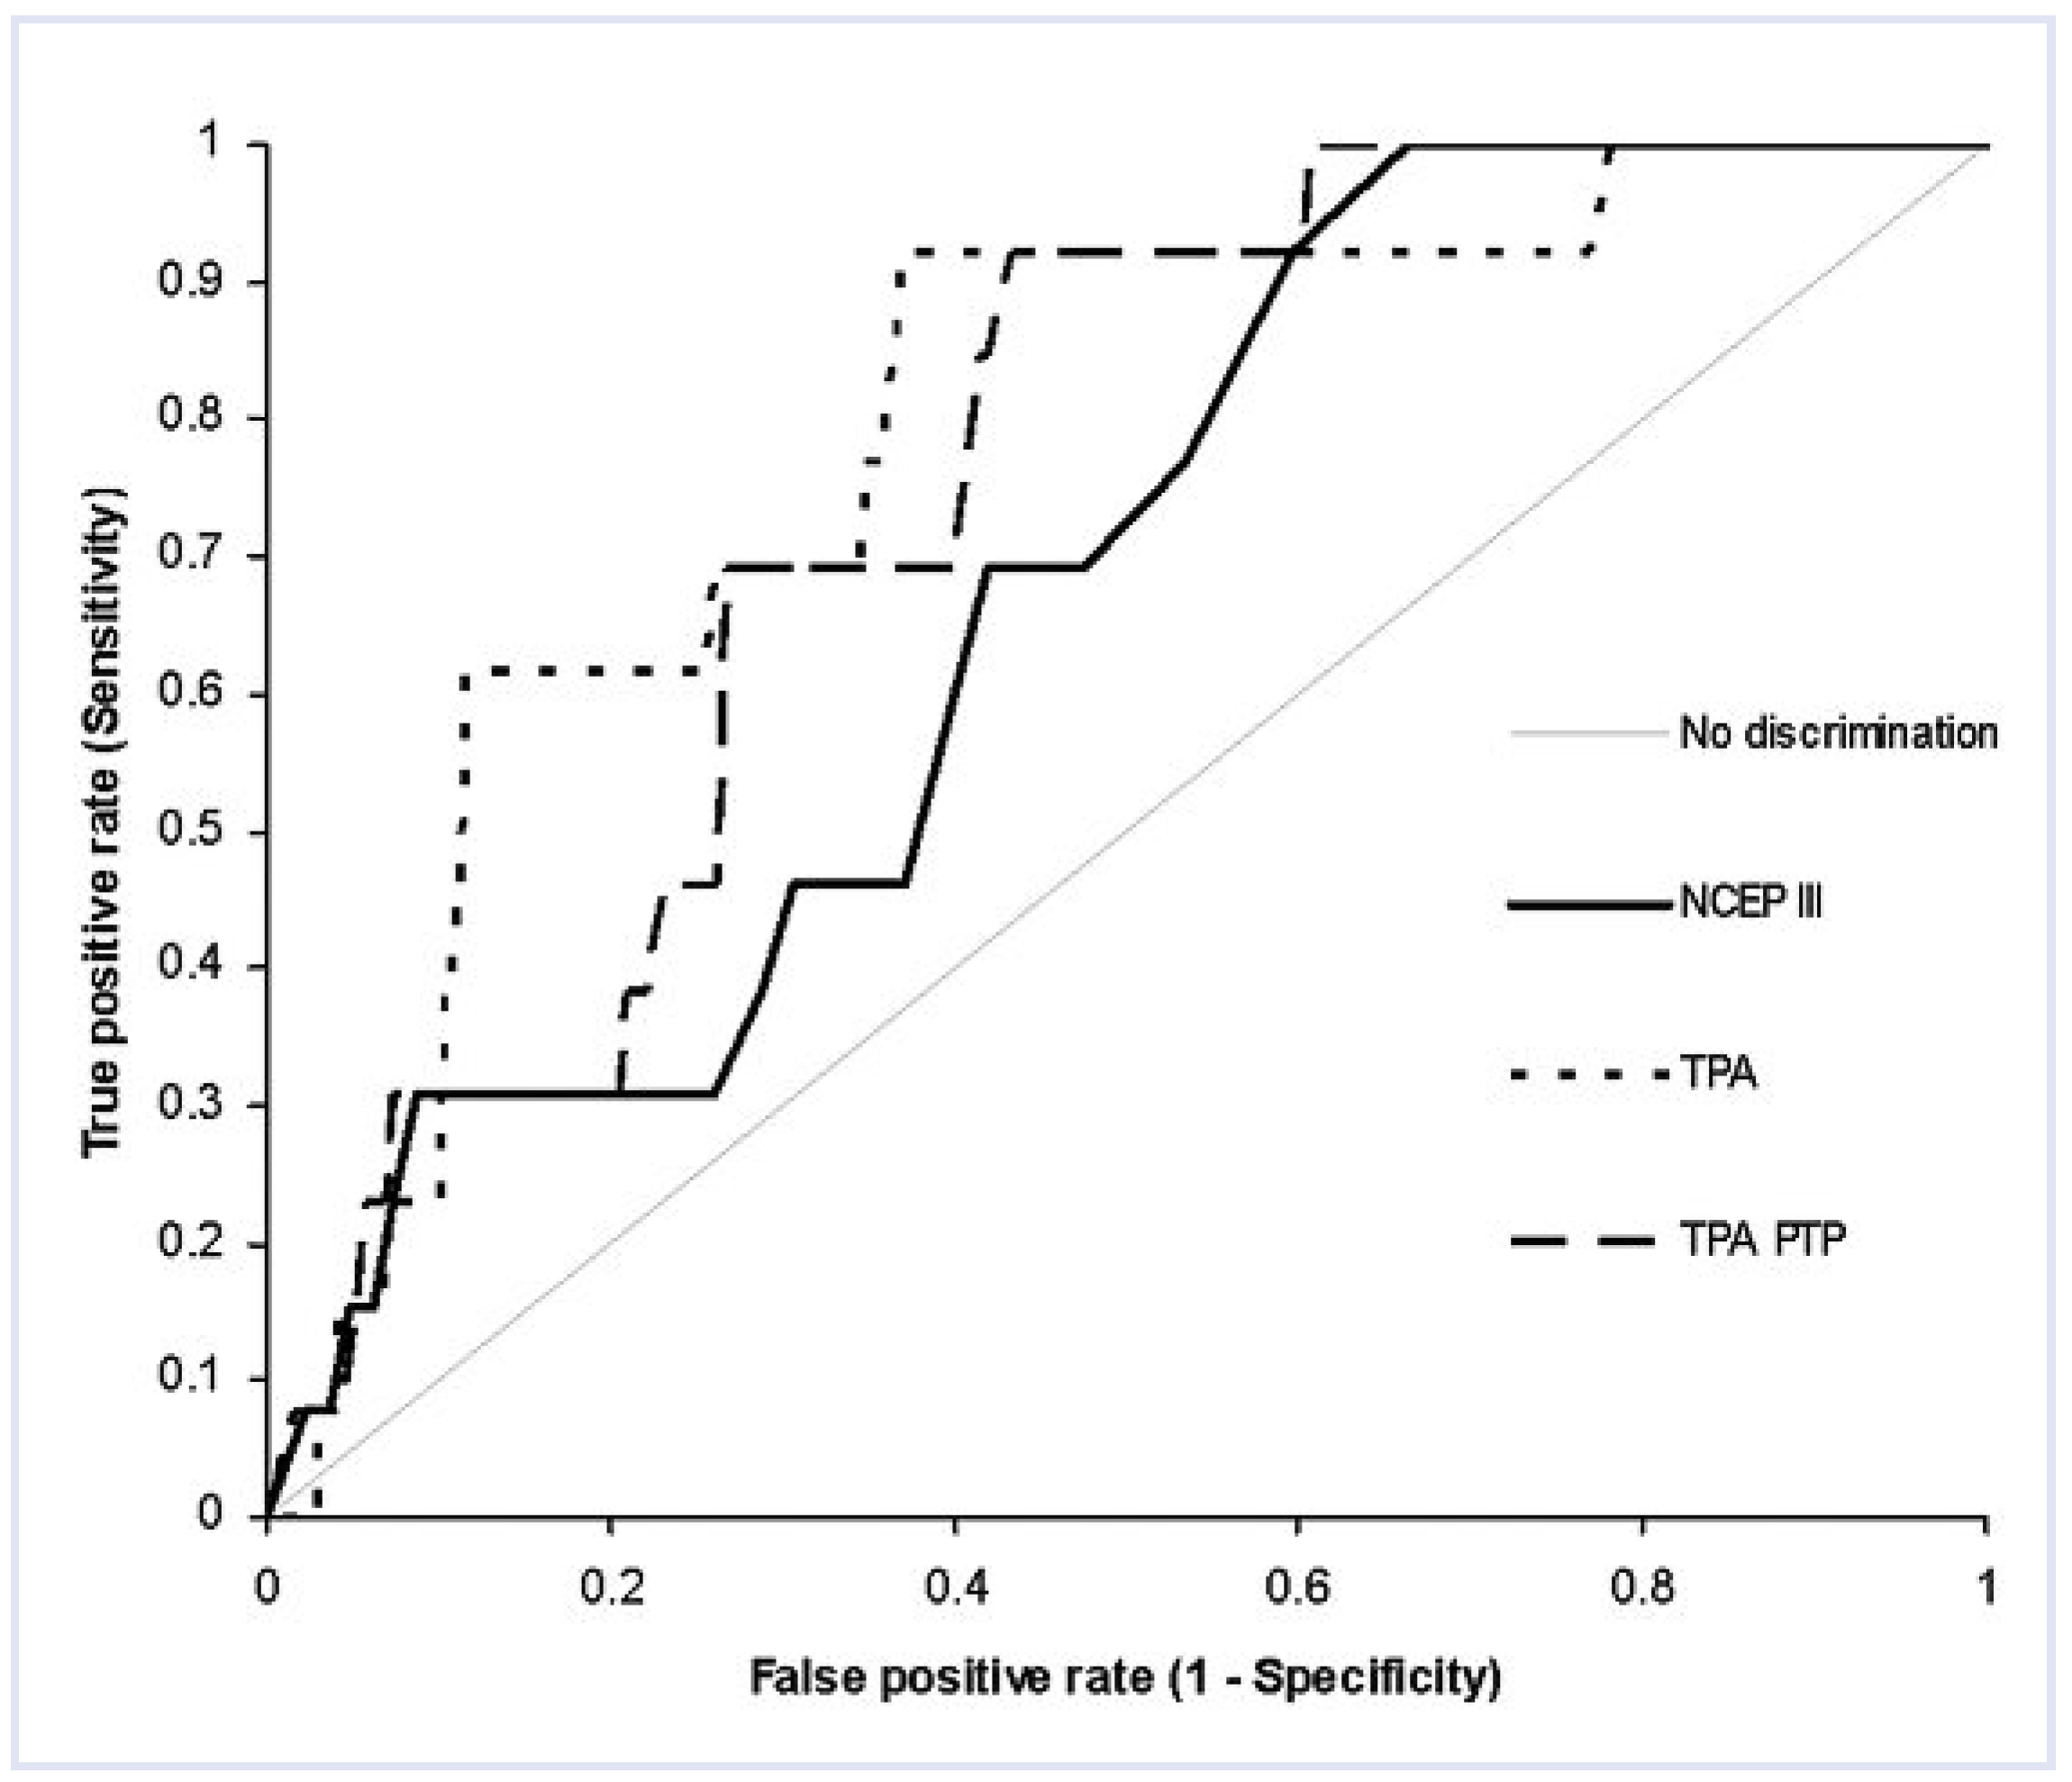
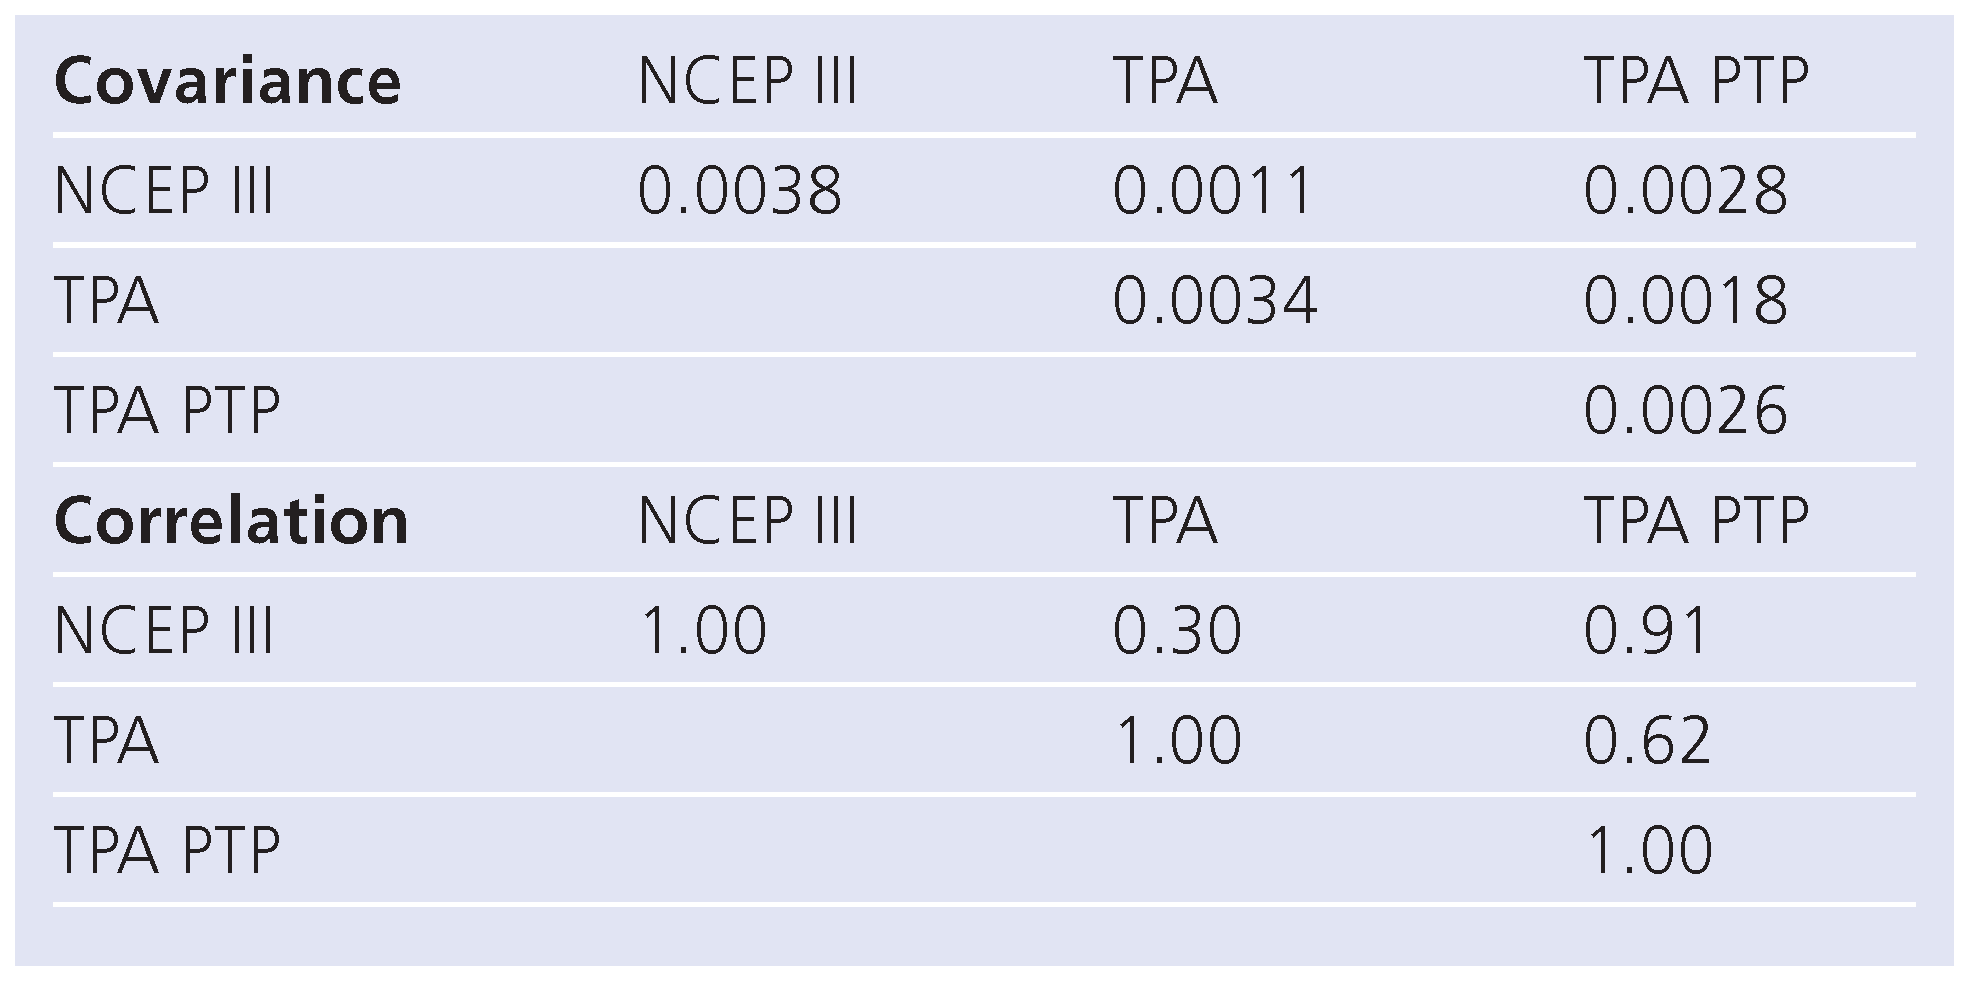
Correlations and diagnostic performance using ROC analysis of NCEP III, TPA, and TPA-PTP (Table 4 and Table 5, Figure 2)

Linear correlation between NCEP III and TPA was 0.68, between NCEP III and TPA-PTP was 0.91. Area under the curve (AUC) was 0.68 (95% CI: 0.56–0.80) for NCEP III, 0.78 (95% CI: 0.67–0.90) for TPA alone and 0.75 (95% CI: 0.65–0.85) for TPA-PTP (all p<0.0001). Probably due to a greater standard error (SE) between NCEP III and TPA (SE: 0.071) versus NCEPIII and TPA-PTP (SE: 0.026), AUC comparison indicated a significant improvement in predictive ability for TPA-PTP versus NCEP III (p = 0.0034) but not for TPA versus NCEP III (p = 0.1209).

Net reclassification improvement

In the 13 subjects with events, TPA posttest probability correctly shifted four subjects into a higher risk category and none into a lower risk category, and thus 30.77% of subjects with events were correctly reclassified. In 671 subjects without an event, 130 were incorrectly shifted into a higher risk group, 495 subjects remained in the same risk group and 46 subjects were correctly classified into a lower risk group. Thus 84 of 671 subjects with no events were incorrectly reclassified (12.52%). This implies a net reclassification improvement of 18.25%.

Discussion

Primary prevention of atherothrombosis leading to myocardial infarction is difficult because of the low sensitivities of coronary risk charts [2]. Coronary risk charts are based on major independent cardiovascular risk factors such as age, sex, hypertension, cholesterol and smoking, whereas diabetes mellitus is frequently regarded as a high risk category per se [1,2,3]. When excluding diabetes from risk calculations, the area under the curve (AUC) of risk charts remains modest, usually within a range between 0.65 and 0.75 [1,2,3]. Several additional tools have been proposed as coronary risk modifiers in order to reclassify subjects and identify high risk conditions earlier. However, most of such emerging risk factors failed to give additional diagnostic infor-mation in ROC analysis [4,6], with the exception of coronary calcium scores [5]. However, when relative risk and odds ratios are used after correction for major independent cardiovascular risk factors, statistically significant improvements in risk prediction could be observed [8]. This is, for example, the case of high sensitivity C-reactive protein [8] or a cluster of genetic tests [12]. In this study we performed a statistical analysis of the additional value of TPA using posttest risk calculation, comparison of ROC curves and net reclassification improvement, as discussed elsewhere [14].
In our study we aimed to introduce an alternative risk assessment strategy that incorporates calculation of posterior probabilities before performing an ROC comparison; thus we partially circumvent the debate on the clinical value of ROC analysis and odds ratios. We exemplified this strategy in a relatively young primary care cohort of 684 patients with a mean age of 50 years and a mean follow-up time of 3.3 years and in whom 13 myocardial infarctions occurred. These 684 patients were part of the London cohort [10]. In each patient, NCEP III risk could be assessed and posterior test probabilities (PTP) could be calculated using the total plaque area (TPA) of both carotid arteries as a sequential test. We found that the area under the curve (AUC) could be significantly improved from 0.68 for NCEP III to 0.75 for TPA-PTP (p = 0.0034). Therefore, TPA combined with NCEP III by using posterior test probabilities allowed for a significantly better prognosis than NCEP III alone or TPA alone when c-statistics were used [13]. Thus TPA-PTP may be used as a sequential test in primary care subjects in whom the intensity of preventive therapy remains unclear. It can replace coronary calcium testing, since TPA-PTP has similar ROC values to coronary calcium scoring. Finally, we were able to show that the net reclassification improvement was 18% when using TPA-PTP instead of NCEP III only.

Limitations

The gold standard of this study, which is myocardial infarction occurrence during follow-up, was only measured during an average observation time of 3.3 ± 1.8 years and had to be extrapolated to a ten-year risk for our test performance calculations. However, since risk tends to increase linearly at least until the age of 60, use of linear extrapolation may be justified in our relatively young cohort of subjects with an average age of 50 years at entry into observation.
Another matter of concern is the small number of events (N = 13) during follow-up in our cohort. However, despite this limitation, we were able to show a significant improvement in the c-statistics using posterior probabilities based on the Bayes theorem. Hence this statistical model may be used to assess the utility of new and emerging tests in clinical practice. Certainly our approach deserves further testing and external validation in larger cohorts with more frequent occurrence of endpoints.

Conclusions

The concept of sequential testing and calculation of posterior probabilities is appealing because it uses a scientifically accepted measure of coronary risk (e.g., ten-year risk for myocardial infarction based upon risk algorithms such as PROCAM, SCORE or NCEP III) as a pretest probability and permits calculation of absolute posttest coronary risk based on posttest risk calculation. Despite the small number of myocardial infarctions in our study cohort, TPA-PTP achieved a significant improvement in AUC over NEP III alone, which was not the case of TPA alone. Statistically significant improvement in c-statistics in sequential testing may be obtained by applying posttest risk probabilities to the pretest probability. Further, we were able to show that with this approach a clinically relevant reclassification improvement can be obtained. Our approach represents a conservative estimate of the value of emerging tests in preventive medicine; however, cost-effectiveness of these posttest-risk calculations remains to be elucidated.
Finally, TPA used in relatively young subjects yielded excellent predictive results in our study. It may therefore be used instead of coronary calcium testing with its inherent radiation risk. It may help to riskstratify subjects better at an earlier stage, where coronary risk interventions are more likely to improve outcome, especially in relatively young healthy subjects where risk-lowering strategies are most likely to improve long-term outcome.

Conflicts of Interest

The authors certify that there is no actual or potential conflict of interest in relation to this article.

References

  1. Assmann, G.; Cullen, P.; Schulte, H. Simple scoring scheme for calculating the risk of acute coronary events based on the 10-year follow-up of the prospective cardiovascular Münster (PROCAM) Study. Circulation 2002, 105, 310–5. [Google Scholar] [CrossRef] [PubMed]
  2. European guidelines on cardiovascular disease prevention in clinical practice. EJCPR 2003, 10 (Suppl 1), S1–78.
  3. Executive Summary of the third report of the national cholesterol education program. NCEP Adult Treatment Panel III. JAMA 2001, 285, 2486–97. [Google Scholar]
  4. Albert, M.; Glynn, R.; Ridker, P. Plasma Concentration of C-Reactive Protein and the Calculated Framingham Coronary Heart Disease Risk Score. Circulation 2003, 108, 161–5. [Google Scholar] [CrossRef] [PubMed]
  5. ACCF/AHA 2007 Clinical Expert Consensus Document on Coronary Artery Calcium Scoring by Computed Tomography in Global Cardiovascular Risk Assessment and in Evaluation of Patients With Chest Pain. Circulation 2007, 115, 402–26. [CrossRef] [PubMed]
  6. Lorenz, M.; Markus, H.; Bots, M.; Rosvall, M.; Sitzer, M. Prediction of Clinical Cardiovascular Events With Carotid Intima-Media Thickness. A Systematic Review and Meta-Analysis. Circulation 2007, 115, 459–67. [Google Scholar] [CrossRef] [PubMed]
  7. Obuchowski, N.A. Receiver operating characteristic curves and their use in radiology. Radiol 2003, 229, 3–8. [Google Scholar] [CrossRef] [PubMed]
  8. Cook, N. Use and Misuse of the Receiver Operating Characteristic Curve in Risk Prediction. Circulation 2007, 115, 928–35. [Google Scholar] [CrossRef] [PubMed]
  9. Bayes, R.T. An Essay Toward Solving a Problem in the Doctrine of Chances. Philos. Trans. R. Soc. London 1958, 53, 370–418. [Google Scholar] [CrossRef]
  10. Spence, D.; Eliasziw, M.; DiCicco, M.; et al. Carotid plaque area: a tool for targeting and evaluation of vascular preventive therapy. Stroke 2002, 33, 2916–22. [Google Scholar] [CrossRef] [PubMed]
  11. Pencina, M.; D’Agostino, R.; D’Agostino, R.B., Jr.; Vasan, R. Evaluating the added predictive ability of a new marker: from area under the ROC curve to reclassification and beyond. Stat Med 2008, 27, 157–72. [Google Scholar] [CrossRef] [PubMed]
  12. Kathiresan, S.; Melander, O.; Anevski, D.; et al. Polymorphisms Associated with Cholesterol and Risk of Cardiovascular Events. N Engl J Med 2008, 358, 1240–9. [Google Scholar] [CrossRef] [PubMed]
  13. DeLong, E.; DeLong, D.; Pearson, C. Comparing the areas under two or more correlated receiver operating curves. A nonparametric approach. Biometrics 1988, 44, 837–45. [Google Scholar] [CrossRef] [PubMed]
  14. Romanens, M.; Ackermann, F.; Spence, D.; et al. Improvement of cardiovascular risk prediction: Time to review current knowledge, debates, and fundamentals on how to assess test characteristics. European Journal of Cardiovascular Prevention & Rehabilitation 2010, 17, 18–23. [Google Scholar]
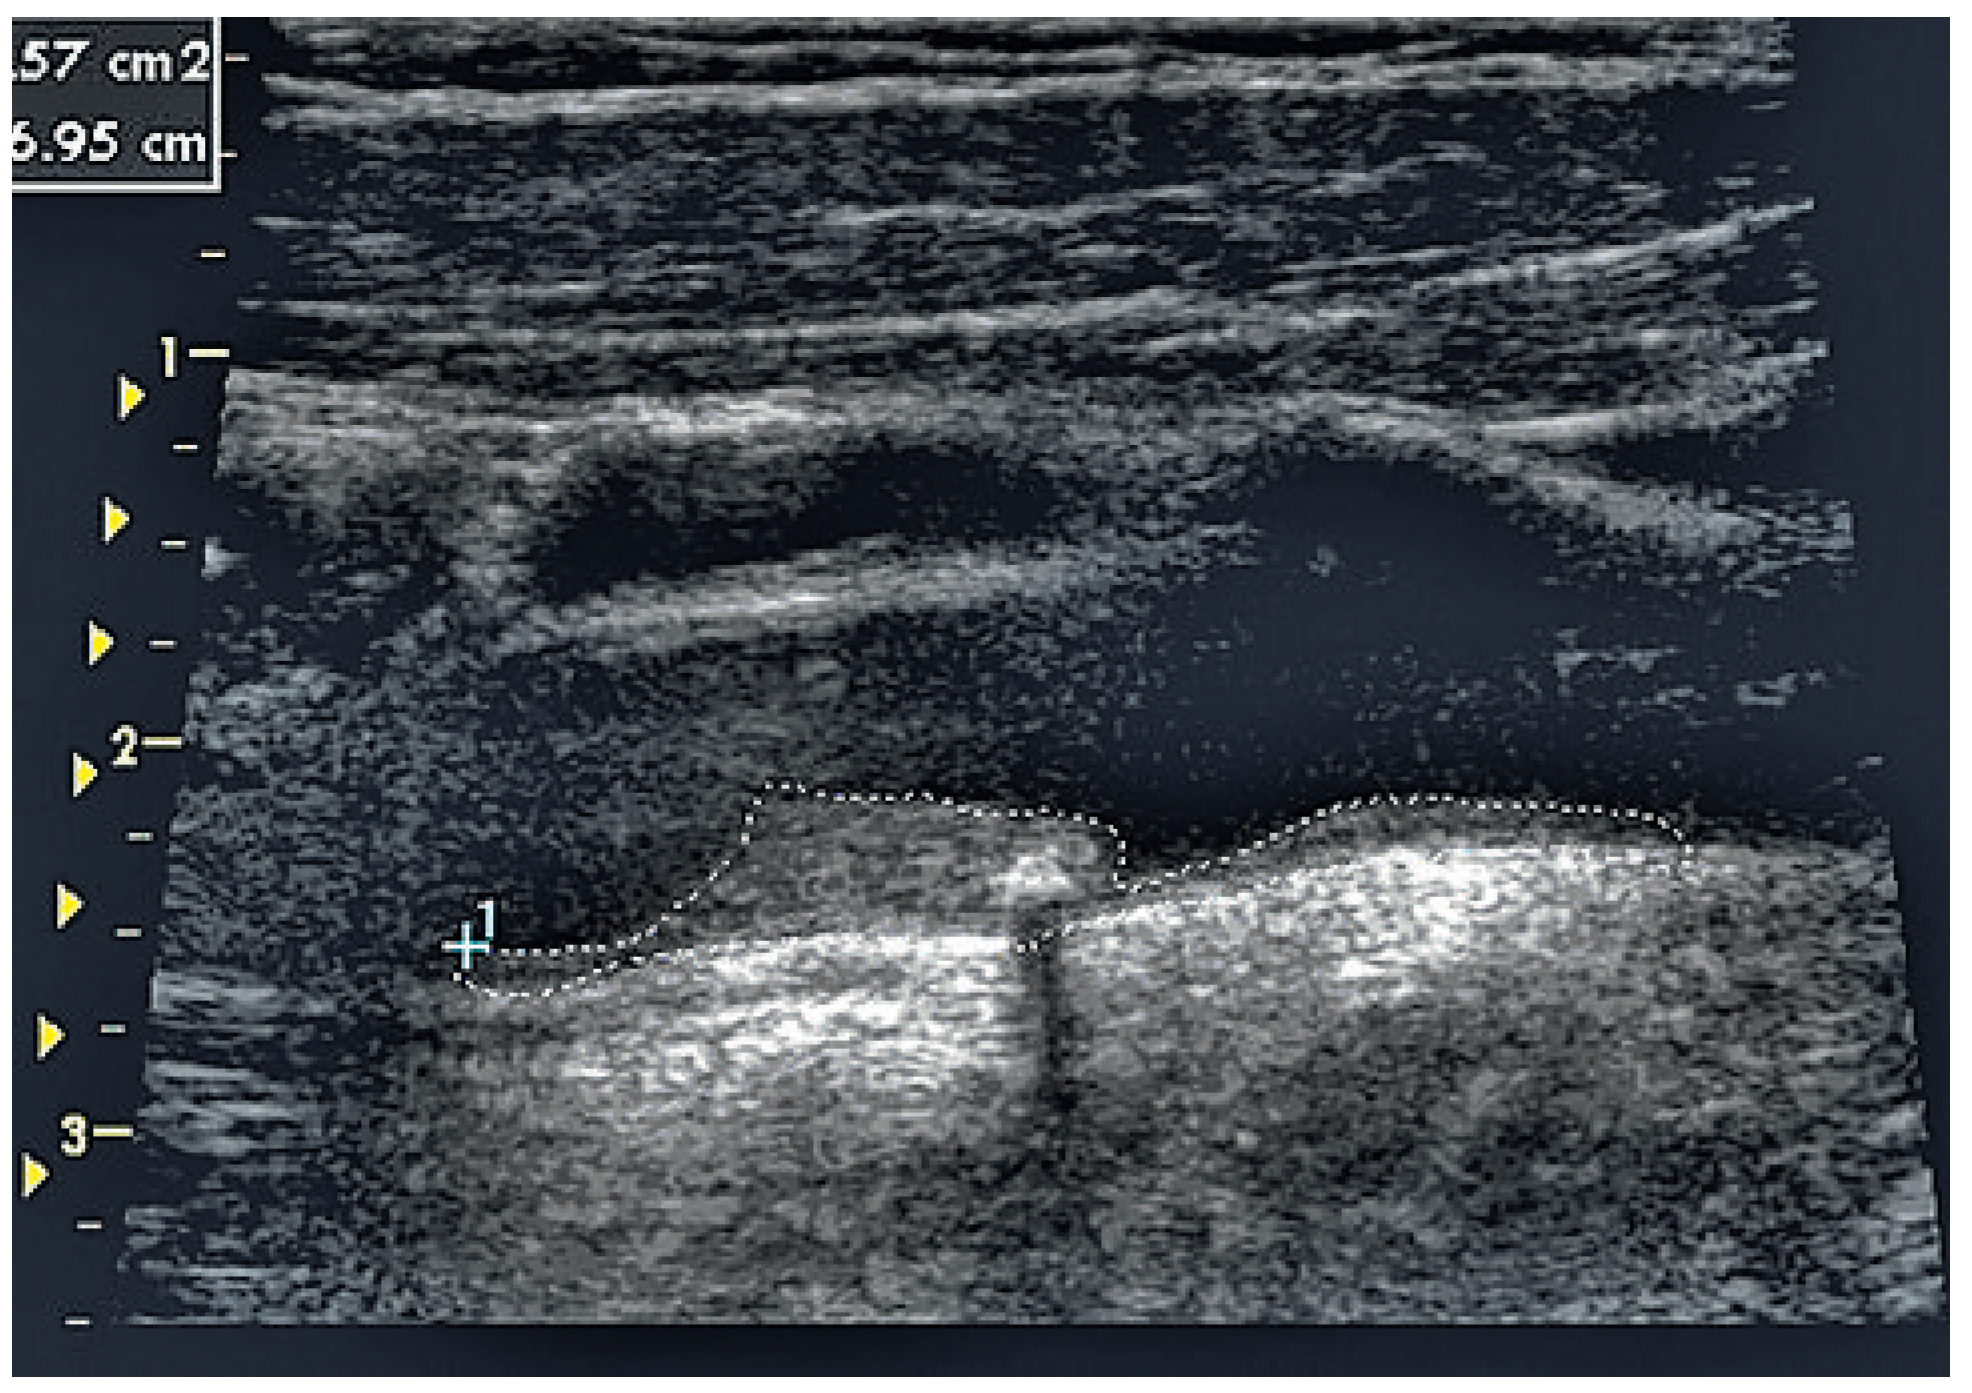
Figure 1. Example of a plaque area measurement.
Cardiovascmed 14 00053 g001
Figure 2. ROC plot for NCEP III, TPA, and TPA-PTP to detect future myocardial infarction (Results: see Table 4).
Cardiovascmed 14 00053 g002
Table 1. Excluded subjects from the original London cohort [10].
Cardiovascmed 14 00053 i001
Table 2. Used sensitivity and specificity of TPA to calculate posttest risk [9].
Cardiovascmed 14 00053 i002
Table 3. Clinical characteristics and risk assessments in the primary care cohort of the original London cohort [10].
Cardiovascmed 14 00053 i003
Table 4. Comparison of test performance in detecting future myocardial infarction.
Cardiovascmed 14 00053 i004
Table 5. Covariance and correlation analysis.
Cardiovascmed 14 00053 i005