Next Article in Journal
Recommendations for Quality Maintenance in Echocardiography
Previous Article in Journal
Flottierender Thrombus in der Aorta Descendens
 
 
Cardiovascular Medicine is published by MDPI from Volume 28 Issue 1 (2025). Previous articles were published by another publisher in Open Access under a CC-BY (or CC-BY-NC-ND) licence, and they are hosted by MDPI on mdpi.com as a courtesy and upon agreement with Editores Medicorum Helveticorum (EMH).
Interesting Images

Osborn Waves Due to Severe Hypothermia

Cardiology Service, University Hospital, Geneva, Switzerland
*
Author to whom correspondence should be addressed.
Cardiovasc. Med. 2009, 12(1), 17; https://doi.org/10.4414/cvm.2009.01385
Submission received: 23 October 2008 / Revised: 23 November 2008 / Accepted: 23 December 2008 / Published: 23 January 2009

Case description

A 60-year-old woman, known for illicit drug use and treated for severe depression was found unconscious at her home with a body temperature 24.5 °C due to intoxication of opiates and multiple psychotropic drugs (flurazepam, citalopram, levomepromazinum, clonazepam). An electrocardiogram (ECG) was obtained at her admission showing large J waves (or Osborn waves) in the 12 leads, with sinus bradycardia at a rate at 48/min and a prolongation of the PR, QRS and QT intervals (Figure 1). She was intubated due to hypoventilation and active rewarming measures were initiated, which consisted of administration of warmed intravenous saline, heated humidified oxygen and use of a warming blanket.
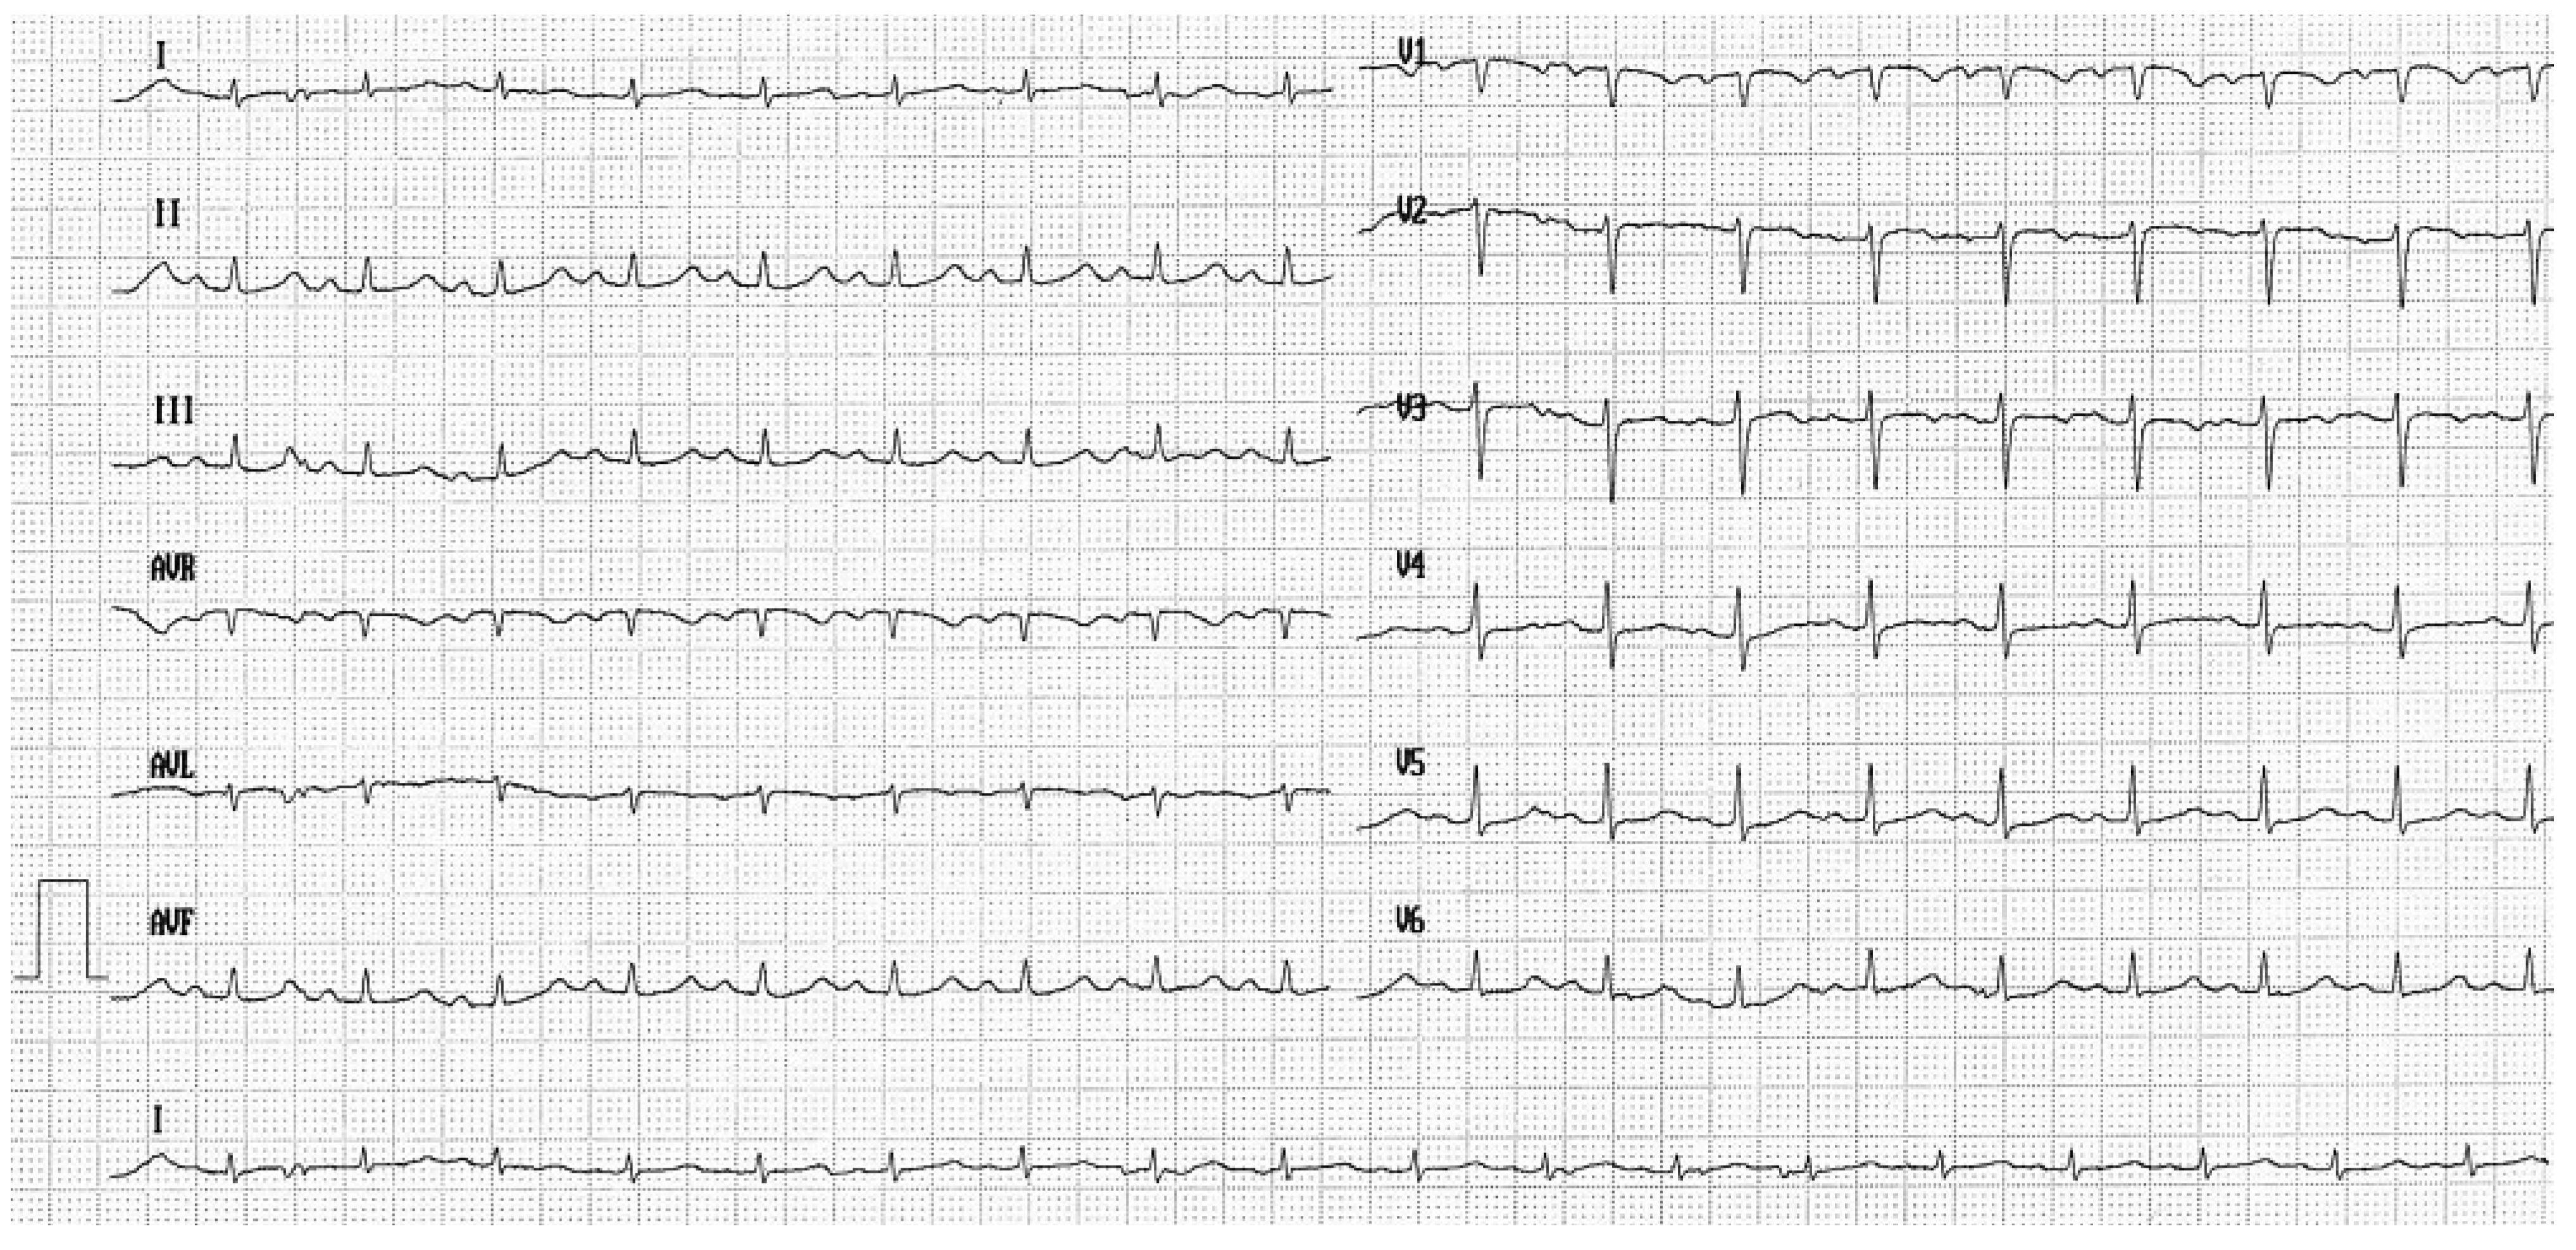
Four hours after admission her body temperature had risen to 29° C and a repeat ECG showed a slight regression of the abnormalities (Figure 2).
The last ECG, done when the hypothermia was corrected, showed disappearance of the J waves, normalisation of the QRS and QT intervals and acceleration of the sinus rate to 111 beats/min (Figure 3). The patient made full neurological recovery.

Discussion

Hypothermia causes characteristic ECG changes. It decreases spontaneous depolarisation of cardiac pacemaker cells and prolongs myocardial action potential duration.
Classic electrocardiographic manifestations [1] of hypothermia include:
-
shivering artefacts
-
sinus bradycardia
-
PR / QRS / QT prolongation
-
J waves (Osborn waves)
-
atrial arrhythmias (common when the temperature falls to below 32 °C)
-
ventricular fibrillation and asystole (especially if the temperature is <28 °C)
The Osborne wave is the most striking ECG feature of hypothermia, first described by John J. Osborn in 1953 [2]. It is a “hump-like” deflection between the QRS complex and the early part of the ST segment [3] and represents distortion of the earliest phase of membrane repolarisation. It is present in approximately 80% of hypothermic patients when the temperature is below 30 °C. The amplitude of the Osborne wave is roughly proportional to the degree of hypothermia [4].
Recent findings suggest that hypothermia increases the epicardial potassium current relative to the current in the endocardium during ventricular repolarisation [5]. The transmural voltage gradient is reflected on the surface electrocardiogram as a prominent J wave or Osborn wave. The J wave is most prominent in leads facing the left ventricle and in the inferior limb leads [6] and disappears with rewarming but can persist for 12–24 hours after restoration of body temperature [4].
The J wave is not pathognomonic of hypothermia but also occurs in other conditions such as hypercalcaemia [7], certain CNS lesions (subarachnoidal haemorrhage or cerebral injuries) [8], in the Brugada Syndrome [9] and also in healthy persons with early repolarisation [10].

Conflicts of Interest

There is no conflict of interest.

References

  1. Solomon, A.; et al. The electrocardiographic features of hypothermia. J Emerg Med. 1989, 7, 169–173. [Google Scholar] [CrossRef] [PubMed]
  2. Osborn, J.J. Experimental hypothermia; respiratory and blood pH changes in relation to cardiac function. Am J Physiol. 1953, 175, 389–398. [Google Scholar] [CrossRef] [PubMed]
  3. Gussak, I.; et al. ECG phenomenon called the J wave. History, pathophysiology, and clinical significance. J Electrocardiol. 1995, 28, 49–58. [Google Scholar] [CrossRef] [PubMed]
  4. Okada, M.; et al. The J wave in accidental hypothermia. J Electrocardiol. 1983, 16, 23–28. [Google Scholar] [CrossRef]
  5. Yan, G.X.; Antzelevitch, C. Cellular basis for the electrocardiographic J wave. Circulation. 1996, 93, 372–379. [Google Scholar] [CrossRef] [PubMed]
  6. Vassallo, S.U.; et al. Aprospective evaluation of the electrocardiographic manifestations of hypothermia. Acad Emerg Med. 1999, 6, 1121–1126. [Google Scholar] [CrossRef] [PubMed]
  7. Sridharan, M.R.; Horan, L.G. Electrocardiographic J wave of hypercalcemia. Am J Cardiol. 1984, 54, 672–673. [Google Scholar] [CrossRef] [PubMed]
  8. De Sweit, J. Changes simulating hypothermia in the electrocardiogram in subarachnoid hemorrhage. J Electrocardiol. 1972, 5, 93–95. [Google Scholar] [CrossRef] [PubMed]
  9. Yan, G.X.; Antzelevitch, C. Cellular basis for the Brugada syndrome and other mechanisms of arrhythmogenesis associated with ST-segment elevation. Circulation. 1999, 100, 1660–1666. [Google Scholar] [CrossRef] [PubMed]
  10. Patel, A.; et al. The Osborn wave of hypothermia in normothermic patients. Clin Cardiol. 1994, 17, 273–276. [Google Scholar] [CrossRef] [PubMed]
Figure 1. 12-lead ECG obtained at core body temperature 24.5 °C, showing sinus bradycardia at 48/min, a prolonged QT interval at 560 ms and large J waves more remarkable in inferior and in V3–V5 leads.
Cardiovascmed 12 00017 g001
Figure 2. 12-lead ECG obtained at core body temperature 29 °C, showing persistance of sinus bradycardia at 50/min, a prolonged QT interval at 480 ms and smaller amplitudes J waves.
Cardiovascmed 12 00017 g002
Figure 3. 12 lead ECG obtained after rewarming (core body temperature 35.9 °C) with disappearance of the J waves and normalisation of QT interval.
Cardiovascmed 12 00017 g003