Article

Mixed Sweeteners Supplemented with Chromium Picolinate (CrPic) Improved Some Diabetes-Related Markers and Complications in a Type 2 Diabetic Rat Model

by
Ekomobong Inyang
1,
Ifeoma Irene Ijeh
1 and
Sunday Oyedemi
1,2,*
1
Department of Biochemistry, Michael Okpara University of Agriculture, Umudike 440101, Abia State, Nigeria
2
Department of Biosciences, School of Science and Technology, Nottingham Trent University, Clifton Lane, Nottingham NG11 8NS, UK
*
Author to whom correspondence should be addressed.
Nutraceuticals 2024, 4(4), 658-672; https://doi.org/10.3390/nutraceuticals4040036
Submission received: 18 September 2024 / Revised: 1 November 2024 / Accepted: 6 November 2024 / Published: 14 November 2024

Abstract

:
Several studies have explored the effects of single or binary mixtures of sweeteners on both healthy individuals and those with diabetes. However, there is limited research on the impact of a combination of four sweeteners supplemented with dietary minerals. Steviol glycosides, extracted from Stevia rebaudiana, offer a zero-calorie sweetness that exerts minimal influence on blood glucose levels. When combined with other sweeteners, they can reduce the required quantity of each component thus mitigating the potential side effects. Furthermore, the incorporation of chromium picolinate into sweeteners may enhance insulin sensitivity and glucose metabolism and diminish insulin resistance in both diabetic and non-diabetic individuals. This study aimed to evaluate the effects of commercial mixed sweeteners (acesulfame-K, sucralose, sorbitol, and steviol glycoside) supplemented with chromium picolinate (MSSC) on diabetes-related markers and complications in healthy and type 2 diabetic rats (T2D). Over six weeks, diabetic rats received daily oral administration of MSSC at a standard dosage. The results demonstrated that MSSC significantly reduced weight loss in diabetic rats, lowered fasting blood glucose levels, enhanced hexokinase activity, and improved pancreatic antioxidative capacities. Additionally, MSSC treatment led to notable reductions in serum triglycerides, cholesterol, malondialdehyde (MDA), and LDL cholesterol levels. The treatment also modulated specific renal function parameters, and moderately reversed the necrotic architectures of the liver and pancreatic β cells. These results indicate that long-term administration of MSSC may alleviate certain diabetic complications without adverse effects on non-diabetic individuals. Further clinical studies are strongly recommended to evaluate the safety and efficacy of MSSC in diverse populations.

1. Introduction

Diabetes mellitus (DM) arises from deficiencies in insulin secretion, loss of insulin action, or both, leading to chronic hyperglycemia. This condition results from decreased insulin-driven cellular entry of glucose, reduced glucose utilization, and increased glucose production by the liver [1]. The global incidence of DM has nearly quadrupled since 1980, reaching 537 million adults between 20 and 79 years in 2021. This sharp increase is attributed to physical inactivity, an aging population, urban migration, and unhealthy dietary habits [2]. Despite the World Health Organization’s recommendation of consuming less than 10% of daily energy from free sugar, a significant portion of the population appears to exceed this threshold [2]. According to Pavanello [3], a high dietary intake of pure sugars in carbonated and non-carbonated sugar-sweetened beverages increases energy density ultimately leading to obesity and diabetes. As a result, many individuals with DM have turned to artificial sweeteners (AS; 30–13,000 times sweeter than sucrose) as a sugar substitute to manage carbohydrate and energy intake [4]. Combined sweeteners in numerous food products are known to create an intense sweetness that surpasses the individual components of the mixture [5]. However, the impact of mixed sweeteners on healthy and diabetic individuals remains unknown highlighting a gap for further exploration.
Non-nutritive sweeteners have become a topic of extensive investigation and controversy in the food industry due to their potential benefits and their potentially adverse or neutral roles in healthy individuals and those living with diabetes [6]. These sweeteners are increasingly popular as sugar substitutes, with the aim of promoting weight loss or maintaining glycemic control. Research has indicated that consuming these sweeteners may lead to increased food intake, overweight or obesity, and decreased receptor activity due to insulin resistance [6]. Similarly there are growing concerns among healthcare professionals regarding the potential overconsumption of artificial sweeteners (AS) by both diabetic and non-diabetic populations. The role of these sweeteners in managing diabetes and related conditions, as well as in promoting health among the general population, remains controversial and inadequately defined in the existing literature [7]. Furthermore, most studies tend to focus on pure forms of artificial sweeteners, rather than the commercially available products commonly consumed by the public, which may differ in composition and effects. This gap highlights the necessity for more comprehensive research that examines the impact of blended sweeteners in real-world dietary contexts.
Sweetener blends enable a reduction in the quantity of each ingredient while still achieving the desired sweetness, which minimizes potential side effects associated with high doses of any single sweetener. Previous research indicates that sweetener blends can lower insulin spikes and enhance satiety, both essential for maintaining stable blood glucose levels and curbing overeating [8,9]. Various combinations of sweeteners are commercially available, and previous data from animal studies have suggested that the consumption of artificial sweeteners may have synergistic or additive effects when used with other food additives [10]. Chromium, particularly in its bioavailable form as chromium picolinate (CrPic), has been recognized for its role in improving insulin sensitivity and glucose metabolism [11]. When combined with sweeteners, chromium may reduce postprandial blood glucose levels by facilitating insulin action. Previous studies have demonstrated that chromium plays a significant role in enhancing insulin signaling, which facilitates improved glucose utilization and may help mitigate hyperglycemia and insulin resistance [11]. This effect is thought to occur through the modulation of key proteins, including peroxisome proliferator-activated receptor gamma (PPAR-γ), insulin receptor substrate-1 (IRS-1), and nuclear factor-kappa B (NF-κB), particularly when chromium is combined with low-glycemic sweeteners [12]. Such interactions highlight the potential of chromium, in conjunction with strategic dietary components, to positively influence metabolic pathways associated with glucose regulation and insulin sensitivity.
All sweeteners bind to and activate the T1R2 and T1R3 subunits of taste-specific G protein-coupled receptors (GPCRs), leading to the activation of phospholipase C (PLC). This enzyme hydrolyses phosphatidylinositol 4,5-bisphosphate (PIP2) in the membrane to generate inositol triphosphate (IP3) and diacylglycerol (DAG). IP3 binds to the receptor on the endoplasmic reticulum, leading to the release of Ca2+ from the intracellular stores [13]. The influx of Ca²⁺ in pancreatic beta cells raises intracellular calcium, which initiates insulin release. Ca²⁺ binds to synaptotagmins, Ca²⁺-sensitive proteins that enable fusion of insulin vesicles with the cell membrane, leading to insulin exocytosis into the bloodstream. This process provides a rapid, regulated insulin response to high blood glucose, supporting glucose homeostasis [13]. Non-nutritive sweeteners (NNSs) also bind to enteroendocrine sweet-taste receptors, causing the release of GLP-1 and increasing intestinal glucose uptake [14]. In contrast, sugars activate T1R heterodimer by activating adenylyl cyclase, resulting in the generation of cyclic adenosine monophosphate (cAMP), which inhibits basolateral K+ channels through phosphorylation of protein kinase A, eventually resulting in insulin exocytosis. Unfortunately, NNSs alone cannot elicit this effect as natural sugars in vivo due to their lack of caloric content. However, acesulfame-K (ace-K) has shown to upregulate sodium-glucose contransporter-1 ( SGLT1) in wild-type mice containing T1R3 or α-gustducin [15]. Despite this information, there is currently a lack of scientific data on mixed sweeteners supplemented with chromium.
Thus, the present study aimed to investigate the effect of a mixed sweetener supplemented with dietary chromium on diabetes-related complication parameters in healthy and experimentally induced type 2 diabetic rats. This holistic approach aligns with emerging trends in nutraceutical research and underscores the need for tailored interventions in diabetes management that consider the interactions among multiple ingredients.

2. Materials and Methods

2.1. Chemicals and Reagents

The compounds streptozotocin (STZ), potassium hydroxide (KOH), fructose, metformin, ethylenediaminetetraacetic acid (EDTA), ketamine, sucrose, formalin, ammonium acetate, 2,4-dinitrophenylhydrazine purchased, hematoxylin and eosin (H&E), oxaloacetate, pyruvate, and insulin EZRMI-13K were purchased from Merck Chemicals (Pty) Ltd., Bellville, South Africa. All other chemicals and reagents used in this study were of biological grade and commercially available. Commercially available kits for assessing lipid profiles and liver enzymes assays were purchased from Sigma-Aldrich (Johannesburg, South Africa). The commercially available sweetener, referred to as MSSC, was purchased from a pharmaceutical store in Umuahia, Nigeria. This low-calorie, low-glycemic index nutritional supplement is specifically formulated for diabetes management. Its primary ingredients comprise dietary fiber, a blend of sweeteners including sorbitol, sucralose, acesulfame-K, and steviol glycosides, as well as chromium picolinate.

2.2. Experimental Animals/Grouping

Thirty Wistar Albino rats with an average weight of 175.22 ± 7.53 g were procured from the Department of Veterinary Medicine, University of Uyo, Akwa-Ibom State, Nigeria. The animals were housed in a temperature- (22 ± 2 °C) and humidity-measured environment (50 ± 5%) with a 12 h light and dark cycle set. All the animals had free access to tap water and received a standard chow diet ad libitum that contained 9.2% water, 22.1% crude protein, 5.1% crude fat, 5.2% crude ash, 4.12% crude fiber, 50% nitrogen-free extract, 1.24% calcium, 0.92% phosphorous, 1.34% lysine and 0.78% methionine and cysteine, for six weeks. The mixed sweeteners contain 6 mg/kg/day for sorbitol and steviol glycoside, 15 mg/kg/day for acesulfame-K and 50 µg/kg/day for chromium picolinate. The animal studies were conducted in accordance to the NIH guidelines and approved by the animal ethics committee of the Faculty of Science, Michael Okpara University of Agriculture, Umudike (MOUAU), Abia State, Nigeria, under the approval number MOUAU/COLNAS/BCH/19/12/04.

2.3. Experimental Design and Type 2 Diabetes Induction

The experimental rats were randomly divided into five groups (n = 6 for each group): a normal control (NC), normal rats treated with supplemented sweeteners (NSSs), a diabetic control (DBC), diabetic animals treated with supplemented sweeteners (DSSs), and a metformin-treated group (DMF, 300 mg/kg). After a one week adaptation period and subsequent overnight fasting, the animals in the DBC, DSS and DMF groups were given 10% w/v fructose solution ad libitum for two weeks to induce insulin resistance. After two weeks, a single intraperitoneal injection of STZ (40 mg/kg) prepared in citrate buffer (0.1 M, pH 4.5) was administered to the animals to induce partial pancreatic β-cell dysfunction [16]. The rats in the control groups were injected with citrate buffer as a vehicle and supplied with ordinary drinking water throughout the experimental period. One week after the STZ injection, the fasting blood glucose level (FBGL) was measured in the blood collected from the tail vein using a portable glucometer (Bayer Healthcare, Tokyo, Japan). Animals with an NFBG level > 180 mg/dL were considered diabetic and used for the study. After diabetes confirmation, different groups were administered metformin or sweetener using a gastric gavage needle, while the untreated non-diabetic rat or normal group received only the animal feed. The dosage of commercial sweeteners was equivalent to the human consumption extrapolated from the guidelines written on the pack of the MSSC. The weekly body weight of the animals was recorded on days 0, 7, 14, 28, 35, and 42.

2.4. Blood Collection and Serum and Tissue Preparation

At the end of the experimental period, animals were fasted overnight and anesthetized using ketamine anesthesia (100 mg/kg). For biochemical analysis, the blood sample was collected via cardiac puncture into sample bottles with EDTA and immediately preserved in a refrigerator at 4 °C. Serum was obtained by centrifuging blood at 3000 rpm for 15 min. The aliquot was collected and stored in the freezer at −20 °C to determine insulin, protein, urea, bilirubin, creatinine, albumin, and lipid profile (HDL, LDL, VLDL, TAG, and CHOL) levels by using a biochemical analyzer. Each animal’s liver and pancreas tissues were dissected, washed in 0.9% saline, weighed, and recorded. Ten percent (10%) of either the liver or pancreas was homogenized using a pre-chilled mortar and pestle. The homogenate was then centrifuged at 10,000 rpm for 10 min in a 25 mM sucrose solution to obtain the supernatant, which was subsequently stored at −0 °C for biochemical analysis using an automated counter. Furthermore, a portion of liver or pancreas tissue was preserved in 10% phosphate-buffered formalin at room temperature for histopathological examination to determine changes in cellular morphology.

2.5. Estimation of Serum Insulin

The effect of MSSC on the serum insulin concentration in diabetic rats was determined by an ultrasensitive rat insulin enzyme-linked immunosorbent assay (ELISA) using a commercial assay kit in a multi-plate ELISA reader (Biorad-680, BIORAD Ltd., Tokyo, Japan). The assay was performed by following the manufacturer’s instructions. The concentrations (mIU/mL), for both the control and the sample, were extrapolated from the standard curve.

2.6. Effect of MSSC on Hexokinase and α-Glucosidase Activities

The effect of the sweetener on alpha-glucosidase in the isolated liver of the diabetic and non-diabetic rats were determined following the method described by Kim et al. [15]. To determine hexokinase activity, an enzyme for glucose metabolism in the liver was assayed according to the method of Brandstrup et al. [17] as modified by Jayaprasad et al. [18].

2.7. The Effect of MSSC on the Serum Lipid Profile

Serum lipid profiles were assayed using the Biobase Series Discrete Automatic Biochemical Analyzer (model: BK 200; Jinan Biobase Biotech Co., Ltd., Jinan, China) with commercial kits purchased from RANDOX Laboratories Limited, Crumlin, County Antrim, UK.

2.8. The Effect of MSSC on the Liver and Kidney Function Indices

The effect of AS on the livers and kidneys of treated diabetic rats was determined by using the Biobase Series Discrete Automatic Biochemical Analyzer (model: BK 200; Jinan Biobase Biotech Co., Ltd., Jinan, China) and the fortress diagnostic kit. The parameters measured include bilirubin, creatinine, urea, total protein, alanine, and aspartate aminotransferases (ALT and AST) by standard techniques using commercial fortress diagnostic kits. The assay method was based on the colorimetric estimation of oxaloacetate (for AST) or pyruvate (for ALT) through the transamination of aspartate or alanine on reacting with 2-4-dinitrophenylhydrazine (DNPH). The intensity of the resultant brown-colored hydrazone was measured with a colorimeter after 5 min at 540 nm, and the activity (AST or ALT) was extrapolated from the standard curve.

2.9. The Effect of MSSC on the Pancreatic Antioxidant Status

Superoxide dismutase (SOD) activity in the pancreatic tissue was estimated by the method of Kakkar et al. [19]. Catalase (CAT) activity was assayed by the method of Sinha [20], glutathione peroxidase (GPX), and reduced glutathione (GSH) by Ellman [21]. Pancreatic lipid peroxidation was determined by measuring the level of malondialdehyde (MDA), an index of lipid peroxidation, following the method of Nichans and Samuelson [22].

2.10. Histopathological Analysis of Liver and Pancreas

After 28 days of quercetin and metformin dosing, the animals from each group were euthanized, and the liver and pancreas were dissected out, washed in 0.9% saline, and then fixed in 10% v/v in formalin solution. For histological studies, the liver and pancreas sections were sliced and transferred immediately into 70% ethanol and then dehydrated via series of graded ethanol (30%, 50%, 70%, 90%, and 100%). After dehydration, the tissues were transferred into xylene and then embedded in paraffin wax and cut into 5-micron sections and then stained with hematoxylin and eosin (H&E). Microscopic examination was performed at a magnification of 400×.

2.11. Statistical Analysis

All the data obtained from this study are presented as the mean ± standard deviation (SD), and analyzed using the IBM SPSS Statistics program (version 22.0) and the differences between treatment groups were assessed using post hoc one-way analysis of variance (ANOVA) or Student’s t-test or Tukey’s multiple comparison tests, as indicated in the Figure or Table legends. The p-values < 0.05 were considered significant.

3. Results

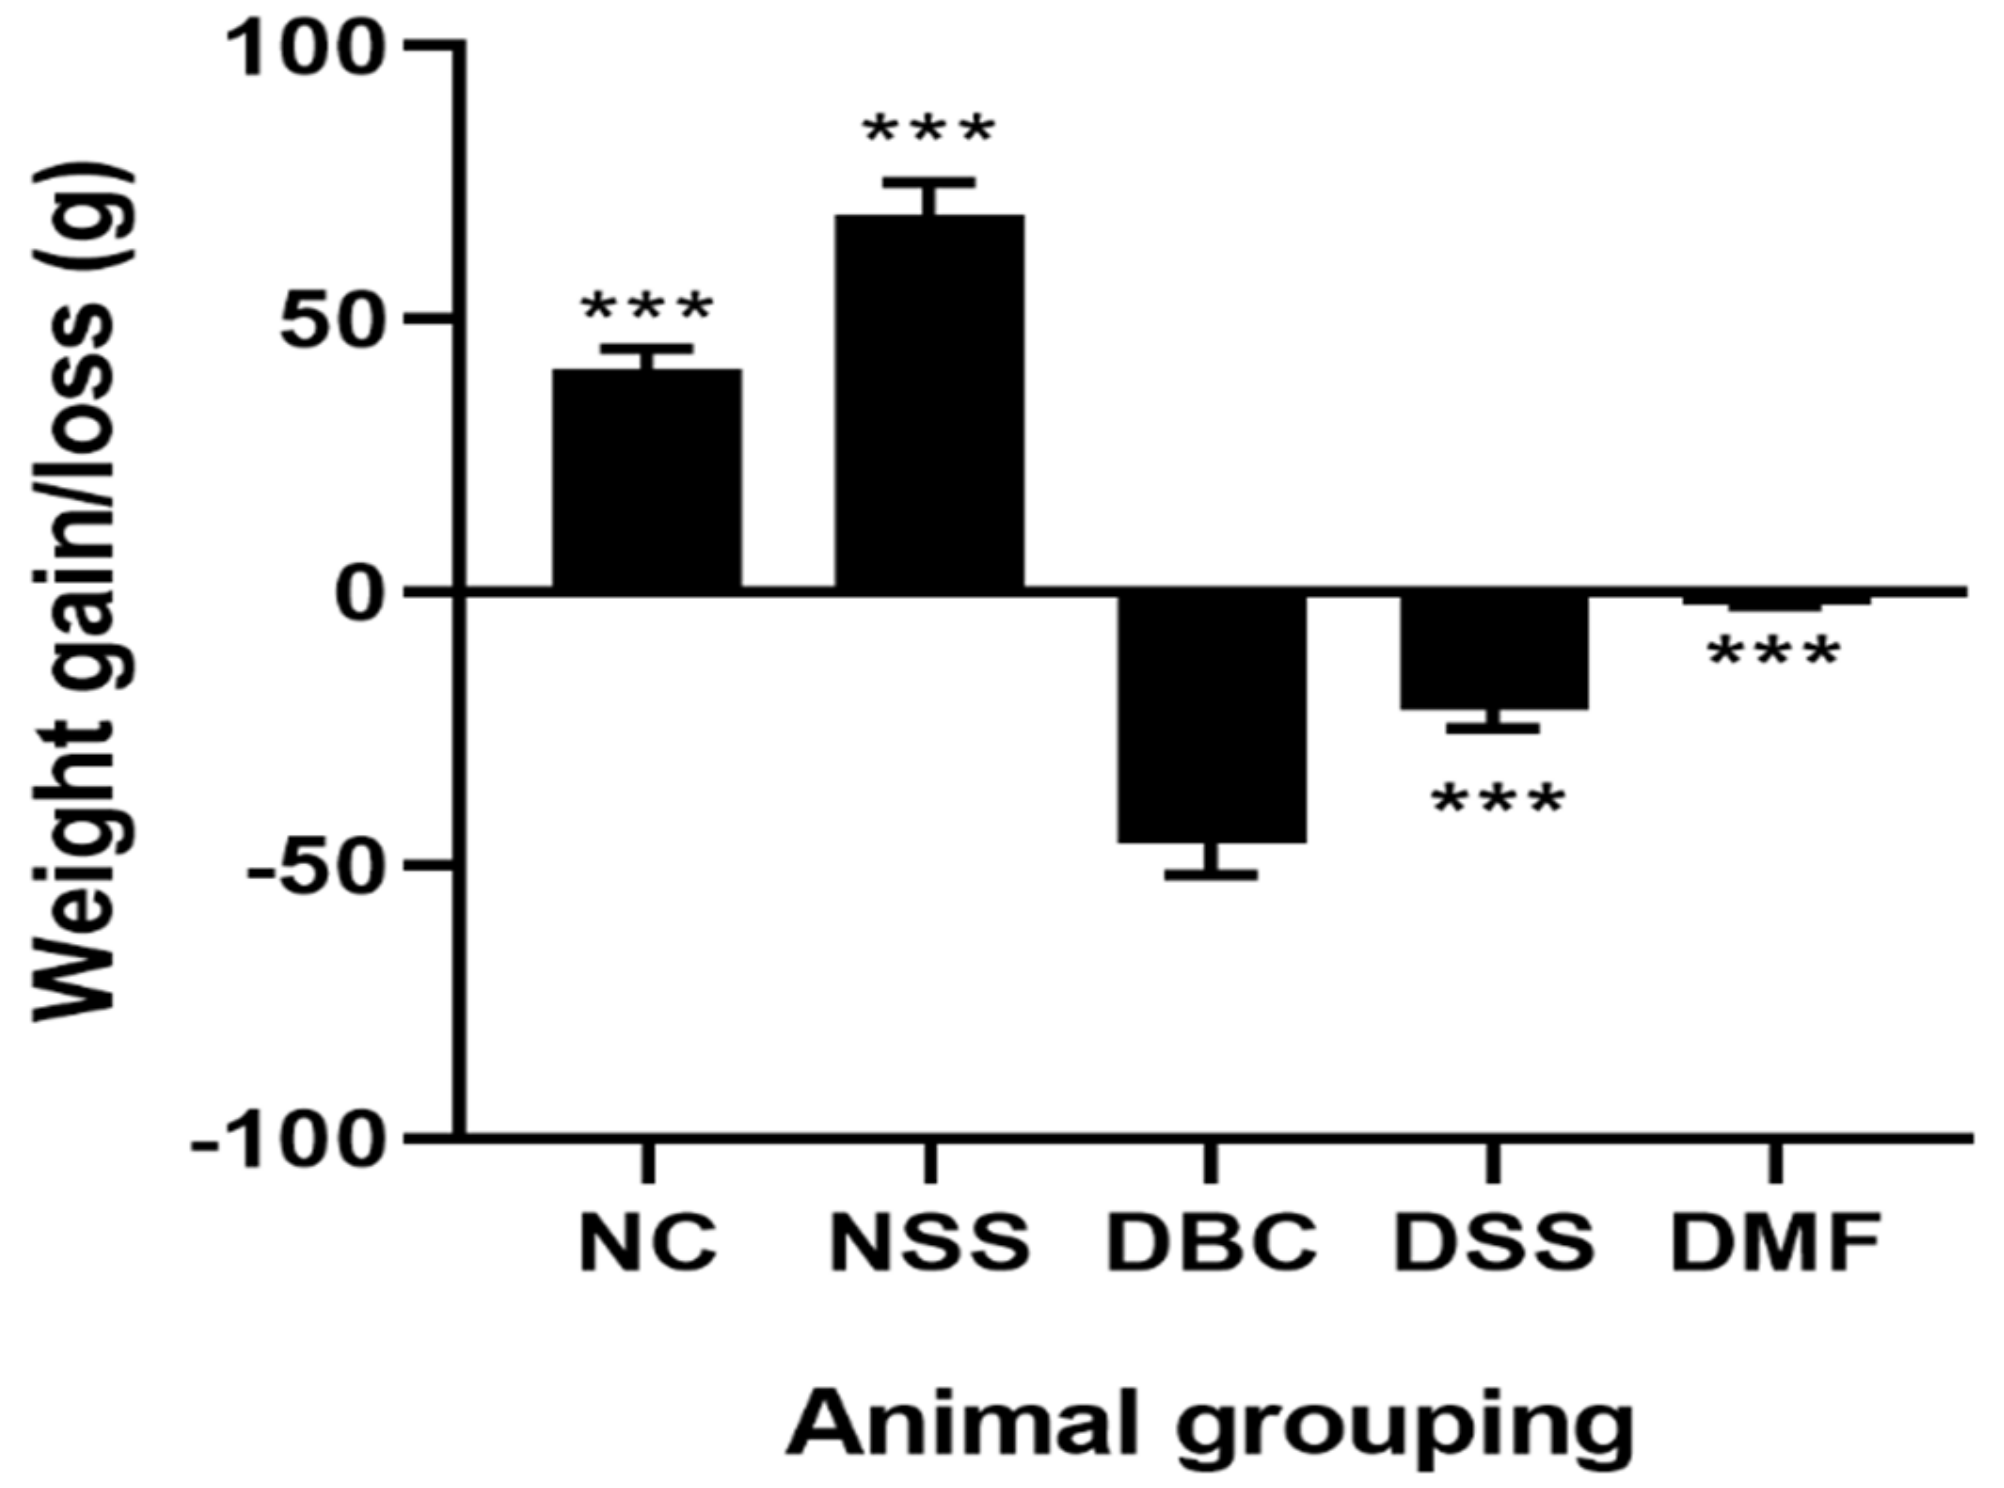
3.1. The Effect of MSSC on Body Weight

After feeding the animals for six weeks, the average body weight gain of untreated non-diabetic rats (NC) increased to 40.78 ± 3.85 g, while the untreated diabetic rats (DBC) experienced a significant weight loss of 45.98 ± 5.81 g, as shown in Figure 1. The NSS group had a significant body weight gain of 69.06 ± 4.21 g. Similarly, the metformin-treated group (DMF) sustained its body weight while the diabetic rats treated with the sweetener (DSS) reduced their body weight to −11.9 ± 1.21 g after six weeks of daily oral administration.

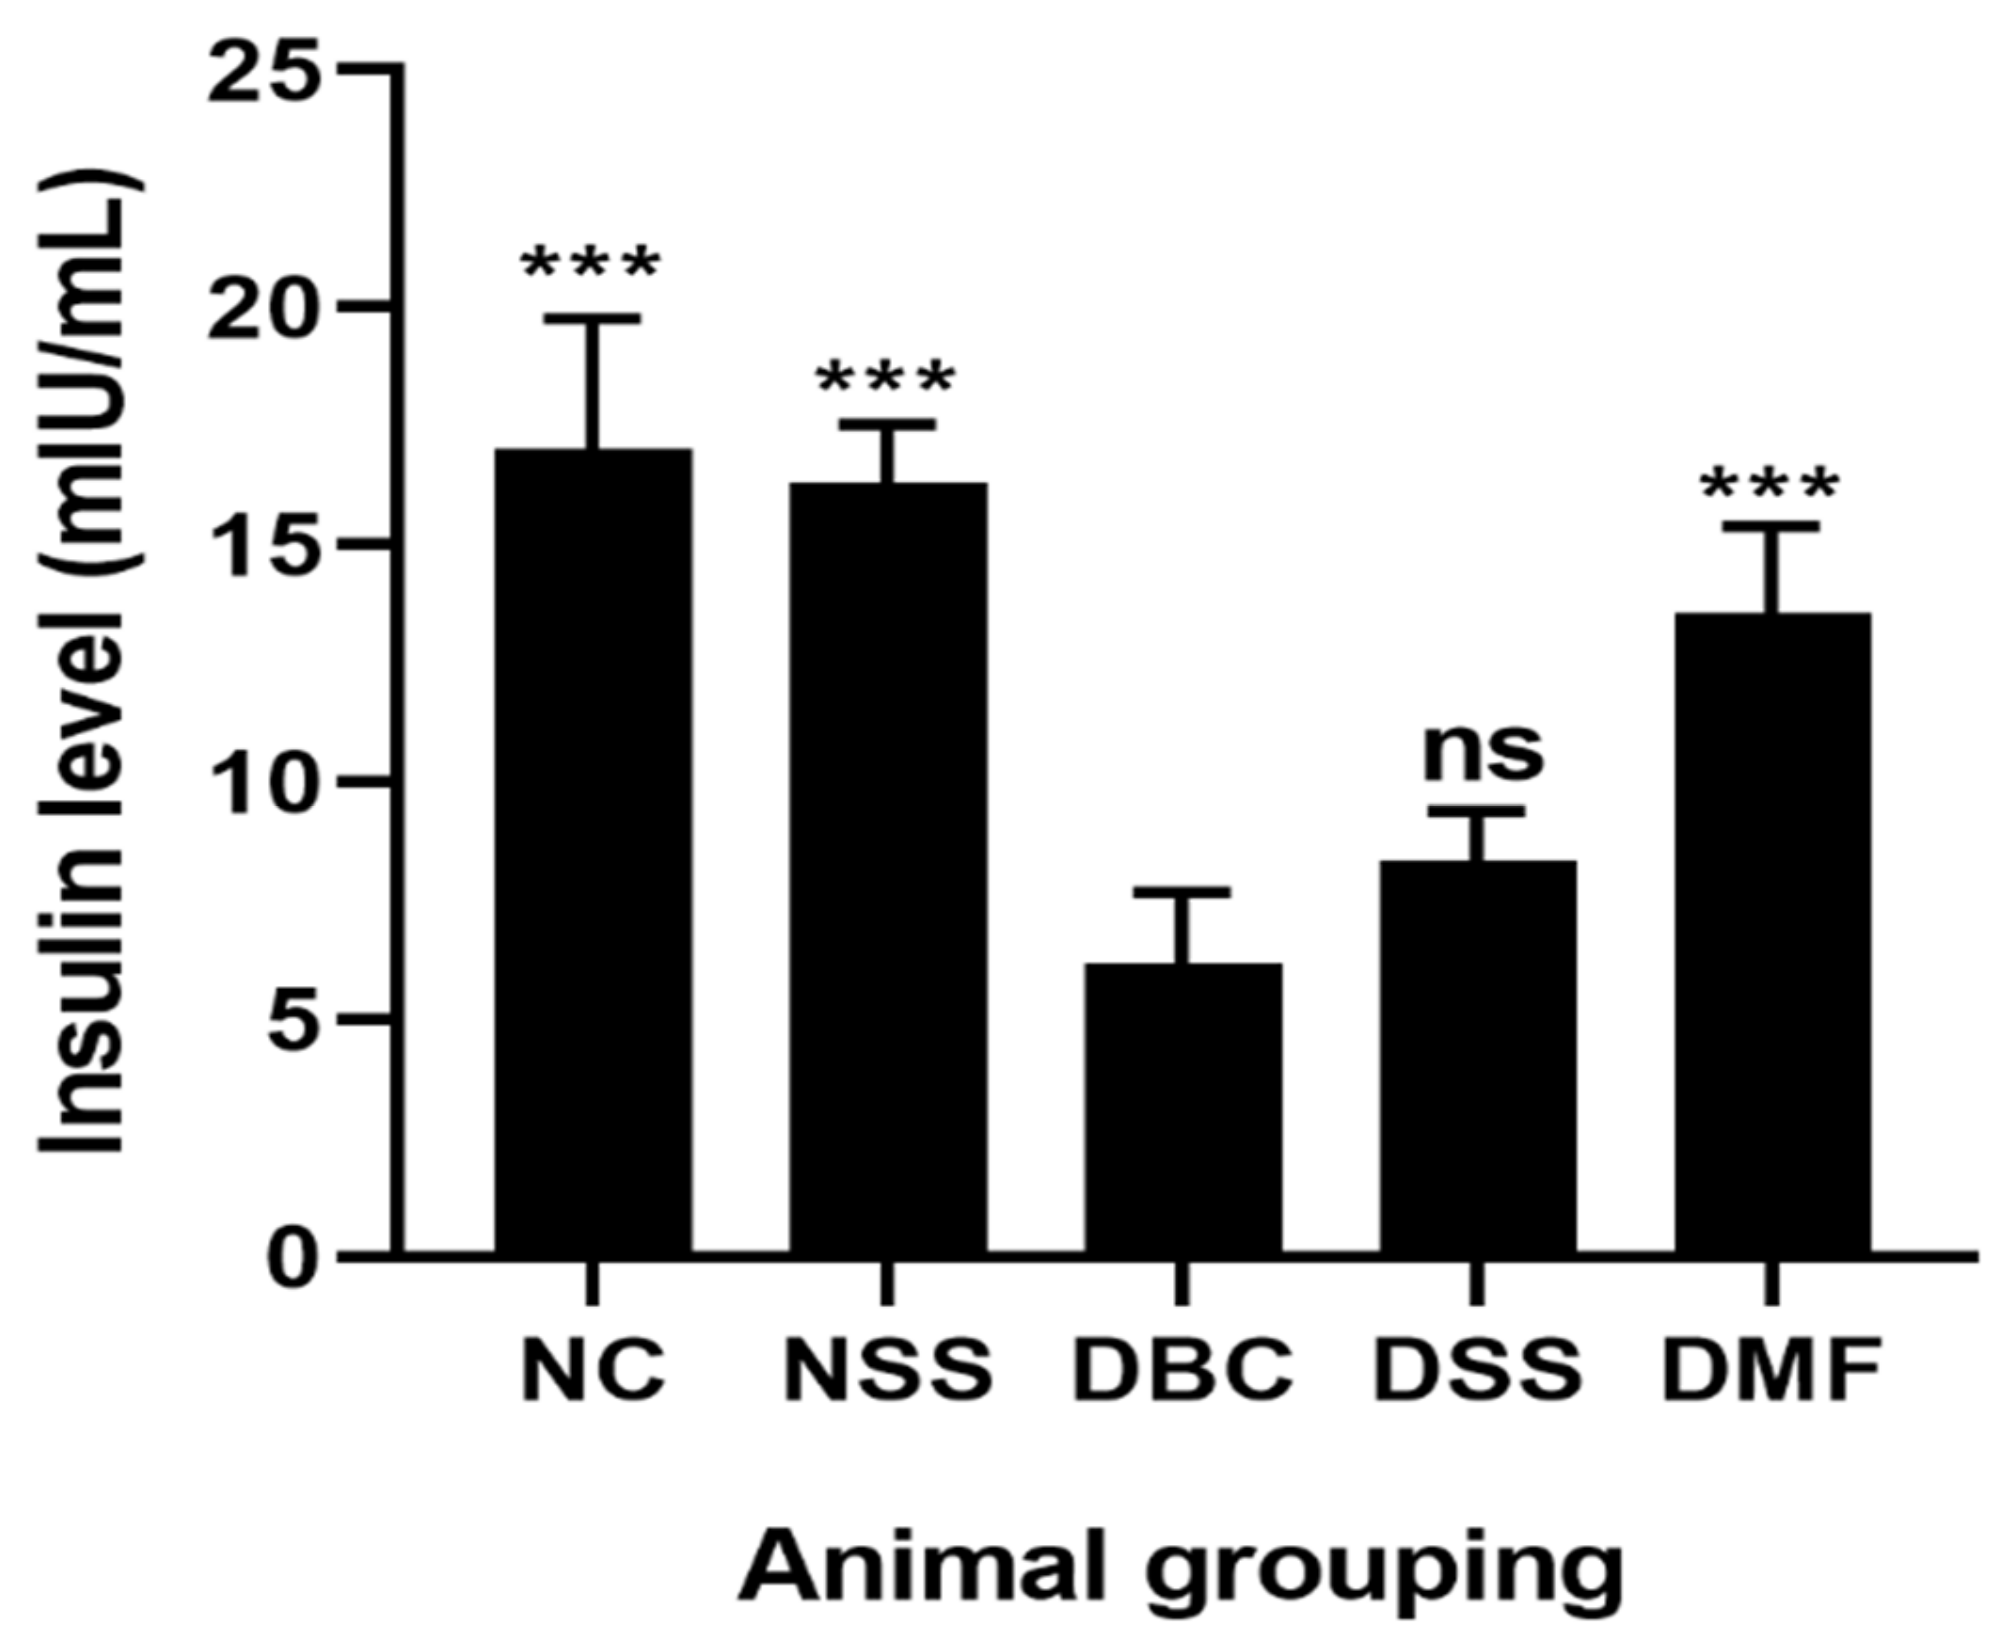
3.2. Effect of MSSC on Fasting Blood Glucose (FBGL) and Insulin Level

The induction of T2D in experimental animals by fructose-streptozotocin resulted in hyperglycemia, as shown in Table 1. At the end of six weeks of treatments, there was a progressive increase of FBGL in DBC (86.5 ± 3.11 mg/dL), while the normal control (NC) rats maintained their blood glucose level throughout the experimental period. The treatment of diabetic rats with the sweetener resulted in a significant reduction (↓ 26.67 mg/dL, p < 0.001) of fasting blood glucose compared to the DBC group. The NSS group did not cause hypoglycemia. The percentage reductions of fasting glucose levels for the NSS, DSS, and DMF groups are 3.63, 7.35, and 45.34%, respectively. Figure 2 shows that MSSC did not significantly enhanced insulin secretion from the pancreatic β cells of diabetic rats at the tested dosage (p > 0.05).

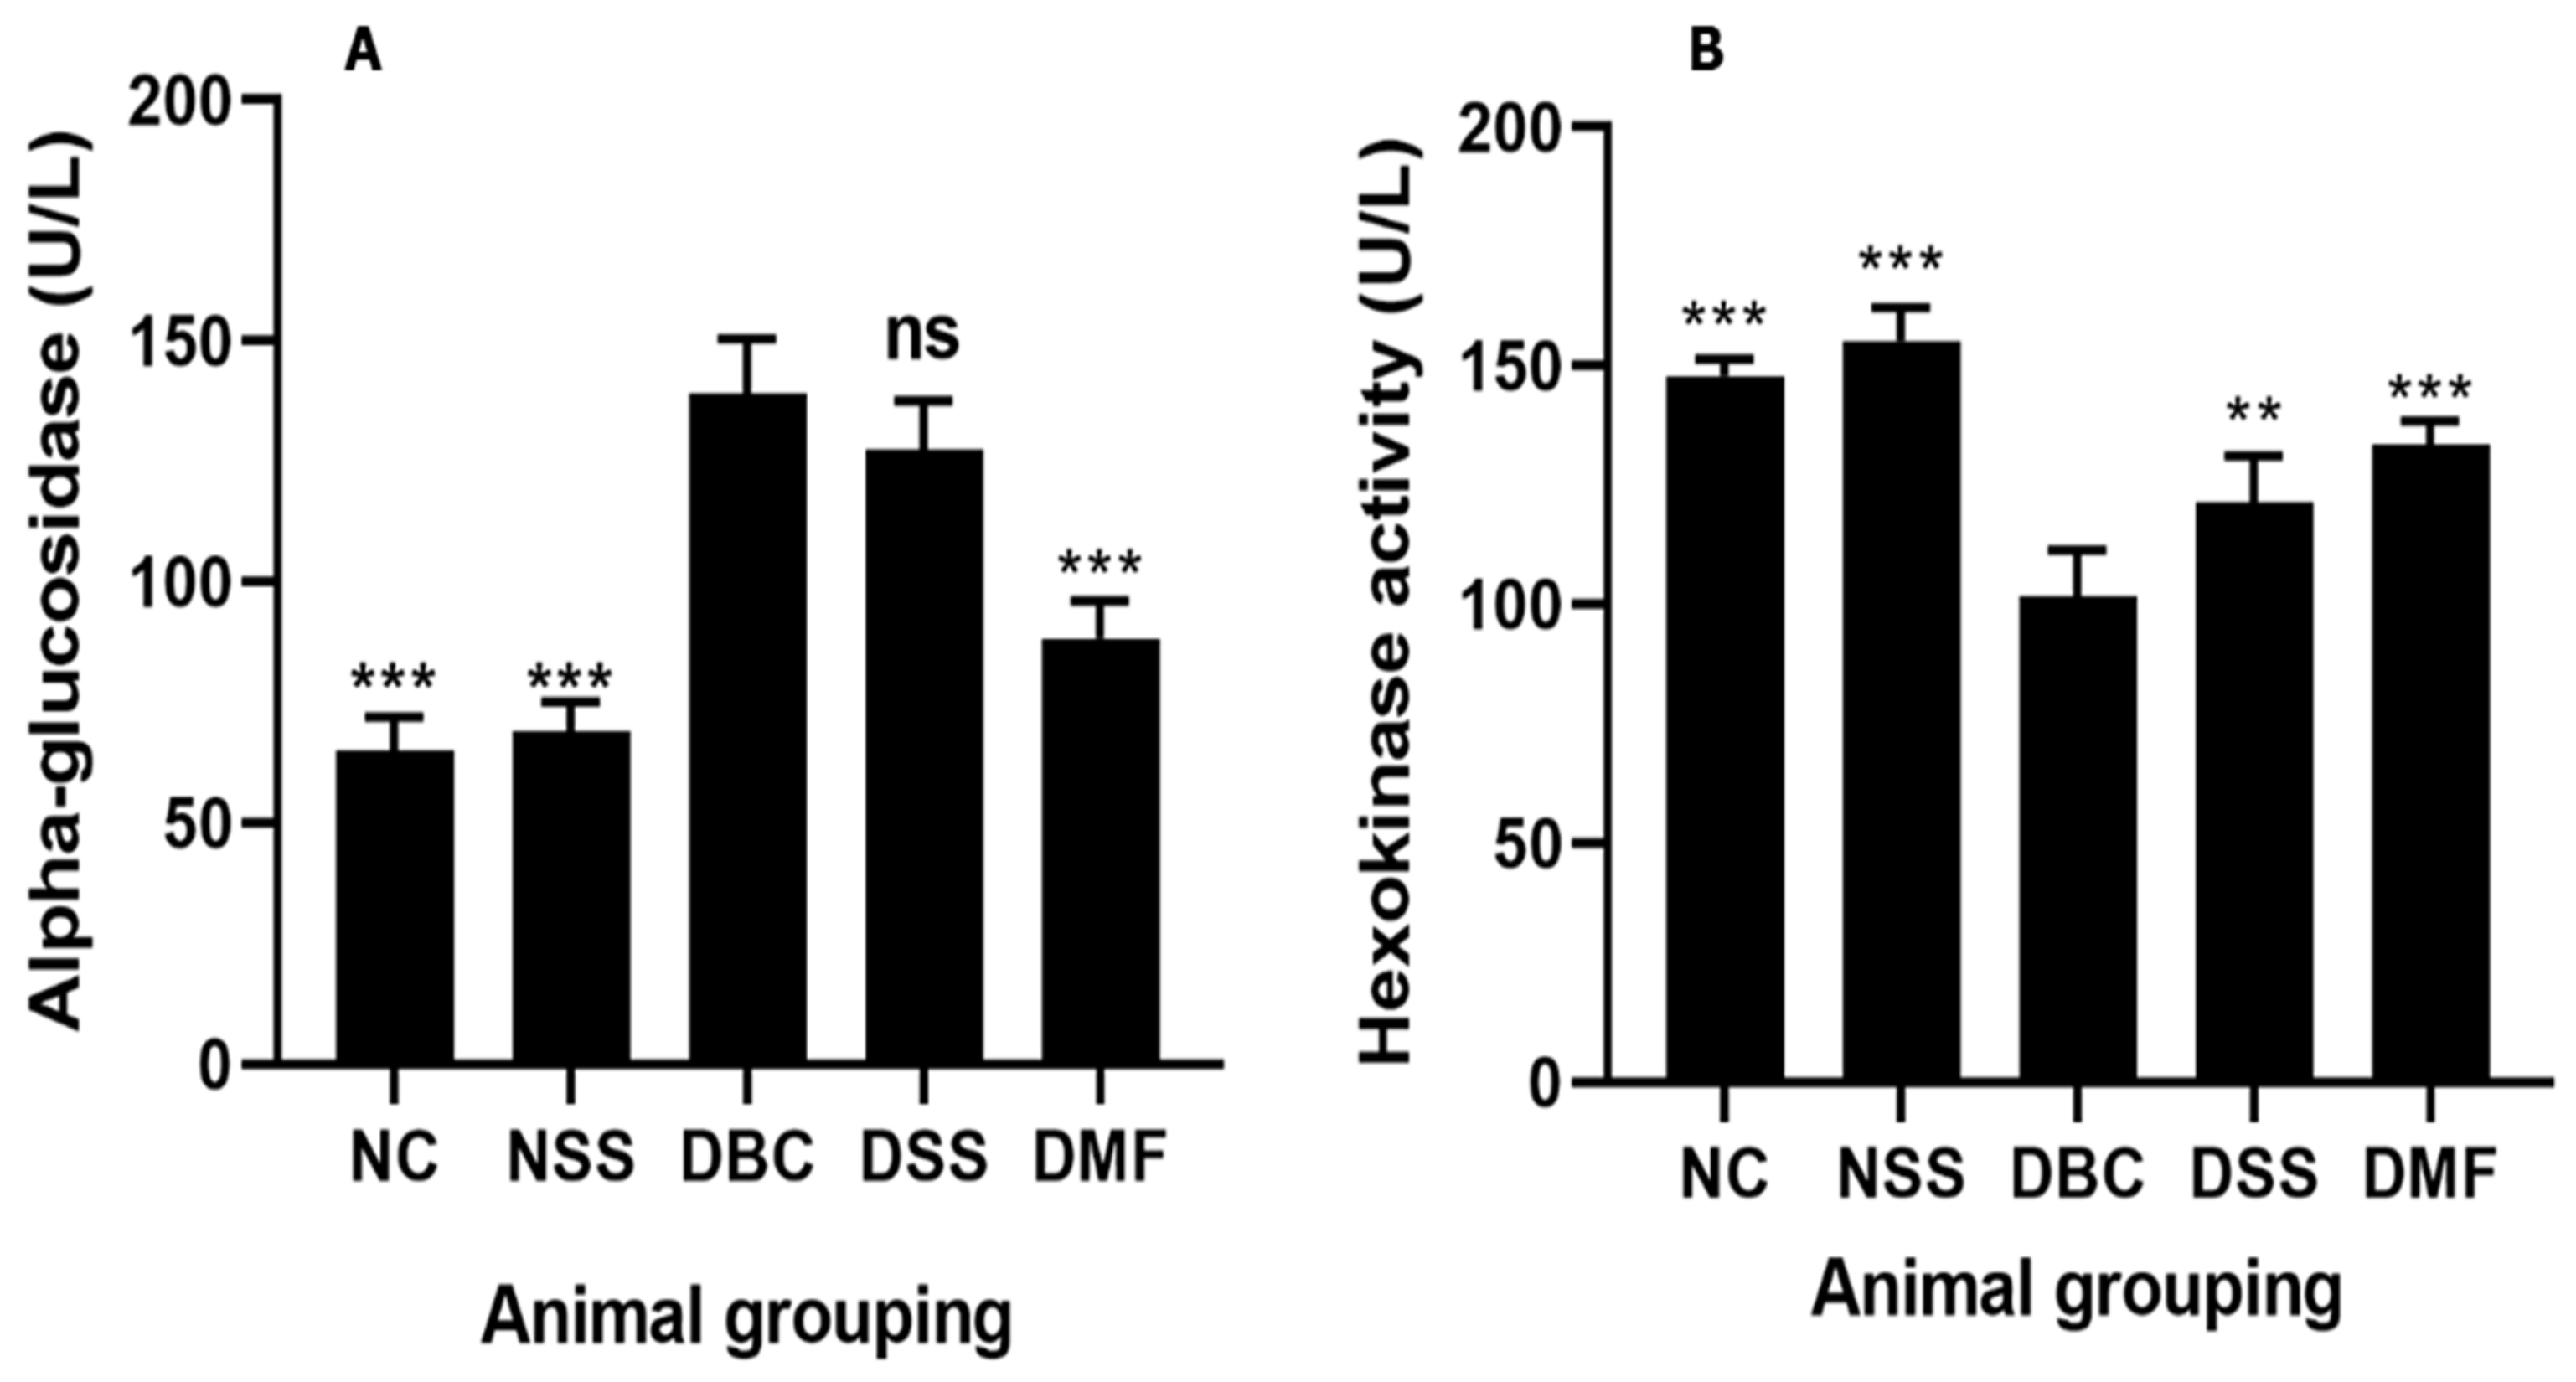
3.3. Effect of MSSC on Hepatic Alpha-Glucosidase and Hexokinase Activity

As shown in Figure 3A, MSSC inhibited alpha-glucosidase activity by 1.39-fold in the isolated livers of diabetic rats. At the same time, the metformin-treated rats exhibited a significant reduction (p > 0.001) in enzyme activity, by 45% compared to the DBC rats. Both the NSS and NC groups displayed a comparable effect of alpha-glucosidase activity. In Figure 3B, the hexokinase activity decreased significantly in diabetic rats, contrary to the observation in DBC rats. After six weeks of oral administration of MSSC, a significant hexokinase activity was obtained but was less effective than DMF (p < 0.05). In general, the sweetener in the NSS group showed comparable enzyme activity with the NC group.

3.4. Effect of MSSC on Serum Lipid Profile

Table 2 shows the effect of commercial sweeteners on the serum blood concentration of total cholesterol, triacylglycerol, HDL-C, and LDL-C in untreated diabetic or non-diabetic rats. In this study, we observed a significant increase in the total cholesterol, triacylglycerol, and LDL-C concentration, while the HDL-C was found to be low in the DBC rats compared to the NC rats. No significant difference was observed in non-diabetic rats administered with the sweetener after six weeks of the experimental period compared with the non-diabetic rats (p > 0.05). Further, the diabetic rats treated with the sweetener exhibited a significant increase in total cholesterol, TAG, and LDL-C (p < 0.05), but the treatment did not affect the level of HDL-C compared to the untreated non-diabetic rats. Also, the metformin-treated group compared favorably with the NC group.

3.5. Effect of MSSC on In Vivo Antioxidant Enzyme Activity

Table 3 shows the effect of MSSC on the antioxidant status in the isolated pancreases of diabetic and non-diabetic rats. In the diabetic control group, our data show a significant reduction in GSH, SOD, CAT, and GPx activities but a significant increase in MDA level (all p < 0.05). The treatment of non-diabetic rats with MSSC reduced the catalase activity but had no significant effect (p < 0.05) on other antioxidant parameters compared to the NC group. After six weeks of the experiment, MSSC increased the CAT, MDA, GPx, and GSH levels but decreased MDA levels in diabetic rats compared to the untreated diabetic rats (p < 0.0001). The results indicate that the diabetic group treated with metformin ameliorated all the antioxidant parameters compared to the NC group.

3.6. The Effect of MSSC on the Liver Functional Indices

The liver marker assay indicated a significant decrease in albumin, protein, and bilirubin but significantly increased urea and creatinine in untreated diabetic rats compared to the untreated non-diabetic rats (all p < 0.05). As indicated in Table 4, the oral administration of MSSC to the non-diabetic rats did not alter the concentrations of the parameters mentioned above except for ALP and AST. Moreover, the diabetic rats treated with the commercial sweeteners exhibited a significant (p < 0.0001) decrease in albumin, protein, and bilirubin while the level of urea, ALP, and AST was significantly (all p < 0.05) increased. At the same time, no significant (p < 0.05) difference was observed in creatinine and ALT compared with the untreated non-diabetic rats. A comparison of the MSSC-treated diabetic rats with an untreated diabetic group showed a significant (p < 0.05) difference in ALP, creatinine, bilirubin, and protein levels. The data obtained from the metformin-treated group compared favorably with the NC and NSS groups (all p < 0.05).

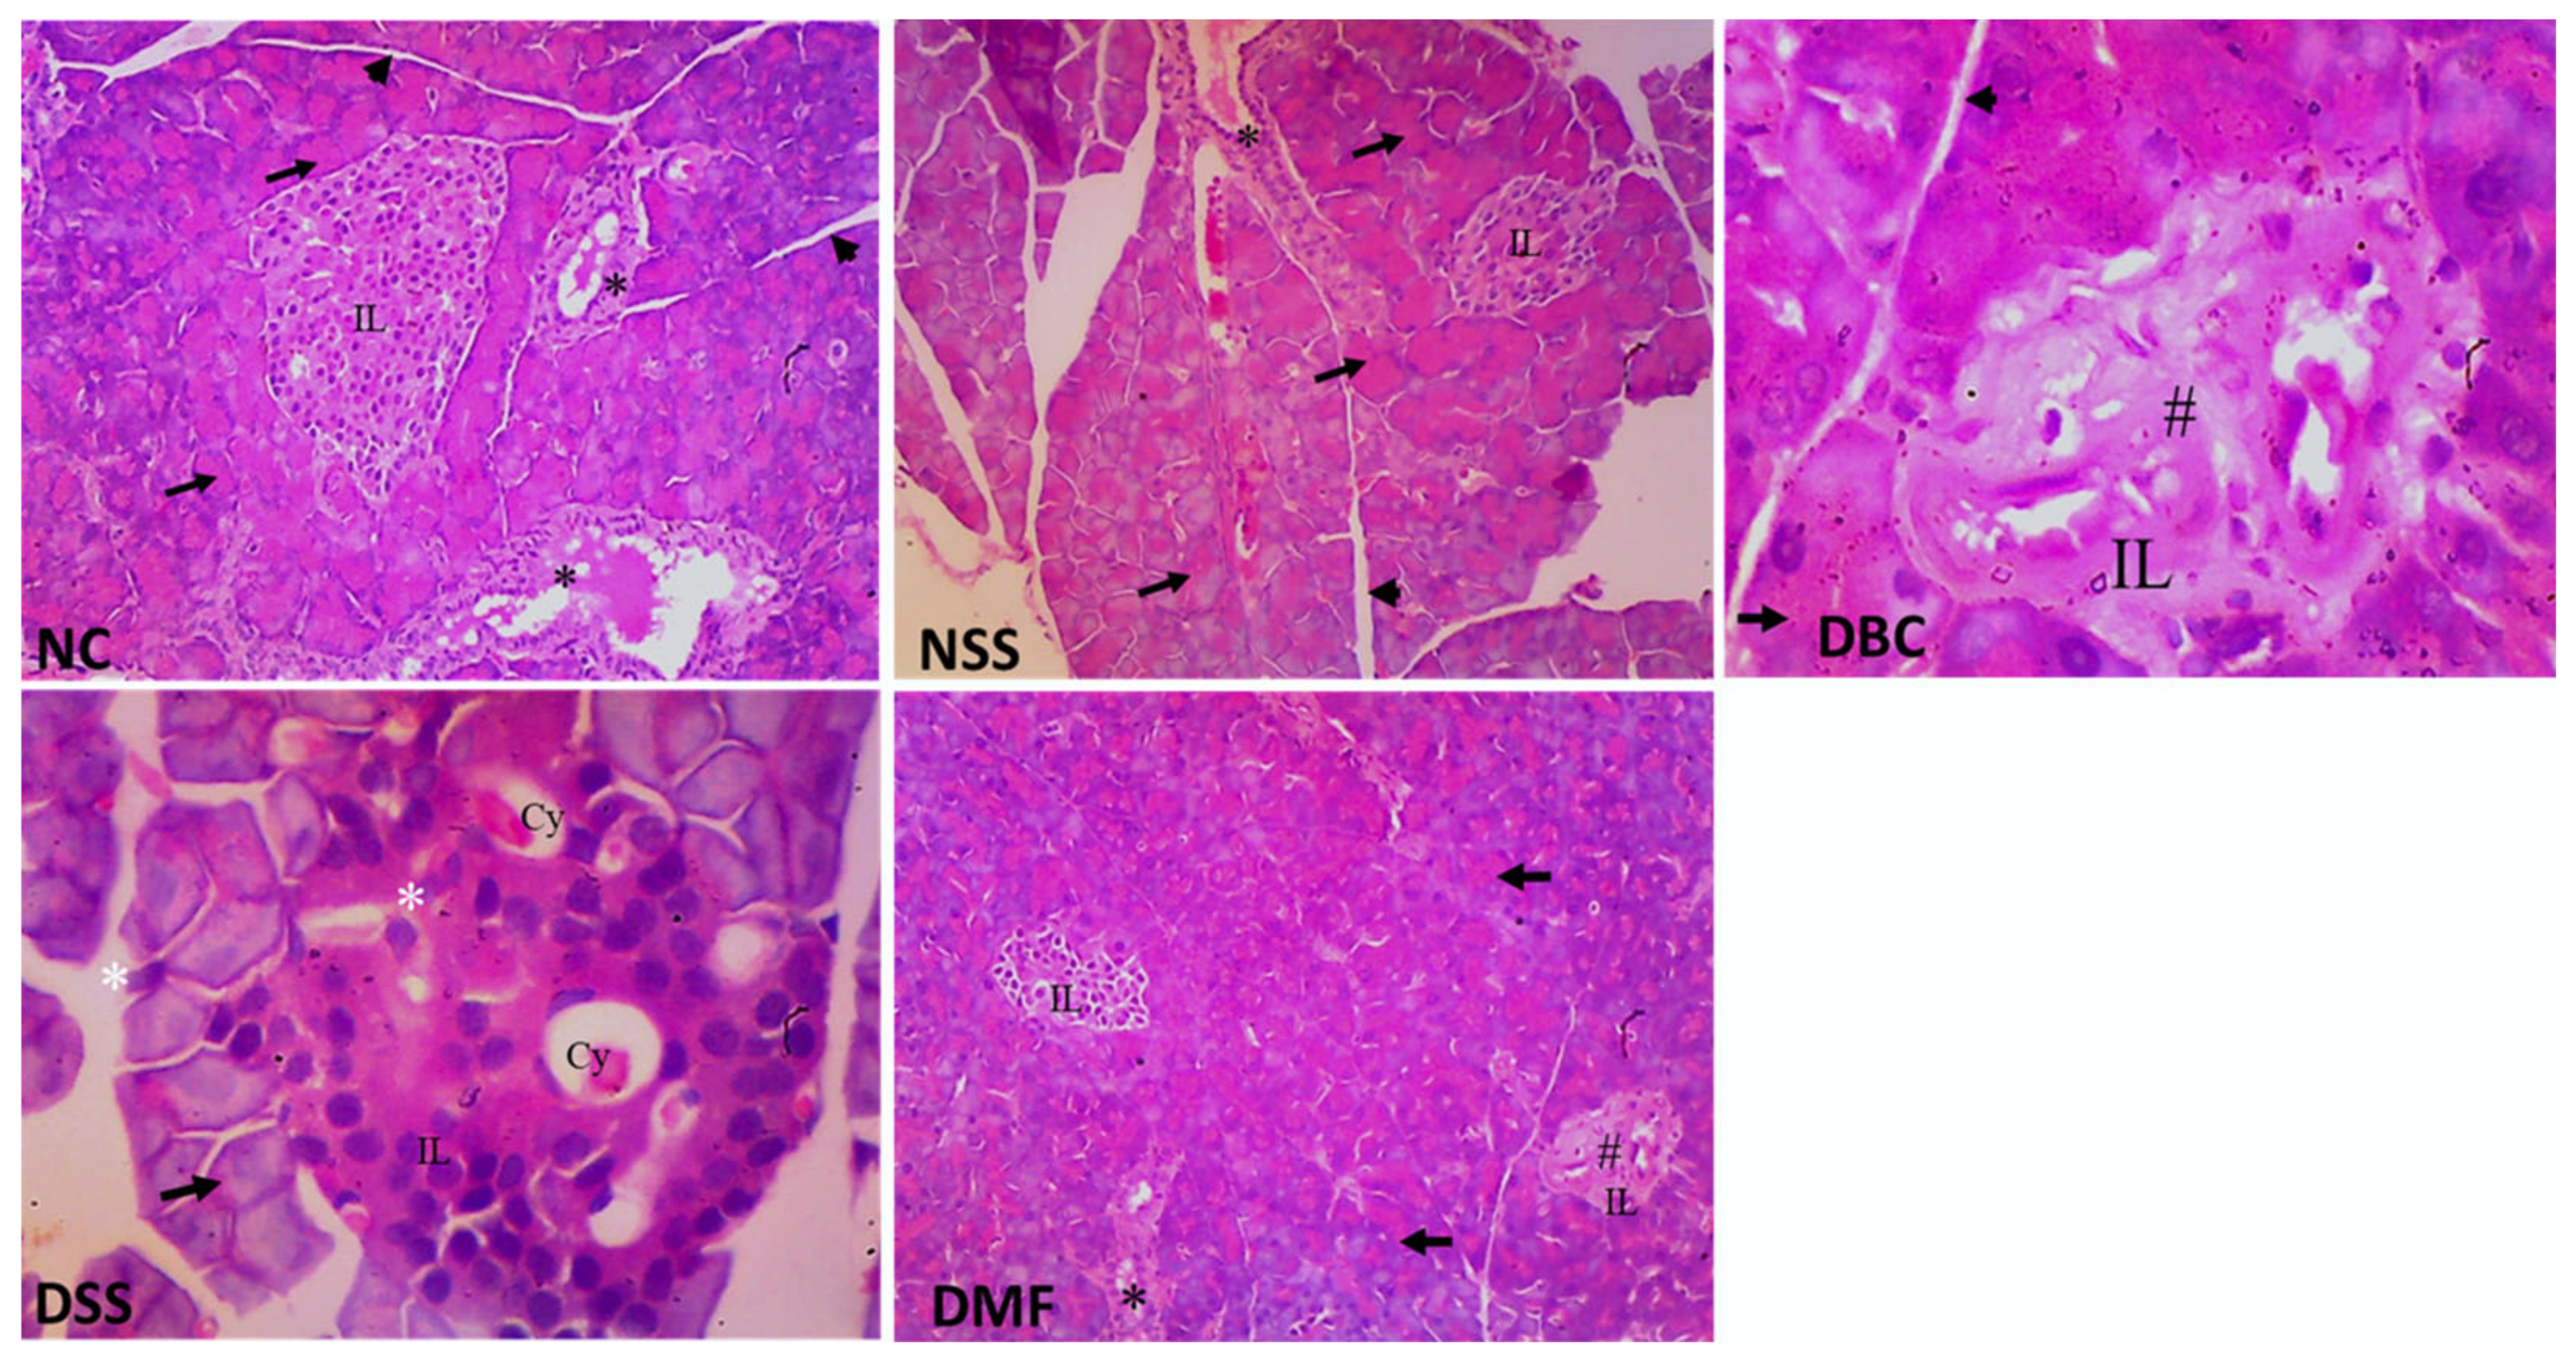
3.7. Histopathological Studies of Pancreas

The results of the histology architecture of the pancreas excised from the treated and untreated non-diabetic or diabetic rats are presented in Figure 4. The histological section of the pancreas from NC rats showed normal numerous secretory acini (arrows), an islet cell (IL), interlobular connective tissue (arrowhead), and the pancreatic duct with eosinophilic secretions (black asterisk). On the other hand, the pancreatic sections of the DBC rats showed various thickened interlobular connective tissues and degenerated endocrine cells within their islets, indicating necrosis. The pancreatic section of the NSS group showed similar architecture to the NC rats by depicting normal serous acinar and zymogenic cells, normal interlobular connective tissue, and compact islets of endocrine cells. Similarly, the pancreatic section from the DSS group showed an improved normal secretory acinus (arrows) and an islet cell (IL). Also seen are interlobular connective tissue (arrowhead), and the acinar was predominantly basophilic from the apical to the nuclei’s basal part, with no pathology changes compared with the untreated diabetic group. Additionally, the section of the pancreas from the metformin-treated diabetic rats of the (DMF) group showed numerous normal acini (arrow), islet cells (IL), pancreatic ducts with eosinophilic secretions (black asterisk), and interlobular connective tissue (arrowhead) without pathological changes comparable to the NC group.

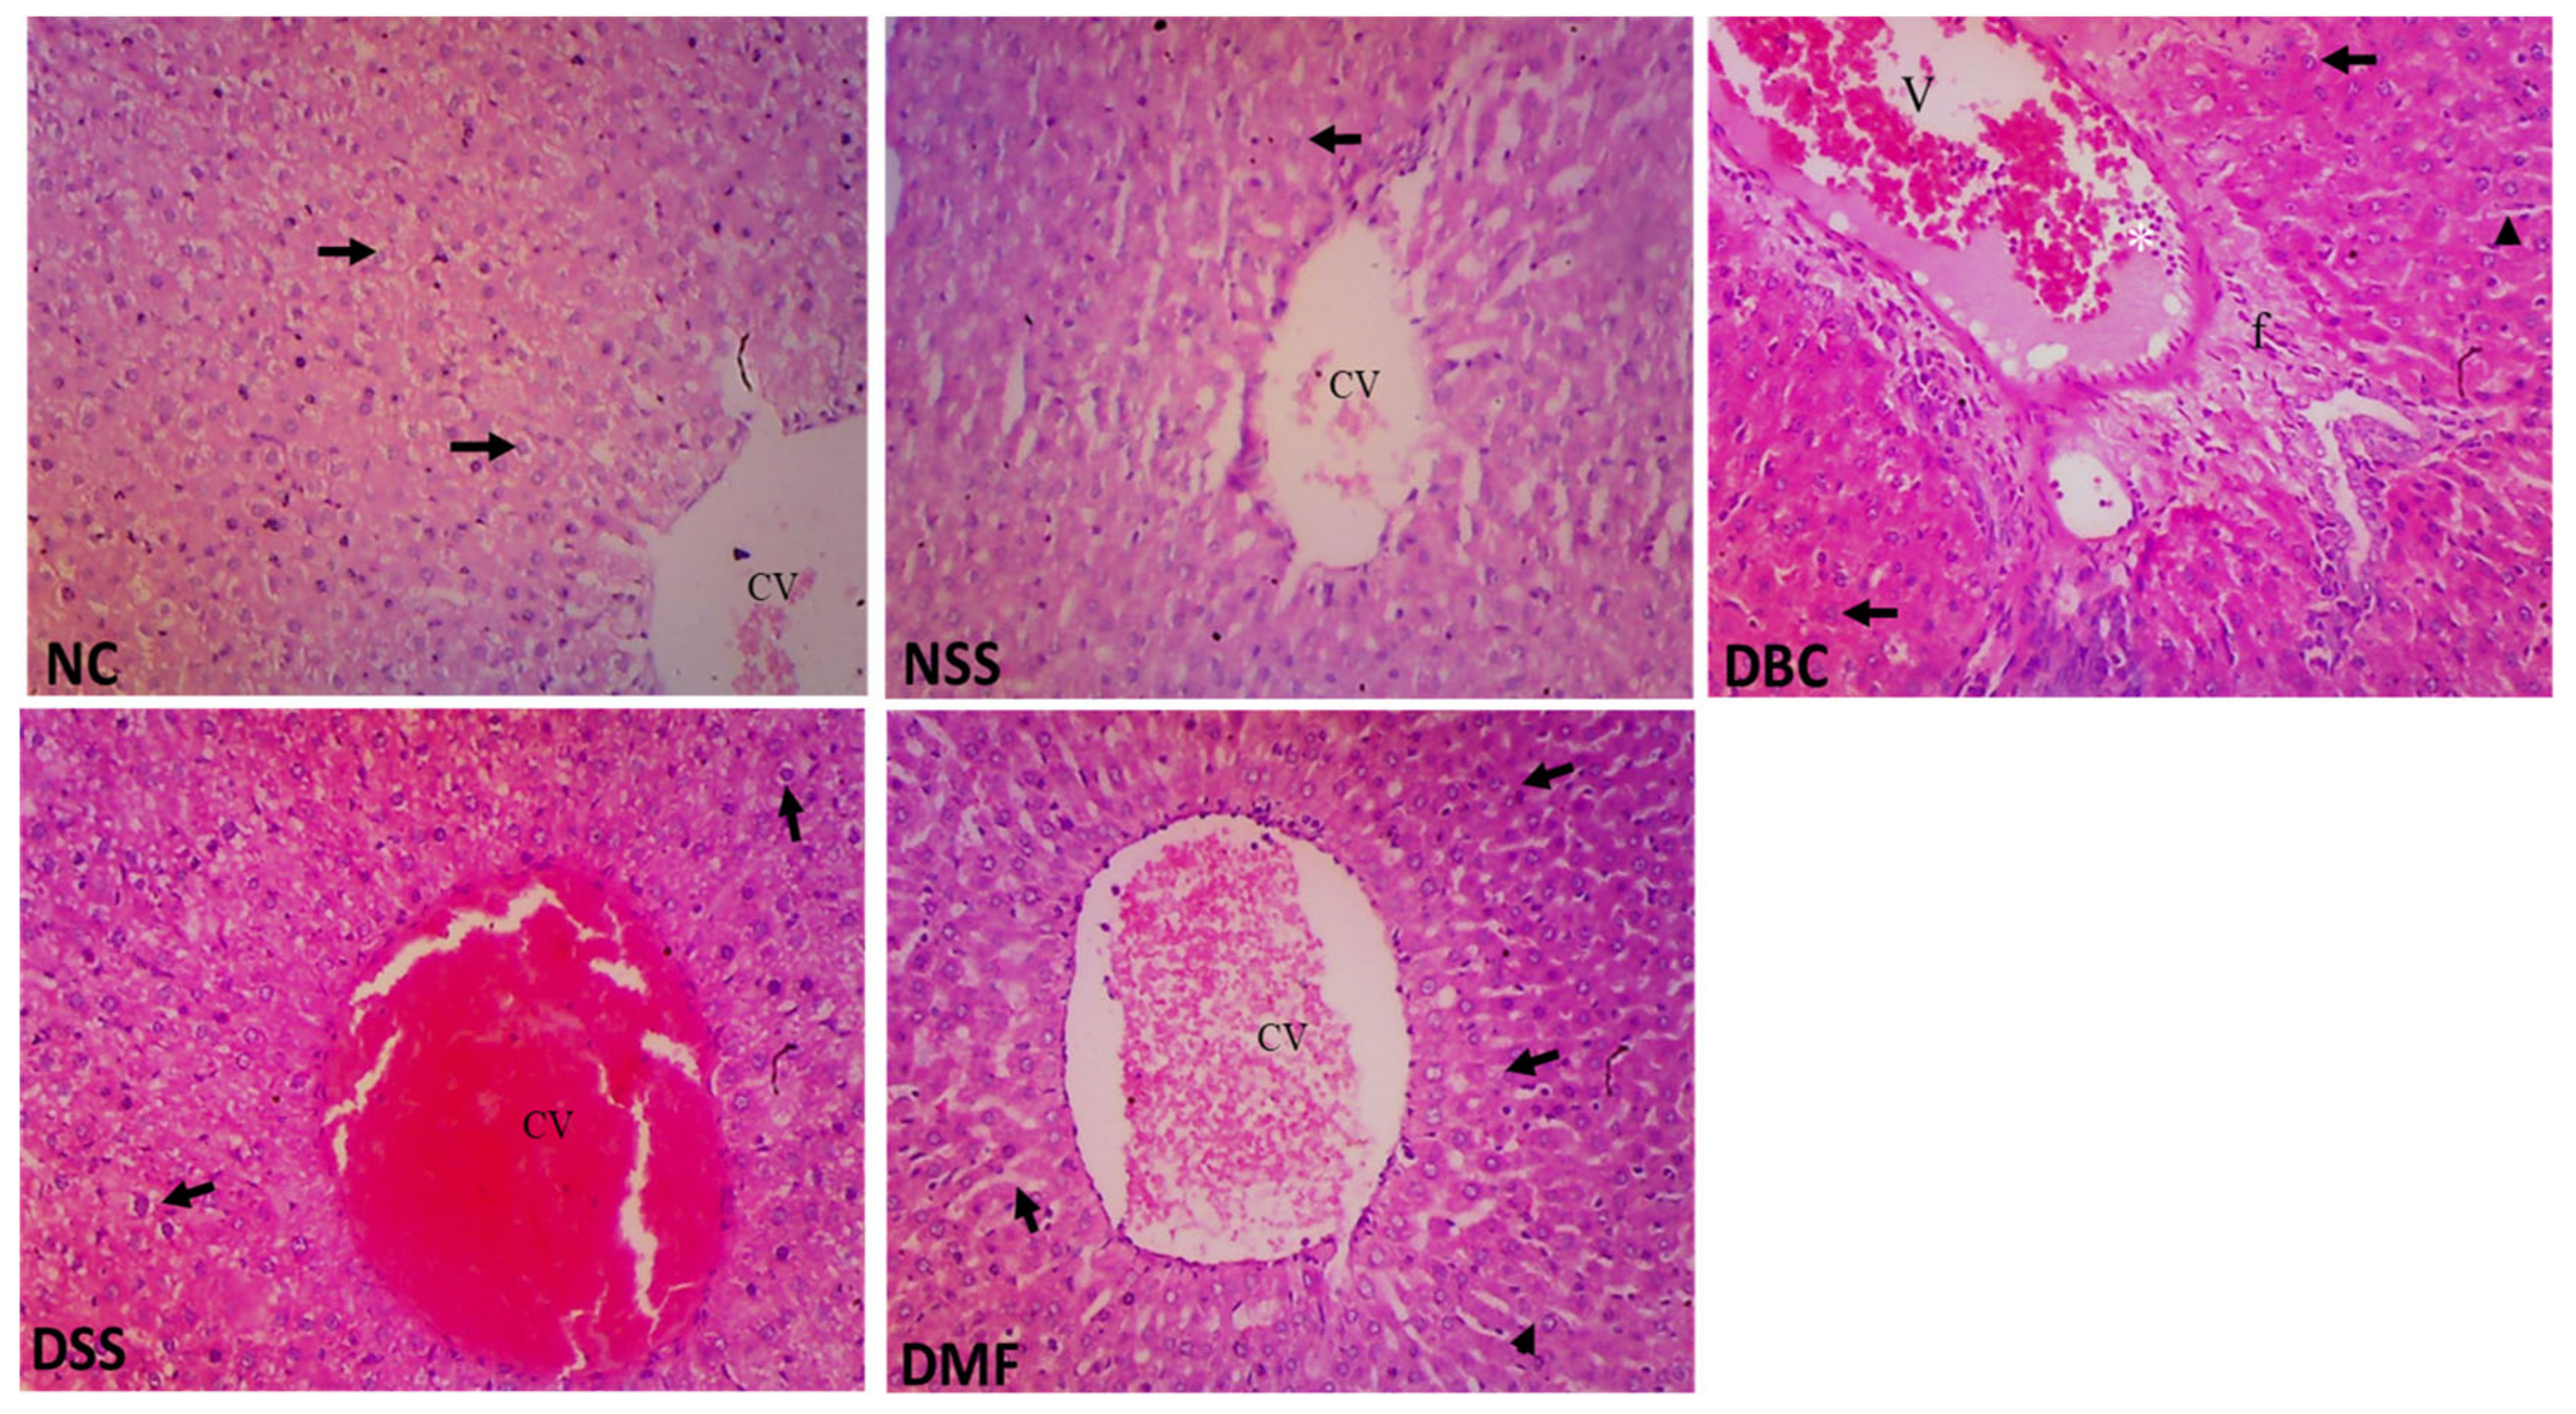
3.8. Histopathological Studies of Liver

Figure 5 shows the photomicrographs of a liver tissue section from non-diabetic, untreated diabetic, and diabetic rats treated with commercial sweetener or standard metformin. The histological investigations of NC and NSS rats showed a normal histoarchitecture of hepatic lobules with normal hepatocytes arranged in interconnecting radiating cords around the central veins (V). Conversely, the liver tissue of DBC rats showed severe coagulative necrosis (black arrow) of the centrilobular and mid-zonal hepatocytes with moderate infiltration of phagocytic mononuclear leukocytes. The oral sweetener administration to the diabetic rats for six weeks reversed coagulative hepatic necrosis showing moderate hepatocytes arranged in interconnecting radiating cords around the central veins (V), and the radiating cords terminate at the periphery of the hepatic lobules. The DMF group showed a typical liver histology architecture, with arrays of hepatocytes, dilated hepatic vein (V), and perivascular inflammation with evidence of inflammatory cells (white asterisk), focal areas of Kupfer cells (notched arrow), hyperplasia. All the data except for the untreated diabetic rats showed a well-preserved histology architecture showing an average-sized central vein (CV) and arrays of hepatocytes (black arrows) and sinusoid (arrowhead).

4. Discussion

Our recent survey uncovered the widespread consumption of mixed sweeteners supplemented with chromium picolinate and steviol glycosides in the Umuahia metropolis, without scientific investigations to validate their health benefits or adverse effects in both healthy and diabetic individuals. Hence, this study was undertaken to address this gap. The mixed sweeteners were found to modulate the serum lipid profiles and improve the pancreatic antioxidant status of diabetic rats without negatively impacting non-diabetic rats. Furthermore, they mitigated some renal function parameters in diabetic rats without influencing the non-diabetic rats and moderately restored the architectures of deranged livers and pancreatic β cells. Additionally, we observed a slight reduction in blood glucose levels corresponding to improved insulin levels.
After six weeks of fructose-streptozotocin induction of diabetes, untreated diabetic rats exhibited significant weight loss, a common clinical manifestation of T2D (Figure 1). The weight reduction is attributed to fat loss from adipose tissue, catabolism of amino acids, and the degradation of structural proteins to compensate for low glucose utilization during ATP synthesis [8]. A similar observation in diabetic rats induced with fructose-streptozotocin was reported by Chukwuma et al. [23]. However, the daily oral administration of MSSC to non-diabetic rats resulted in an increased body weight, probably due to reduced satiety and changes in the gut microbiome [24]. The body weight reduction observed in untreated diabetic rats was significantly enhanced after MSSC administration. Steviol glycoside and chromium have been associated with body weight management via alterations in gut microbiota and higher caloric intake thus could be responsible for this observation [25,26]. Although information about the interaction of these sweeteners is currently limited, the potential of mixed sweeteners supplemented with chromium for weight management presents a promising avenue for future research.
Oral administration of fructose for a duration of two weeks, in conjunction with a single intraperitoneal injection of streptozotocin (40 mg/kg), effectively induces T2D in rats, closely replicating the etiological and pathophysiological conditions observed in humans [16]. Notably, the administration of MSSC resulted in a significant reduction in serum fasting blood glucose levels, which correlated with a moderate increase in insulin secretion (Figure 2). Sorbitol, a component of the MSSC has demonstrated improved muscle glucose uptake in both diabetic and non-diabetic individuals [23]. Steviol glycosides has also been reported to improve pancreatic β-cell functionality and activate GLUT4 gene expression in diabetic rats [27,28]. Research by Cefalu [29] found that chromium picolinate supplementation (500 µg/day) significantly lowers blood glucose levels in T2D patients by enhancing insulin signaling through the activation of PI3-kinase and Akt, and GLUT4 translocation for improved glucose uptake [30]. Additionally, chromium plays a crucial role in alleviating insulin resistance by downregulating protein tyrosine phosphatase-1B (PTP-1B) a negative regulator of insulin signaling. Therefore, these components of the supplemented mixed sweeteners may contribute to the observations reported in this study. Further clinical investigations are necessary to validate these findings and enhance our understanding of the underlying mechanisms.
Furthermore, a restoration of hexokinase activity has been reported to offer a potential therapeutic strategy for diabetes treatment through enhanced glucose utilization and glycogen synthesis [31]. In our study, the activity of liver hexokinase, responsible for converting glucose into glucose-6-phosphate, was remarkably decreased in untreated diabetic rats, consistent with findings by Ekakitie et al. [31]. Following six weeks of the daily oral administration of MSSC, an elevated liver hexokinase activity was observed (Figure 3B), potentially due to improved insulin secretion. However, the sweetener-treated diabetic rats exhibited weak inhibition against alpha-glucosidase (Figure 3A).
The disruption of lipid profiles is a critical factor in the pathogenesis of type 2 diabetes (T2D), leading to lipid peroxidation and subsequent complications, including atherosclerosis and cardiovascular diseases [32]. In this study, the administration of fructose and streptozotocin induced hyperlipidemia in diabetic rats, likely due to the activity of lipolytic hormones on adipose tissue [33]. Conversely, the negligible impact observed in non-diabetic rats treated with the supplemented sweeteners suggests that the consumption of MSSC does not significantly influence lipid profiles in healthy individuals, which is relevant to body weight management (Table 2). The beneficial effects noted from the oral administration of MSSC in diabetic rats indicate its potential to normalize lipid profiles in this population, possibly mediated by chromium’s action in lipase inhibition, thereby mitigating complications associated with diabetes [34,35,36]. Further research is warranted to elucidate these mechanisms and their implications in diabetes management.
In individuals with type 2 diabetes (T2D), prolonged high blood glucose levels can lead to a compromised antioxidant status, resulting in oxidative stress and subsequent damage to tissues and organs. Several sweeteners investigated in clinical trials including studies with both healthy participants and those with diabetes, have generally demonstrated no significant effect on antioxidant parameters [37,38]. However, the findings from the current study reveal that MSSC exerted a selective positive influence on glutathione peroxidase and catalase activity, while concurrently reducing malondialdehyde levels, a well-established marker of lipid peroxidation (Table 3). Our findings imply that quaternary sweeteners, when supplemented with CrPic, may possess the capacity to mitigate oxidative stress in diabetic individuals. Supporting this notion, a study by Mchunu et al. [39] also highlighted the potential of non-nutritive sweeteners to enhance antioxidant enzyme activity. Additionally, dietary supplementation with chromium or steviol glycosides has been reported to improve antioxidant biomarkers in diabetic rat models [40]. It is plausible that the synergistic effects of these components within the sweetener matrix contributed to the neutralization of free radical generation through the enhancement of antioxidant enzyme activities.
Prolonged hyperglycemia can result in significant liver damage due to an imbalance between the production of free radicals and the body’s antioxidant defenses. If left untreated, this imbalance may lead to liver scarring, cirrhosis, liver cancer, and vascular damage in the kidneys [41,42]. Diagnosis of these conditions is often indicated by elevated liver markers such as alkaline phosphatase (ALP), alanine aminotransferase (ALT), and aspartate aminotransferase (AST), as well as alterations in protein levels, bilirubin, albumin, urea, and creatinine in diabetic kidney disease [43,44]. Our findings confirmed that the induction of diabetes adversely affects liver and kidney function, as evidenced by abnormal changes reflecting the kidney’s diminished ability to filter waste products from the blood [45]. Notably, the oral administration of MSSC to diabetic rats over a six-week period resulted in a relative modulation of specific kidney parameters. Although there was no significant effect on AST and ALT levels, a notable increase in ALP was observed, as illustrated in Table 4. Previous research has indicated that steviol glycosides may aid in normalizing kidney markers such as serum creatinine, uric acid, and albumin in patients with renal dysfunction [46]. This effect may be attributed to their ability to alleviate oxidative damage associated with diabetic nephropathy and protect renal cells from injury, thereby enhancing renal filtration through their antioxidant properties. Additionally, chromium has been shown to mitigate endoplasmic reticulum (ER) stress which may help minimize damage from diabetic nephropathy and promote improved kidney filtration, thereby safeguarding renal cells from injury [47]. Consequently, this study concludes that supplemented sweeteners may provide relative benefits to kidney function in individuals with T2D without negatively affecting renal functionality in non-diabetic subjects. However, further clinical trials are required to confirm the beneficial effects of these sweeteners on kidney parameters in a clinical setting.
The data acquired from the histological studies of the pancreas and liver isolated from untreated diabetic rats (DBC) revealed necrotic areas of pancreatic beta cells and the derangement of liver architecture caused by the free radicals generated after induction of T2D [48]. In contrast, the histology of the liver and pancreas of untreated non-diabetic rats and non-diabetic rats treated with the sweetener showed a normal architecture without structural changes (Figure 4 and Figure 5). The pancreatic section of MSSC-treated diabetic rats exhibited a moderate reversal of necrosis caused by fructose-streptozotocin. This observed necrotic reversal, attributed to the presence of steviol glycosides, sorbitol, and chromium in MSSC, has been reported in the liver and pancreatic beta cells of diabetic rats induced with a high-fat diet and streptozotocin, which could possibly explain this observation [13,29,48]. Additionally, the metformin-treated group effectively reduced the severity of degenerative changes by attenuating and reversing hepatic or pancreatic necrosis. The relative improvement of renal and hepatic biomarkers, glycemic control, and the suppression of oxidative stress through the enhancement of antioxidant enzymes are possibly justified by the moderate reversal of necrosis in the architecture of liver and pancreas tissues. Our study suggests that supplemented sweeteners may have a positive impact on kidney and liver function in individuals with T2D and are unlikely to impair the functionality of these organs in non-diabetic subjects.
The limitations of this study include the absence of long-term data, which raises concerns regarding the sustained safety and efficacy of MSSC for chronic conditions such as diabetes. Although our animal model has yielded promising results, the applicability of these findings to humans remains uncertain due to differing metabolic responses that may influence glucose regulation and insulin sensitivity. Addressing these gaps through extended clinical trials is essential for a comprehensive evaluation of MSSC’s therapeutic potential and safety in diabetic populations. Additionally, data from nutritional surveys assessing the health benefits of these sweeteners are necessary to validate the study’s findings. Furthermore, a better understanding of the mechanisms underlying the interaction between sweeteners and chromium is crucial. Future research should evaluate the safety and efficacy of MSSC within clinical settings. Conducting clinical trials in diverse populations is essential to assess both the short- and long-term effects on glucose regulation and overall metabolic health in individuals with type 2 diabetes. Based on the findings of this study, MSSC has the potential to function as a promising complementary treatment for routine diabetes management, particularly in improving glycemic control and aiding in weight management.

5. Conclusions

We have demonstrated for the first time that chromium-supplemented stevia-based sweeteners positively impact diabetes-related parameters in animal subjects. Our data also indicate that the sweetener mixture could potentially prevent or alleviate diabetic secondary complications in the liver and kidney and advocate for the supplementation of sweeteners with minerals known for their association with glycemic control. Prolonged use may enhance serum insulin secretion and help prevent or alleviate diabetic complications such as neuropathy and cardiovascular health. Additionally, these sweeteners could serve as an effective adjunct for weight management. However, further clinical studies are needed to assess their long-term efficacy and safety in individuals with type 2 diabetes.

Author Contributions

Conceptualization, S.O.; methodology, S.O.; validation, S.O., E.I. and I.I.I.; formal analysis and investigation, S.O. and E.I.; data curation and visualization, S.O., E.I. and I.I.I.; writing—original draft preparation, E.I.; writing—review and editing, S.O. and I.I.I.; supervision, S.O. All authors have read and agreed to the published version of the manuscript.

Funding

This research received no external funding.

Institutional Review Board Statement

The animal study protocol was approved by the Institutional Review Board (or Ethics Committee) of Michael Okpara University of Agriculture (MOUAU/COLNAS/BCH/19/12/04).

Informed Consent Statement

Not applicable.

Data Availability Statement

The data supporting this study’s findings are available from the corresponding author upon a reasonable request.

Conflicts of Interest

We wish to confirm that there are no known conflicts of interest associated with this publication and there has been no significant financial support for this work that could have influenced its outcome.

References

  1. El-Newary, S.A.; Afifi, S.M.; Aly, M.S.; Ahmed, R.; El Gendy, A.E.G.; Abd-ElGawad, A.M.; Farag, M.A.; Elgamal, A.M.; Elshamy, A.I. Chemical profile of Launaea nudicaulis ethanolic extract and its antidiabetic effect in streptozotocin-induced rats. Molecules 2021, 26, 1000. [Google Scholar] [CrossRef] [PubMed]
  2. World Health Organisation. Obesity and Overweight; World Health Organisation: Geneva, Switzerland, 2021. [Google Scholar]
  3. Pavanello, S.; Moretto, A.; La Vecchia, C.; Alicandro, G. Non-sugar sweeteners and cancer: Toxicological and epidemiological evidence. Regul. Toxicol. Pharmacol. 2023, 139, 105369. [Google Scholar] [CrossRef] [PubMed]
  4. Wang, C.; Liu, Y.; Zhao, X.; Liu, B. Current Advances and Future Aspects of Sweetener Synergy: Properties, Evaluation Methods and Molecular Mechanisms. Appl. Sci. 2022, 12, 5096. [Google Scholar] [CrossRef]
  5. Bordier, V.; Teysseire, F.; Schlotterbeck, G.; Senner, F.; Beglinger, C.; Meyer-Gerspach, A.C.; Wölnerhanssen, B.K. Effect of a chronic intake of the natural sweeteners Xylitol and Erythritol on glucose absorption in humans with obesity. Nutrients 2021, 13, 3950. [Google Scholar] [CrossRef]
  6. Baird, I.M.; Shephard, N.W.; Merritt, R.J.; Hildick-Smith, G. Repeated dose study of sucralose tolerance in human subjects. Food Chem. Toxicol. 2000, 38, S123–S129. [Google Scholar] [CrossRef]
  7. Barakat, H.; Al-Roug, K.; Algonaiman, R.; Althwab, S.A.; Alfheeaid, H.A.; Alhomaid, R.M.; Almujaydil, M.S.; Bushnaq, T.; Ebeid, T.A. Biological assessment of stevioside and sucralose as sucrose substitutes for diabetics on STZ-induced diabetes in rats. Molecules 2023, 28, 940. [Google Scholar] [CrossRef]
  8. Mbambo, N.P.; Dlamini, S.N.; Chukwuma, C.I.; Islam, M. Comparative effects of commonly used commercially available non-nutritive sweeteners on diabetes-related parameters in non-diabetic rats. J. Food Biochem. 2020, 44, e13453. [Google Scholar] [CrossRef]
  9. Lohner, S.; Kuellenberg de Gaudry, D.; Toews, I.; Ferenci, T.; Meerpohl, J.J. Non-nutritive sweeteners for diabetes mellitus. Cochrane Database Syst. Rev. 2020, 5, CD012885. [Google Scholar] [CrossRef]
  10. Anderson, R.A. Recent Advances in the clinical and bio-chemical manifestation of chromium deficiency in Human and Animal Nutrition. J. Trace Elem. Med. Biol. 1998, 11, 241–250. [Google Scholar] [CrossRef]
  11. Qi, S.S.; Zheng, H.X.; Jiang, H.; Yuan, L.P.; Dong, L.C. Protective effects of chromium picolinate against diabetic-induced renal dysfunction and renal fibrosis in streptozotocin-induced diabetic rats. Biomolecules 2020, 10, 398. [Google Scholar] [CrossRef]
  12. Harrington, E.O.; Vang, A.; Braza, J.; Shil, A.; Chichger, H. Activation of the sweet taste receptor, T1R3, by the artificial sweetener sucralose regulates the pulmonary endothelium. Am. J. Physiol. Lung Cell. Mol. Physiol. 2018, 314, L165–L176. [Google Scholar] [CrossRef] [PubMed]
  13. Schmitz, E.A.; Takahashi, H.; Karakas, E. Structural basis for activation and gating of IP3 receptors. Nat. Commun. 2022, 13, 1408. [Google Scholar] [CrossRef] [PubMed]
  14. Margolskee, R.F.; Dyer, J.; Kokrashvili, Z.; Salmon, K.; Ilegems, E.; Daly, K.; Maillet, E.L.; Ninomiya, Y.; Mosinger, B.; Shirazi-Beechey, S.P. T1R3 and gustducin in gut sense sugars to regulate expression of Na+-glucose cotransporter 1. Proc. Natl. Acad. Sci. USA 2007, 104, 15075–15080. [Google Scholar] [CrossRef] [PubMed]
  15. Proença, C.; Ribeiro, D.; Freitas, M.; Fernandes, E. Flavonoids as potential agents in the management of type 2 diabetes through the modulation of α-amylase and α-glucosidase activity: A review. Crit. Rev. Food Sci. Nutr. 2022, 62, 3137–3207. [Google Scholar] [CrossRef]
  16. Wilson, R.D.; Islam, M.S. Fructose-fed streptozotocin-injected rat: An alternative model for type 2 diabetes. Pharmacol. Rep. 2012, 64, 129–139. [Google Scholar] [CrossRef]
  17. Kalaivani, K.; Sankaranarayanan, C. Modulatory effect of isopulegol on hepatic key enzymes of glucose metabolism in high-fat diet/streptozotocin-induced diabetic rats. Arch. Physiol. Biochem. 2021, 127, 318–326. [Google Scholar] [CrossRef] [PubMed]
  18. Jayaprasad, B.; Sharavanan, P.S.; Sivaraj, R. Antidiabetic effect of Chloroxylon swietenia bark extracts on streptozotocin induced diabetic rats. Beni-Suef Univ. J. Basic Appl. Sci. 2016, 5, 61–69. [Google Scholar] [CrossRef]
  19. Kakkar, P.; Das, B.; Viswanathan, P.N. A modified spectrophotometric assay of superoxide dismutase. Indian J. Biochem. Biophys. 1984, 21, 130–132. [Google Scholar]
  20. Sinha, A.K. Colorimetric assay of catalase. Anal. Biochem. 1972, 47, 389–394. [Google Scholar] [CrossRef]
  21. Ellman, G.L. Tissue sulfhydryl groups. Arch. Biochem. Biophys. J. 1959, 82, 70–77. [Google Scholar] [CrossRef]
  22. Nichans, W.G.; Samuelson, B. Formation of malondialdehyde from phospholipid arachidonate during microsomal lipid peroxidation. Eur. J. Biochem. 1968, 6, 126–130. [Google Scholar] [CrossRef]
  23. Chukwuma, C.I.; Islam, M.S. Sorbitol increases muscle glucose uptake ex vivo and inhibits intestinal glucose absorption ex vivo and in normal and type 2 diabetic rats. Appl. Physiol. Nutr. Metab. 2017, 42, 377–383. [Google Scholar] [CrossRef] [PubMed]
  24. Meenatchi, M.; Vellapandian, C. Exploring the long-term effect of artificial sweeteners on metabolic health. Cureus 2024, 16, e70043. [Google Scholar] [CrossRef]
  25. Vajdi, M.; Khajeh, M.; Safaei, E.; Moeinolsadat, S.; Mousavi, S.; Seyedhosseini-Ghaheh, H.; Abbasalizad-Farhangi, M.; Askari, G. Effects of chromium supplementation on body composition in patients with type 2 diabetes: A dose-response systematic review and meta-analysis of randomized controlled trials. J. Trace Elem. Med. Biol. 2024, 81, 127338. [Google Scholar] [CrossRef] [PubMed]
  26. Stamataki, N.S.; Scott, C.; Elliott, R.; McKie, S.; Bosscher, D.; McLaughlin, J.T. Stevia Beverage Consumption prior to Lunch Reduces Appetite and Total Energy Intake without Affecting Glycemia or Attentional Bias to Food Cues: A Double-Blind Randomized Controlled Trial in Healthy Adults. J. Nutr. 2020, 150, 1126–1134. [Google Scholar] [CrossRef]
  27. Orellana-Paucar, A.M. Steviol glycosides from stevia rebaudiana: An updated overview of their sweetening activity, pharmacological properties, and safety aspects. Molecules 2023, 28, 1258. [Google Scholar] [CrossRef]
  28. Assaei, A.; Mokarram, P.; Dastghaib, S.; Darbandi, S.; Darbandi, M.; Zal, F.; Akmali, M.; Ranjbar Omrani, G.H. Hypoglycemic Effect of Aquatic Extract of Stevia in Pancreas of Diabetic Rats: PPARγ-dependent Regulation or Antioxidant Potential. Avicenna J. Med. Biotechnol. 2016, 8, 65–74. [Google Scholar] [PubMed]
  29. Cefalu, W.T. Concept, strategies, and feasibility of noninvasive insulin delivery. Diabetes Care 2004, 27, 239–246. [Google Scholar] [CrossRef]
  30. Hua, Y.; Clark, S.; Ren, J.; Sreejayan, N. Molecular mechanisms of chromium in alleviating insulin resistance. J. Nutr. Biochem. 2012, 23, 313–319. [Google Scholar] [CrossRef]
  31. Ekakitie, L.; Ajiboye, B.O.; Oyinloye, B.E.; Owero-Ozeze, O.S.; Onikanni, S.A.; Ojo, O.A. Attenuation of diabetic nephropathy in alloxan-induced diabetic rats by Solanum macrocarpon Linn aqueous leaves extract. Comp. Clin. Pathol. 2021, 30, 173–179. [Google Scholar] [CrossRef]
  32. Boubekri, N.; Amrani, A.; Zama, D.; Dendougi, H.; Benayache, F.; Benayache, S. In vitro antioxidant and in vivo antidiabetic potential of n-butanol extract of Chrysanthemum fuscatum in streptozotocin induced diabetic rats. Int. J. Pharm. Sci. Rev. Res. 2016, 41, 214–221. [Google Scholar]
  33. Kumar, R.; Kumar, N.; Rajput, S.K.; Mallan, S.; Kumar, A.; Rawat, B.S.; Rangra, N.K.; Singh, S. Antidiabetic Evaluation of Kigelia pinnata Root Bark Extract in Streptozotocin-Induced Type-2 Diabetes Model of Rats. Assay. Drug Dev. Technol. 2024, 22, 169–180. [Google Scholar] [CrossRef] [PubMed]
  34. Talevi, A. Beneficial Effects of Stevia rebaudiana Bertoni and Steviol-Related Compounds on Health, in Sweeteners: Pharmacology, Biotechnology, and Applications; Springer International Publishing: Cham, Switzerland, 2017; pp. 1–22. [Google Scholar]
  35. Sharma, S.; Walia, S.; Singh, B.; Kumar, R. Comprehensive review on agro technologies of low-calorie natural sweetener stevia (Stevia rebaudiana Bertoni): A boon to diabetic patients. J. Sci. Food Agric. 2016, 96, 1867–1879. [Google Scholar] [CrossRef]
  36. Zheng, Y.; Sun, F.; Ye, S.; Zhu, J.; Ma, Y.; Shan, M.; Li, S.; Chen, Y.; Li, J. Correlation between fruit consumption and 10-year all-cause mortality in patients with dyslipidemia. Front. Nutr. 2024, 11, 1471737. [Google Scholar] [CrossRef]
  37. Romo-Romo, A.; Aguilar-Salinas, C.A.; Brito-Córdova, G.X.; Gómez Díaz, R.A.; Vilchis Valentín, D.; Almeda-Valdes, P. Effects of the non-nutritive sweeteners on glucose metabolism and appetite regulating hormones: Systematic review of observational prospective studies and clinical trials. PLoS ONE 2016, 11, e0161264. [Google Scholar] [CrossRef] [PubMed]
  38. Tey, S.L.; Salleh, N.; Henry, J.; Forde, C.G. Effects of aspartame-, monk fruit-, stevia- and sucrose-sweetened beverages on postprandial glucose, insulin and energy intake. Int. J. Obes. 2017, 41, 450–457. [Google Scholar] [CrossRef]
  39. Mchunu, N.; Chukwuma, C.I.; Ibrahim, M.A.; Oyebode, O.A.; Dlamini, S.N.; Islam, M.S. Commercially available non-nutritive sweeteners modulate the antioxidant status of type 2 diabetic rats. J. Food Biochem. 2019, 43, e12775. [Google Scholar] [CrossRef]
  40. Kooshki, F.; Tutunchi, H.; Vajdi, M.; Karimi, A.; Niazkar, H.R.; Shoorei, H.; Gargari, B.P. Comprehensive insight into the effect of chromium supplementation on oxidative stress indices in diabetes mellitus: A systematic review. Clin. Exp. Pharmacol. Physiol. 2021, 48, 291–309. [Google Scholar] [CrossRef]
  41. Mohamed; Nazratun, N. A.H.; Zariyantey, A.H.; Budin, S.B. Mechanisms of Diabetes-Induced Liver Damage: The role of oxidative stress and inflammation. Sultan Qaboos Univ. Med. J. 2016, 16, e132–e141. [Google Scholar] [CrossRef]
  42. Pecoits-Filho, R.; Abensur, H.; Betônico, C.C.; Machado, A.D.; Parente, E.B.; Queiroz, M.; Salles, J.E.; Titan, S.; Vencio, S. Interactions between kidney disease and diabetes: Dangerous liaisons. Diabetol. Metab. Syndr. 2016, 8, 50. [Google Scholar] [CrossRef] [PubMed]
  43. Erukainure, O.L.; Hafizur, R.M.; Kabir, N.; Choudhary, M.I.; Atolani, O.; Banerjee, P.; Preissner, R.; Chukwuma, C.I.; Muhammad, A.; Amonsou, E.O.; et al. Suppressive Effects of Clerodendrum volubile P Beauv. [Labiatae] Methanolic Extract and Its Fractions on Type 2 Diabetes and Its Complications. Front. Pharmacol. 2018, 9, 8. [Google Scholar] [CrossRef] [PubMed]
  44. Ballestri, S.; Zona, S.; Targher, G.; Romagnoli, D.; Baldelli, E.; Nascimbeni, F.; Roverato, A.; Guaraldi, G.; Lonardo, A. Nonalcoholic fatty liver disease is associated with an almost twofold increased risk of incident type 2 diabetes and metabolic syndrome. Evidence from a systematic review and meta-analysis. J. Gastroenterol. Hepatol. 2016, 31, 936–944. [Google Scholar] [CrossRef] [PubMed]
  45. Oyedemi, S.O.; Nwaogu, G.; Chukwuma, C.I.; Adeyemi, O.T.; Matsabisa, M.G.; Swain, S.S.; Aiyegoro, O.A. Quercetin modulates hyperglycemia by improving the pancreatic antioxidant status and enzymes activities linked with glucose metabolism in type 2 diabetes model of rats: In silico studies of molecular interaction of quercetin with hexokinase and catalase. J. Food Biochem. 2020, 44, e13127. [Google Scholar] [CrossRef] [PubMed]
  46. Rizwan, F.; Rashid, H.U.; Yesmine, S.; Monjur, F.; Chatterjee, T.K. Preliminary analysis of the effect of Stevia (Stevia rebaudiana) in patients with chronic kidney disease (stage I to stage III). Contemp. Clin. Trials Commun. 2018, 12, 17–25. [Google Scholar] [CrossRef] [PubMed]
  47. AbdElwahab, A.H.; Yousuf, A.F.; Ramadan. B.K.; Elimam, H. Comparative Effects of Stevia rebaudiana and Aspartame on hepato-renal function of diabetic rats: Biochemical and Histological Approaches. J. App. Pharm. Sci. 2017, 7, 34–42. [Google Scholar]
  48. Lenzen, S. The mechanisms of alloxan-and streptozotocin-induced diabetes. Diabetologia 2008, 51, 216–226. [Google Scholar] [CrossRef]
Figure 1. Effect of MSSC on body weight of diabetic and non-diabetic rats. Data were analyzed using one-way ANOVA, followed by Tukey’s multiple comparisons tests. Values are expressed as mean ± SD; n = 6 rats per group; *** p < 0.05 versus untreated diabetic control.
Nutraceuticals 04 00036 g001
Figure 2. Effects of MSSC on insulin level of normal and experimental rats. Data are expressed as mean ± SD of three separate experiments, each of three replicates. Data were analyzed using one-way ANOVA, followed by Tukey’s multiple comparisons tests; *** p < 0.05 versus untreated diabetic control; ns—not significant.
Nutraceuticals 04 00036 g002
Figure 3. Effects of MSSC on alpha-glucosidase (A) and hexokinase activities (B) in isolated livers of diabetic and non-diabetic rats after six weeks of experimental period (A). NC—normal control; DBC—diabetic control; NSS—normal rats treated with sweetener; DSS—diabetic rats treated with sweetener; DMF—diabetic rats treated with metformin; data are expressed as mean ± SD of six rats per group. Data were analyzed using one-way ANOVA, followed by Dunnette’s multiple comparisons tests; *** p < 0.0001; ** p < 0.001 versus DBC group; ns—not significant.
Nutraceuticals 04 00036 g003
Figure 4. Photomicrographs of a section of the endocrine pancreatic tissue of untreated diabetic and non-diabetic rats. All sections were stained with H and E stain and viewed with a light microscope (400× magnification). The NC and NSS groups show normal numerous secretory acini (arrows) and islet cells (IL), also seen are interlobular connective tissue (arrowhead) and the pancreatic duct with eosinophilic secretions (black asterisk)without pathological changes. The DBC-treated group shows numerous secretory acini (arrows) and islet cells (IL). Also seen are interlobular connective tissue (arrowhead) and the pancreatic duct with eosinophilic secretions (black asterisk). One of the islets showed complete amyloid deposition (#) (Islet amyloidosis).DSS shows numerous acini (arrow) and islet cells (IL) with very basophilic in the basal part of the nuclei (white asterisk). Seen within the islet are cysts (Cy). Some of the cysts showed mild congestion. The acina. The DMF group shows normal secretory acini (arrows) and islet cells (IL). Also seen is interlobular connective tissue (arrowhead). The acini were basophilic from the apical to the basal part.
Nutraceuticals 04 00036 g004
Figure 5. Photomicrographs of liver sections from untreated diabetic and non-diabetic rats. All sections were stained with H and E stain and viewed with a light microscope (400× magnification). The NC and NSS groups showed hepatic lobules of normal hepatocytes arranged in interconnecting radiating cords around the central veins (CV). The radiating cords terminate at the periphery of the hepatic lobules, where they contact the structures of the hepatic artery, hepatic vein (HV), and bile duct (B) embedded in loose fibrous connective tissue. The DBC group showed a portal area of liver tissue, with arrays of hepatocytes, congested dilated portal vein and periportal fibrosis (f) with evidence of fibrocytes (black arrow). Also seen withing vessels are mononuclear inflammatory cells. (White asterisks). Sinusoid (arrowhead) is seen. The DSS group showed normal liver histology architecture, with arrays of feathery hepatocytes, hugely congested and dilated central vein (CV). The sinusoid was not conspicuously seen showed hepatic lobules of almost normal hepatocytes arranged in interconnecting radiating cords around the central veins (CV). The DMF group showed active and healthy hepatocytes with active vesicular nuclei like the NC group and the absence of any degenerative changes. All sections were stained with H and E stain and viewed with a light microscope (400× magnification).
Nutraceuticals 04 00036 g005
Table 1. The effect of the daily oral administration of MSSC on the fasting serum blood glucose level (mg/dL) in diabetic and non-diabetic rats after six weeks of the experimental period.
Groups0 D7 Days14 Days21 Days28 Days35 Days42 Days%NFBGR
NC98.8 ± 6.0 a98.4 ± 3.05 a98.2 ± 3.8 a99.8 ± 1.5 a101.6 ± 3.1 a100.2 ± 2.04 a98.4 ± 5.4 a,b-
DBC277.8 ± 22.7 c296.0 ± 18.6 d325.3 ± 23.3 d311.8 ± 25.2 c328.5 ± 36.5 c351.0 ± 37.6 c364.3 ± 41.7 cNR
NSS103.3 ± 9.1 a102.2 ± 12.1 a105.3 ± 4.0 a111.3 ± 5.7 a99.5 ± 4.5 a90.8 ± 1.71 a83.5 ± 3.7 a3.63 ± 0.8 a
DSS362.8 ± 16.1 d389.7 ± 14.6 e373.3 ± 20.3 e363.0 ± 14.8 d358.7 ± 11.4 d351.0 ± 6.5 c335.3 ± 7.0 c7.35 ± 1.2 b
DMF253.2 ± 31.5 b,c241.6 ± 21.0 c214.6 ± 32.5 c193.4 ± 18.8 b172.6 ± 22.6 b152.8 ± 18.1 b138.4 ± 22.1 b45.34 ± 6.0 c
NC—normal control; DBC—diabetic control; NSS—normal rats treated with sweetener; DSS—diabetic rats treated with sweetener; DMF—diabetic rats treated with metformin; NFBGR—non-fasting blood glucose reduction; NR—no blood glucose reduction. a–e Values with different letters for a given parameter are significantly different (Tukey’s HSD multiple range post hoc test, p < 0.05). The diabetic and non-diabetic rats were treated with either sweetener, vehicle, or metformin by oral gavage. DSS-treated T2DM rats showed significant differences compared to the non-diabetic and diabetic rats. Data are mean ± SD; n = 6 rats per group.
Table 2. The effect of the oral administration of MSSC on the lipid profile (U/L) of different animal groups after six weeks of the experimental period.
GroupingTCTAGHDL-CLDL-C
NC2.89 ± 0.19 b2.08 ± 0.12 b1.50 ± 0.08 a0.97 ± 0.19 b
DBC4.27 ± 0.31 c3.23 ± 0.19 c1.40 ± 0.01 a1.81 ± 0.31 c
NSS2.92 ± 0.16 b2.19 ± 0.65 b1.48 ± 0.07 a0.47 ± 0.04 a
DSS2.71 ± 0.15 b2.33 ± 0.1 b1.40 ± 0.02 a0.84 ± 0.16 b
DMF1.85 ± 0.13 a1.99 ± 0.04 a1.42 ± 0.0 a0.63 ± 0.00 a
Data are presented as the mean ± SD, n = 6 rats per group. a–c Values with different letters for a given parameter are significantly different (Tukey’s HSD multiple range post hoc test, p < 0.05). NC—normal control; DBC—diabetic control; NSS—normal rats treated with sweetener; DSS—diabetic rats treated with sweetener; DMF—diabetic rats treated with metformin; TC—total cholesterol; TAG—triacylglycerol; HDL-C—high-density lipoprotein cholesterol and LDL-C—low-density lipoprotein cholesterol.
Table 3. The effect of the daily oral administration of MSSC on the antioxidant enzymes activities in isolated pancreases from different groups of animals after six weeks of the experimental period.
GroupingGPx (U/L)SOD (U/mL)CAT (U/mL)MDA (µM)GSH (mM)
NC18.64 ± 2.34 d1.74 ± 0.43 b34.44 ± 2.96 c2.58 ± 0.73 a3.03 ± 0.37 c
DBC8.42 ± 1.28 a0.82 ± 0.07 a17.62 ± 2.66 a7.47 ± 1.17 a1.31 ± 0.05 a
NSS18.26 ± 1.95 d1.92 ± 0.08 b,c30.68 ± 1.57 c2.27 ± 0.72 a2.86 ± 0.48 c
DSS11.38 ± 2.40 b1.18 ± 0.07 b25.49 ± 1.61 b4.19 ± 0.78 b2.03 ± 0.15 b
DMF15.64 ± 1.93 c1.46 ± 0.24 b28.56 ± 2.63 b3.68 ± 1.07 b2.87 ± 0.08 c
Data are presented as the mean ± SD, n = 6 six rats per group. a–d Values with different letters within a row for a given parameter are significantly different (Tukey’s HSD multiple range post hoc test, p < 0.05). NC—normal control; DBC—diabetic control; NSS—normal rats treated with sweetener; DBC—diabetic untreated rats; DSS—diabetic rats treated with sweetener; DMF—diabetic rats treated with metformin; GPx—glutathione peroxidase; SOD—superoxide dismutase; CAT—catalase; MDA—malondialdehyde; GSH—reduced glutathione.
Table 4. The effect of the daily oral administration of MSSC on the functional parameters (U/L) in the isolated livers and kidneys from different groups of animals after six weeks of the experimental period.
Parameters.NCDBCNSSDSSDMF
Albumin (g/dL)5.12 ± 0.6 b3.89 ± 0.4 a5.47 ± 0.3 b3.8 ± 0.2 a5.37 ± 0.6 b
Protein (g/dL)6.05 ± 0.2 b4.75 ± 0.3 a6.45 ± 0.2 b5.1 ± 0.2 a6.18 ± 0.3 b
Bilirubin (µmol/L)26.25 ± 3.2 c11.57 ± 1.7 a25.96 ± 1.4 c15.6 ± 1.3 b26.05 ± 1.7 c
Urea (mmol/L)1.19 ± 0.1 a2.63 ± 0.3 b1.42 ± 0.1 a2.41 ± 0.2 b1.29 ± 0.2 a
Creatinine (µmol/L)2.86 ± 0.2 a4.22 ± 0.3 b2.92 ± 0.2 a3.03 ± 0.2 a2.78 ± 0.2 a
ALT (U/L)120.23 ± 2.8 a132.82 ± 4.5 b117.66 ± 2.8 a130.76 ± 5.4 b130.81 ± 4.7 b
ALP (U/L)284.53 ± 11.9 a1493.08 ± 226.6 e438.59 ±31.8 b912.69 ±63.3 d585.5 ± 55.1 c
AST (U/L)113.42 ± 9.4 a124.96 ± 6.4 c127.71 ± 7.5 c124.84 ± 6.4 c119.0 ± 6.5 b
Data are presented as the mean ± SD, n = 6 six rats per group. a–e Values with different letters within a row for a given parameter are significantly different (Tukey’s HSD multiple range post hoc test, p < 0.05). NC—normal control; DBC—diabetic control; NSS—normal rats treated with sweetener; DBC—diabetic untreated rats; DSS—diabetic rats treated with sweetener; DMF—diabetic rats treated with metformin; ALT—alanine transaminases; ALP—alkaline phosphatase; AST—aspartate transaminases.
Disclaimer/Publisher’s Note: The statements, opinions and data contained in all publications are solely those of the individual author(s) and contributor(s) and not of MDPI and/or the editor(s). MDPI and/or the editor(s) disclaim responsibility for any injury to people or property resulting from any ideas, methods, instructions or products referred to in the content.

