Article

Nutritional Properties, Antioxidant Activity, and Heavy Metal Accumulation in Selected Marine Macro-Algae Species of Sri Lanka

by
Viraji Warnasooriya
1,
Sadhisha Gunawardena
2,
Pabodha Weththasinghe
1,
Barana Jayawardana
1,
Mallique Qader
3 and
Ruvini Liyanage
2,*
1
Department of Animal Science, Faculty of Agriculture, University of Peradeniya, Peradeniya 20400, Sri Lanka
2
Nutritional Biochemistry Division, National Institute of Fundamental Studies, Hanthana Road, Kandy 20000, Sri Lanka
3
Institute for Tuberculosis Research, Department of Pharmaceutical Sciences, College of Pharmacy, University of Illinois Chicago, Chicago, IL 60612, USA
*
Author to whom correspondence should be addressed.
Nutraceuticals 2024, 4(1), 50-64; https://doi.org/10.3390/nutraceuticals4010004
Submission received: 20 September 2023 / Revised: 16 December 2023 / Accepted: 4 January 2024 / Published: 18 January 2024

Abstract

:
In recent years, the emergence of drug resistance and sensitivity in leading diseases has heightened global interest in natural nutraceuticals as primary health supplements. However, comprehensive scientific scrutiny is essential before marketing these as supplements. In this study, we assessed the nutritional composition, antioxidant activities, and trace metal accumulation in eleven selected Sri Lankan coastal seaweed species. Gracilaria corticata had the highest (p < 0.05) ash and crude fiber content among the species. Protein content ranged from 4.87% to 23.67% (DW), with Ulva rigida displaying the highest (p < 0.05). Crude fat content ranged from 0.09% to 4.13% (DW), with Cladophora herpestica having the highest (p < 0.05) crude fat content. Sargassam cinereum, Turbinaria ornata and Sargassum crassifolium had the highest (p < 0.05) TPC content (51.32 ± 0.61–28.90 ± 2.68 mg/GAE g) and the highest (p < 0.05) radical scavenging antioxidant activity compared to other seaweeds. The study findings indicate that most of the studied metals in seaweeds exceeded the WHO-recommended levels. Aluminum was the highest (p < 0.05) accumulated metal in seaweeds compared to other metals. Toxic heavy metals, such as arsenic, cadmium and chromium, levels in all of the studied seaweeds surpassed the WHO limits. While seaweeds displayed acceptable nutritional and antioxidant properties, heavy metal presence poses a potential health risk to consumers. Products using seaweeds with accumulated heavy metals may have lower nutritional quality. Thus, this study underscores the need for comprehensive scientific investigation before developing high-quality natural food products or supplements from seaweeds.

1. Introduction

The seaweeds, also known as macroalgae, are consumed in many Asian countries, and are gaining increased attention in Western countries due to their functional properties [1]. These multicellular organisms thrive in intertidal and subtidal zones, utilizing light for photosynthesis and converting inorganic resources and minerals into biomass through the harnessing of light energy [2,3]. They are categorized into three main taxonomic groups based on their photosynthetic pigments: green algae, brown algae, and red algae, each characterized by distinct pigments such as chlorophylls, fucoxanthins, and phycobilins [3,4].
Microalgae, despite being low in calories, are rich in essential nutrients, including vitamins, minerals, polyunsaturated fatty acids, bioactive metabolites, proteins, polysaccharides, and dietary fibers [2,5]. However, variations in nutrient composition exist among species and environmental conditions [5]. Seaweeds, with their lower fat content but adequate levels of other nutrients and bioactive compounds compared to terrestrial plants, offer a convenient source of nutrition [2,5]. Although seaweeds generally contain lower total lipid content, their consisting lipids are mainly of polyunsaturated fatty acids including docosahexaenoic acid and eicosapentaenoic acid (ω-3 fatty acids) [6]. The protein content in seaweeds varies from 5% to 47% of dry mass, with red seaweeds having the highest protein content and green seaweeds the lowest [6]. A significant portion of algal proteins comprises amino acids, particularly aspartic and glutamic acids, with some species like Palmaria palmata and Ulva spp. containing essential amino acids such as histidine, leucine, isoleucine, and valine [7]. Seaweeds are also rich in dietary fiber, which contributes to a reduced risk of certain chronic diseases [8]. The structural composition of algal fibers differs from terrestrial plant fibers and consists primarily of non-starchy fiber, which helps regulate blood glucose levels [6,9]. For instance, some seaweeds like Laminaria digitata have a higher total fiber percentage (6.2%) compared to brown rice (3.8%), resulting in a minimal glycemic load [7].
Beyond their nutritional value, seaweeds are a valuable source of bioactive compounds with various beneficial effects, including antioxidant, antibacterial, antifungal, cytotoxic, anti-inflammatory, and antidiabetic properties [10,11,12,13,14]. These bioactive compounds, such as polyphenols, flavonoids, phlorotannins, sulfated polysaccharides, and carotenoids, contribute to the antioxidant properties of seaweeds [5].
Phenolic acids are structurally characterized by the presence of an aromatic ring and one or more hydroxyl groups. The diversity of phenolic acids range from simpler molecules like hydroxycinnamic acids to more complex polymeric forms with molecular sizes ranging from 126–650 kDa [15]. Phlorotannins are secondary metabolite only found in marine algae. They are a large group of natural polyphenolic compounds consisting polymeric structural units of phloroglucinol (1,3,5-trihydroxybenzene) and can be categorize into six different classes namely, phloroethols, fuhalols, fucophloroethols, fucols eckols, and carmalols. In addition to wide range of bioactivities such as antimicrobial, anticancerous, anti-inflammatory, anti-diabetic and UV radiation protection [16], phlorotannins known to have powerful antioxidant activity due to their ability to act as chelating agents with reactive oxygen species [6,17]. The relative high concentration of phenolic compounds in marine algae contributes for their antioxidant properties [18].
Carotenoids are linear lipid-soluble polymeric pigments which protect photoxidation of algae by inactivating reactive oxygen species formed by exposure to light and air. For instance, the unusual chemical structure of tetraterpinoid carotenoid fucoxanthin can donate an electron to quench reactive oxygen species [6,19]. Likewise the antioxidant activity of the carotenoids may help prevent human diseases [17].
Phlorotannins and fucoxanthin, in particular, are known to mitigate cellular damage caused by free radicals. Clinical studies have also established a correlation between the antioxidant capacity of microalgae and their DPPH assay capacities [6].
Concerning about algal polysaccharides, they are different from terrestrial plant polysaccharides. Especially, sulfated polysaccharides like fucoidans, fucan sulfate, ulvan and carrageenan are investigated for their biological activity and found to possess antioxidant activity. Compared to synthetic antioxidants like BHT and BHA, recent studies have shown that sulfated polysaccharides are more potent in nitric oxide scavenging [1].
In contrast to other organisms, marine algae produce a wide array of bioactive secondary metabolites in response to the extreme environmental conditions occurring in their habitat. The prevalence of such bioactive metabolites in marine algae facilitate the algal survival in extremely competitive environments [18].
Furthermore, seaweeds are a rich source of essential minerals and trace elements essential for human nutrition, with mineral content ranging from 8% to 40%. Unlike edible land plants, seaweeds contain a diverse array of minerals, although the variation in mineral content can be attributed to factors such as the seaweed’s phylum, geographical origin, and seasonal, environmental, and physiological variations [20].
However, it is crucial to note that, while seaweeds are generally rich in trace elements, certain metals such as aluminum, cadmium, and lead can be toxic to humans even at lower concentrations [21]. Therefore, caution should be exercised when considering the potential presence of these toxic metals in seaweed samples. The significance of this study extends beyond the exploration of nutritional and antioxidant properties and differs from previously published data by delving into the assessment of seaweeds’ safety for human consumption. The thorough elemental analysis, encompassing trace elements and heavy metals, provides crucial data for making well-informed decisions about the suitability of incorporating these seaweeds into the diet.

2. Materials and Methods

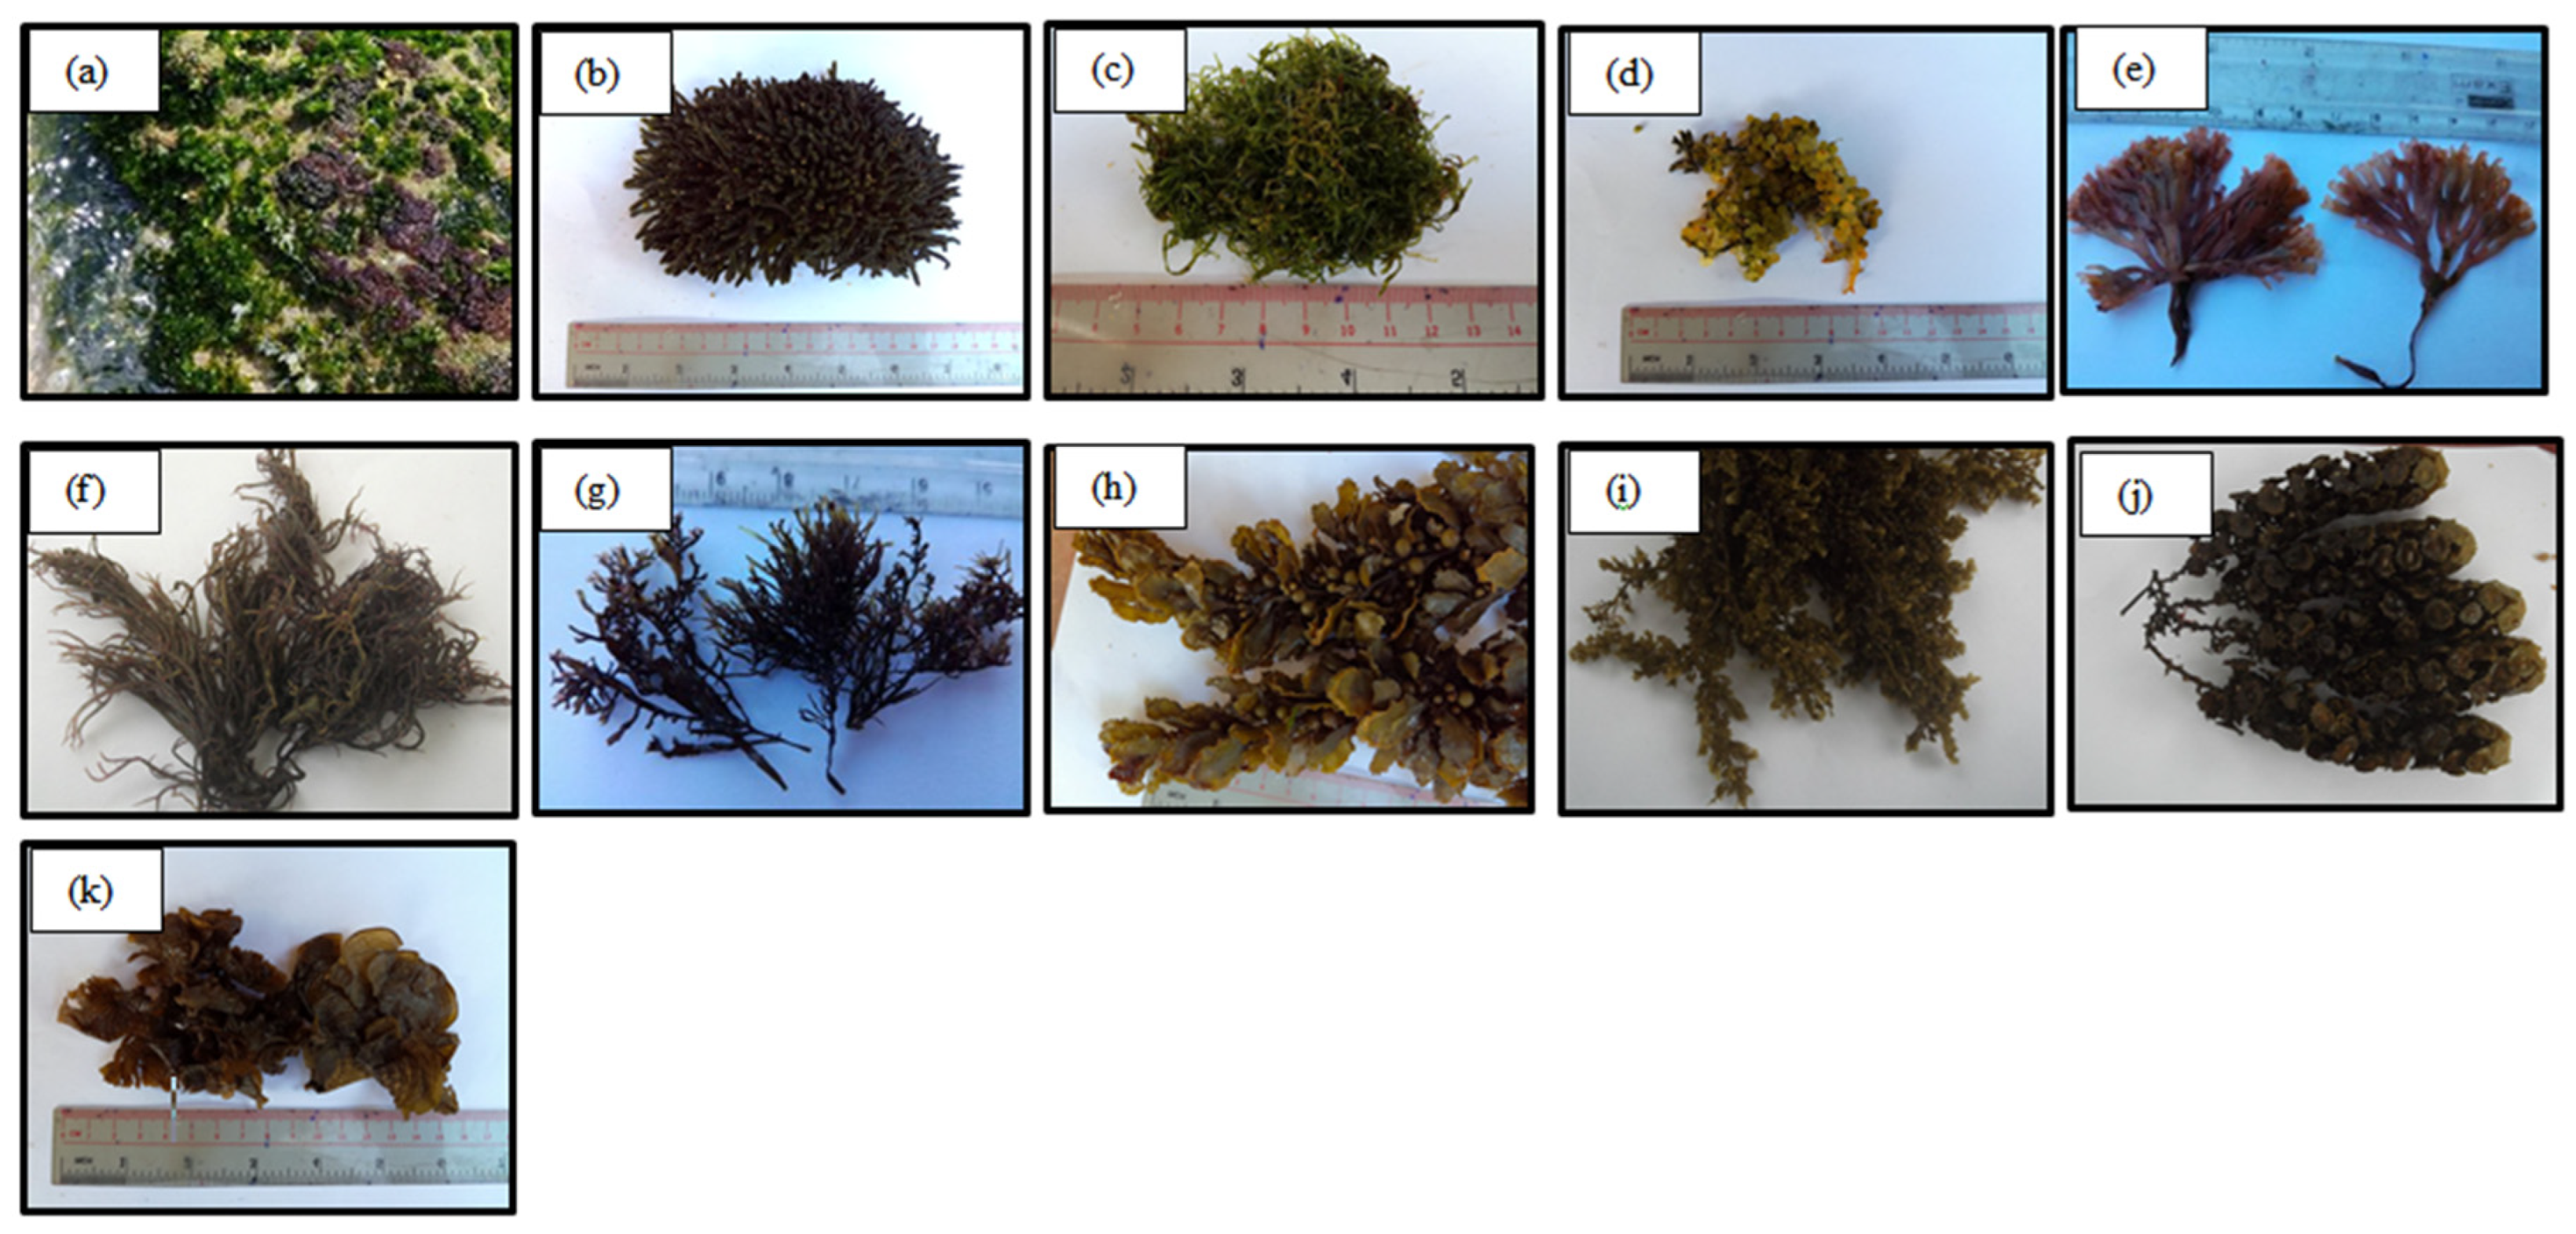
2.1. Seaweed Sample Collection

Eleven seaweed species were collected from coastal areas in Sri Lanka at depths ranging from 0.2 to 1 m. The seaweed specimens were identified using the identification guide [22] and authenticated by Prof. K.M.G.G Jayasuriya, Professor in Botany, Department of Botany, Faculty of Science, University of Peradeniya. The specimens were deposited at the National Institute of Fundamental Studies for future references. Detailed information and voucher numbers of the seaweeds can be found in Table 1, and their photographs are available in Figure 1.
After collection, the samples were thoroughly rinsed with seawater at the collection site and then placed in polythene bags. Subsequently, the samples were transported to the laboratory and washed once more with distilled water to remove any epiphytes, adhered sand particles, and debris.
To facilitate drying, all samples were air-dried at room temperature for 5–7 days, followed by further drying at 60 °C in a hot air oven until a constant weight was achieved. Afterward, the dried samples were ground to a particle size of less than 2 mm and stored in airtight polythene bags at −20 °C for future analysis. Voucher specimens of the seaweeds were stored in a −80 °C freezer at the National Institute of Fundamental Studies in Kandy, Sri Lanka.

2.2. Proximate Analysis

Moisture, dry matter, ash, crude protein, crude fat, and crude fiber content in seaweed samples were analyzed in replicates according to the AOAC method [23].

2.2.1. Determination of Moisture Content

The moisture content of seaweeds was determined following the oven drying method described by AOAC [22]. Two grams of macroalgal samples were placed in crucibles and dried in the YAMATO IC600 drying oven (Yamato Scientific Co., Ltd., Tokyo, Japan) overnight at 105 °C until a constant weight was achieved.
M o i s t u r e   ( % ) = S a m p l e   d r y   w e i g h t   w i t h   c r u c i b l e C r u c i b l e S a m p l e   f r e s h   w e i g h t   w i t h   c r u c i b l e C r u c i b l e   w e i g h t × 100

2.2.2. Determination Dry Matter and Ash

First, 0.5–1.0 g of dried sample was weighed into previously dried and weighed porcelain crucibles. These crucibles were then placed in the YAMATO IC600 drying oven (Yamato Scientific Co., Ltd., Tokyo, Japan) overnight at 105 °C. After drying, the samples were removed and allowed to cool in desiccators.
Following the drying step, the sample weights were measured and then placed in the CARBOLITE Muffle Furnace at 600 °C for 4 h. Finally, the samples were cooled in desiccators and accurately weighed [21].
D r y   m a t t e r % = S a m p l e   d r y   w e i g h t   w i t h   c r u c i b l e C r u c i b l e   w e i g h t S a m p l e   w e i g h t   w i t h   c r u c i b l e C r u c i b l e   w e i g h t × 100
A s h % = S a m p l e   a s h   w e i g h t   w i t h   c r u c i b l e C r u c i b l e   w e i g h t S a m p l e   d r y   w e i g h t C r u c i b l e   w e i g h t × 100

2.2.3. Determination of Crude Protein

First, 0.25 g of dried samples were weighed and placed in Kjeldahl digestion flasks. To each flask, 10 g of a digestion mixture (powdered K2SO4 and small crystals of CuSO4 mixed in a 5:1 ratio) and 5 mL of 98% concentrated H2SO4 acid were added. The flasks were then put into a digestion apparatus (Perstop Analytical Company, Tokyo, Japan). They were allowed to boil for one hour until the solutions became clear. After digestion was completed, the flasks were cooled, and 5 mL of distilled water was added.
Next, 25 mL of 4% boric acid was added to each of the 250 mL conical flasks, and they were placed in a preheated distillation apparatus (Automatic Kjeldahl Apparatus Company, Tokyo, Japan). The Kjeldahl flasks were then connected to the distillation apparatus and 20 mL of 40% NaOH was slowly added until the solution turned blackish brown. Distillation continued until 75 mL was collected in the boric acid trap. After that, the flask containing boric acid and the distillate were titrated with 0.1N H2SO4 until the color changed to pink, and the burette reading was recorded [23].
P e r c e n t a g e   o f   c r u d e   p r o t e i n = B u r e t t e   r e a d i n g × N o r m a l i t y   o f   H 2 S O 4 × 8.75 × 10 W e i g h t   o f   s a m p l e × D r y   m a t t e r   p e r c e n t a g e

2.2.4. Determination of Crude Fat

Initially, cleaned fat extraction beakers were placed in a drying oven for one hour at 100 °C and then transferred to desiccators until they reached room temperature. The dried fat extraction beakers were weighed after cooling. One gram of the dried and ground sample was weighed onto a filter paper, wrapped, and placed into a pre-dried asbestos thimble. After adding 310 mL of acetone to the fat-extracting beaker, it was secured with the sample tube connected to the Soxhlet extraction unit. Fat extraction was carried out for a duration of approximately 4 h.
Finally, the beaker was transferred into a Heraeus 208 Vacuum Oven (Thomas Scientific, Swedesboro, NJ, USA) set at a temperature of 80 °C for 12 h (overnight), and the weight of the beaker with fat was measured [23]. The percentage of crude fat was calculated using the formula below [23].
P e r c e n t a g e   o f   c r u d e   f a t = W e i g h t   o f   b e a k e r   a n d   f a t W e i g h t   o f   e m p t y   b e a k e r W e i g h t   o f   d r y   s a m p l e D r y   m a t t e r   p e r c e n t a g e × 100

2.3. Determination of Crude Fiber

Crude fiber content was determined using 1 g of dried seaweed samples. The samples were subjected to hydrolysis with 50 mL of 0.3 N H2SO4 for 30 min, followed by treatment with 25 mL of 1.5 N NaOH for an additional 30 min. Subsequently, 0.5 g of EDTA was added, and the mixture was boiled for an additional 5 min. The resulting mixture was then filtered using suction filtration. The remaining crude residue was washed with distilled water and dried overnight at 100 °C in a drying oven (Yamato Scientific Co., Ltd., Tokyo, Japan). Afterward, the samples were allowed to cool in desiccators and were weighed precisely. These weighed samples were then converted to ash using the CARBOLITE Muffle Furnace (Carbolite Gero Ltd., Hope Valley, UK), following the procedure described by Kirk and Sawyer (1991), which involved heating them at 520 °C for 4 h. Finally, the ash samples were cooled in desiccators and accurately weighed [23].
C r u d e   F i b e r % = D r y   w e i g h t   o f   t h e   s a m p l e A s h   w e i g h t   o f   t h e   s a m p l e W e i g h t   o f   d r y   s a m p l e × D r y   m a t t e r   p e r c e n t a g e × 100

2.4. Preparation of Crude Ethanol Extract of the Samples

First, each ground sample was mixed with absolute ethanol. Subsequently, the mixture underwent sonication at a temperature of 30 °C for a duration of 30 min. After the sonication process, the resulting extract was filtered using cotton wool to remove macro particles. The filtered extract was then concentrated using a rotary evaporator. To ensure accuracy and reliability, this entire procedure was conducted in triplicate for each sample. The collected crude ethanol extracts obtained through this process were subsequently used for assays.

2.5. Antioxidant Assays

2.5.1. Total Phenolic Content

The total polyphenolic content was determined using the Folin–Ciocalteu method with slight modifications adapted from Singleton and Rossi [24]. Sample stocks at a concentration of 0.2 mg/mL were prepared using crude ethanol extracts of the samples, with gallic acid used as the standard.
In a 96-well plate, 40 µL of each sample was added, followed by 25 µL of distilled water and 105 µL of Folin reagent. After 3 min, 7.5% (w/v) Na2CO3 was added, and the mixture was incubated for 30 min at room temperature. The absorbance was measured at 760 nm against the blank sample using a microplate spectrophotometer (Thermo Fisher Scientific™ Multiskan™ GO, Vantaa, Finland). Three replicates were used for each sample. Blank samples were prepared using 40 µL from the sample stocks and 210 µL of distilled water.

2.5.2. DPPH Assay

The ability of the extracts to neutralize the DPPH radical (1,1-diphenyl-2-picrylhydrazyl) was investigated using the method described by Williams et al. in 1995 [25]. Different sample volumes (50 µL, 75 µL, 100 µL, 125 µL, and 150 µL) of 5 mg/mL sample stocks were added to 96-well plates, followed by 100 µL (100 µM) DPPH and various volumes of distilled water. The reaction mixture was incubated for 30 min at room temperature, and the absorbance was recorded at 517 nm using a microplate spectrophotometer. The percentage of radical scavenging activity at each concentration of the sample was calculated (five different concentrations with three replicates). Control samples of DPPH were prepared with 150 µL of methanol and 100 µL of DPPH. A blank sample was used for each seaweed sample. A scatter graph plotting concentration against the percentage of radical scavenging activity was created. The equation Y = mx + c (where x = concentration and Y = percentage of radical scavenging activity) was fitted, and the x value at Y = 50 was calculated.

2.5.3. ABTS Assay

The ABTS free radical-scavenging activity of each sample was determined according to the method described by Arnao et al. in 2001 [26]. A mixture of ABTS (2 mM) and potassium persulfate (70 mM) was allowed to stand overnight at room temperature in the dark to generate the ABTS radical cation, 16 h prior its use. The ABTS+ solution was then diluted with 80% methanol to obtain an absorbance of 0.700 ± 0.005 at 734 nm. Next, 25 µL of each sample stock was added to a 96-well plate, followed by the addition of 200 µL of ABTS+ solution. The absorbance was recorded at 734 nm after 6 min of incubation at room temperature. A standard curve was generated using a Trolox standard solution at various concentrations (6-hydroxy-2-5-7-8-tetramethylchroman-2-carboxylic acid).
The scavenging activity of different concentrations of extracts and fractions against the ABTS radical was also measured to calculate IC50, following a procedure similar to the DPPH scavenging method described above.

2.5.4. FRAP Assay

The FRAP assay was conducted following the method described by Al-Farsi et al. in 2005 [27]. The FRAP reagent was prepared by mixing 300 mM sodium acetate buffer (pH 3.6), a 10.0 mM solution of tripyridyl triazine (TPTZ), and a 20.0 mM solution of FeCl3·6H2O in a 10:1:1 volume ratio. Then, fifty microliters of each sample at a concentration of 5 mg/mL were added to a 96-well plate, followed by the addition of 2 mL of the FRAP reagent. The reaction mixture was incubated at room temperature for 4 min, and the increase in absorbance at 593 nm was measured. A standard curve was generated using different concentrations of FeSO4 (1.5 mM).
The antioxidant capacity, based on the ability to reduce ferric ions in the sample, was calculated from the linear calibration curve and expressed as mM FeSO4 equivalents per gram of sample (DW).

2.6. Trace Elements and Heavy Metal Analysis

Trace elements and heavy metals analysis were performed on eight seaweed species (R1, R3, G1, G2, G3, B1, B2, and B3) using ICP-OES (Inductively Coupled Plasma-Optical Emission Spectrometry) [28]. Each freeze-dried seaweed sample, weighing 0.3 g, was digested with 6 mL of 69% nitric acid in a microwave digester (MARS, CEM Corporation, Matthews, NC, USA) for a duration of 40 min.
After digestion, the samples were diluted with 25 mL of distilled deionized water and filtered through a 0.45 μm filter paper. The resulting filtrate was then utilized for analysis by ICP-OES (iCPA 7000 series, Thermo Scientific, Waltham, MA, USA). A multi-element standard solution (5 for ICP) was employed as the standard reference material for calibration.

2.7. Statistical Analysis

SAS version 9.1, statistical software was used to analyze data. All the data were presented as mean ± standard deviation.

3. Results and Discussion

3.1. Proximate Analysis

The proximate compositions of the seaweeds are presented in Table 2. The results of the proximate analysis are reported based on dry weight (DW), except for moisture content. The moisture content of the samples ranged from 80.84% to 93.76% based on fresh weight. Among the seaweed species, C. herpestica (G4) exhibited the highest (p < 0.05) moisture content, while U. rigida (G2) had the lowest (p < 0.05) moisture content. The ash content of the red algae ranged from 16.69% ± 0.00% to 35.20% ± 0.17%. As for the green algae and brown algae, their ash values ranged from 26.78% ± 0.04% to 28.18% ± 0.61% and 31.18% ± 0.05% to 33.39% ± 0.11%, respectively. Among the seaweeds investigated, Gracilaria corticata (R3) had the highest ash content of 35.20% ± 0.17% (p < 0.005), while S. cinereum (B2) exhibited the lowest content at 12.96% ± 0.37% (Table 2). The ash values were compared with similar seaweed species reported by Premarathna et al. (2022) [27] from various locations in Sri Lanka. The ash content of R3 was higher compared to G. corticata samples collected from Ahangama and Negombo in Sri Lanka, which were 08.17% ± 0.49% and 21.98% ± 0.23%, respectively. The ash content in Gelidiopsis variabilis (R1) was 16.69% ± 0.00%, which was lower than the reported value for Geldiopsis variabilis (21.64% ± 0.03%) collected from Chilaw, Sri Lanka [29].
The ash content typically found in edible seaweed is generally higher compared to that found in terrestrial plants, with the exception of spinach. Most vegetables from land have an ash content ranging from 5% to 10% of their dry weight, while spinach has a mineral content of 20.4% [20,30]. The high ash content in the seaweeds can be attributed to the elevated levels of salt and minerals present in their habitat. Furthermore, various factors such as seaweed species, location, geography, season, environment, physiology, and mineralization processes contribute to variations in ash content [31]. The consumption of seaweed ash is known to have preventive effects against diseases such as arthritis, fever, gout, fluid retention, bladder problems, and constipation [27].
In this study, the highest (p < 0.05) content of crude protein was found in green algae, Ulva rigida (G2), with 23.67% ± 0.73%, while the lowest protein content was observed in brown algae, Turbinaria ornata (B3), with 4.87% ± 0.85%. These findings align with those of Ibañez and Cifuentes in 2013, which reported that brown algae typically contain lower protein content (5% to 15% of the dry weight), whereas green and red algae contain the highest protein content (10% to 47% of the dry weight) [32]. A previous study on U. rigida collected from the northwest Iberian coast found a protein content of 17.8% [33], which is comparatively lower than that of G2. Brown algae, T. ornata, collected from Kankasanthurai, Sri Lanka, reported a protein content of 23.54% ± 0.53% [29], which is higher than that of B3.
Rajapakse and Kim in 2011 mentioned that the protein content of several red seaweeds is quantitatively comparable to that of legumes, where 30% to 40% of dry matter consists of proteins [34]. However, the protein content of the red algae investigated in this research was found to be lower than that of legumes. Variations in seaweed protein content are reported in similar species harvested at different locations and during different seasons [29,34,35]. Additionally, variations in protein content may depend on the method employed for protein estimation [36].
Highest (p < 0.05) fat content was found in brown algae, T. ornate (B3) with 4.13 ± 0.12% and C. herpestica (G4) while green algae, U. rigida (G2) accounts for the lowest with 0.09 ± 0.02% (Table 2). From the fat content range, it is evident that the least available component of all the investigated seaweeds is fat. It was mentioned by Rajapakse and Kim (2011) [34] that the lipid content of the seaweeds ranges from 1% to 5% of dry matter and the content and the composition of fat can greatly vary depending on the type of seaweed [34]. T. ornata, collected from Kankasanthurai, Sri Lanka exhibited a lower fat content of 3.3% ± 0.08% compared to that of B3 [29]. When comparing G2 with U. rigida samples collected from the Northwest Iberian coast and Varvara, Bulgaria, they were reported to have fat contents of 0.9% [33] and 0.79%, respectively [37]. In contrast, a comparison of the fat content of R3 with G. corticata found in the Thondi coast of Southeast India showed a higher fat content of 7.07% ± 0.33%.
Crude fiber indicates the amount of fiber that can be digested and affects energy digestibility. Generally, there is a significantly lower amount of crude fiber found in seaweeds compared to land plants [31]. The crude fiber content of the analyzed seaweeds ranged from 9.94% ± 0.13% to 18.73% ± 0.39%. Significantly high (p < 0.05) fiber contents were found in G. corticata (R3) and S. cinereum (B2), while the lowest (p < 0.05) crude fiber content was observed in G. variabilis (R1), both of which are red algae. The crude fiber content of green algae ranged from 10.66% ± 0.39% to 15.42% ± 0.26%, while in brown algae, it ranged from 17.46% ± 0.38% to 15.33% ± 0.56%.
The proximate analysis and comparison of results with previously published data reveal variations. As noted by Wong and Cheung in 2000, the chemical composition of seaweeds varies depending on factors such as species, habitats, maturity, and environmental conditions [9].

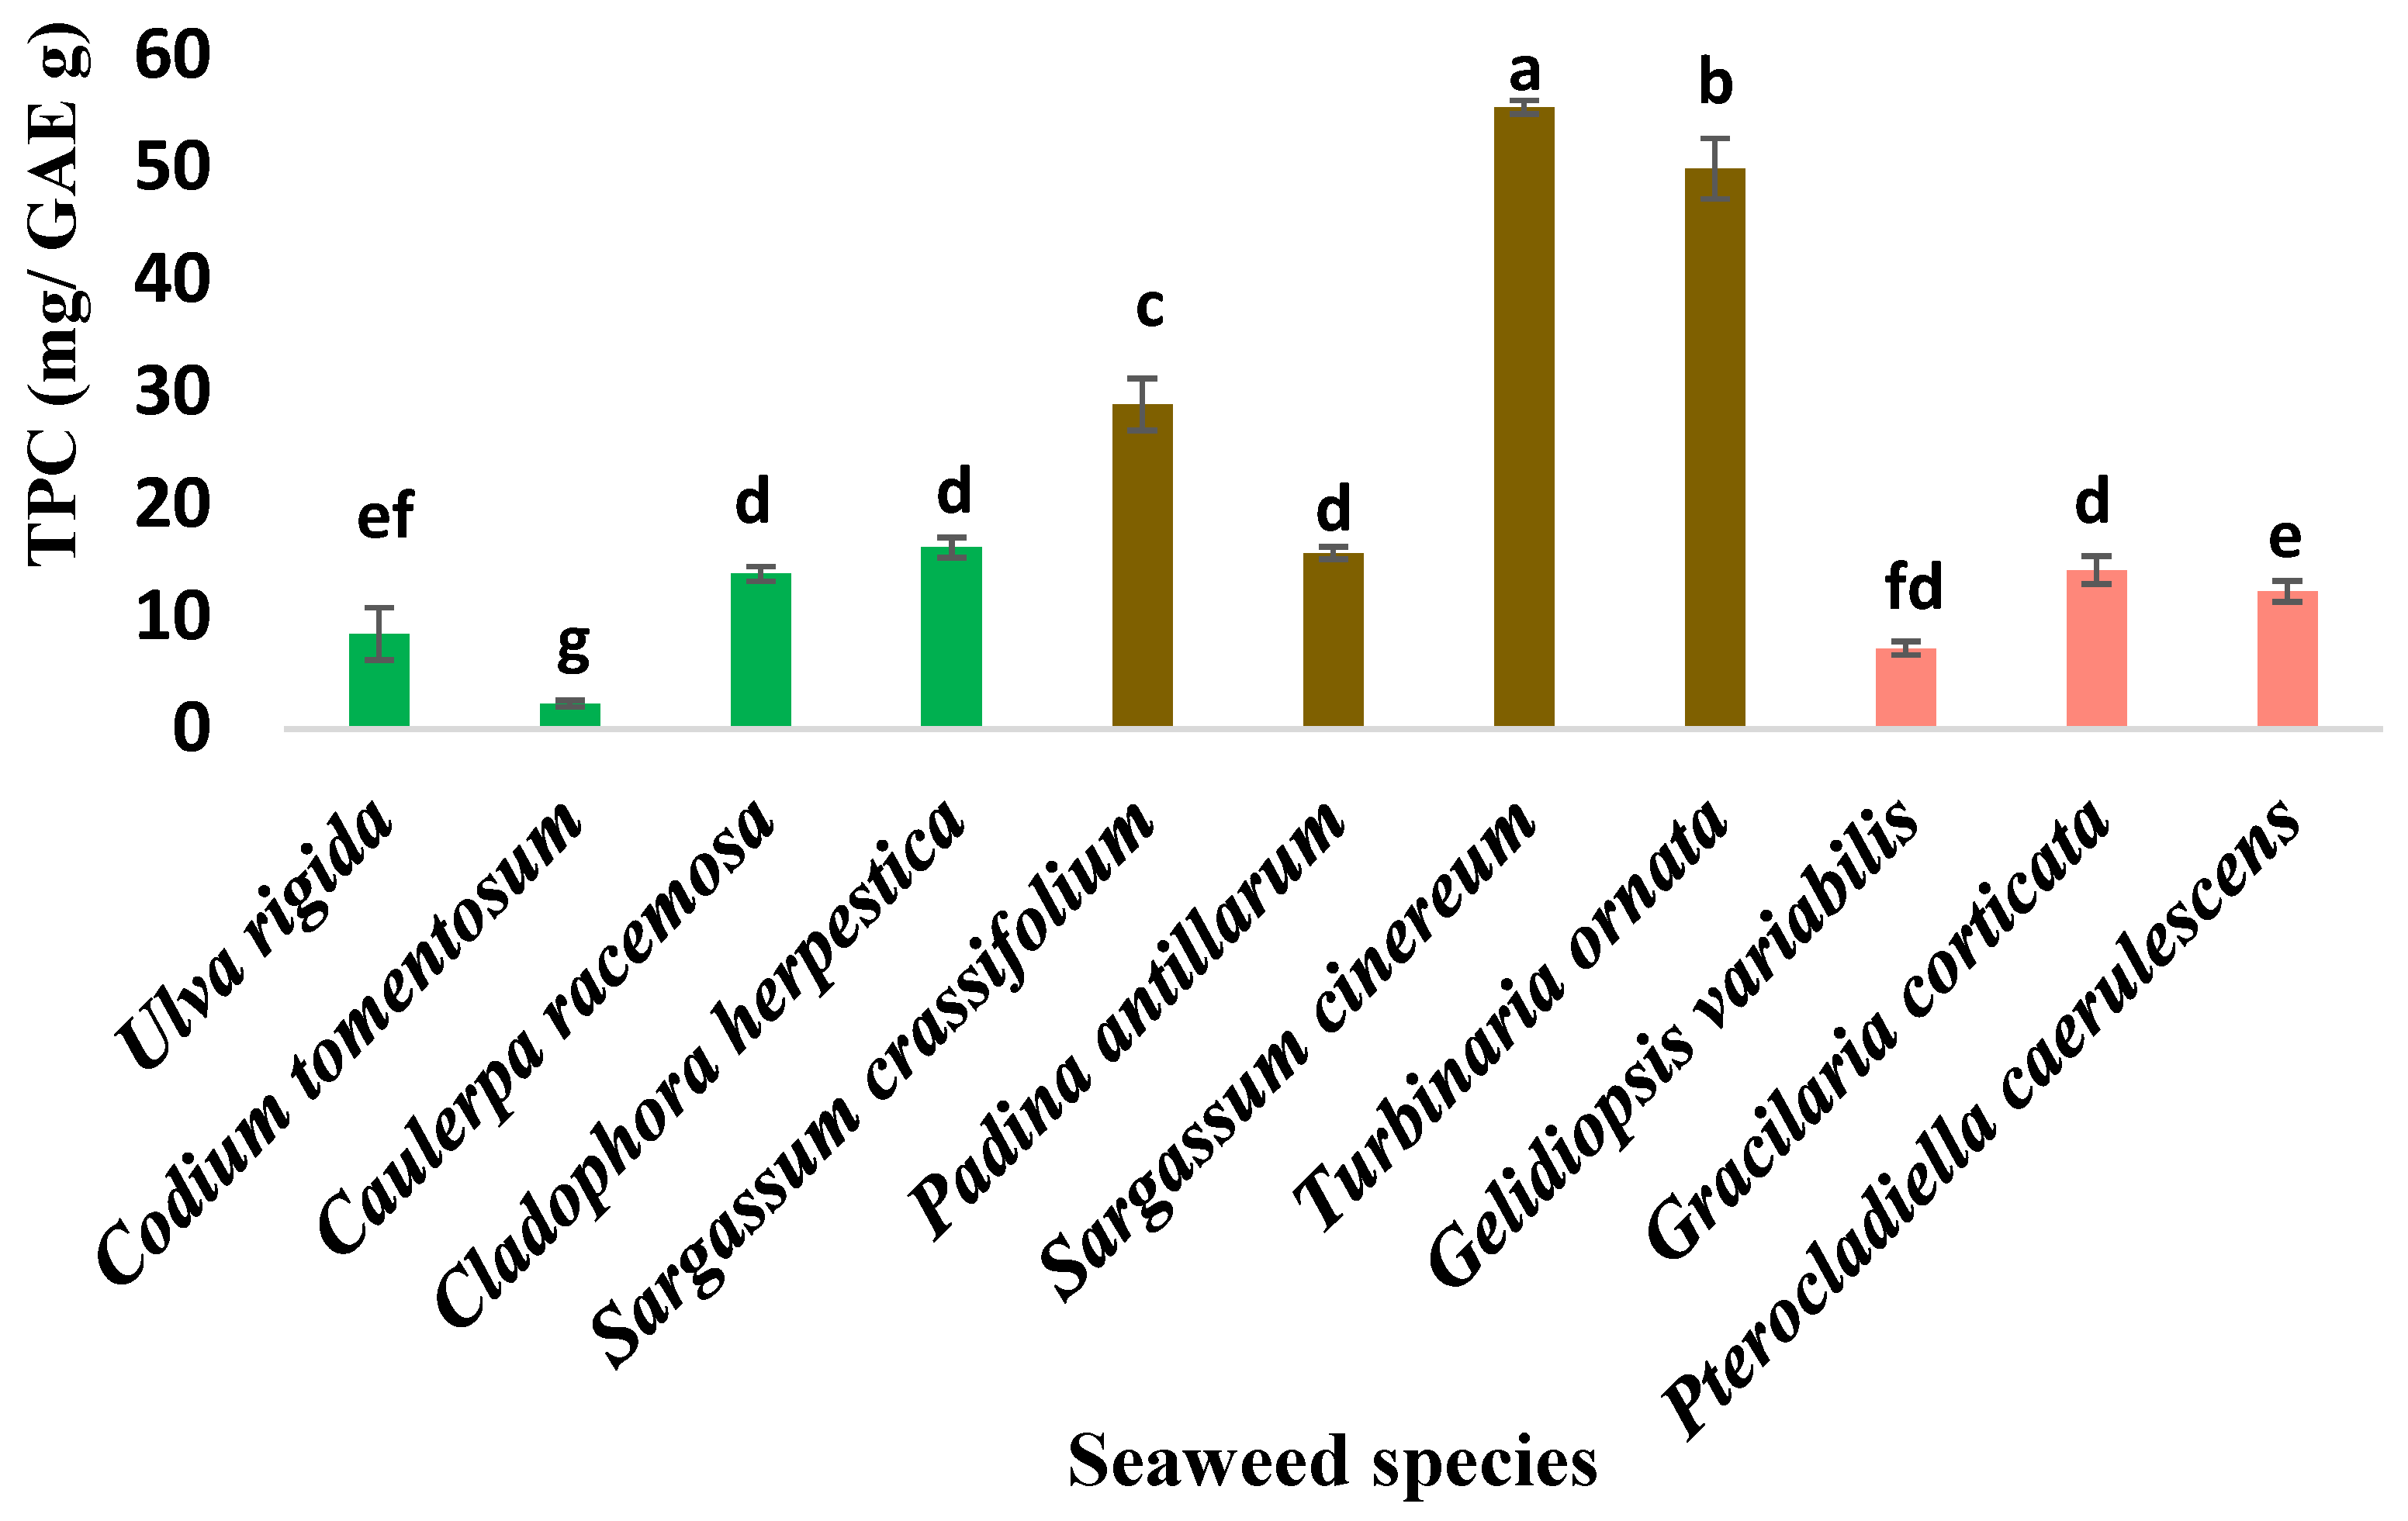
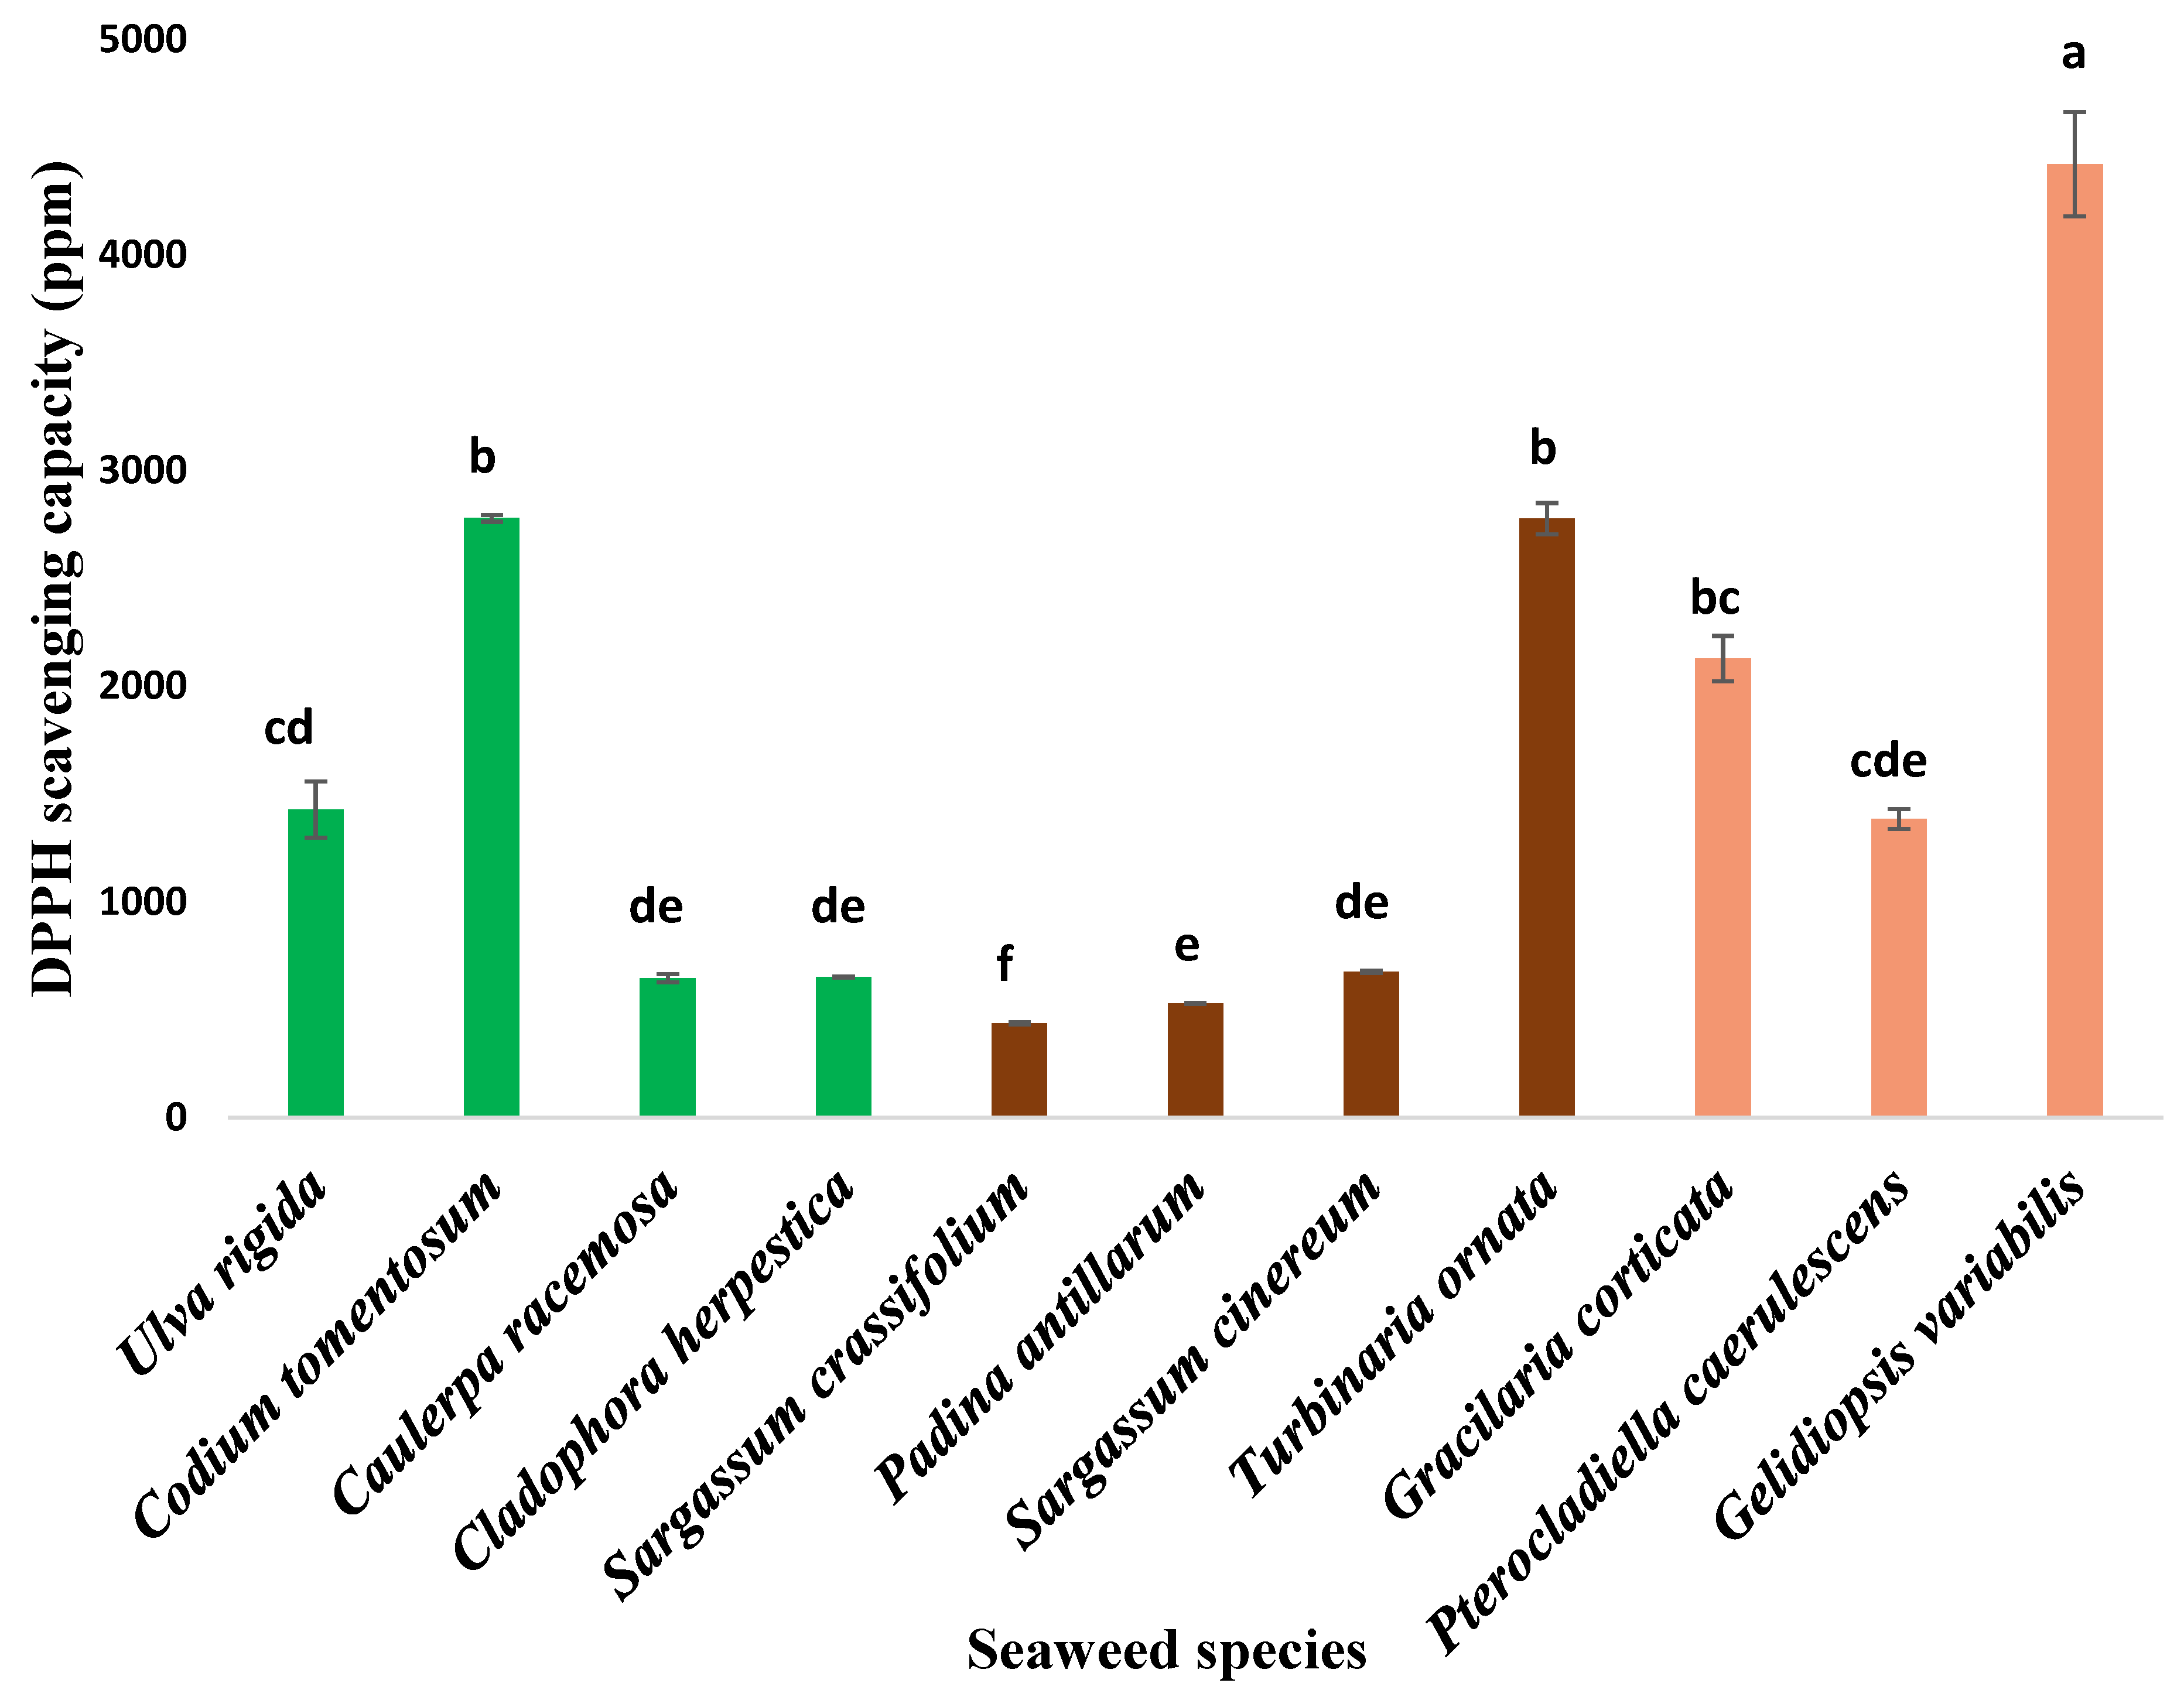
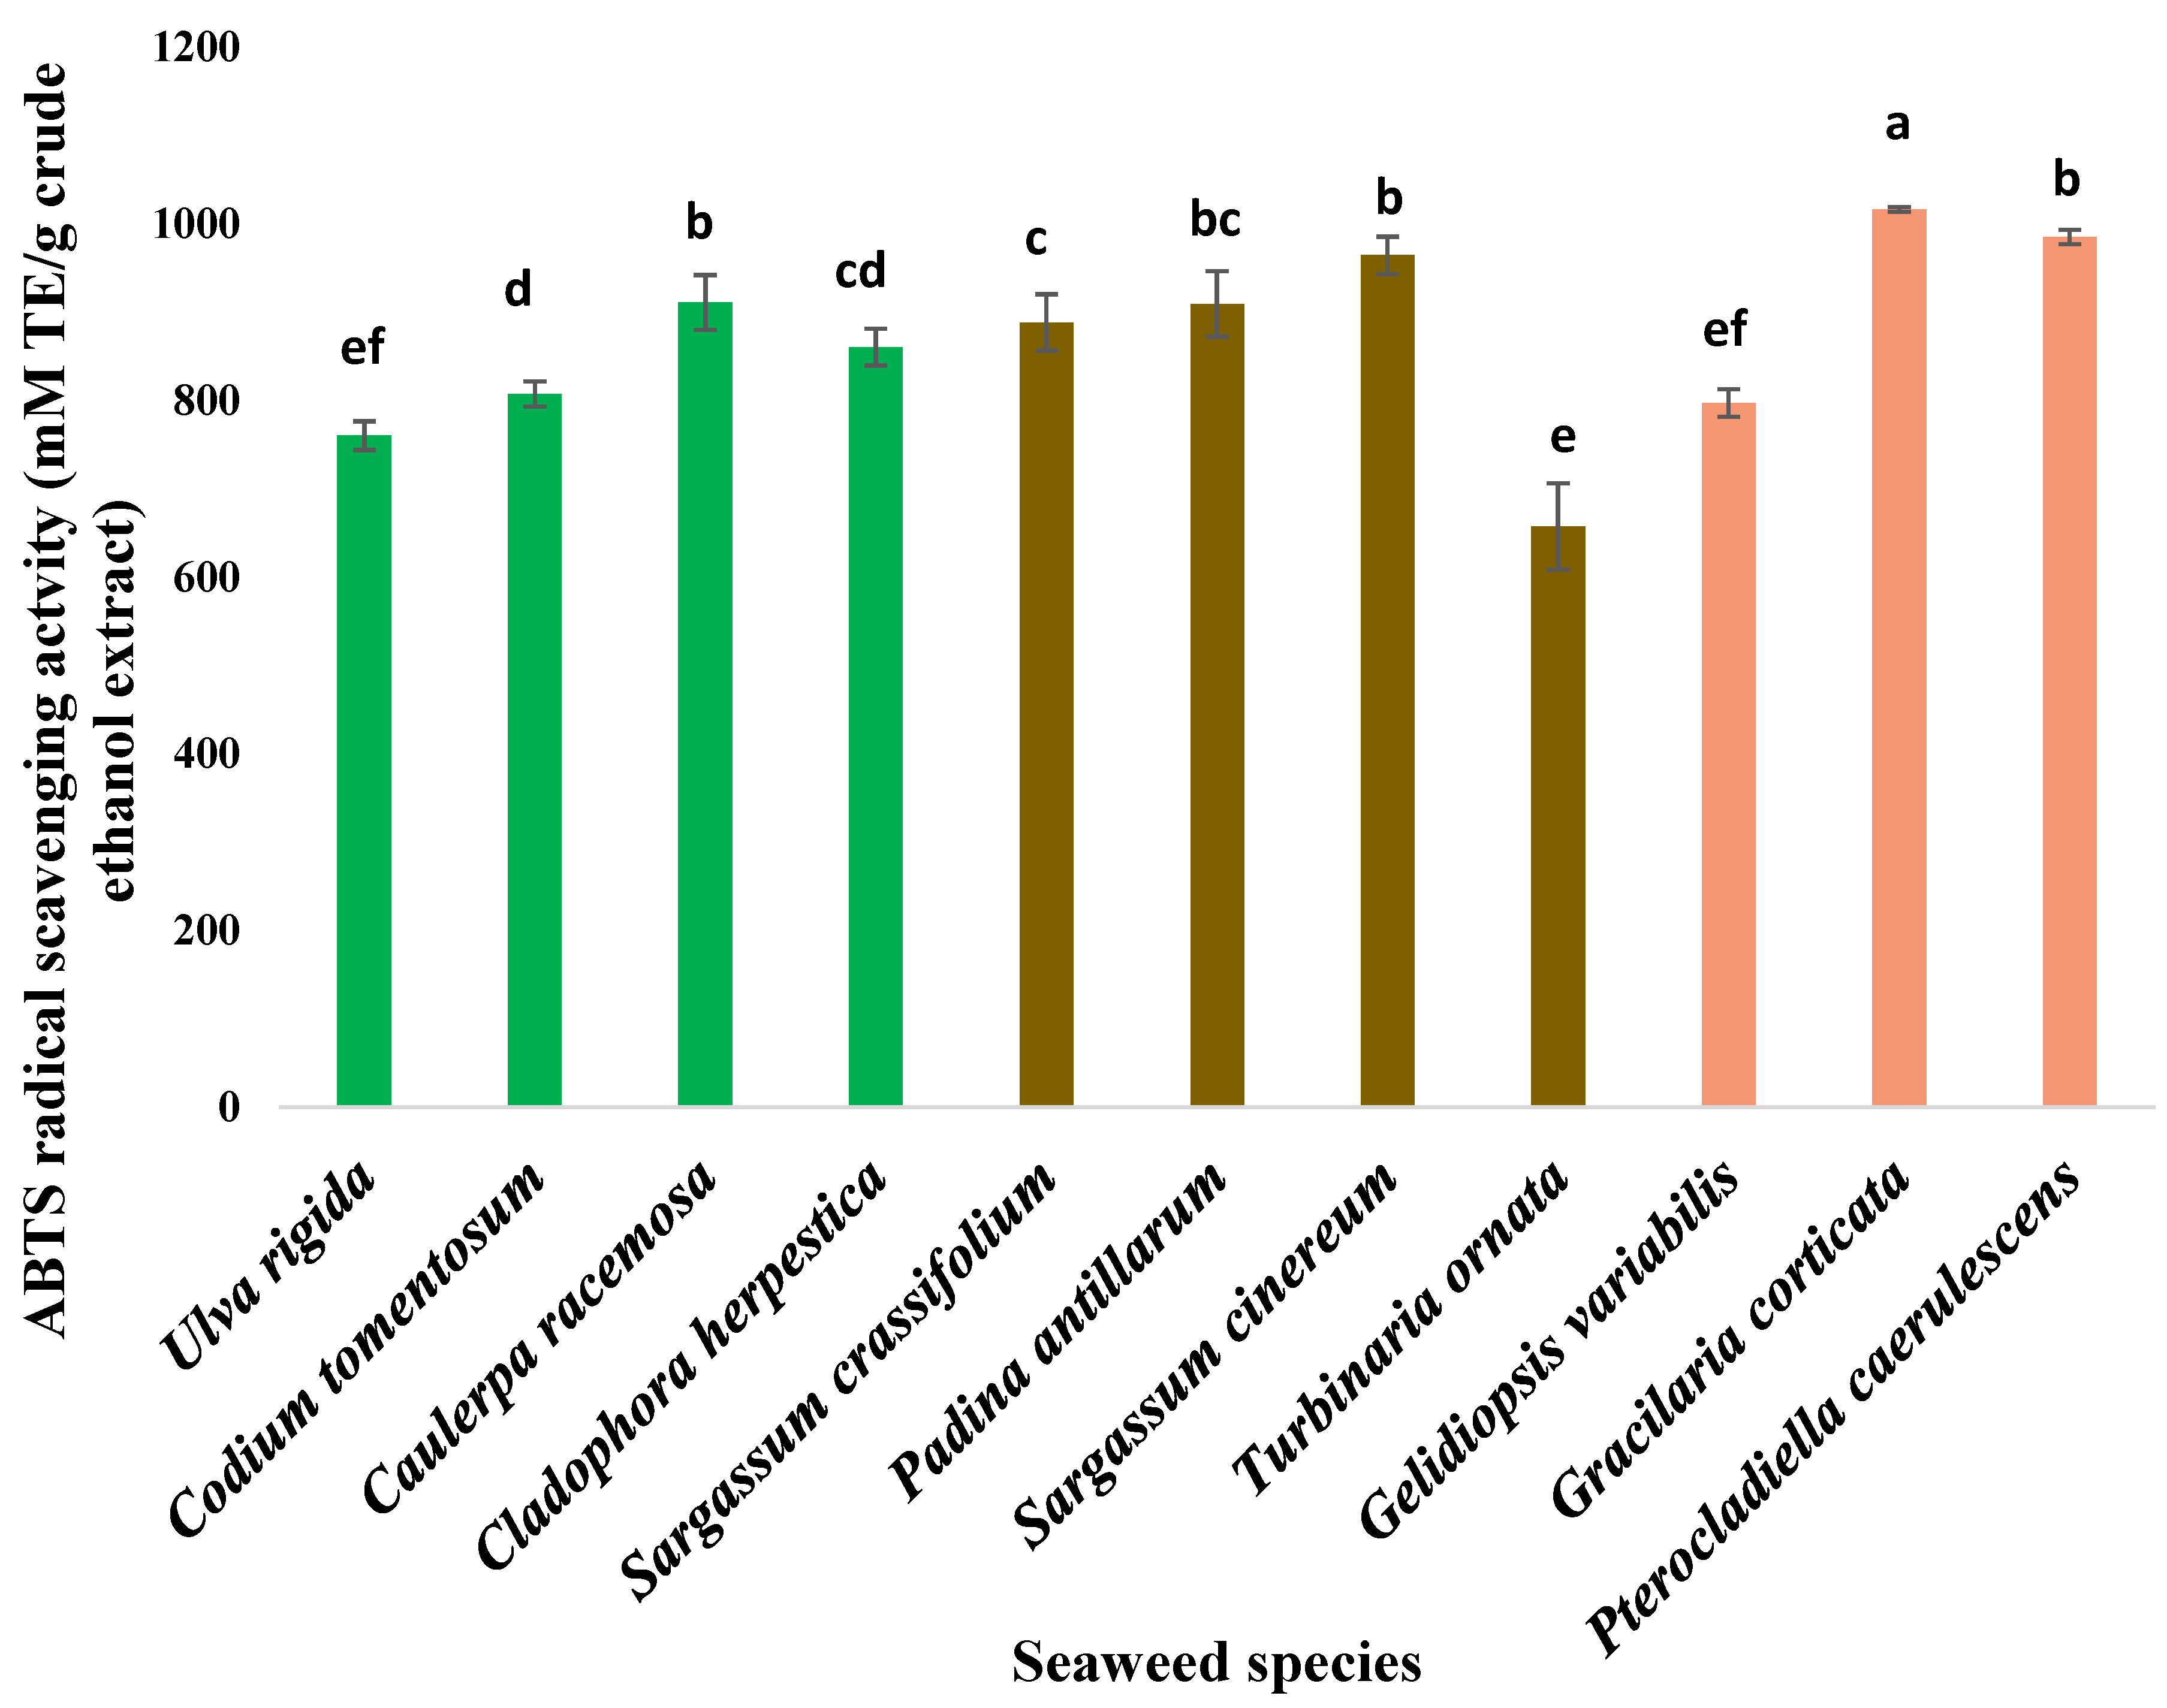
3.2. Antioxidant Activity

Phenolic compounds are commonly found in plants, reportedly having several biological activities including antioxidant properties. Previous reports have revealed that marine seaweed extracts, especially polyphenols, have antioxidant activity [36]. Phenolic compounds are regarded for their important dietary roles as antioxidants and chemo preventive agents [37]. The total phenolic contents of the seaweeds are shown in Figure 2. Highest (p < 0.05) total phenolic content was recorded in Sargassum cinereum (B2) (55.38 ± 0.61 mg/GAE g) and the lowest in Codium tomentosum species (G3) (2.26 ± 0.28 mg/GAE g). The total phenol content and antioxidant activity of the examined seaweeds may be higher than the observed data suggests, as the drying temperature of 60 °C could have removed some volatile compounds responsible for the TPC and antioxidant properties of seaweeds [38].
The FRAP values of the selected seaweeds are presented in Figure 3. Although the green algae C. racemosa had a lower total phenolic content (TPC) compared to some other seaweeds, it exhibited the highest ferric-reducing antioxidant power (FRAP) (p < 0.05) among them and agreed with previous observations [39,40,41]. The value was 420.19 ± 6.78 mM Fe2+/g of crude ethanol extract for C. racemosa (G1), followed by S. cinereum (B2) with 212.52 ± 6.54 mM Fe2+/g of crude ethanol extract, and T. ornata (B3) with 200.34 ± 8.39 mM Fe2+/g of crude ethanol extract. In contrast, Ulva rigida (G2) displayed the lowest (p < 0.05) FRAP value at 19.59 ± 0.17 mM Fe2+/g of crude ethanol extract. The findings support previous observations that oil cakes extracted from some seeds showed a negative correlation between TPC and the antioxidant efficiencies of the corresponding extracts, suggesting that phenolic compounds are not the sole contributors to the antioxidant activities [39].
DPPH is a free-radical compound widely employed to assess the free radical scavenging ability of samples [42,43]. This method allows for the determination of the anti-radical activity of an antioxidant by measuring the decrease in absorbance of the DPPH radical resulting from the scavenging of hydroxyl radicals through hydrogen donation. The DPPH radical scavenging activities of seaweeds are depicted in Figure 4. In this study, highest (p < 0.05) DPPH radical scavenging activity was exhibited by S. crassifolium (B1). The concentration of B1 required to scavenge 50% of the DPPH radical was 437.16 ppm (p < 0.05). Conversely, Gelidiopsis variabilis (R1) displayed the lowest DPPH radical scavenging activity, with an IC50 value of 4421.67 ± 94.80 ppm.
The ABTS radical cation is reactive towards most antioxidants, including phenolics, thiols, and vitamin C. Figure 5 displays the ABTS radical scavenging activity of selected seaweed species. Gracilaria corticata (R3) exhibited the highest ABTS radical scavenging activity at 1016.50 ± 2.74 mM TE/g of the crude ethanol extract (p < 0.05). Conversely, the lowest scavenging activity was observed in the brown algae, T. ornate (B3), with a value of 657.40 ± 48.97 mM TE/g of the crude ethanol extract.

3.3. Trace Elements and Heavy Metal Analysis

The different types of seaweed have the capability to accumulate minerals and essential elements from their surrounding environment, including the effective accumulation of arsenic and other heavy metals. The type and concentration of metals that accumulate vary depending on factors such as the seaweed species, collection time, growth phase, and location [44]. Furthermore, metal accumulation in seaweeds is influenced by environmental factors such as wave exposure, temperature, salinity, light, pH, and nitrogen availability [21]. Among these factors, two of the most significant ones in metal accumulation are the bioavailability of metals in the surrounding water and the algae’s capacity to uptake these metals [3]. The concentrations of trace elements, including Copper (Cu), Cobalt (Co), Nickel (Ni), Manganese (Mn), Chromium (Cr), Aluminium (Al), Lead (Pb), Arsenic (As), and Cadmium (Cd), were analyzed in eight seaweed species, and the results are presented in Table 3. Essential elements such as Cu, Co, Ni, Mn, and Cr are known to play roles in maintaining biochemical and physiological functions in living organisms. In contrast, Al, Pb, As, and Cd are considered non-essential elements or heavy metals and are recognized for their toxicity, even at low concentrations [45].
Among the analyzed seaweeds, significantly elevated concentrations (p < 0.05) of Cu, Co, Al, and Pb were observed in brown algae, specifically Sargassum cinereum (B2). Among the elements examined, Al demonstrated the highest accumulation, with concentrations ranging from 123.74 ± 3.87 to 562.13 ± 2.98 mg/kg and agreed with the findings of previous studies done in Italy and India. Brown algae, Sargassum cinereum (B2), exhibited the highest (p < 0.05) concentration of Al, while red algae, Pterocladiella caerulescens (R2), had the lowest (p < 0.05). It has been reported in previous studies that brown seaweed samples collected from urban industrialized areas tend to contain high levels of aluminum [46]. Likewise, it can be inferred that pollution in Sri Lankan coastal areas may have contributed to the accumulation of elevated levels of Al.
The results reveal that the highest (p < 0.05) amount of Pb was accumulated in brown algae, specifically S. cinereum (B2) (1.21 ± 0.07 mg/kg), while the lowest amount of Pb was found in another brown algae, S. crassifolium (B1) (0.14 ± 0.01 mg/kg). In terms of As content, the highest (p < 0.05) amount was detected in brown algae S. crassifolium (B1) (36.91 ± 0.13 mg/kg), while the lowest (p < 0.05) amount was observed in green algae, specifically U. rigida (G2) (2.349 ± 0.027 mg/kg). The study also indicated that higher (p < 0.05) levels of As were accumulated in brown algae compared to other seaweed classes. Regarding Cd, the highest levels (p < 0.05) were found in red algae, G. corticata (R3) (3.67 ± 0.08 mg/kg) and green algae, Caulerpa racemosa(G1) (3.66 ± 0.02 mg/kg), while the lowest levels were recorded in green algae, Codium tomentosum (G3) (0.59 ± 0.01 mg/kg).
According to WHO standards, the maximum allowable levels of heavy metals, including Pb, As, and Cd, in food and drugs are 10 mg/kg, 1.0 mg/kg, and 0.3 mg/kg, respectively [29]. In comparison with WHO data, the Pb levels in the analyzed seaweeds are within safe limits for human consumption. However, the amounts of As and Cd are notably higher than the WHO-recommended levels. These results suggest that the consumption of seaweeds may pose a health risk to humans [47]. Furthermore, the average concentration of Cr, Mn, Ni, and Zn in all investigated seaweed species exceeded WHO standard levels [48].
Another significant observation from the study is that brown seaweed tends to contain higher concentrations of metals such as Cu, Co, Al, Pb, and As compared to other seaweed classes. Similar observations have been reported by several other studies [45,47]. The reason for such accumulation in brown algae is attributed to the algal polysaccharide called fucoidan, which has the capacity to concentrate metals from the surrounding environment due to its metal-binding properties. Additionally, alginic acid in the cell walls of brown seaweed plays a role in trace metal uptake through non-regulated ion-exchange processes [47].

4. Conclusions

This study investigated the nutritional properties, antioxidant activities, and accumulation of trace elements in selected seaweed species from Sri Lanka. Among the species examined, Gracilaria corticata exhibited the highest ash and crude fiber content. Ulva rigida, a green alga, had the highest protein content. Crude fat content was generally low in all the investigated seaweed species, with Cladophora herpestica displaying the highest fat content. Gracilaria corticata, Sargassum crassifolium, Caulerpa racemosa, and Sargassum cinereum demonstrated the highest ABTS and DPPH radical scavenging activity, FRAP and TPC content, respectively.
The findings of the study indicate that the average concentrations of metals present in the seaweeds exceeded the recommended levels set by the World Health Organization (WHO). Specifically, the accumulation of aluminum was significantly higher compared to other trace metals. The concentrations of arsenic and cadmium, both heavy metals, also exceeded the recommended limits set by the WHO. While the analyzed seaweeds displayed acceptable nutritional content and antioxidant activity, the presence of heavy metals poses a potential risk to consumer health. Furthermore, any food products developed using seaweeds with accumulated heavy metals may have lower nutritional quality. Further studies are recommended to explore additional nutritional aspects such as fatty acid composition, amino acids, and vitamins. Additionally, the development of processing methods to remove harmful metals, extract nutritional and bioactive compounds, and produce high-quality food products from seaweeds is encouraged.

Author Contributions

Conceptualization, B.J. and R.L.: methodology, V.W. and S.G.; validation, R.L. and B.J.; formal analysis and investigation, V.W.; S.G.; B.J. and R.L.; writing original draft preparation, V.W.; P.W. and S.G.; writing, review, and editing, B.J., M.Q. and R.L.; supervision, B.J.; P.W. and R.L. All authors have read and agreed to the published version of the manuscript.

Funding

This research received no external funding.

Institutional Review Board Statement

Not applicable.

Informed Consent Statement

Not applicable.

Data Availability Statement

The data that support the findings of this study are available from the corresponding author upon request.

Acknowledgments

Authors would like to acknowledge K.M.G.G Jayasuriya, Department of Botany, Faculty of Science, University of Peradeniya, Sri Lanka for morphological identification of seaweed species.

Conflicts of Interest

The authors declare no conflicts of interest.

References

  1. Ganesan, A.R.; Tiwari, U.; Rajauria, G. Seaweed Nutraceuticals and Their Therapeutic Role in Disease Prevention. Food Sci. Hum. Wellness 2019, 8, 252–263. [Google Scholar] [CrossRef]
  2. Tanna, B.; Mishra, A. Nutraceutical Potential of Seaweed Polysaccharides: Structure, Bioactivity, Safety, and Toxicity. Compr. Rev. Food Sci. Food Saf. 2019, 18, 817–831. [Google Scholar] [CrossRef] [PubMed]
  3. Teixeira-Guedes, C.; Gomes-Dias, J.S.; Cunha, S.A.; Pintado, M.E.; Pereira, R.N.; Teixeira, J.A.; Rocha, C.M.R. Enzymatic Approach for the Extraction of Bioactive Fractions from Red, Green and Brown Seaweeds. Food Bioprod. Process. 2023, 138, 25–39. [Google Scholar] [CrossRef]
  4. Michalak, I.; Tiwari, R.; Dhawan, M.; Alagawany, M.; Farag, M.R.; Sharun, K.; Emran, T.; Bin Dhama, K. Antioxidant Effects of Seaweeds and Their Active Compounds on Animal Health and Production—A Review. Vet. Q. 2022, 42, 48–67. [Google Scholar] [CrossRef]
  5. Pirian, K.; Jeliani, Z.Z.; Sohrabipour, J.; Arman, M.; Faghihi, M.M.; Yousefzadi, M. Nutritional and Bioactivity Evaluation of Common Seaweed Species from the Persian Gulf. Iran. J. Sci. Technol. Trans. A Sci. 2018, 42, 1795–1804. [Google Scholar] [CrossRef]
  6. Shannon, E.; Abu-Ghannam, N. Seaweeds as Nutraceuticals for Health and Nutrition. Phycologia 2019, 58, 563–577. [Google Scholar] [CrossRef]
  7. MacArtain, P.; Gill, C.I.R.; Brooks, M.; Campbell, R.; Rowland, I.R. Nutritional Value of Edible Seaweeds. Nutr. Rev. 2007, 65, 535–543. [Google Scholar] [CrossRef]
  8. Meinita, M.D.N.; Harwanto, D.; Choi, J.-S. Seaweed Exhibits Therapeutic Properties against Chronic Diseases: An Overview. Appl. Sci. 2022, 12, 2638. [Google Scholar] [CrossRef]
  9. Wong, K.H.; Cheung, P.C.K. Nutritional Evaluation of Some Subtropical Red and Green Seaweeds. Food Chem. 2000, 71, 475–482. [Google Scholar] [CrossRef]
  10. Fayzi, L.; Askarne, L.; Cherifi, O.; Boufous, E.H.; Cherifi, K. Comparative Antibacterial Activity of Some Selected Seaweed Extracts from Agadir Coastal Regions in Morocco. Int. J. Curr. Microbiol. Appl. Sci. 2020, 9, 390–399. [Google Scholar] [CrossRef]
  11. Nurkolis, F.; Taslim, N.A.; Qhabibi, F.R.; Kang, S.; Moon, M.; Choi, J.; Choi, M.; Park, M.N.; Mayulu, N.; Kim, B. Ulvophyte Green Algae Caulerpa lentillifera: Metabolites Profile and Antioxidant, Anticancer, Anti-Obesity, and In Vitro Cytotoxicity Properties. Molecules 2023, 28, 1365. [Google Scholar] [CrossRef]
  12. Pourakbar, L.; Moghaddam, S.S.; El Enshasy, H.A.; Sayyed, R.Z. Antifungal Activity of the Extract of a Macroalgae, Gracilariopsis Persica, against Four Plant Pathogenic Fungi. Plants 2021, 10, 1781. [Google Scholar] [CrossRef]
  13. Malhão, F.; Ramos, A.; Macedo, A.; Rocha, E. Cytotoxicity of Seaweed Compounds, Alone or Combined to Reference Drugs, against Breast Cell Lines Cultured in 2D and 3D. Toxics 2021, 9, 24. [Google Scholar] [CrossRef] [PubMed]
  14. El Shafay, S.; El-Sheekh, M.; Bases, E.; El-Shenody, R. Antioxidant, Antidiabetic, Anti-Inflammatory and Anticancer Potential of Some Seaweed Extracts. Food Sci. Technol. 2022, 42, e20521. [Google Scholar] [CrossRef]
  15. Cotas, J.; Leandro, A.; Monteiro, P.; Pacheco, D.; Figueirinha, A.; Gonçalves, A.M.M.; da Silva, G.J.; Pereira, L. Seaweed Phenolics: From Extraction to Applications. Mar. Drugs 2020, 18, 384. [Google Scholar] [CrossRef]
  16. Kumar, L.R.G.; Paul, P.T.; Anas, K.K.; Tejpal, C.S.; Chatterjee, N.S.; Anupama, T.K.; Mathew, S.; Ravishankar, C.N. Phlorotannins–Bioactivity and Extraction Perspectives. J. Appl. Phycol. 2022, 34, 2173–2185. [Google Scholar] [CrossRef] [PubMed]
  17. Jacobsen, C.; Sørensen, A.-D.M.; Holdt, S.L.; Akoh, C.C.; Hermund, D.B. Source, Extraction, Characterization, and Applications of Novel Antioxidants from Seaweed. Annu. Rev. Food Sci. Technol. 2019, 10, 541–568. [Google Scholar] [CrossRef]
  18. Freile-Pelegrín, Y.; Robledo, D. Bioactive Phenolic Compounds from Algae. In Bioactive Compounds from Marine Foods; Wiley: Hoboken, NJ, USA, 2013; pp. 113–129. [Google Scholar] [CrossRef]
  19. Maeda, H.; Tsukui, T.; Sashima, T.; Hosokawa, M.; Miyashita, K. Seaweed Carotenoid, Fucoxanthin, as a Multi-Functional Nutrient. Asia Pac. J. Clin. Nutr. 2008, 17 (Suppl. S1), 196–199. [Google Scholar]
  20. Rupérez, P. Mineral Content of Edible Marine Seaweeds. Food Chem. 2002, 79, 23–26. [Google Scholar] [CrossRef]
  21. Rubio, C.; Napoleone, G.; Luis-González, G.; Gutiérrez, A.J.; González-Weller, D.; Hardisson, A.; Revert, C. Metals in Edible Seaweed. Chemosphere 2017, 173, 572–579. [Google Scholar] [CrossRef]
  22. Coppejans, E.; Leliaert, F.; Dargent, O.; Gunasekara, R.; De Clerck, O. Sri Lankan Seaweeds: Methodologies and Field Guide to the Dominant Species; Belgian National Focal Point to the Global Taxonomy Initiative: Brussels, Belgium, 2009. [Google Scholar]
  23. Official Methods of Analysis of AOAC International, 18th ed.; AOAC International: Gaithersburg, MD, USA, 2005.
  24. Singleton, V.L.; Rossi, J.A. Colorimetry of Total Phenolics with Phosphomolybdic-Phosphotungstic Acid Reagents. Am. J. Enol. Vitic. 1965, 16, 144–158. [Google Scholar]
  25. Brand-Williams, W.; Cuvelier, M.E.; Berset, C. Use of a Free Radical Method to Evaluate Antioxidant Activity. LWT Food Sci. Technol. 1995, 28, 25–30. [Google Scholar] [CrossRef]
  26. Arnao, M.B.; Cano, A.; Acosta, M. The Hydrophilic and Lipophilic Contribution to Total Antioxidant Activity. Food Chem. 2001, 73, 239–244. [Google Scholar] [CrossRef]
  27. Al-Farsi, M.; Alasalvar, C.; Morris, A.; Baron, M.; Shahidi, F. Comparison of Antioxidant Activity, Anthocyanins, Carotenoids, and Phenolics of Three Native Fresh and Sun-Dried Date (Phoenix dactylifera L.) Varieties Grown in Oman. J. Agric. Food Chem. 2005, 53, 7592–7599. [Google Scholar] [CrossRef]
  28. Suriya, M.S.; Ridma, L.; Ruksheela, B.; Isuri, R.; Afka, D.; Barana, J.; Ruvini, L. Morphological, physicochemical, and functional properties of fifteen different dietary carbohydrate sources in Sri Lanka. JSFA Rep. 2023, 3, 463–472. [Google Scholar] [CrossRef]
  29. Premarathna, A.D.; Tuvikene, R.; Fernando, P.H.P.; Adhikari, R.; Perera, M.C.N.; Ranahewa, T.H.; Howlader, M.M.; Wangchuk, P.; Jayasooriya, A.P.; Rajapakse, R.P.V.J. Comparative Analysis of Proximate Compositions, Mineral and Functional Chemical Groups of 15 Different Seaweed Species. Sci. Rep. 2022, 12, 19610. [Google Scholar] [CrossRef]
  30. Sánchez-Machado, D.I.I.; López-Cervantes, J.; López-Hernández, J.; Paseiro-Losada, P. Fatty Acids, Total Lipid, Protein and Ash Contents of Processed Edible Seaweeds. Food Chem. 2004, 85, 439–444. [Google Scholar] [CrossRef]
  31. Nafiqoh, N.; Suryaningrum, L.H.; Novita, H.; Andriyanto, S. Nutrient Content of Seaweed and Its Digestibility in Osteochilus Hasseltii. IOP Conf. Ser. Earth Environ. Sci. 2021, 695, 012015. [Google Scholar] [CrossRef]
  32. Ibañez, E.; Cifuentes, A. Benefits of Using Algae as Natural Sources of Functional Ingredients. J. Sci. Food Agric. 2013, 93, 703–709. [Google Scholar] [CrossRef]
  33. Taboada, C.; MillÃn, R.; MÃ guez, I. Composition, Nutritional Aspects and Effect on Serum Parameters of Marine Algae Ulva rigida. J. Sci. Food Agric. 2009, 90, 445–449. [Google Scholar] [CrossRef]
  34. Rajapakse, N.; Kim, S.-K. Nutritional and Digestive Health Benefits of Seaweed. In Advances in Food and Nutrition Research; Elsevier Inc.: Amsterdam, The Netherlands, 2011; Volume 64, pp. 17–28. [Google Scholar] [CrossRef]
  35. Tabarsa, M.; Rezaei, M.; Ramezanpour, Z.; Robert Waaland, J.; Rabiei, R. Fatty Acids, Amino Acids, Mineral Contents, and Proximate Composition of Some Brown Seaweeds. J. Phycol. 2012, 48, 285–292. [Google Scholar] [CrossRef]
  36. McDermid, K.J.; Stuercke, B. Nutritional Composition of Edible Hawaiian Seaweeds. J. Appl. Phycol. 2003, 15, 513–524. [Google Scholar] [CrossRef]
  37. Ivanova, V.; Stancheva, M.; Petrova, D.; Ivanova, V.; Stancheva, M.; Petrova, D. Fatty Acid Composition of Black Sea Ulva rigida and Cystoseira crinita. Bulg. J. Agric. Sci. 2013, 19 (Suppl. S1), 42–47. [Google Scholar]
  38. Grant, T.; Ingegerd, S.; Federico, G.G. A review of drying methods for improving the quality of dried herbs. Crit. Rev. Food Sci. Nutr. 2021, 61, 1763–1786. [Google Scholar] [CrossRef]
  39. Kurniawan, R.; Nurkolis, F.; Taslim, N.A.; Subali, D.; Surya, R.; Gunawan, W.B.; Alisaputra, D.; Mayulu, N.; Salindeho, N.; Kim, B. Carotenoids Composition of Green Algae Caulerpa racemosa and Their Antidiabetic, Anti-Obesity, Antioxidant, and Anti-Inflammatory Properties. Molecules 2023, 28, 3267. [Google Scholar] [CrossRef]
  40. Grace, S.; Djuhria, W.; Nurmelita, T.; Verly, D.; Aurielle, A.S.; Happy, K.P.; Sidik, M.; Fahrul, N.; Apollinaire, T.; Bonglee, K. Green seaweed Caulerpa racemosa—Chemical constituents, cytotoxicity in breast cancer cells and molecular docking simulation. J. Agric. Food Res. 2023, 12, 100621. [Google Scholar] [CrossRef]
  41. Petra, T.; Barbara, Č.; Nataša, P.U.; Helena, A. Studies of the correlation between antioxidant properties and the total phenolic content of different oil cake extracts. Ind. Crops. Prod. 2012, 39, 210–221, ISSN 0926-6690. [Google Scholar]
  42. Qi, H.; Zhao, T.; Zhang, Q.; Li, Z.; Zhao, Z.; Xing, R. Antioxidant Activity of Different Molecular Weight Sulfated Polysaccharides from Ulva Pertusa Kjellm (Chlorophyta). J. Appl. Phycol. 2005, 17, 527–534. [Google Scholar] [CrossRef]
  43. Wang, T.; Jónsdóttir, R.; Ólafsdóttir, G. Total Phenolic Compounds, Radical Scavenging and Metal Chelation of Extracts from Icelandic Seaweeds. Food Chem. 2009, 116, 240–248. [Google Scholar] [CrossRef]
  44. Smith, J.; Summers, G.; Wong, R. Nutrient and Heavy Metal Content of Edible Seaweeds in New Zealand. New Zeal. J. Crop Hortic. Sci. 2010, 38, 19–28. [Google Scholar] [CrossRef]
  45. Marquès, M.; Correig, E.; Capdevila, E.; Gargallo, E.; González, N.; Nadal, M.; Domingo, J.L. Essential and Non-Essential Trace Elements in Milks and Plant-Based Drinks. Biol. Trace Elem. Res. 2022, 200, 4524–4533. [Google Scholar] [CrossRef] [PubMed]
  46. Maria, F.; Anna, B.; Simonetta, M.; Giorgio, F.; Silva, R.; Domenico, G.; Giorgia, V.; Raissa, B.; Stefano, M.; Silvia, V. Heavy metals and potential risks in edible seaweed on the market in Italy. Chemosphere 2020, 263, 127983. [Google Scholar] [CrossRef]
  47. Muse, J.O.; Tudino, M.B.; D’Huicque, L.; Troccoli, O.E.; Carducci, C.N. A Survey of Some Trace Elements in Seaweeds from Patagonia, Argentina. Environ. Pollut. 1995, 87, 249–253. [Google Scholar] [CrossRef] [PubMed]
  48. Jayawardana, B.C.; Warnasooriya, S.G.V.B.; Vithange, M.; Thilakarathna, H.M.E.; Jayawardana, B.M.Y.B.; Liyanage, R. Nutritional and Bioactive Properties of Selected Marine Microalge Species in Sri Lanka. In International Conference of Food Security and Roles of Fisheries; Korean Federation of Fisheries Science and technology Societies: Busan, Republic of Korea, 2017; p. 464. [Google Scholar]
Figure 1. Seaweed species, sample number; (a) Ulva rigida, R1, (b) Codium tomentosum, G3, (c) Cladophora herpestica, G4, (d) Caulerpa racemosa, G1, (e) Gracilaria corticata, R3, (f) Gelidiopsis variabilis, R1, (g) Pterocladiella caerulescens, R2, (h) Sargassum crassifolium, B1, (i) Sargassum cinereum, B2, (j) Turbinaria ornata, B3, (k) Padina antillarum, B4.
Nutraceuticals 04 00004 g001
Figure 2. Total phenolic content in the studied seaweed extracts. Mean values with different superscript letters were significantly different (p < 0.05).
Nutraceuticals 04 00004 g002
Figure 3. Ferric-reducing antioxidant power (FRAP) of some selected seaweed extracts. Mean values with different superscript letters were significantly different (p < 0.05).
Nutraceuticals 04 00004 g003
Figure 4. DPPH scavenging capacity of the studied seaweed extracts. Mean values with different superscript letters were significantly different (p < 0.05).
Nutraceuticals 04 00004 g004
Figure 5. ABTS radical scavenging activity of the studied seaweed extracts. Mean values with different superscript letters were significantly different (p < 0.05).
Nutraceuticals 04 00004 g005
Table 1. Seaweed species, voucher number, type of algae, collected location and collected date. Abbreviations: R, red algae (Rhodophyceae); G, green algae (Chlorophyceae); B, brown algae (Phaeophyaceae).
Seaweed SpeciesVoucher No.TypeCollected LocationLocation CoordinatesCollected Date
Gelidiopsis variabilisSW1RSouth Bar, MannarN 8°97′13″, E 79°88′06″31 August 2016
Pterocladiella caerulescensSW2RMadiha, MataraN 5°56′11″, E 80°30′56″25 September 2016
Gracilaria corticataSW3RWellamadama, MataraN 5°94′26″, E 80°56′74″26 September 2016
Caulerpa racemosaSW4G
Ulva rigidaSW5GMadiha, MataraN 5°56′11″, E 80°30′56″25 September 2016
Codium tomentosumSW6GMadiha, MataraN 5°56′11″, E 80°30′56″25 September 2016
Cladophora herpesticaSW7GMadiha, MataraN 5°56′11″, E 80°30′56″25 September 2016
Sargassum crassifoliumSW8BMadiha, MataraN 5°56′11″, E 80°30′56″25 September 2016
Sargassum cinereumSW9BErukkalampiddy, MannarN 9°2′27″, E 79°52′43″30 August 2016
Turbinaria ornataSW10BSouth Bar, MannarN 8°97′13″, E 79°88′06″31 August 2016
Padina antillarumSW11BWellamadama, MataraN 5°94′26″, E 80°56′74″25 September 2016
Table 2. Proximate composition of seaweeds.
Types of SeaweedSample No.MC% (FW)Ash% (DW)Crude Protein% (DW)Crude Fat% (DW)Crude Fiber% (DW)
Gelidiopsis variabilisR191.3116.69 ± 0.00 g13.66 ± 0.04 d1.46 ± 0.09 cd9.94 ± 0.13 c
Pterocladiella caerulescensR287.3622.58 ± 0.19 fc22.58 ± 0.39 ab2.09 ± 0.14 bc10.49 ± 0.04 d
Gracilaria corticataR385.6835.20 ± 0.17 a19.43 ± 0.27 b2.68 ± 0.09 b18.73 ± 0.39 a
Caulerpa racemosaG192.8926.78 ± 0.04 dc18.61 ± 0.82 bc0.54 ± 0.66 c12.33 ± 0.08 c
Ulva rigidaG280.8420.26 ± 0.11 cf23.67 ± 0.73 a0.09 ± 0.02 c11.64 ± 0.31 cd
Codium tomentosumG391.8021.43 ± 0.73 c13.85 ± 0.48 d1.31 ± 0.23 cd10.66 ± 0.39 d
Cladophora herpesticaG493.7628.18 ± 0.61 d17.53 ± 1.90 bc3.89 ± 0.40 a15.42 ± 0.26 b
Sargassum crassifoliumB189.0231.18 ± 0.05 bc10.44 ± 0.51 c2.65 ± 0.01 b15.78 ± 0.11 b
Sargassum cinereumB288.0212.96 ± 0.37 h8.30 ± 0.24 f2.47 ± 0.22 b17.46 ± 0.38 a
Turbinaria ornataB387.0221.11 ± 0.12 c4.87 ± 0.85 g4.13 ± 0.12 a15.33 ± 0.56 b
Padina antillarumB487.9733.39 ± 0.11 bc18.44 ± 0.51 bc2.33 ± 0.00 b16.32 ± 0.04 b
Values are expressed as mean ± S.D (Standard deviation); Values with different alphabet letters are significantly different (p < 0.05). MC, moisture content; FW, fresh weight; DW, dry weight.
Table 3. Trace element and heavy metal content in the studied seaweeds (mg/kg wet weight).
Seaweed TypeTrace MetalsHeavy Metals
CuCoNiMnCrAlPbAsCd
P. caerulescens0.48 ± 0.15 c0.30 ± 0.00 e0.95 ± 0.02 c,d14.29 ± 0.1 d0.55 ± 0.02 e123.74 ± 3.87 h0.19 ± 0.03 d6.08 ± 0.04 f2.76 ± 0.03 b
G. corticata1.85 ± 0.19 c0.37 ± 0.02 d0.95 ± 0.05 c,d53.41 ± 1.32 a1.17 ± 0.12 d246.69 ± 5.74 d0.32 ± 0.04 c7.33 ± 0.2 e3.67 ± 0.08 a
C. racemosa1.95 ± 0.07 c0.66 ± 0.01 b5.88 ± 0.79 a34.58 ± 0.18 c4.17 ± 0.12 a453.29 ± 9.15 c0.58 ± 0.03 b5.90 ± 0.01 f3.66 ± 0.02 a
U. rigida1.574 ± 0.05 c0.23 ± 0.01 f2.76 ± 0.048 b9.74 ± 0.176 e2.23 ± 0.159 b180.88 ± 2.28 f0.374 ± 0.025 c2.35 ± 0.027 g0.99 ± 0.006 e
C. tomentosum0.50 ± 0.08 c0.16 ± 0.00 g1.43 ± 0.02 c,d9.70 ± 0.20 e1.93 ± 0.09 c214.59 ± 7.06 e0.35 ± 0.02 c18.50 ± 0.34 d0.59 ± 0.01 f
S. crassifolium0.25 ± 0.04 c0.25 ± 0.00 f0.70 ± 0.01 d7.54 ± 0.07 f0.68 ± 0.02 e152.93 ± 2.98 g0.14 ± 0.01 d36.91 ± 0.13 a2.13 ± 0.01 c
S. cinereum442.34 ± 20.94 a1.57 ± 0.04 a1.6 ± 0.03 c49.3 ± 0.58 b1.9 ± 0.04 c562.13 ± 6.47 a1.21 ± 0.07 a30.99 ± 0.3 c1.34 ± 0.02 d
T. ornata37.77 ± 2.47 b0.54 ± 0.01 c0.99 ± 0.06 c,d9.14 ± 0.09 e1.68 ± 0.13 c477.43 ± 4.49 b0.33 ± 0.01 c33.66 ± 0.07 b1.04 ± 0.01 e
Values are expressed as mean ± S.D (Standard deviation); Values with different alphabet letters are significantly different (p < 0.05).
Disclaimer/Publisher’s Note: The statements, opinions and data contained in all publications are solely those of the individual author(s) and contributor(s) and not of MDPI and/or the editor(s). MDPI and/or the editor(s) disclaim responsibility for any injury to people or property resulting from any ideas, methods, instructions or products referred to in the content.

