Child Acute Malnutrition and Mortality in Populations Affected by Displacement in the Horn of Africa, 1997–2009

Abstract
:1. Introduction
2. Methods

| Displaced persons (n) c,i | Local (Resident) (n) d,j | Mixed (n) e,k | |
|---|---|---|---|
| A: Under-5 Mortality | |||
| Pastoralists a | 1.43 (89) | 1.53 (186) | 1.48 (138) |
| Agriculturalists b | 1.41 (39) | 0.93 (315) | |
| Total f | 1.42 (128) | 1.15 (501) | |
| B: GAM (%) | |||
| Pastoralists g | 16.4 (173) | 19.3 (302) | 18.0 (188) |
| Agriculturalists h | 7.2 (104) | 9.0 (389) | |
| Total l | 13.0 (277) | 13.5 (691) |
| Under-5 Mortality (n) | Global Acute Malnutrition (with oedema included) (n) | |
|---|---|---|
| A: Sudan (pastoralists) | ||
| 1997–2002 | 1.83 (57) | 18.9 (117) |
| 2003–2006 | 1.40 (158) | 17.7 (222) |
| 2007–2009 | 1.09 (77) | 17.4 (97) |
| Total | 1.46 (292) | 18.0 (436) |
| p | 0.000 | 0.60 |
| B: Kenya (pastoralists) | ||
| 1997–2004 | 1.90 (21) | 17.9 (51) |
| 2005–2009 | 0.87 (47) | 18.6 (74) |
| Total | 1.19 (68) | 18.3 (125) |
| p | 0.000 | 0.58 |
| C: Ethiopia (agriculturalists only) | ||
| 1997–2002 | 1.59 (32) | 9.2 (110) |
| 2003–2006 | 0.94 (221) | 9.3 (225) |
| 2007–2009 | 0.56 (76) | 8.8 (77) |
| Total | 0.92 (329) | 9.2 (412) |
| p | 0.000 | 0.12 |
| D: Ethiopia (pastoralists only) | ||
| 1997–2004 | 2.25 (30) | 20.9 (65) |
| 2005–2009 | 2.10 (33) | 16.0 (36) |
| Total | 2.18 (63) | 19.1 (101) |
| p | 0.39 | 0.10 |
| U5MR, deaths/10,000/day | GAM % | |||||
|---|---|---|---|---|---|---|
| Time period | Displaced persons | Local (Resident) | Mixed | Displaced persons | Local (Resident) | Mixed |
| 1997–2002 | 1.77 (15) | 1.95 (18) | 1.84 (34) | 15.6 (52) | 20.9 (52) | 19.5 (50) |
| 2003–2006 | 1.58 (49) | 1.28 (68) | 1.41 (61) | 18.1 (65) | 19.7 (111) | 16.4 (86) |
| 2007–2009 | 1.09 (26) | 0.88 (50) | 1.10 (38) | 15.5 (43) | 18.2 (59) | 16.8 (42) |
| Total | 1.47 (90) | 1.22 (136) | 1.43 (133) | 16.6 (160) | 19.6 (222) | 17.4 (178) |
| p | 0.08 | 0.00 | 0.01 | 0.02 | 0.15 | 0.17 |
| A: Kenya (pastoralists) at cut-off point of 20% GAM a | |||
|---|---|---|---|
| U5MR | |||
| GAM | ≥2.0 | <2.0 | Total |
| ≥20% | 11 | 18 | 29 |
| <20% | 2 | 37 | 39 |
| Total | 13 | 55 | 68 |
| B: Ethiopia (agriculturalists only) at cut-off point of 10% GAM b | |||
|---|---|---|---|
| U5MR | |||
| GAM | ≥2.0 | <2.0 | Total |
| ≥10% | 16 | 99 | 115 |
| <10% | 12 | 202 | 214 |
| Total | 28 | 301 | 329 |


3. Results
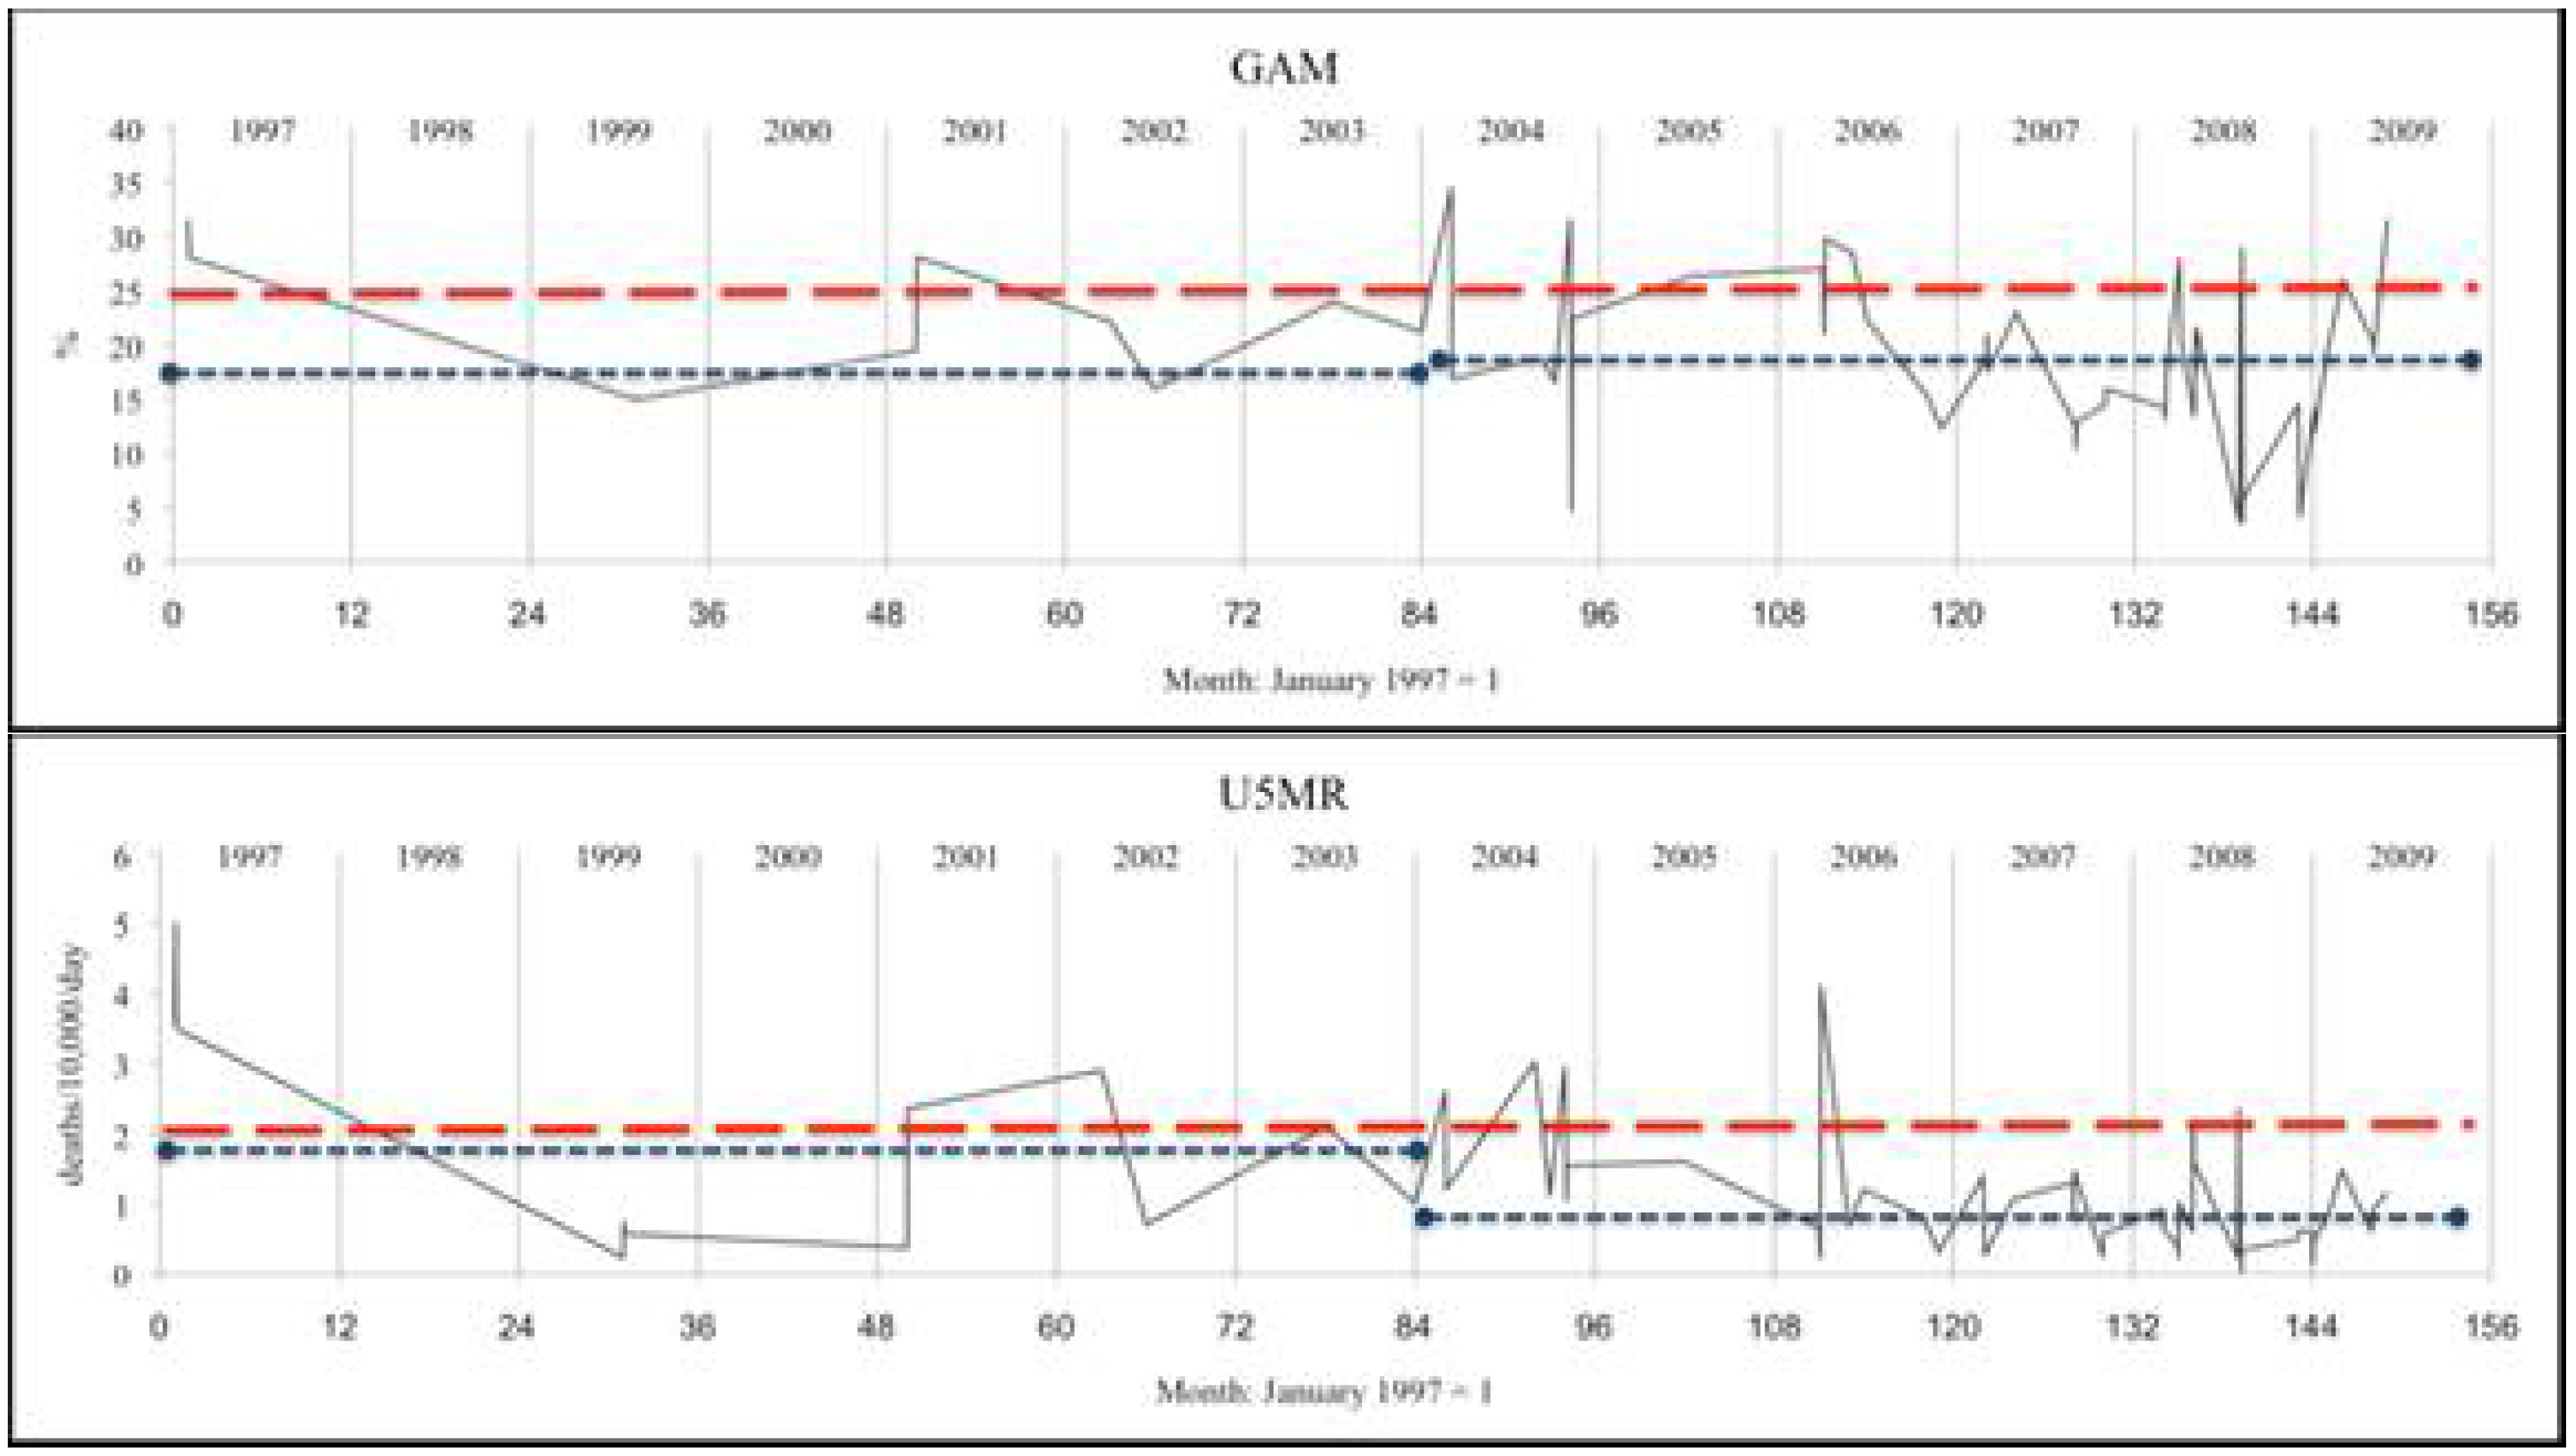
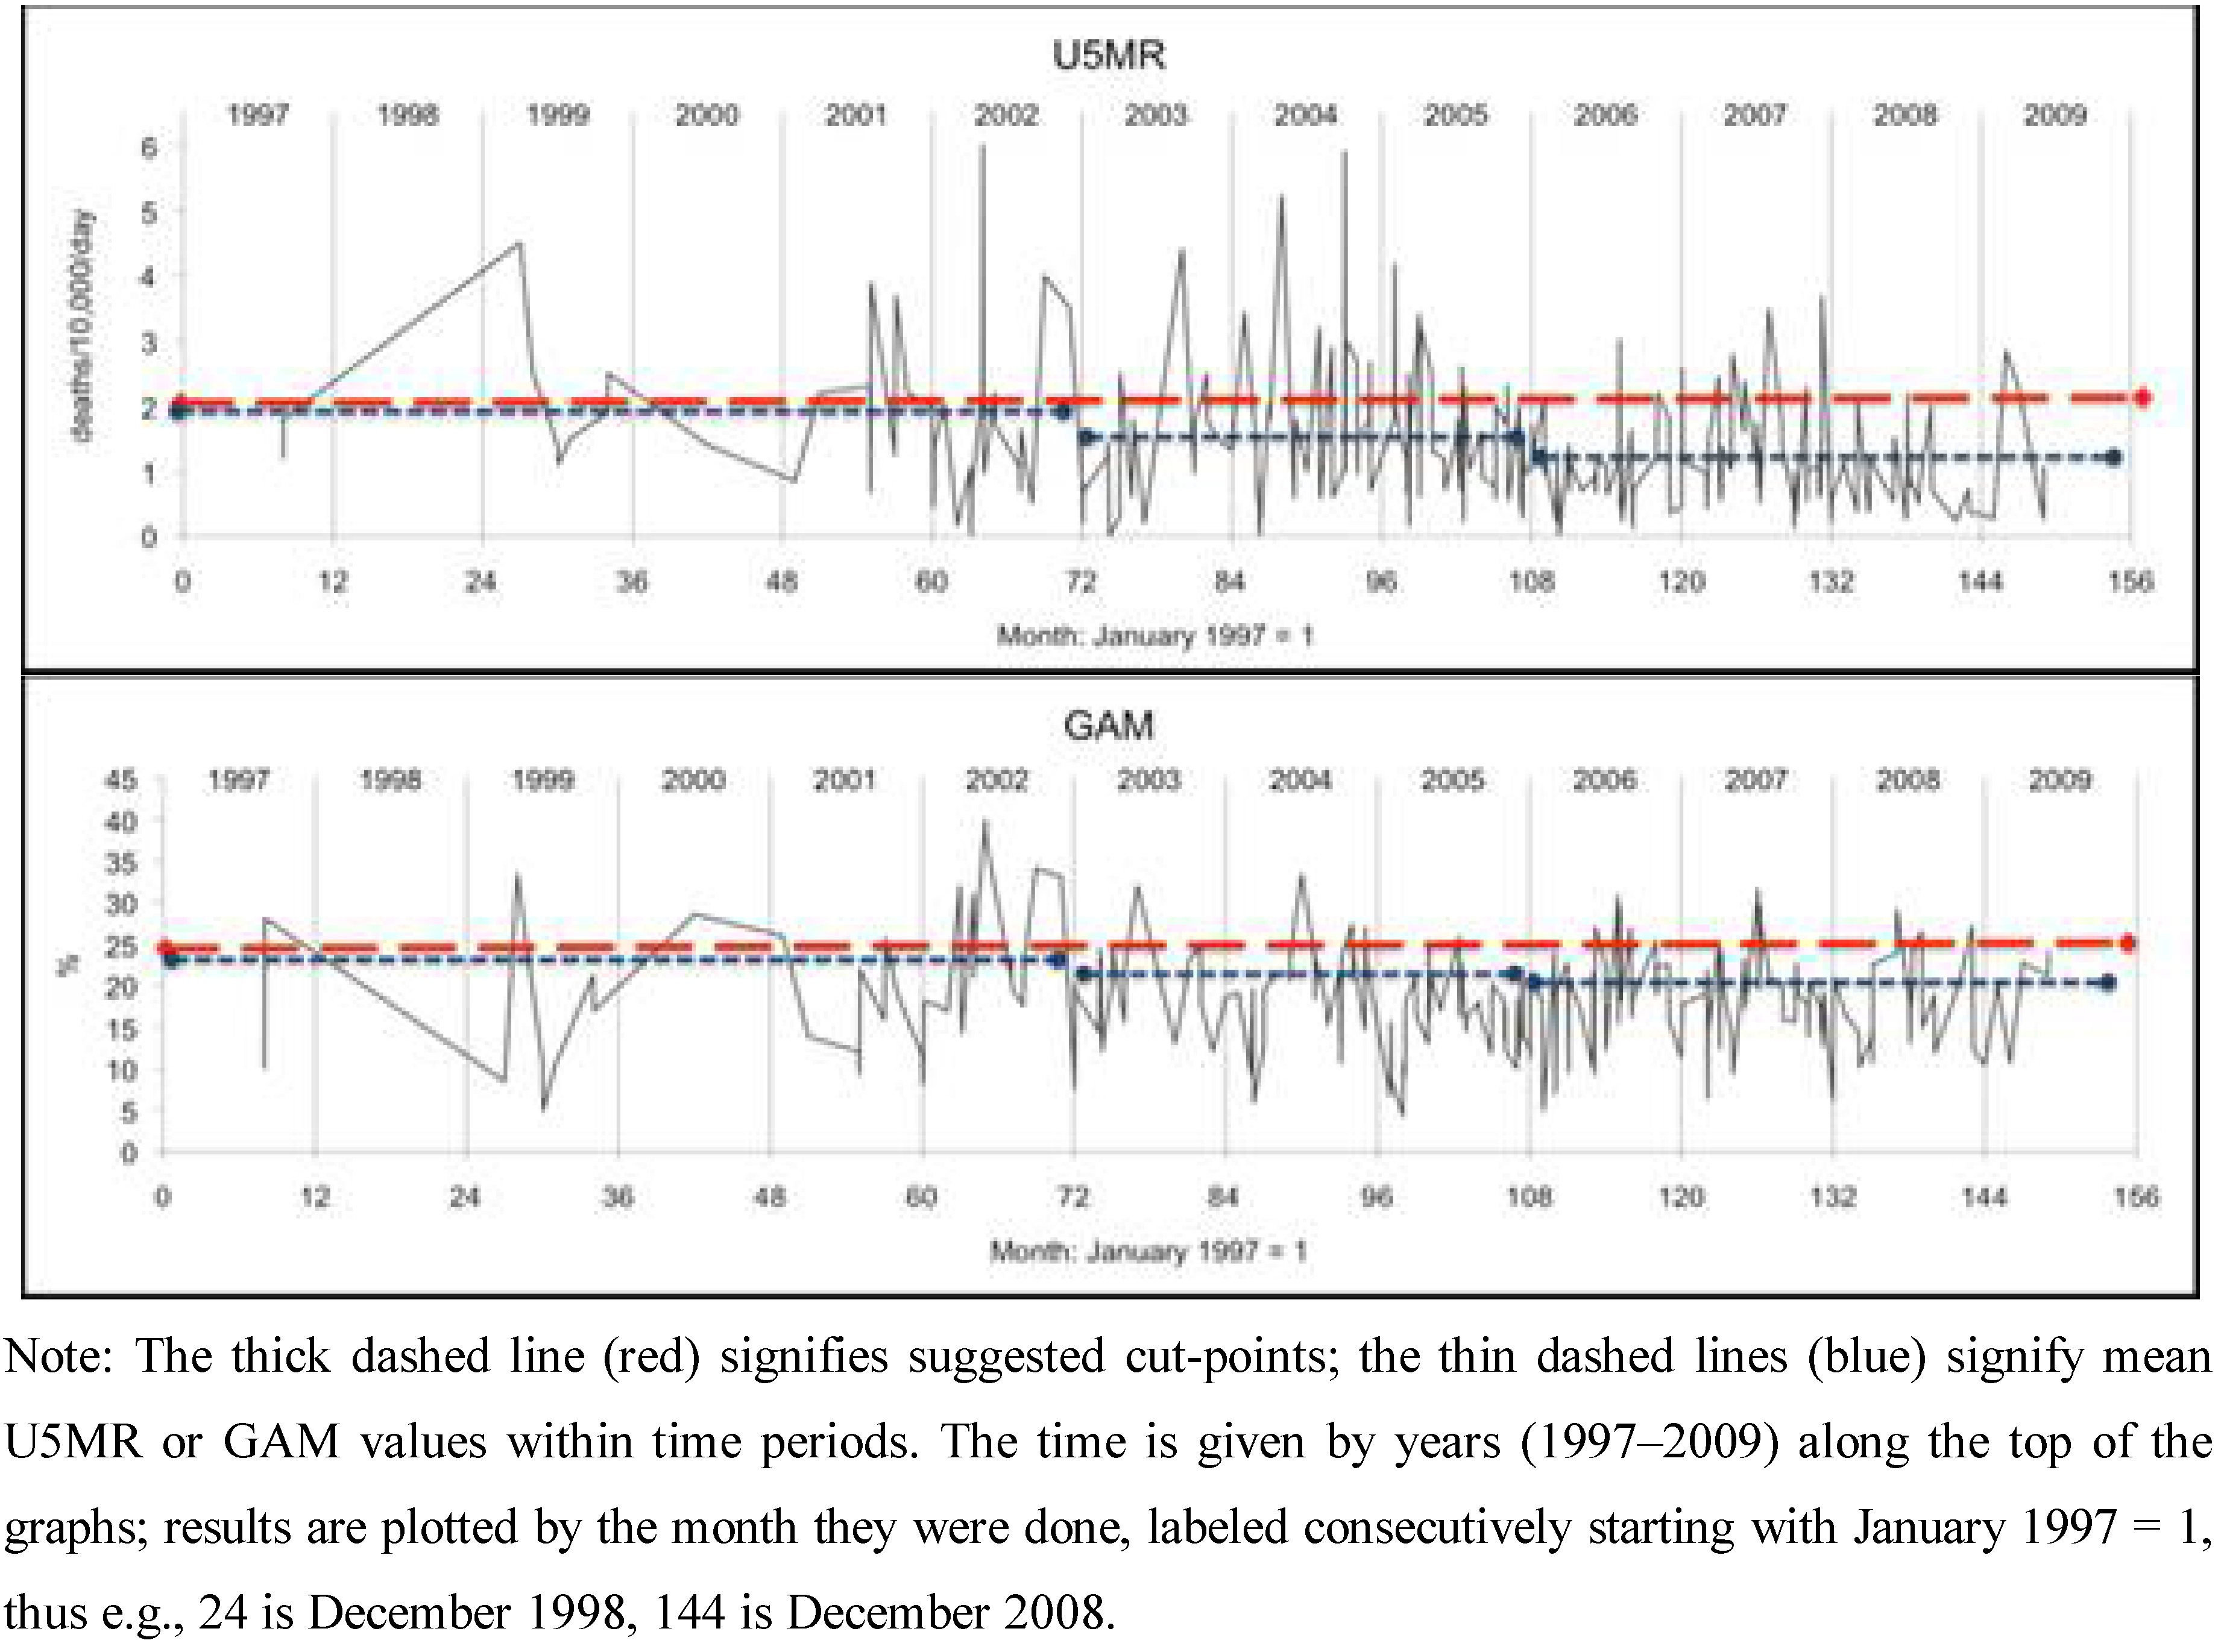
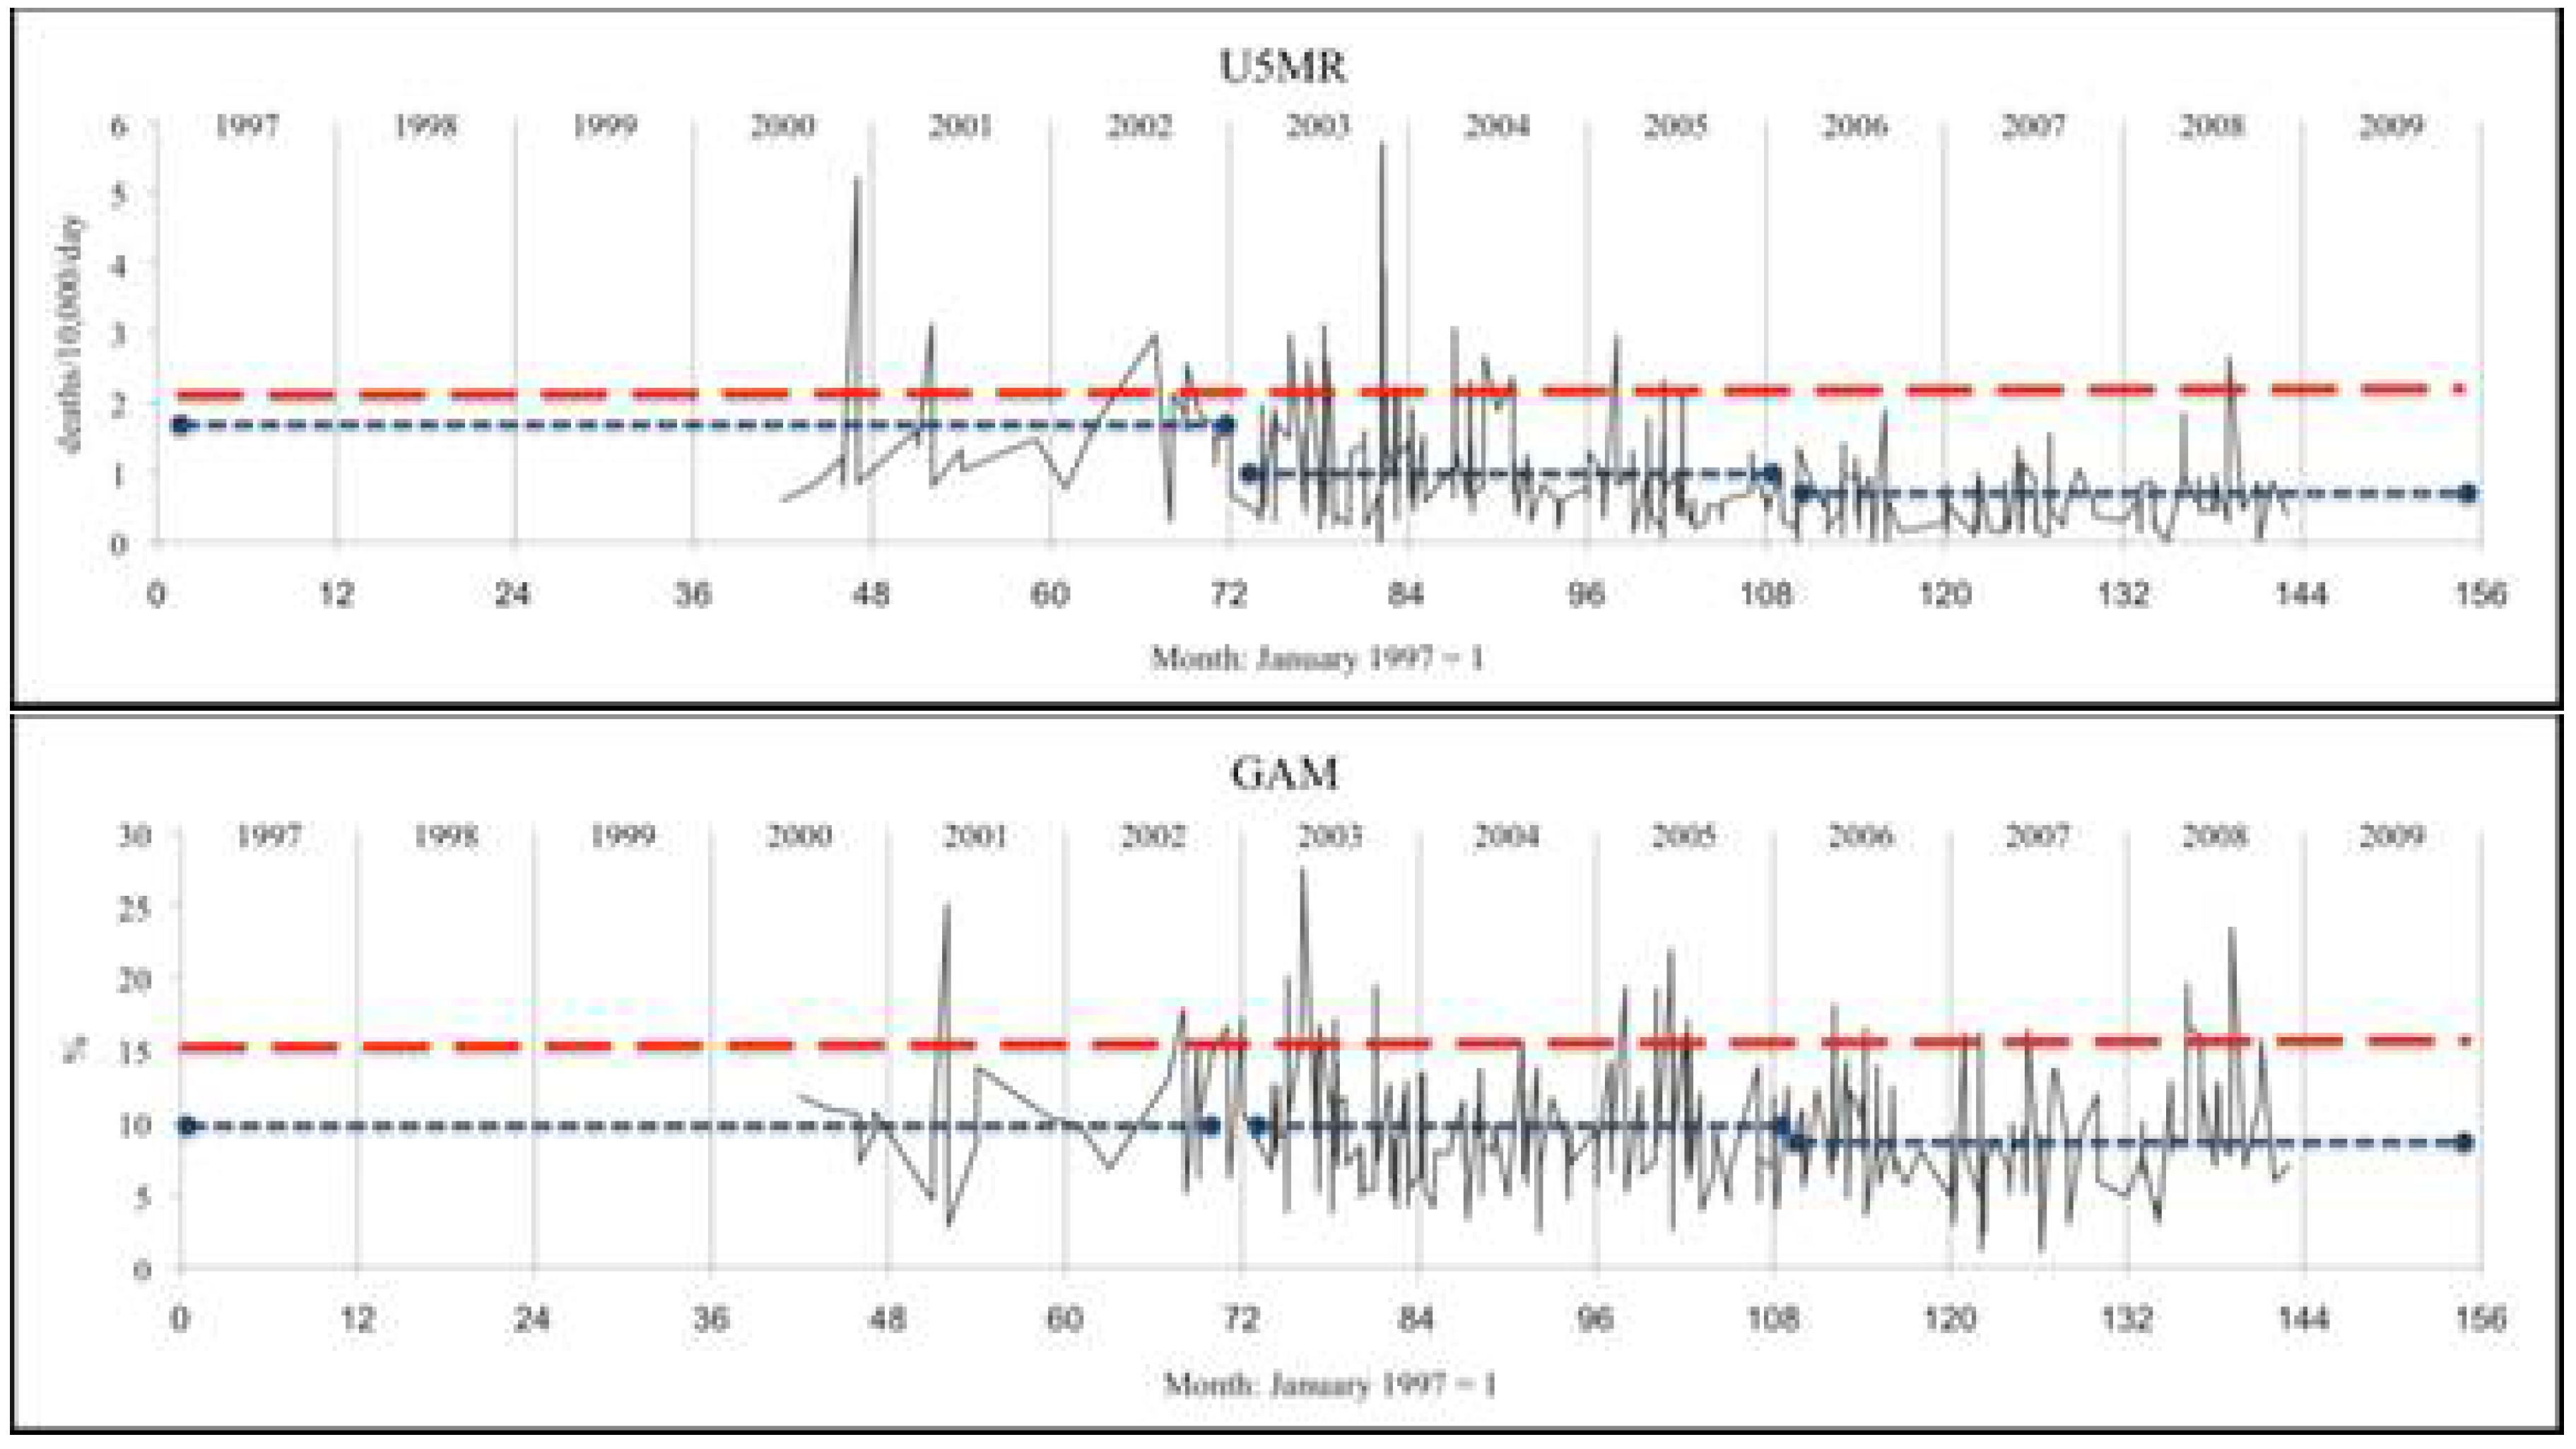
3.1. Trends in GAM and U5MR
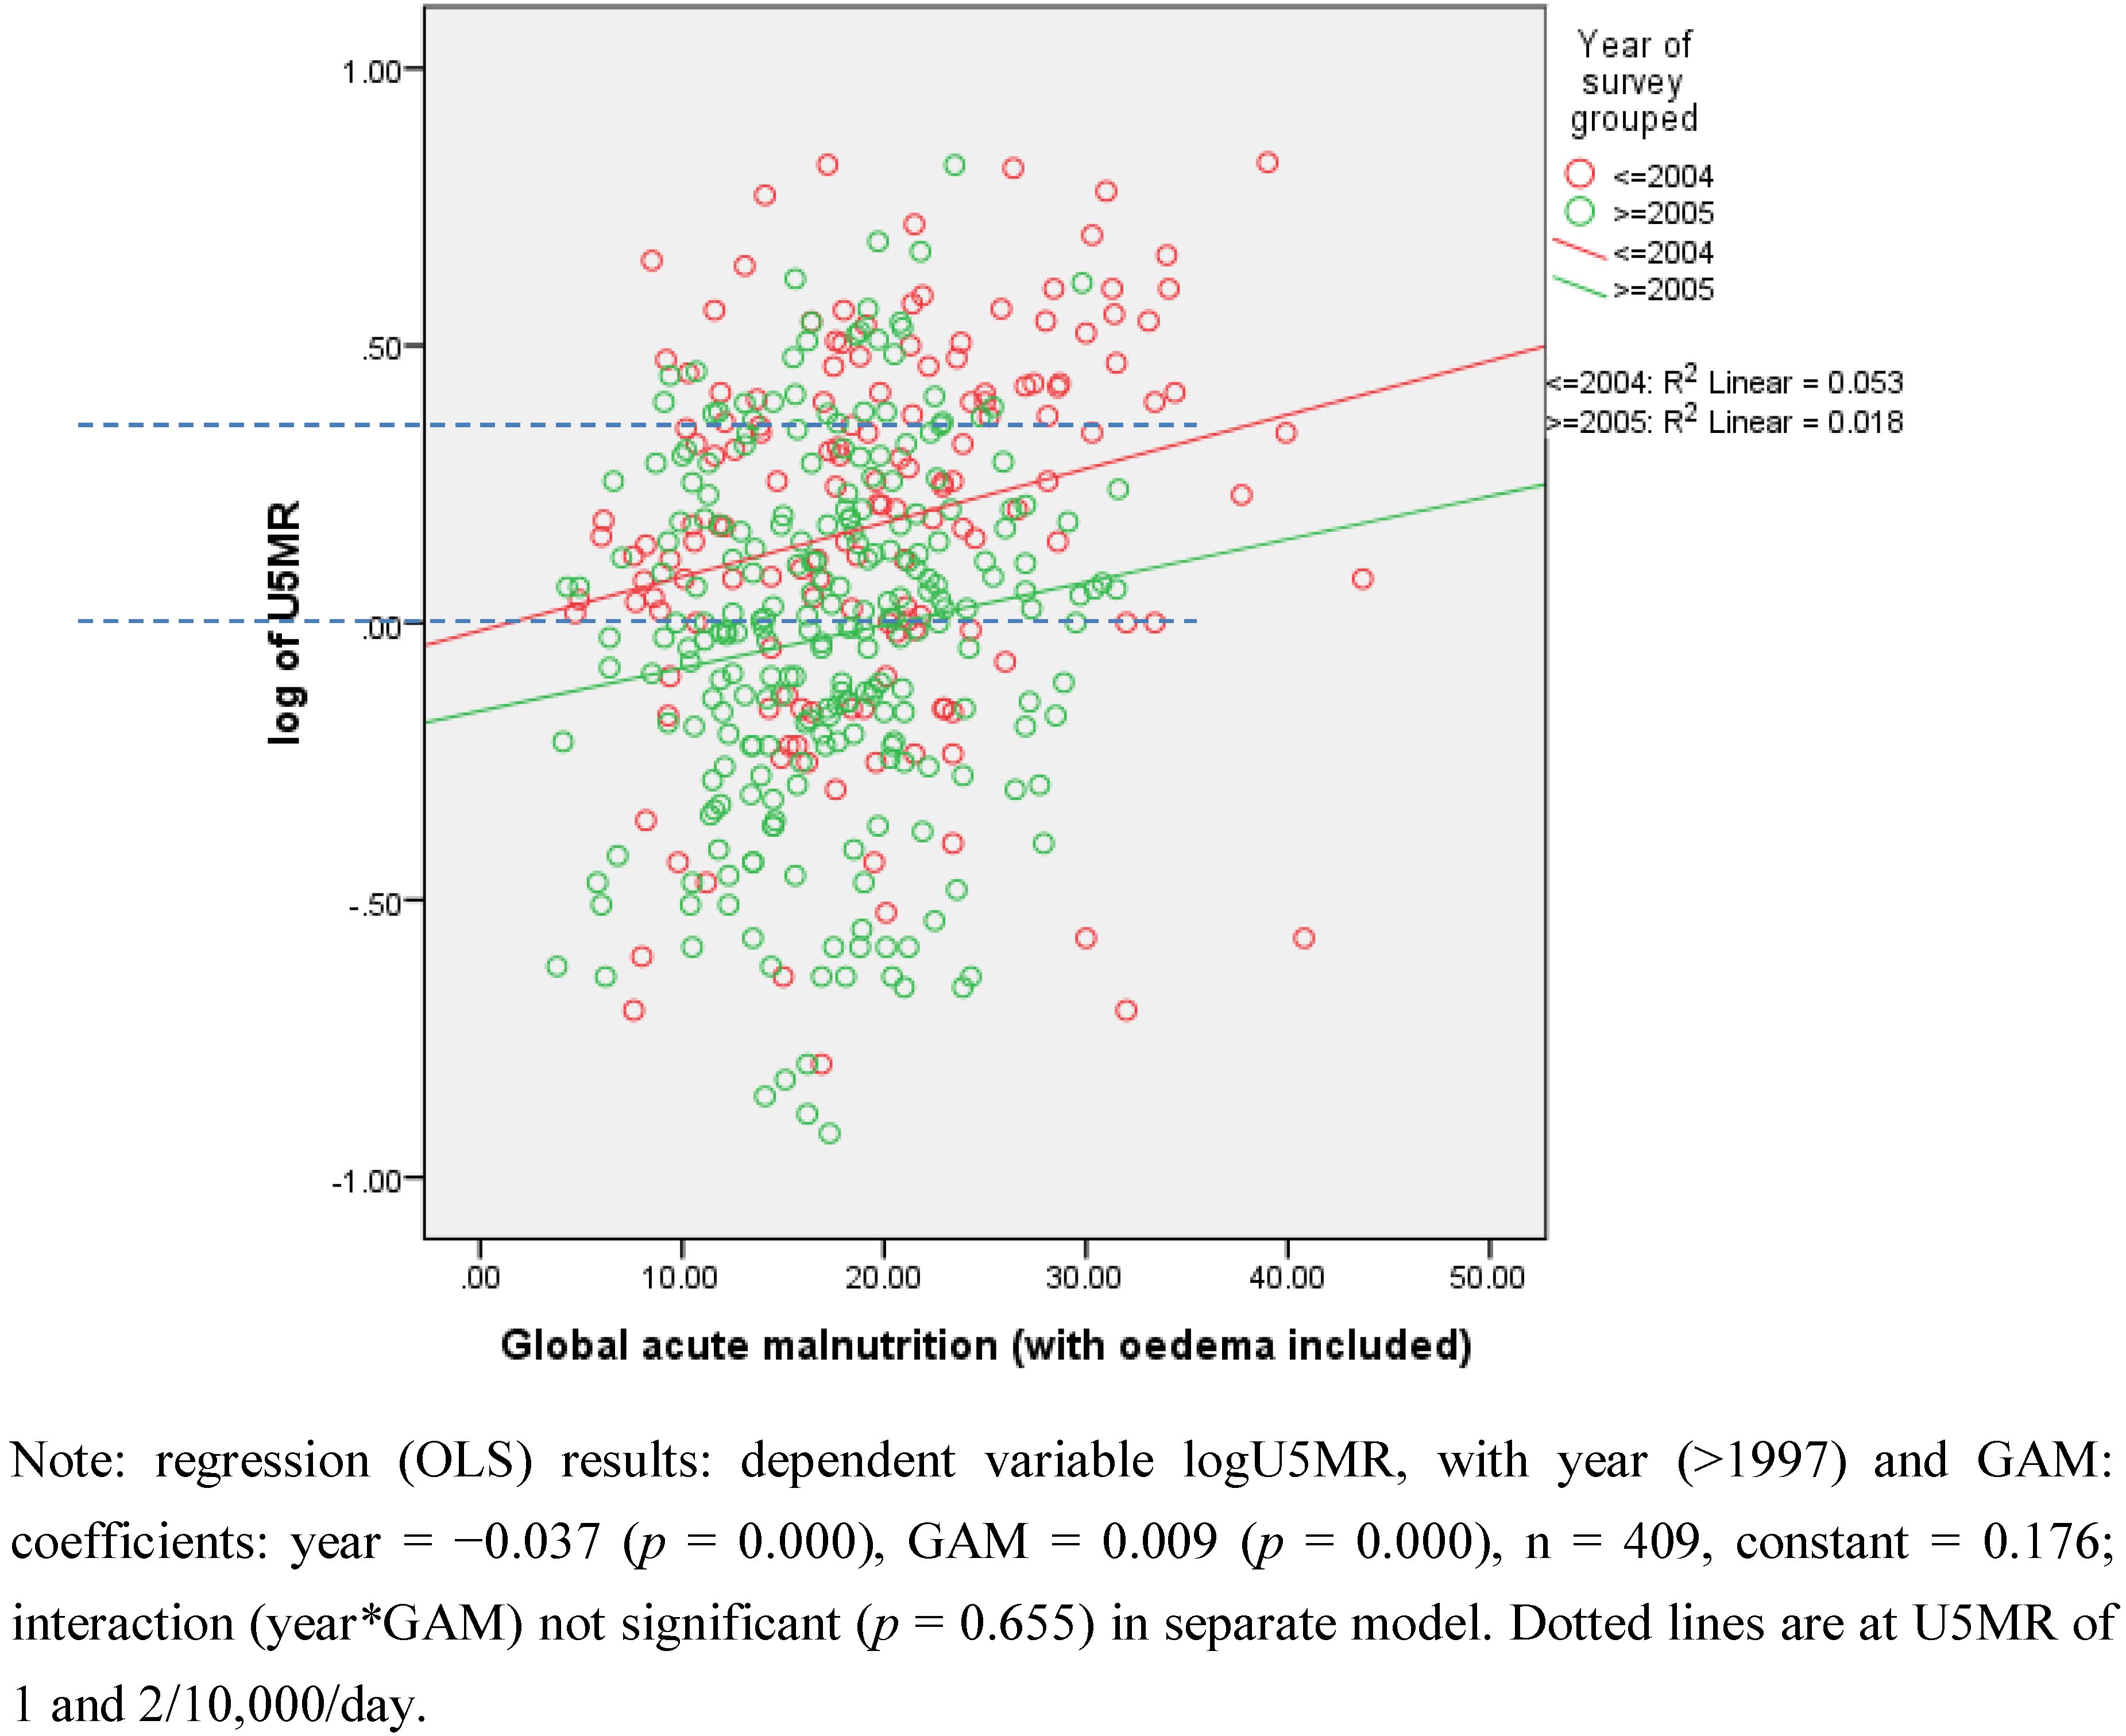

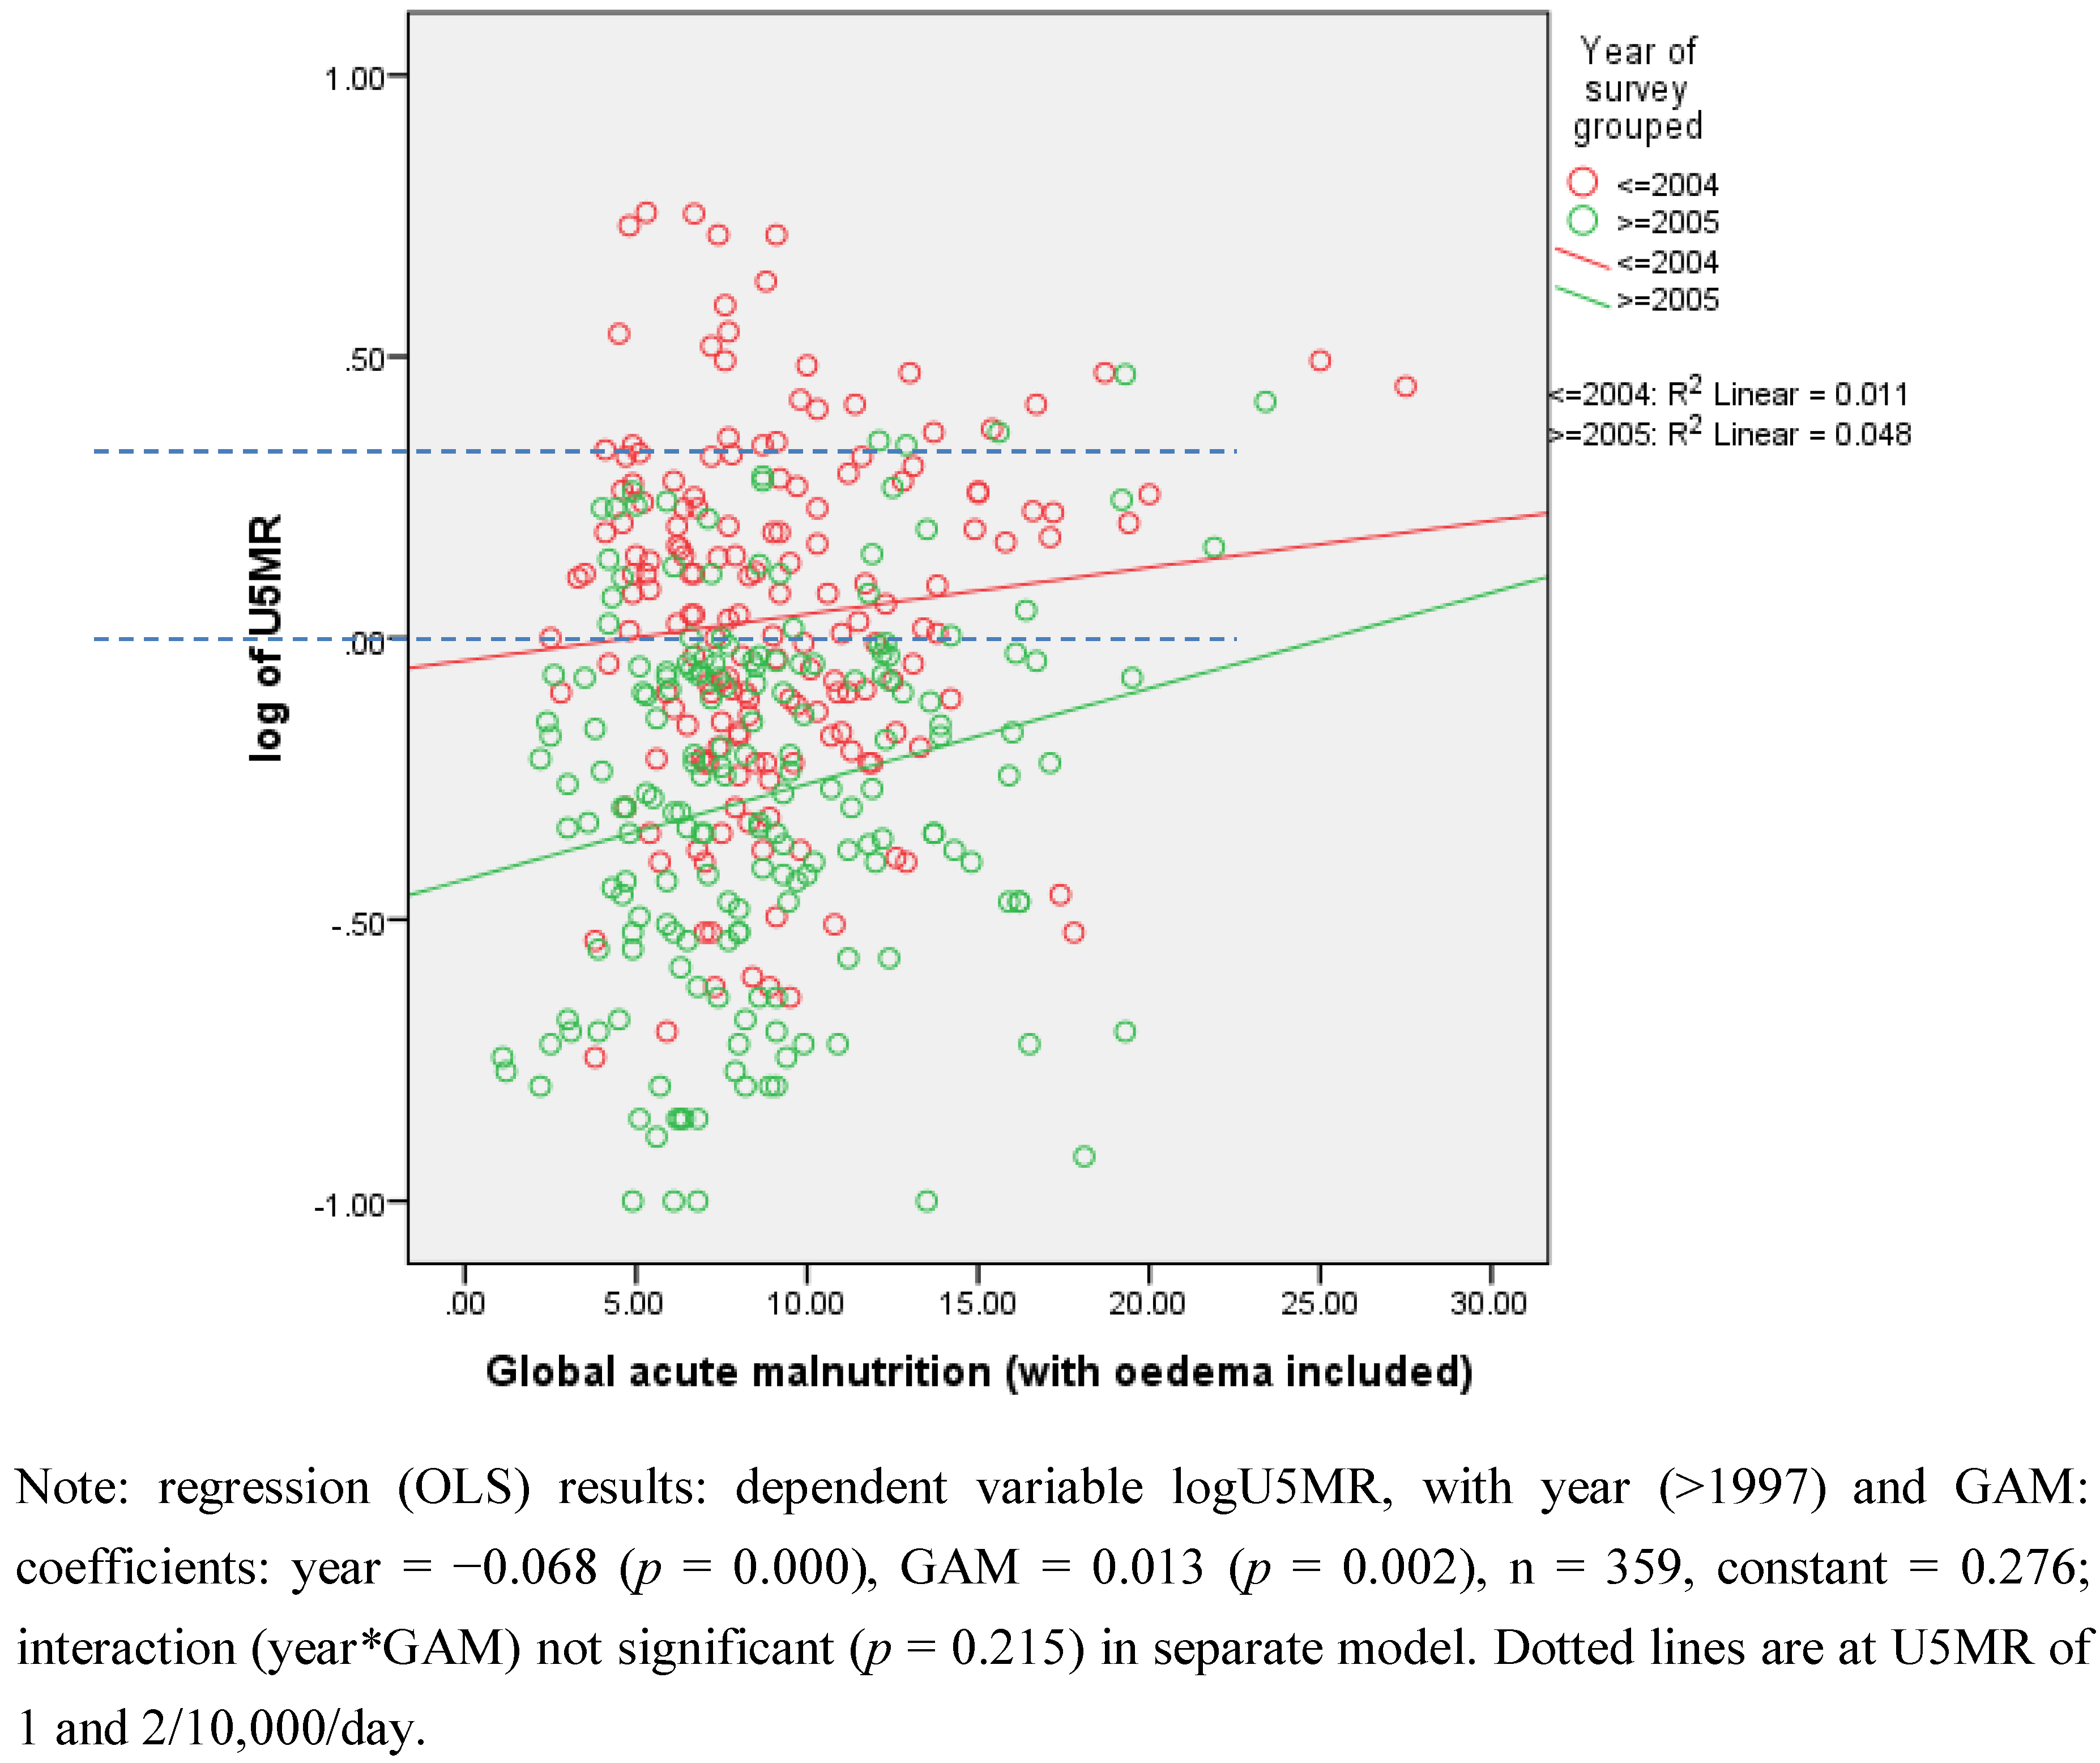
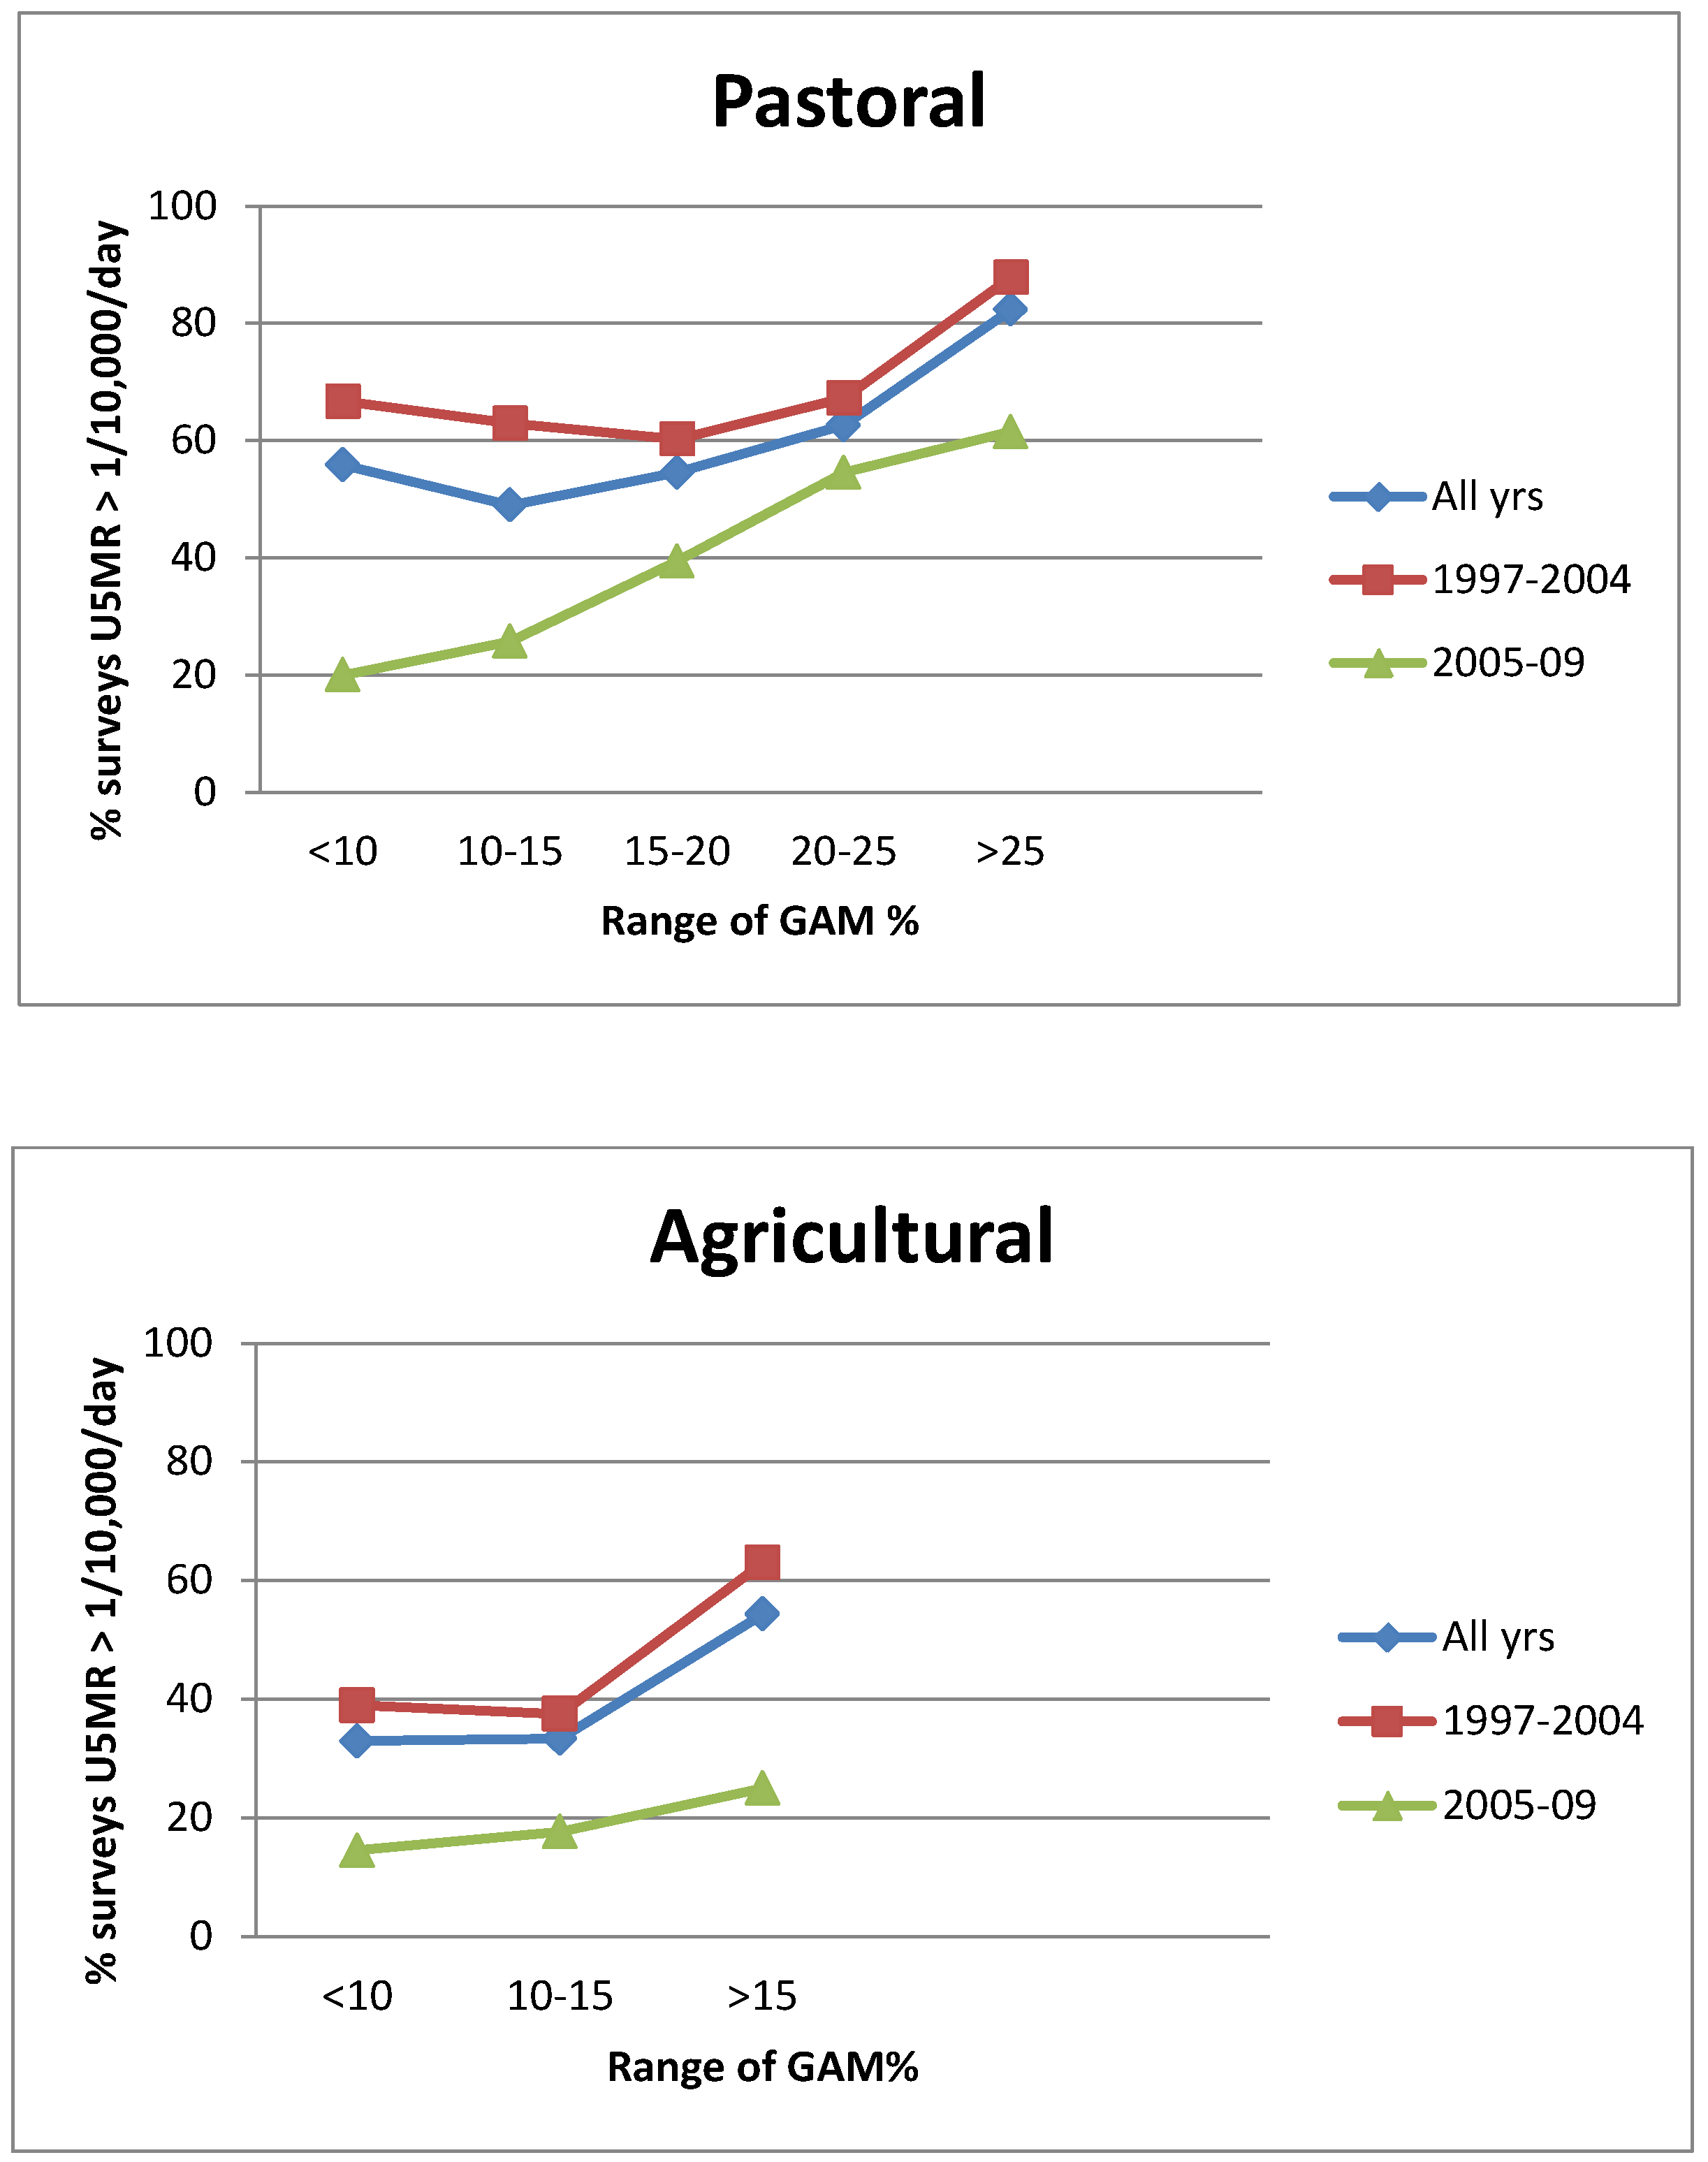
3.2. Relationships of GAM with U5MR
3.3. Agreement between GAM and U5MR
| Group | For U5MR > 1/10,000/day | For U5MR > 2/10,000/day | N | ||
|---|---|---|---|---|---|
| GAM cut point % | (Se+Sp–1) | GAM cut point % | (Se+Sp–1) | ||
| Sudan (pastoralists) | 20% | 0.20 | 25% | 0.19 | 283 |
| Kenya (pastoralists) | 20% | 0.43 | 20% | 0.52 | 68 |
| Ethiopia (agriculturalists) | 10% | 0.15 | 10% | 0.24 | 329 |
| Ethiopia (pastoralists) | 15% | 0.28 | 15% | 0.37 | 62 |
4. Discussion
4.1. GAM Prevalences Need Different Interpretation between Livelihood Groups
4.2. U5MR: A Success Story?
4.3. Limitations
Conflict of Interest
Acknowledgment
References
- IRIN. Horn of Africa: Food Insecurity Grips Region. Available online: http://www.irinnews.org/report.aspx?ReportId=92752 (accessed on 17 February 2012).
- FEWSNET. East Africa Food Security Outlook, October 2011 to March. 2012. Available online: http://www.fews.net/docs/publications/ea_regional_ol_2011_11_final.pdf (accessed on 17 February 2012).
- The United Nationals High Commissioner for Refugees (UNHCR), The Global Report; United Nations Refugee Agency: Geneva, Switzerland, 2005.
- SMART, Measuring Mortality, Nutritional Status, and Food Security in Crisis Situations: SMART Methodology (Version 1); Standardized Monitoring & Assessment of Relief Transitions: Washington, DC, USA, 2006.
- Chotard, S.; Mason, J.B.; Oliphant, N.P.; Mebrahtu, S.; Hailey, P. Fluctuations in wasting in vulnerable child populations in the Greater Horn of Africa. Food Nutr. Bull. 2010, 31, S219–S233. [Google Scholar]
- Mason, J.B.; Chotard, S.; Cercone, E.; Dieterich, M.; Mebrahtu, S.; Hailey, P. Identifying priorities for emergency intervention from child wasting and mortality estimates in vulnerable areas of the Horn of Africa. Food Nutr. Bull. 2010, 31, S234–S247. [Google Scholar]
- World Health Organization (WHO). The Management of Nutrition in Major Emergencies; WHO: Geneva, Switzerland, 2000. Available online: http://www.who.int/nutrition/publications/emergencies/9241545208/en/index.html (accessed on 13 December 2011). ISBN:92-4-154520-8.
- United Nations Standing Committee on Nutrition (UNSCN), Nutrition Information in Crisis Situations (Report Number XXIII); United Nations Standing Committee on Nutrition: Geneva, Switzerland, 2011.
- Center for Disease Control and Prevention (CDC), Famine-Affected, Refugee, and Displaced Populations: Recommendations for Public Health Issues; CDC: Atlanta, GA, USA, 1992.
- The Sphere Project, Humanitarian Charter and Minimum Standards for Disaster Response; The Sphere Project: Geneva, Switzerland, 2011.
- Food and Agriculture Organization of the United Nations, The Food Security and Nutrition Analysis Unit (FAO/FSAU), Integrated Food Security Phase Classification: Technical Manual Version 1; Food and Agriculture Organization, Food Security Analysis Unit: Nairobi, Kenya, 2006.
- United Nations Standing Committee on Nutrition (UNSCN). NICS—Nutrition Information in Crisis Situations: Nutrition Survey Results Database. Available online: http://www.unscn.org/en/publications/nics/database.php (accessed on 13 December 2011).
- Center for Research on the Epidemiology of Disasters (CRED). Available online: http://www.cred.be/ (accessed on 13 December 2011).
- World Health Organization (WHO). Global Database on Child Growth and Malnutrition. Available online: http://www.who.int/nutgrowthdb/publications/algorithms/en/ (accessed on 13 December 2011).
- Szklo, M.; Nieto, F. Epidemiology. Beyond the Basics; Aspen publishers, Inc.: Gaithersburg, MD, USA, 2000; pp. 1–370. [Google Scholar]
- Fluss, R.; Faraggi, D.; Reiser, B. Estimation of the Youden Index and its associated cutoff point. Biom. J. 2005, 47, 458–472. [Google Scholar]
- Salama, P.; Spiegel, P.; Talley, L.; Waldman, R. Lessons learned from complex emergencies over the past decade. Lancet 2004, 364, 1801–1813. [Google Scholar]
- Garfield, R.; Polonsky, J. Changes in mortality rates and humanitarian conditions in Darfur, Sudan 2003–2007. Prehosp. Disaster Med. 2010, 25, 496–502. [Google Scholar]
- Young, H.; Borrel, A.; Holland, D.; Salama, P. Public nutrition in complex emergencies. Lancet 2004, 364, 1899–1909. [Google Scholar]
- Aaby, P.; Gomes, J.; Fernandes, M.; Djana, Q.; Lisse, I.; Jensen, H. Nutritional status and mortality of refugee and resident children in a non-camp setting during conflict: Follow up study in Guinea-Bissau. BMJ 1999, 319, 878–881. [Google Scholar]
- Porignon, D.; Katulanya, I.; Elongo, L.; Ntalemwa, N.; Tonglet, R.; Dramaix, M.; Hennart, P. The unseen face of humanitarian crisis in eastern Democratic Republic of Congo: Was nutritional relief properly targeted? J. Epidemiol. Community Health 2000, 54, 6–9. [Google Scholar] [CrossRef]
- Guerrier, G.; Zounoun, M.; Delarosa, O.; Defourney, I.; Lacharite, M.; Brown, V.; Pedalino, B. Malnutrition and mortality patterns among internally displaced and non-displaced population living in a camp, a village or a town in Eastern Chad. PLoS One 2009, 4. [Google Scholar] [CrossRef]
- Prudhon, C.; Spiegel, P.B. A review of methodology and analysis of nutrition and mortality surveys conducted in humanitarian emergencies from October 1993 to April 2004. Emerg. Themes Epidemiol. 2007. [Google Scholar] [CrossRef]
- Spiegel, P.; Sheik, M.; Gotway-Crawford, C.; Salama, P. Health programmes and policies associated with decreased mortality in displaced persons in postemergency phase camps: A retrospective study. Lancet 2002, 360, 1927–1934. [Google Scholar]
- Mason, J.B. Lessons on nutrition of displaced people. J. Nutr. 2002, 132, S2096–S2103. [Google Scholar]
© 2012 by the authors; licensee MDPI, Basel, Switzerland. This article is an open-access article distributed under the terms and conditions of the Creative Commons Attribution license (http://creativecommons.org/licenses/by/3.0/).
Share and Cite
Mason, J.B.; White, J.M.; Heron, L.; Carter, J.; Wilkinson, C.; Spiegel, P. Child Acute Malnutrition and Mortality in Populations Affected by Displacement in the Horn of Africa, 1997–2009. Int. J. Environ. Res. Public Health 2012, 9, 791-806. https://doi.org/10.3390/ijerph9030791
Mason JB, White JM, Heron L, Carter J, Wilkinson C, Spiegel P. Child Acute Malnutrition and Mortality in Populations Affected by Displacement in the Horn of Africa, 1997–2009. International Journal of Environmental Research and Public Health. 2012; 9(3):791-806. https://doi.org/10.3390/ijerph9030791
Chicago/Turabian StyleMason, John B., Jessica M. White, Linda Heron, Jennifer Carter, Caroline Wilkinson, and Paul Spiegel. 2012. "Child Acute Malnutrition and Mortality in Populations Affected by Displacement in the Horn of Africa, 1997–2009" International Journal of Environmental Research and Public Health 9, no. 3: 791-806. https://doi.org/10.3390/ijerph9030791
APA StyleMason, J. B., White, J. M., Heron, L., Carter, J., Wilkinson, C., & Spiegel, P. (2012). Child Acute Malnutrition and Mortality in Populations Affected by Displacement in the Horn of Africa, 1997–2009. International Journal of Environmental Research and Public Health, 9(3), 791-806. https://doi.org/10.3390/ijerph9030791