Gender Differences in Public and Private Drinking Contexts: A Multi-Level GENACIS Analysis


Abstract
:1. Introduction
2. Methods
2.1. Data Sources
2.2. Measures
2.2.1. Dependent variables
2.2.2. Independent variables
2.3. Analysis
3. Results
3.1. Descriptive Results
3.2. Multi-Level Modeling Results
3.2.1. Public setting results
3.2.2. Private Setting Results
4. Discussion
4.1. Limitations
4.2. Strengths
5. Conclusions
5.1. Implications
Acknowledgments
- Argentina: Myriam Munné, Ph.D., World Health Organization
- Australia: Paul Dietze, Ph.D., National Health and Medical Research Council (Grant 398500)
- Belize: Claudia Cayetano, Ph.D., Pan American Health Organization (PAHO)
- Brazil: Florence Kerr-Corréa, M.D., Ph.D., Foundation for the Support of Sao Paulo State Research (Fundação de Amparo a Pesquisa do Estado de São Paulo, FAPESP) (Grant 01/03150-6)
- Canada: Kathryn Graham, Ph.D., Canadian Institutes of Health Research (CIHR)
- Costa Rica: Julio Bejarano, M. Sc., World Health Organization
- Denmark: Kim Bloomfield, Dr.P.H., Sygekassernes Helsefond; Danish Medical Research Council
- Iceland: Hildigunnur Ólafsdóttir, Ph.D., Alcohol and Drug Abuse Prevention Council, Public Health Institute of Iceland, Reykjavík, Iceland
- India: Vivek Benegal, M.D., World Health Organization
- Isle of Man: Martin Plant, Ph.D., and Moira Plant, Ph.D., Isle of Man Medical Research Council; University of the West of England, Bristol
- Japan: Shinji Shimizu, Ph.D., Japan Society for the Promotion of Science (Grant 13410072)
- Kazakhstan: Bedel Sarbayev, Ph.D., World Health Organization
- New Zealand, Jennie Connor, M.D., Otago University Research Grant
- Nicaragua, Jose Trinidad Caldera, Ph.D., Pan American Health Organization (PAHO)
- Nigeria: Akanidomo Ibanga, Ph.D., World Health Organization
- Norway: Sturla Nordlund, Norwegian Institute for Alcohol and Drug Research
- Spain: Juan Carlos Valderrama, M.D., Dirección General de Atención a la Dependencia, Conselleria de Sanidad, Generalitat Valenciana; Comisionado do Plan de Galicia sobre Drogas, Conselleria de Sanidade, Xunta de Galicia; Dirección General de Drogodependencias y Servicios Sociales, Gobierno de Cantabria
- Sri Lanka: Siri Hettige, Ph.D., World Health Organization
- Sweden: Karin Helmersson Bergmark, Ph.D., Ministry for Social Affairs and Health, Sweden
- Uganda: M. Nazarius Tumwesigye, Ph.D., World Health Organization
- UK: Martin Plant, Ph.D., and Moira Plant, Ph.D., Alcohol Education and Research Council; Amsterdam Group; University of the West of England, Bristol
- USA: Thomas Greenfield, Ph.D., National Institute on Alcohol Abuse and Alcoholism/National Institutes of Health (Grant P50 AA005595)
- Uruguay: Raquel Magri, M.D., World Health Organization.
References and Notes
- Commission on Social Determinants of Health. Closing the Gap in a Generation: Health equity through action on the Social Determinants of Health Final report of the Commission on Social Determinants of Health; World Health Organization: Geneva, Switzerland, 2008; p. 247. [Google Scholar]
- Sen, G; Östlin, P; George, A. Unequal, Unfair, Ineffective and Inefficient Gender Inequity in Health: Why It Exists and How We Can Change It Final report to the WHO Commision on Social Determinants of Health; Women and Gender Equity Knowledge Network, World Health Organization: Geneva, Switzerland, 2007; p. 127. [Google Scholar]
- Scott-Samuel, A. Patriarchy, masculinities, and health inequalities. Gaceta Sanitaria 2009, 23, 159–160. [Google Scholar]
- Nathanson, CA. Mortality and the position of women in developed countries. In Adult Mortality in Developed Countries: From Description to Explanation; Lopez, AD, Caselli, G, Valkonen, T, Eds.; Clarendon Press: Oxford, UK, 1995; pp. 135–157. [Google Scholar]
- Backhans, MC; Lundberg, M; Månsdotter, A. Does increased gender equality lead to a convergence of health outcomes for men and women? A study of Swedish municipalities. Soc Sci Med 2007, 64, 1892–1903. [Google Scholar]
- Chen, Y-Y; Subramanian, SV; Acevedo-Garcia, D; Kawachi, I. Women’s status and depressive symptoms: a multilevel analysis. Soc Sci Med 2005, 60, 49–60. [Google Scholar]
- Kawachi, I; Kennedy, BP; Gupta, V; Prothrow-Stith, D. Women’s status and the health of women and men: a view from the States. Soc Sci Med 1999, 48, 21–32. [Google Scholar]
- Koenig, MA; Stephenson, R; Ahmed, S; Jejeebhoy, SJ; Campbell, J. Individual and contextual determinants of domestic violence in North India. Am J Public Health 2006, 96, 132–138. [Google Scholar]
- Pallitto, CC; O’Campo, P. Community level effects of gender inequality on intimate partner violence and unintended pregnancy in Columbia: testing the feminist perspective. Soc Sci Med 2005, 60, 2205–2216. [Google Scholar]
- Schaap, MM; Kunst, AE; Leinsalu, M; Regidor, E; Espelt, A; Ekholm, O; Helmert, U; Klumbiene, J; Mackenbach, JP. Female ever-smoking, education, emancipation and economic development in 19 European countries. Soc Sci Med 2009, 68, 1271–1278. [Google Scholar]
- Bergdahl, J. An application of convergence theory to women’s drinking and driving. Women Criminal Justice 2000, 10, 93–107. [Google Scholar]
- Keyes, KM; Grant, BF; Hasin, DS. Evidence for a closing gender gap in alcohol use, abuse, and dependence in the United States population. Drug Alcohol Depend 2008, 93, 21–29. [Google Scholar]
- McPherson, M; Casswell, S; Pledger, M. Gender convergence in alcohol consumption and related problems: issues and outcomes from comparisons of New Zealand survey data. Addiction 2004, 99, 738–748. [Google Scholar]
- Grucza, RA; Bucholz, KK; Rice, JP; Bierut, LJ. Secular trends in the lifetime prevalence of alcohol dependence in the United States: a re-evaluation. Alcohol Clin Exp Res 2008, 32, 763–770. [Google Scholar]
- Rahav, G; Wilsnack, RW; Bloomfield, K; Gmel, G; Kuntsche, S. The influence of societal level factors on men’s and women’s alcohol consumption and alcohol problems. Alcohol Alcohol 2006, 41, i47–i55. [Google Scholar]
- Morris, A. Gender bender: More women are drinking, and the women who drink are drinking more, in some cases matching their male peers. Available online: http://nymag.com/news/features/52758/(accessed on February 24, 2010).
- Riddoch, L. We’re paying the price of the 70s and 80s deprivation. The Scotsman.
- Clark-Flory, T. I’m sooo wasted off feminism. Saloncom. 2008. Available online: http://mobile.salon.com/mwt/broadsheet/feature/2008/12/09/gender_benders/index.html (accessed on February 24, 2010).
- Demers, A; Kairouz, S; Adlaf, EM; Gliksman, L; Newton-Taylor, B; Marchand, A. Multilevel analysis of situational drinking among Canadian undergraduates. Soc Sci Med 2002, 55, 415–424. [Google Scholar]
- Harford, TC. Contextual drinking patterns among men and women. In Currents in Alcoholism: Psychiatric, Psychological, Social, and Epidemiological Studies; Seixas, FA, Ed.; Grune and Stratton: New York, NY, USA, 1978; Volume IV, pp. 287–296. [Google Scholar]
- Kairouz, S; Greenfield, TK. A comparative multilevel analysis of contextual drinking in American and Canadian adults. Addiction 2007, 102, 71–80. [Google Scholar]
- Nyaronga, D; Greenfield, TK; McDaniel, PA. Drinking context and drinking problems among black, white and Hispanic men and women in the 1984, 1995 and 2005 U.S. National Alcohol Surveys. J Stud Alcohol Drugs 2009, 70, 16–26. [Google Scholar]
- Wells, S; Graham, K; Speechley, M; Koval, J. Drinking patterns, drinking contexts and alcohol-related aggression among late adolescent and young adult drinkers. Addiction 2005, 100, 933–945. [Google Scholar]
- Clark, WB. Public drinking contexts: bars and taverns. In Social Drinking Contexts [Research Monograph No 7, DHHS Pubication No (ADM 81-1097)]; Harford, TC, Gaines, LS, Eds.; National Institute on Alcohol Abuse and Alcoholism, National Institutes of Health: Rockville, MD, USA, 1981; pp. 8–33. [Google Scholar]
- Clark, WB. Introduction to drinking contexts. In Alcohol in America; Clark, WB, Hilton, ME, Eds.; State University of New York Press: Albany, NY, USA, 1991; pp. 249–255. [Google Scholar]
- Nusbaumer, MR; Mauss, AL; Pearson, DC. Draughts and drunks: the contributions of taverns and bars to excessive drinking in America. Deviant Behavior 1982, 3, 329–358. [Google Scholar]
- Brown, SA. Context of drinking and reinforcement from alcohol: alcoholic patterns. Addict Behav 1985, 10, 191–195. [Google Scholar]
- Graham, K; Wells, S. Aggression among young adults in the social context of the bar. Addict Res 2001, 9, 193–219. [Google Scholar]
- Wells, S; Graham, K. Frequency of third-party involvement in incidents of barroom aggression. Contemp Drug Prob 1999, 26, 457–480. [Google Scholar]
- Stall, R; Heurtin-Roberts, S; McKusick, L; Hunt, C; Lang, SW. Sexual risk for HIV transmission among singles-bar patrons in San Francisco. Med Anthropol Q 1990, 4, 115–128. [Google Scholar]
- Trocki, KF; Michalak, L; McDaniel, PA. Etude exploratoire de l’usage des drogues dans les bars. Psychotropes 2004, 3–4, 203–211. [Google Scholar]
- Perrine, MW; Mundt, JC; Searles, JS; Walter, D. I only had a couple of beers: Validation of drivers’ self-reported drinking in bars. In Proceedings of the 10th International Conference on Alcohol, Drugs, and Traffic Safety, Annecy, France, September 21–26, 1997; pp. 769–776.
- Morojele, NK; Kachieng’a, MA; Mokoko, E; Nkoko, MA; Parry, CDH; Nkowane, AM; Moshia, KM; Saxena, S. Alcohol use and sexual behaviour among risky drinkers and bar and shebeen patrons in Gauteng province, South Africa. Soc Sci Med 2006, 62, 217–227. [Google Scholar]
- Diez Roux, AV. A glossary for multilevel analysis. J Epidemiol Community Health 2002, 56, 588–594. [Google Scholar]
- Eriksen, S. Alcohol as a gender symbol. Scandinavian J History 1999, 24, 45–73. [Google Scholar]
- Lyons, AC; Willott, SA. Alcohol consumption, gender identities, and women’s changing social positions. Sex Roles 2008, 59, 694–712. [Google Scholar]
- Room, R. Gender roles and interactions in drinking and drug use. J Subst Abuse 1996, 8, 227–239. [Google Scholar]
- Wojcicki, JM. “She drank his money”: survival sex and the problem of violence in taverns in Gaunteng province, South Africa. Med Anthropol Q 2002, 16, 267–293. [Google Scholar]
- Wolff, B; Busza, J; Bufumbo, L; Whitworth, J. Women who fall by the roadside: gender, sexual risk and alcohol in rural Uganda. Addiction 2006, 101, 1277–1284. [Google Scholar]
- Parks, KA; Scheidt, DM. Male bar drinkers’ perspective on female bar drinkers. Sex Roles 2000, 43, 927–941. [Google Scholar]
- Campbell, H. The glass phallus: pub(lic) masculinity and drinking in rural New Zealand. Rural Sociology 2000, 65, 562–581. [Google Scholar]
- Suggs, DN. Mosadi Tshwene: the construction of gender and the consumption of alcohol in Botswana. Amer Ethnologist 1996, 23, 597–610. [Google Scholar]
- Suggs, DN. These young chaps think they are just men, “too”: redistributing masculinity in Kgatleng bars. Soc Sci Med 2001, 53, 241–250. [Google Scholar]
- Roberts, SCM. [abstract] What Can Alcohol Researchers Learn from Research about the Relationship Between Macro-Level Gender Equality and Violence Against Women? In Kettil Bruun Society Alcohol and Violence Thematic Meeting; AER Alcohol Policy Research Centre at Turning Point Alcohol and Drug Centre: Fitzroy, Australia, March 15–18 2010. [Google Scholar]
- Walsh, DC; Sorenson, G; Leonard, L. Gender, health, and cigarette smoking. In Society and Health; Amick, BC, Levine, S, III, Tarlov, AR, Walsh, DC, Eds.; Oxford University Press: New York, NY, USA, 1995; pp. 131–171. [Google Scholar]
- Månsdotter, A; Backhans, M; Hallqvist, J. The relationship between a less gender-stereotypical parenthood and alcohol-related care and death: a registry of Swedish mothers and fathers. BMC Public Health 2008, 8, 312–324. [Google Scholar]
- Murphy, SA; Connelly, CD; Evens, C; Stoep, AV. Roles, lifestyles, and well-being as predictors of alcohol consumption among young and midlife women. Health Care Women Intern 2000, 21, 677–699. [Google Scholar]
- Kuntsche, S; Knibbe, RA; Gmel, G. Social roles and alcohol consumption: a study of 10 industrialised countries. Soc Sci Med 2009, 68, 1263–1270. [Google Scholar]
- Brownmiller, S. Against Our Will: Men, Women, and Rape; Bantam Books: New York, NY, USA, 1975; p. 541. [Google Scholar]
- Wilsnack, SC; Wilsnack, RW. International gender and alcohol research: recent findings and future directions. Alcohol Res Health 2002, 26, 245–250. [Google Scholar]
- Wilsnack, RW; Wilsnack, SC; Kristjanson, AF; Vogeltanz-Holm, ND; Gmel, G. Gender and alcohol consumption: patterns from the multinational GENACIS project. Addiction 2009, 104, 1487–1500. [Google Scholar]
- United Nations Development Programme (UNDP). Human Development Report 2007/2008. Fighting Climate Change: Human Solidarity in a Divided World. Palgrave Macmillan: New York, NY, USA, 2007; p. 384. Available online: http://hdr.undp.org/en/media/HDR_20072008_EN_Complete.pdf (accessed on December 9, 2009).
- Human Development Reports Gender Empowerment Measure; United Nations Development Programme (UNDP): New York, NY, USA, 2009.
- Hausmann, R; Tyson, LD; Zahidi, S. The Global Gender Gap Report 2007; World Economic Forum: Geneva, Switzerland, 2007; p. 162. [Google Scholar]
- Torsheim, T; Ravens-Sieberer, U; Hetland, J; Välimaa, R; Danielson, M; Overpeck, M. Cross-national variation of gender differences in adolescent subjective health in eurpoe and North America. Soc Sci Med 2006, 62, 815–827. [Google Scholar]
- Center for Reproductive Rights. The World’s Abortion Laws; Center for Reproductive Rights: New York, NY, USA, 2008; p. 2. [Google Scholar]
- United Nations Statistics Division. Statistics and Indicators on Women and Men; United Nations: New York, NY, USA, 2009. [Google Scholar]
- World Health Organization. Health-Related Millenium Development Goals. In World Health Statistics 2009; World Health Organization: Geneva, Switzerland, 2009. [Google Scholar]
- García-Moreno, C; Jansen, HAFM; Ellsberg, M; Heise, L; Watts, C. WHO Multi-country Study on Women’s Health and Domestic Violence Against Women; World Health Organization: Geneva, Switzerland, 2005; p. 206. [Google Scholar]
- Uganda Bureau of Statistics (UBOS); Macro International Inc. Uganda Demographic and Health Survey 2006; UBOS and Macro International Inc.: Calverton, MD, USA, 2007; p. 467. [Google Scholar]
- Krug, EG; Dahlberg, LL; Mercy, JA; Zwi, AB; Lozano, R. World Report on Violence and Health; World Health Organization: Geneva, Switzerland, 2002; p. 372. [Google Scholar]
- Johnson, H; Ollus, N; Nevala, S. Violence against Women: An International Perspective; Springer: New York, NY, USA, 2007; p. 290. [Google Scholar]
- Bhat, PNM; Arnold, F; Gupta, K; Kishor, S; Parasuraman, S; Arokiasamy, P; Singh, SK; Lhungdim, H. National Family Health Survey (NFHS-3), 2005–06: India: Volume I; International Institute for Population Sciences (IIPS) and Macro International: Mumbai, India and Calverton, MD, USA, 2007; p. 540. [Google Scholar]
- Fanslow, J; Robinson, E. Violence against women in New Zealand: prevalence and health consequences. J N Z Med Assoc 2004, 117, U1173. [Google Scholar]
- In-depth Study on all Forms of Violence against Women: Report of the Secretary-General; United Nations: New York, NY, USA, 2006; p. 139.
- Dijk, JV; Kesteren, JV; Smit, P. Criminal Victimisation in International Perspective: Key findings from the 2004–2005 ICVS and EU ICS.
- United Nations Office on Drugs and Crime (UNODC). International Homicide Statistics (IHS); United Nations Office on Drugs and Crime (UNODC): Vienna, Austria, 2004; p. 10. [Google Scholar]
- Pan American Health Organization (PAHO). Regional Core Health Data Initiative. Table Generator System; Pan American Health Organization (PAHO): Washington, DC, USA, 2009. [Google Scholar]
- Eurostat. Death due to Homicide, Assault, by Gender; Eurostat: Luxembourg, 2009. [Google Scholar]
- World Values Survey. 2005/2008; Survey. Online Data Analysis (step 4): Question data. Justifiable: For a man to beat his wife. World Values Survey: Stockholm, Sweden,2009.
- National Population Commission (NPC) (Nigeria); Macro International. Nigeria Demographic and Health Survey 2003; National Population Commission (NPC) and Macro International: Calverton, MD, USA, 2004; p. 333. [Google Scholar]
- Instituto Nacional de Estadísticas y Censos (INEC); Ministerio de Salud (MINSA); Macro International. Encuesta Nicaragüense de Demografía y Salud 2001; Instituto Nacional de Estadísticas y Censos (INEC), Ministerio de Salud (MINSA) and Macro International: Calverton, MD, USA, 2002; p. 40. [Google Scholar]
- World Economic Forum. The Global Gender Gap Report 2008: Country Highlights and Profiles; World Economic Forum: Geneva, Switzerland, 2008. [Google Scholar]
- The UN Secretary-General's Database on Violence against Women; The Division for the Advancement of Women/Department of Economic and Social Affairs (DAW/DESA) and the United Nations: New York, NY, USA, 2009.
- Schafer, JL. NORM Multple Imputation of Multivariate Continuous Data under a Normal Model Version 203; Pennsylvania State University: Philadelphia, PA, USA, 1999. [Google Scholar]
- Bryk, AS; Raudenbush, SW. Hierarchical Linear Models: Applications and Data Analysis Methods; SAGE Publications: Newbury Park, CA, USA, 1992. [Google Scholar]
- Raudenbush, SW; Bryk, AS; Congdon, RT, Jr. HLM 606: Hierarchical Linear and NonLinear Modeling; Scientific Software International: Lincolnwood, IL, USA, 2009. [Google Scholar]
- Wilsnack, RW; Vogeltanz, ND; Wilsnack, SC; Harris, R; IRGGA. Gender differences in alcohol consumption and adverse drinking consequences: cross-cultural patterns. Addiction 2000, 95, 251–265. [Google Scholar]
- Parks, KA; Zetes-Zanatta, LM. Women’s bar-related victimization: refining and testing a conceptual model. Aggressive Behavior 1999, 25, 349–364. [Google Scholar]
- Miller, P; Plant, M; Plant, M. Spreading out or concentrating weekly consumption: alcohol problems and other consequences within a UK population sample. Alcohol Alcohol 2005, 40, 461–468. [Google Scholar]


| Country | Survey Year | Women (n) | Men (n) | Sampling Frame | Survey Mode |
|---|---|---|---|---|---|
| Argentina | 2003 | 598 | 401 | Regional: ≈95% of population (Buenos Aires City & Province) | Face-to-face |
| Australia | 2007 | 1,221 | 831 | Regional (Victoria) | Telephone |
| Belize | 2005 | 1,913 | 1,721 | National | Face-to-face |
| Brazil | 2001/2002 | 387 | 273 | Regional: (Botucatu, Sao Paulo State) | Face-to-face |
| Canada | 2004 | 6,904 | 5,360 | National | Telephone |
| Costa Rica | 2003 | 776 | 381 | Regional: ≈50% of population (Greater Metropolitan Area) | Face-to-face |
| Denmark | 2003 | 881 | 711 | National | Telephone |
| Iceland | 2001 | 1,067 | 931 | National: Sampled using Register | Postal/Telephone |
| India | 2003 | 1,215 | 1,318 | Regional: (Karnataka, 5 regions including Bangalore) | Face-to-face |
| Isle of Man | 2006 | 425 | 366 | National | Mixed mode (57.5% F-to-F; 42.5% Tel) |
| Japan | 2001 | 992 | 993 | National | Self-Admin Q |
| Kazakhstan | 2002/2003 | 545 | 487 | Regional (east Kazakhstan) | Face-to-face |
| New Zealand | 2007 | 902 | 689 | National | Postal |
| Nicaragua | 2005 | 1,390 | 594 | Regional: (Bluefields, Esteli, Juigalpa, Leon, & Rivas) | Face-to-face |
| Nigeria | 2003 | 926 | 1,068 | Regional: 2 South, 3 North states & Federal Capital | Face-to-face |
| Spain | 2002 | 716 | 721 | Regional | Face-to-face |
| Sri Lanka | 2002 | 552 | 543 | Near National: 17 of 25 districts | Face-to-face |
| Sweden | 2002 | 954 | 870 | National | Telephone |
| Uganda | 2003 | 743 | 695 | Regional: 1 district in each of 4 regions | Face-to-face |
| UK | 2004 | 863 | 810 | National | Face-to-face |
| Uruguay | 2004 | 624 | 376 | National | Face-to-face |
| USA | 2000 | 3,338 | 3,057 | National: 50 states & Washington DC | Telephone |
| Country/Survey | Women | Men | ||||||
|---|---|---|---|---|---|---|---|---|
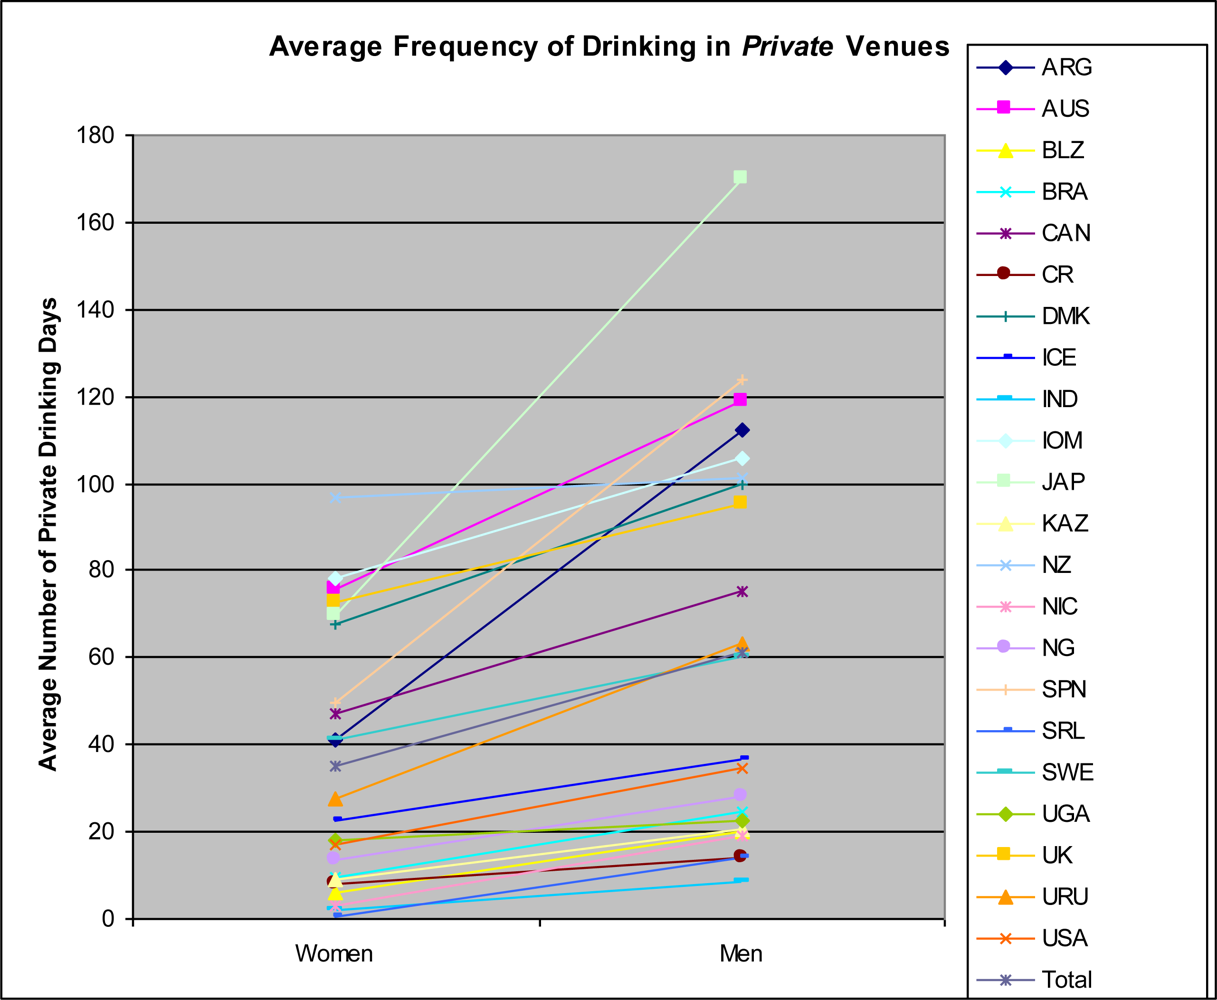
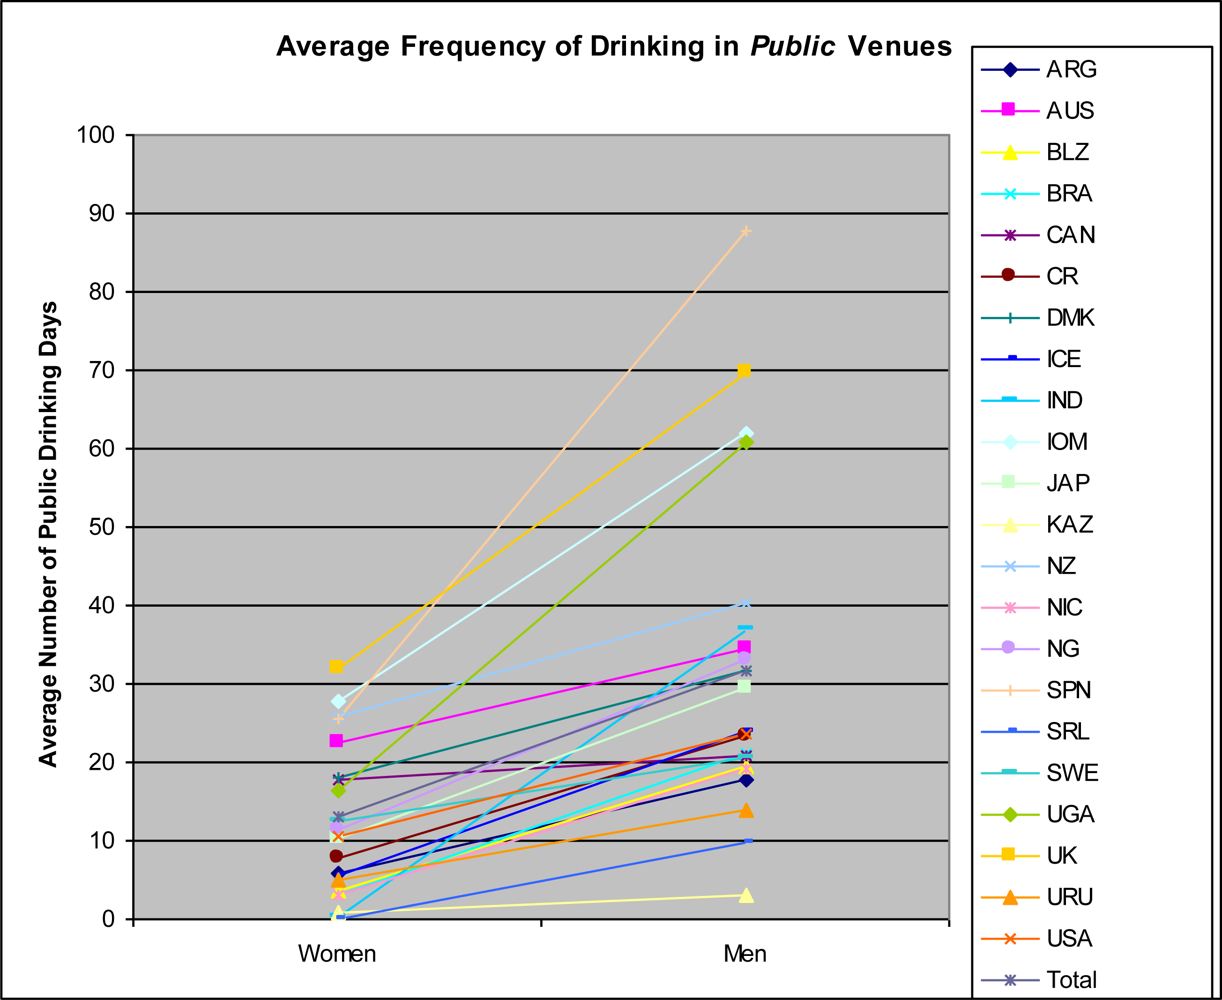
| N | % Current Drinkers | Average Frequency Public Drinkingb | Average Frequency Private Drinkingb | N | % Current Drinkers | Average Frequency Public Drinkingb | Average Frequency Private Drinkingb | |
| Argentina | 598 | 73.7 | 5.71 | 41.05 | 401 | 91.5 | 17.64 | 112.56 |
| Australia | 1,221 | 84.3 | 22.39 | 75.58 | 831 | 90.0 | 34.57 | 118.74 |
| Belize | 1,913 | 20.1 | 3.72 | 5.95 | 1,721 | 52.9 | 19.36 | 20.04 |
| Brazil | 387 | 18.9 | 2.93 | 9.29 | 273 | 39.2 | 21.02 | 24.37 |
| Canada | 6,904 | 76.9 | 17.78 | 47.36 | 5,360 | 83.1 | 20.93 | 75.34 |
| Costa Rica | 776 | 45.4 | 7.73 | 7.83 | 381 | 69.8 | 23.47 | 14.09 |
| Denmark | 881 | 93.8 | 18.10 | 67.46 | 711 | 96.8 | 31.67 | 99.56 |
| Iceland | 1,067 | 86.1 | 5.69 | 22.63 | 931 | 87.3 | 23.83 | 36.40 |
| India | 1,215 | 3.0 | .14 | 1.80 | 1,318 | 36.9 | 37.07 | 8.49 |
| Isle of Man | 425 | 88.0 | 27.74 | 78.33 | 366 | 95.4 | 62.04 | 105.59 |
| Japan | 992 | 78.7 | 10.40 | 69.49 | 993 | 92.0 | 29.55 | 169.89 |
| Kazakhstan | 545 | 66.6 | .92 | 9.21 | 487 | 77.2 | 2.96 | 20.80 |
| New Zealand | 902 | 90.4 | 25.80 | 96.89 | 689 | 90.1 | 40.32 | 101.52 |
| Nicaragua | 1,390 | 10.7 | 3.11 | 2.86 | 594 | 44.1 | 19.05 | 19.18 |
| Nigeria | 926 | 20.8 | 11.34 | 13.29 | 1,068 | 40.8 | 32.95 | 28.29 |
| Spain | 716 | 51.1 | 25.63 | 49.45 | 721 | 72.8 | 87.64 | 123.90 |
| Sri Lanka | 552 | 5.8 | .07 | .34 | 543 | 56.5 | 9.68 | 14.19 |
| Sweden | 954 | 64.9 | 12.58 | 41.21 | 870 | 78.9 | 20.48 | 60.32 |
| Uganda | 743 | 39.6 | 16.44 | 17.99 | 695 | 54.2 | 60.78 | 22.49 |
| UK | 863 | 84.2 | 31.93 | 72.79 | 810 | 91.5 | 69.60 | 95.41 |
| Uruguay | 624 | 60.3 | 4.98 | 27.47 | 376 | 81.1 | 14.00 | 63.13 |
| USA | 3,338 | 60.4 | 10.43 | 17.27 | 3,057 | 68.8 | 23.53 | 34.55 |
| All Countries | 27,932 | 59.0 | 13.17 | 35.02 | 23,196 | 72.6 | 31.53 | 61.02 |
| Country-Level Variables | Gross Domestic Product | Gender Empowerment Measure | Economic Participation and Opportunity | Educational Attainment | Political Participation | Reproductive Autonomy | Context of Violence Against Women |
|---|---|---|---|---|---|---|---|
| GDP | 1 | 0.69 | 0.36 | 0.24 | 0.51 | 0.73 | −0.69 |
| GEM | -- | 1 | 0.67 | 0.53 | 0.82 | 0.76 | −0.59 |
| EP&O | -- | -- | 1 | 0.20 | 0.64 | 0.48 | −0.32 |
| EA | -- | -- | -- | 1 | 0.36 | 0.47 | −0.34 |
| PP | -- | -- | -- | -- | 1 | 0.84 | −0.66 |
| RA | -- | -- | -- | -- | -- | 1 | −0.86 |
| CVAW | -- | -- | -- | -- | -- | -- | 1 |
| Public Venues | Private Venues | |
|---|---|---|
| Model 1: Base Model controlling for Age and Marital Status (no Country Level Predictors) a | ||
| Intercept | 1.071 (0.181)*** | 1.694 (0.235)*** |
| Age | −0.017 (0.003)*** | −0.003 (0.003) |
| Marital Status | −0.174 (0.041)*** | 0.165 (0.041)*** |
| Gender | 0.697 (0.062)*** | 0.737 (0.083)*** |
| Model 2: Country–Level Coefficients Predicting the Country–level Gender Coefficients (Each Included in Separate Models) a, b, c | ||
| Economic Status : | ||
| Gross Domestic Product | −0.161 (0.032)*** | −0.065 (0.055) |
| Gender Equality: | ||
| Gender Empowerment Measure | −0.153 (0.042)*** | −0.066 (0.072) |
| Economic Participation & Opportunity | −0.210 (0.026)*** | −0.136 (0.063) |
| Educational Attainment | −0.114 (0.043)** | 0.071 (0.032)* |
| Political Participation | −0.019 (0.075) | −0.056 (0.074) |
| Reproductive Autonomy Factor | −0.144 (0.041)*** | −0.003 (0.003) |
| Violence Against Women Factor | 0.175 (0.055)*** | 0.008 (0.061) |
| Model 3: Country–Level Coefficients Predicting the Country–Level Gender Coefficients Included Simultaneouslya,b,c | ||
| Gross Domestic Product | 0.042 (0.071) | −0.142 (0.071)* |
| Economic Participation & Opportunity | −0.221 (0.062)** | –– |
| Educational Attainment | –– | −0.075 (0.772) |
© 2010 by the authors; licensee Molecular Diversity Preservation International, Basel, Switzerland. This article is an open-access article distributed under the terms and conditions of the Creative Commons Attribution license (http://creativecommons.org/licenses/by/3.0/).
Share and Cite
Bond, J.C.; Roberts, S.C.M.; Greenfield, T.K.; Korcha, R.; Ye, Y.; Nayak, M.B. Gender Differences in Public and Private Drinking Contexts: A Multi-Level GENACIS Analysis. Int. J. Environ. Res. Public Health 2010, 7, 2136-2160. https://doi.org/10.3390/ijerph7052136
Bond JC, Roberts SCM, Greenfield TK, Korcha R, Ye Y, Nayak MB. Gender Differences in Public and Private Drinking Contexts: A Multi-Level GENACIS Analysis. International Journal of Environmental Research and Public Health. 2010; 7(5):2136-2160. https://doi.org/10.3390/ijerph7052136
Chicago/Turabian StyleBond, Jason C., Sarah C.M. Roberts, Thomas K. Greenfield, Rachael Korcha, Yu Ye, and Madhabika B. Nayak. 2010. "Gender Differences in Public and Private Drinking Contexts: A Multi-Level GENACIS Analysis" International Journal of Environmental Research and Public Health 7, no. 5: 2136-2160. https://doi.org/10.3390/ijerph7052136
APA StyleBond, J. C., Roberts, S. C. M., Greenfield, T. K., Korcha, R., Ye, Y., & Nayak, M. B. (2010). Gender Differences in Public and Private Drinking Contexts: A Multi-Level GENACIS Analysis. International Journal of Environmental Research and Public Health, 7(5), 2136-2160. https://doi.org/10.3390/ijerph7052136