Article

Association Between Biomarkers of Environmental Enteric Dysfunction and Early Child Development Amongst Infants in Rural Central Java, Indonesia


1
National Centre for Epidemiology and Population Health, College of Law, Governance, and Policy, Australian National University, Canberra, ACT 2601, Australia
2
Population Health Program, QIMR Berghofer Medical Research Institute, Herston, QLD 4006, Australia
3
Faculty of Medicine, Public Health, and Nursing, Universitas Gadjah Mada, Yogyakarta 55281, Indonesia
4
School of Medicine and Psychology, College of Science and Medicine, Australian National University, Acton, ACT 2601, Australia
5
Infection and Inflammation Program, QIMR Berghofer Medical Research Institute, Herston, QLD 4006, Australia
*
Author to whom correspondence should be addressed.
These authors contributed equally to this work.
Int. J. Environ. Res. Public Health 2026, 23(9), 1210; https://doi.org/10.3390/ijerph23091210
Submission received: 25 July 2026 / Revised: 7 September 2026 / Accepted: 10 September 2026 / Published: 14 September 2026

Highlights

Public health relevance—How does this work relate to a public health issue?
  • In impoverished settings often with poor water, sanitation, and hygiene (WASH) conditions, concurrent growth stunting and cognitive deficits remain a pervasive problem.
  • Chronic exposure to faecal pathogens may drive changes in the small intestinal architecture and function, termed environmental enteric dysfunction (EED).
Public health significance—Why is this work of significance to public health?
  • In a setting with poor WASH conditions and elevated levels of EED biomarkers, reduced early child development was observed.
  • EED biomarkers were weakly associated with early child development of children in rural Indonesia.
Public health implications—What are the key implications or messages for practitioners, policy makers and/or researchers in public health?
  • EED warrants further research as a potential driver of poor early child development outcomes.
  • Public health interventions to improve child growth and health in impoverished settings should consider the possibility of EED occurring.

Abstract

Environmental enteric dysfunction (EED) may be associated with poor cognitive and overall early child development (ECD) independent of linear growth. This may serve as an opportunity to improve ECD with water, sanitation, and hygiene (WASH) interventions. This study aimed to measure the association between EED and ECD amongst 119 infants aged 11–24 months from five villages in rural Wonosobo, Indonesia. Data collection at baseline (September–October 2024) and follow-up (February–March 2025) involved a quantitative questionnaire, anthropometric measurements, measurement of three EED stool biomarkers, alpha-1-antitrypsin (AAT), neopterin (NEO), and myeloperoxidase (MPO), and assessment of ECD using the Caregiver Reported Early Development Instruments (CREDI) z-scores for the cognitive and overall category performed at follow-up. Linear regression modelled the association between EED biomarkers and CREDI cognitive and overall z-score. The associations between MPO and ECD were generally weak and insignificant. MPO above the 75th percentile at baseline was associated with lower cognitive z-score (β = −0.63, 95% CI = −0.99 to −0.26, p < 0.001) but, at follow-up, was associated with higher cognitive z-score (β = 0.41, 95% CI = 0.03 to 0.79, p < 0.05). Associations between AAT and NEO with cognitive and development z-scores were not statistically significant. These findings show that the relationships between EED and early child development are complex and weakly explained by these biomarkers.

1. Introduction

Low- and middle-income countries (LMICs) bear most of the burden of child stunting—failure to achieve one’s genetic height potential [1]. A form of chronic undernutrition, stunting is a multifactorial condition driven by poor maternal health, marginal diets, chronic infection and caregiving practices [2]. Children who are stunted are more likely to have reduced cognitive development [3], lower earnings as an adult [4], increased morbidity and mortality from non-communicable disease in adulthood and greater risk of birth complications and stunting in offspring [5]. These outcomes contribute to the cycle of poverty in LMICs, thus preventing achievement of improved population health and early child development [6].
Whilst stunting is associated with birth complications and stunting in offspring, it is possible that not all poor health and development outcomes linked to stunting are causal in nature [7]. It is plausible that stunting and its associated poor health outcomes such as increased mortality and reduced cognitive development are both consequences of the deficient environment—poor nutrition, unsanitary conditions, and limited access to healthcare—that millions of infants are exposed to in LMICs [7]. Over-emphasis on stunting as the primary yardstick for child health and nutrition interventions may be an inefficient use of resources. Early child development outcomes have been improved by interventions that do not generate any improvement in linear growth [8]. For example, psycho-social stimulation has been shown to be far more effective in increasing cognitive and language development compared to nutrition interventions [9]. Thus, a shift is required to address the underlying determinants of poor child health and development in LMICs with recognition that stunting is one of many outcomes with a shared set of risk factors and many experts argue against linear growth as the sole outcome in intervention trials [10,11]. Identifying risk factors to poor child development independent of linear growth is thus of great importance.
Alongside poor dietary intakes, inadequate caregiving and stimulation, a major constituent of the “deficient environment” that may be driving stunting and poor development outcomes amongst infants in LMICs is the absence of safe water, sanitation, and hygiene (WASH) [12]. Such conditions are associated with gastrointestinal infection and acute but potentially severe symptoms, including diarrhoea, anaemia, and wasting [13]. More recently, however, the contribution of poor WASH conditions to poor health amongst infants has been recognised to also occur not only through acute symptomatic infections but an asymptomatic progressive degeneration of the small intestine architecture due to chronic pathogen exposure resulting in high intestinal inflammation, increased intestinal permeability, and translocation of microbial products across the small intestine leading to subsequent chronic systemic inflammation and growth stunting [14]. This condition has been termed environmental enteric dysfunction (EED), which may represent a neglected cause of poor cognitive and overall early child development in LMICs [15,16]. Reduced nutrient absorption in EED and shifting nutrient needs towards maintaining an inflammatory response during the critical period of neuroplasticity in the first two years of life may hinder both bone and brain development as seen in the reduced concentrations of insulin-like growth factor 1 (IGF-1) in infants with high levels of EED biomarkers [17]. The chronic low-grade systemic inflammation induced in EED may lead to a subclinical neuroinflammatory state that directly affects cognitive development [18].
The evidence base regarding the interaction between EED and cognitive outcomes is overall lacking. The research presented here took place in Indonesia, a south-east Asian archipelago country where the persistence of poor WASH conditions and child stunting provide an ideal context for exploring the interplay of these factors on child development. This study aims to measure the association between EED biomarkers and early child development.

2. Methods

2.1. Study Design, Sample, and Population

The details of this study have been described in the overarching study paper investigating the associations between environmental exposures, EED and stunting [19]. Briefly, this was a longitudinal study of 119 infants aged 5–19 months at baseline (11–24 months at follow-up) from five villages in rural Wonosobo, Central Java, Indonesia, between September–October 2024 (Baseline) and February–March 2025 (Follow-up), with follow-up occurring in the wet season. Data was collected at a baseline visit and then a follow-up visit 5 months later. Baseline data collection consisted of a quantitative questionnaire administered to infants’ mothers, anthropometry measurements and stool sample collection and analysis. The questionnaire captured information on household and infant demographic and socio-economic conditions, breastfeeding, infant health and consumption of animal-source foods, and household WASH conditions. At follow-up, the questionnaire was repeated for time-varying variables as well as follow-up anthropometry measurements and stool sample collection and the addition of an early child development (CREDI) questionnaire described in the proceeding section. Infant length was recorded using an infant length board (InnoQ Infantometer 100, PT Astra Components Indonesia, 1 mm graduation) and weight using a calibrated baby weight scale (InnoQ Digital Baby Scale 100, PT Astra Components Indonesia, 5 g graduation).
Stool samples were analysed for the concentration of three established biomarkers of EED: alpha-1-antitrypsin (AAT), neopterin (NEO), and myeloperoxidase (MPO). Analysis was performed using commercial ELISA kits according to manufacturer instructions (AAT and MPO: Immundiagnostik AG, Bensheim, Germany; NEO: IBL Immuno-biological laboratories, Minneapolis, MN, USA). Samples were diluted 1:25,000 for AAT, 1:8 for NEO, and 1:500 for MPO. High stool AAT levels are an indicator of protein leakage in the intestinal tract [20], a key feature of EED due to breakdown of tight junctions between epithelial cells [21]. Produced by macrophages following interferon-gamma stimulation, NEO is a marker of increased intestinal immune activity and inflammation [22]. MPO is primarily produced by neutrophils and is involved in the production of antimicrobial reactive oxygen species; therefore, it is an indicator of intestinal immune activity and inflammation [21].

2.2. Assessment of Early Child Development Scales

At follow-up, infants’ early child development (ECD) was assessed using the Caregiver-Reported Early Development Index (CREDI) long-form questionnaire [23]. The CREDI is a questionnaire designed for the assessment of ECD specifically amongst infants from birth to 36 months of age developed at Harvard University Graduate School of Education and is validated for use in low-resourced settings, with translations available to Bahasa Indonesia language [24]. The CREDI questionnaire consists of 108 caregiver-reported development milestones that relate to cognitive, language, motor, and socio-emotional as well as overall development “domains”. The questionnaire and guidelines for its implementation in the field can be downloaded from the Harvard GSE CREDI website (https://credi.gse.harvard.edu/materials (accessed on 10 October 2024)). Example questions include “Can the child bring his/her hands together?” and “Can the child say one or more words?”. A physical print out of annotations for questions pertaining to physical actions was used as provided by Harvard GSE. Raw data from the questionnaire was de-identified and then uploaded to the CREDI Scoring App (https://credi.shinyapps.io/CREDI-Scoring-App (accessed on 10 October 2024)) where the z-scores for each domain are calculated and downloaded. The interpretation of CREDI z-scores is comparable to the interpretation of WHO anthropometry z-scores whereby CREDI z-scores are centred around 0, which is the mean score of a child of the same age from the reference sample of 4652 children with “advantageous” home environments. A score of −1 for a given domain indicates an infant’s score in that domain is one standard deviation below the average of infants the same age in the reference sample. We focus primarily on the cognitive domain as this is most closely linked to stunting but present results for the overall development score in the Supplementary Materials as an indicator of overall ECD. As CREDI is a caregiver-reported questionnaire, the potential for desirability bias exists, where mothers exaggerate their infants’ development. To mitigate this as best as possible, it was explained to mothers that ECD is a highly individual process and there is no shame in responding that their child has not reached a particular development milestone and that all children develop at different rates as recommended in the CREDI guidelines.

2.3. Confounders

Household level WASH variables measured at baseline included drinking water source (municipal vs. spring), household sanitation (improved vs. unimproved), dirt floors (partial dirt floor or fully concreted/covered), storage of infant’s complementary foods at room temperature between feedings (yes vs. no), disposal of infant faeces (safe vs. unsafe), mother washes hands with soap before preparing meals (yes vs. no) and father handles animals and/or animal faeces regularly (yes vs. no). An overall WASH index was created by summing these variables and stratifying as above three vs. three or below exposures to show the cumulative effect of poor WASH conditions. The scoring system is provided in Supplementary Table S6. Infants’ average daily play time outdoors on soiled surfaces was measured as a potential confounder given it was associated with EED biomarkers in the previous study [19].
Infants’ height and weight was converted into height-for-age z-scores (HAZ) using WHO AnthroPlus software (version 1.0.4) [25], which has the 2006 WHO Child Growth Charts built in [26]. Linear growth was modelled as both HAZ at follow-up to show the relationship between current attained height-for-age and development and as the change in HAZ (∆HAZ) to show the effect of recent linear growth.
EED biomarkers were log-transformed due to skew and modelled as comparisons of the upper and lower quartiles, with the reference category being the interquartile range (25th–75th percentile).

2.4. Statistical Analysis

As this was an additional outcome under the overarching sub-study with a sample size of 119 infants, a sample size calculation was not applicable. The sample size was assessed to be appropriate for a multivariate regression model with 10–12 predictors, assuming a minimum of ~10 observations per variable [27].
The association between EED biomarkers with CREDI z-scores was modelled using ordinary least squares linear regressions after identifying the lack of clustering of scores amongst infants within the same villages. A base model was first developed including the following a priori key covariates that could plausibly confound the association between EED biomarkers and CREDI z-scores: infant’s age, sex, breastfeeding status, diarrhoea incidence, mother’s education and working status, household expenses, and animal-source food intake. A partially adjusted model was built as the base model and then EED biomarkers were added and modelled iteratively. The fully adjusted model accounted for the confounding effects of WASH through the WASH index variable as described and adjusted for infant’s average daily outdoor play time as a potential confounder as well as HAZ at follow-up. EED biomarkers at each time point were modelled separately and mutually adjusted with biomarkers from either time point if p < 0.25 in univariate analysis. A simple random effects model of each CREDI domain z-score with a random intercept for data collector was used to assess variance in CREDI z-scores attributed to data collector bias; the highest intra-class correlation (ICC) reported was 5.3%, which reduced to <0.001% after accounting for base covariates indicating no bias. Model assumptions and covariates figured are provided in Supplementary Table S7 and Supplementary Figure S1.

2.5. Ethics

This project received ethical approval from the Indonesian National Research and Innovation Agency (BRIN) Health Research Ethics Committee (Protocol #28062023000007) and the Australian National University Research Ethics Committee (Protocol H/2023/1123).

3. Results

3.1. Distribution of CREDI Scores

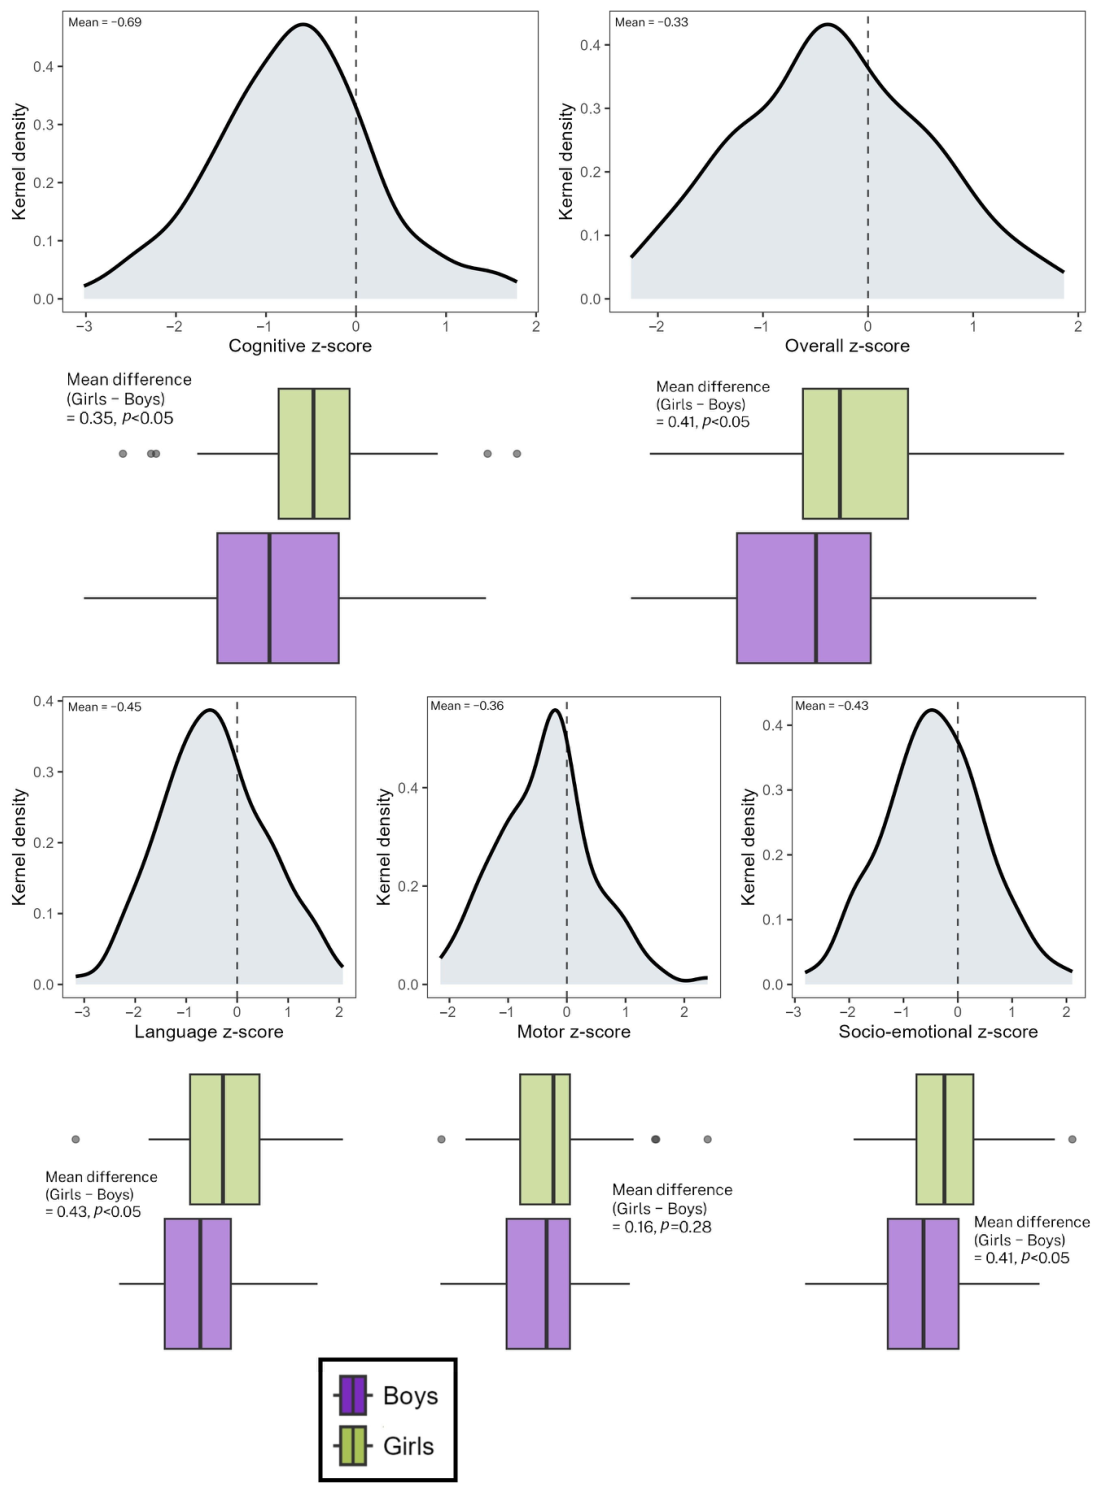
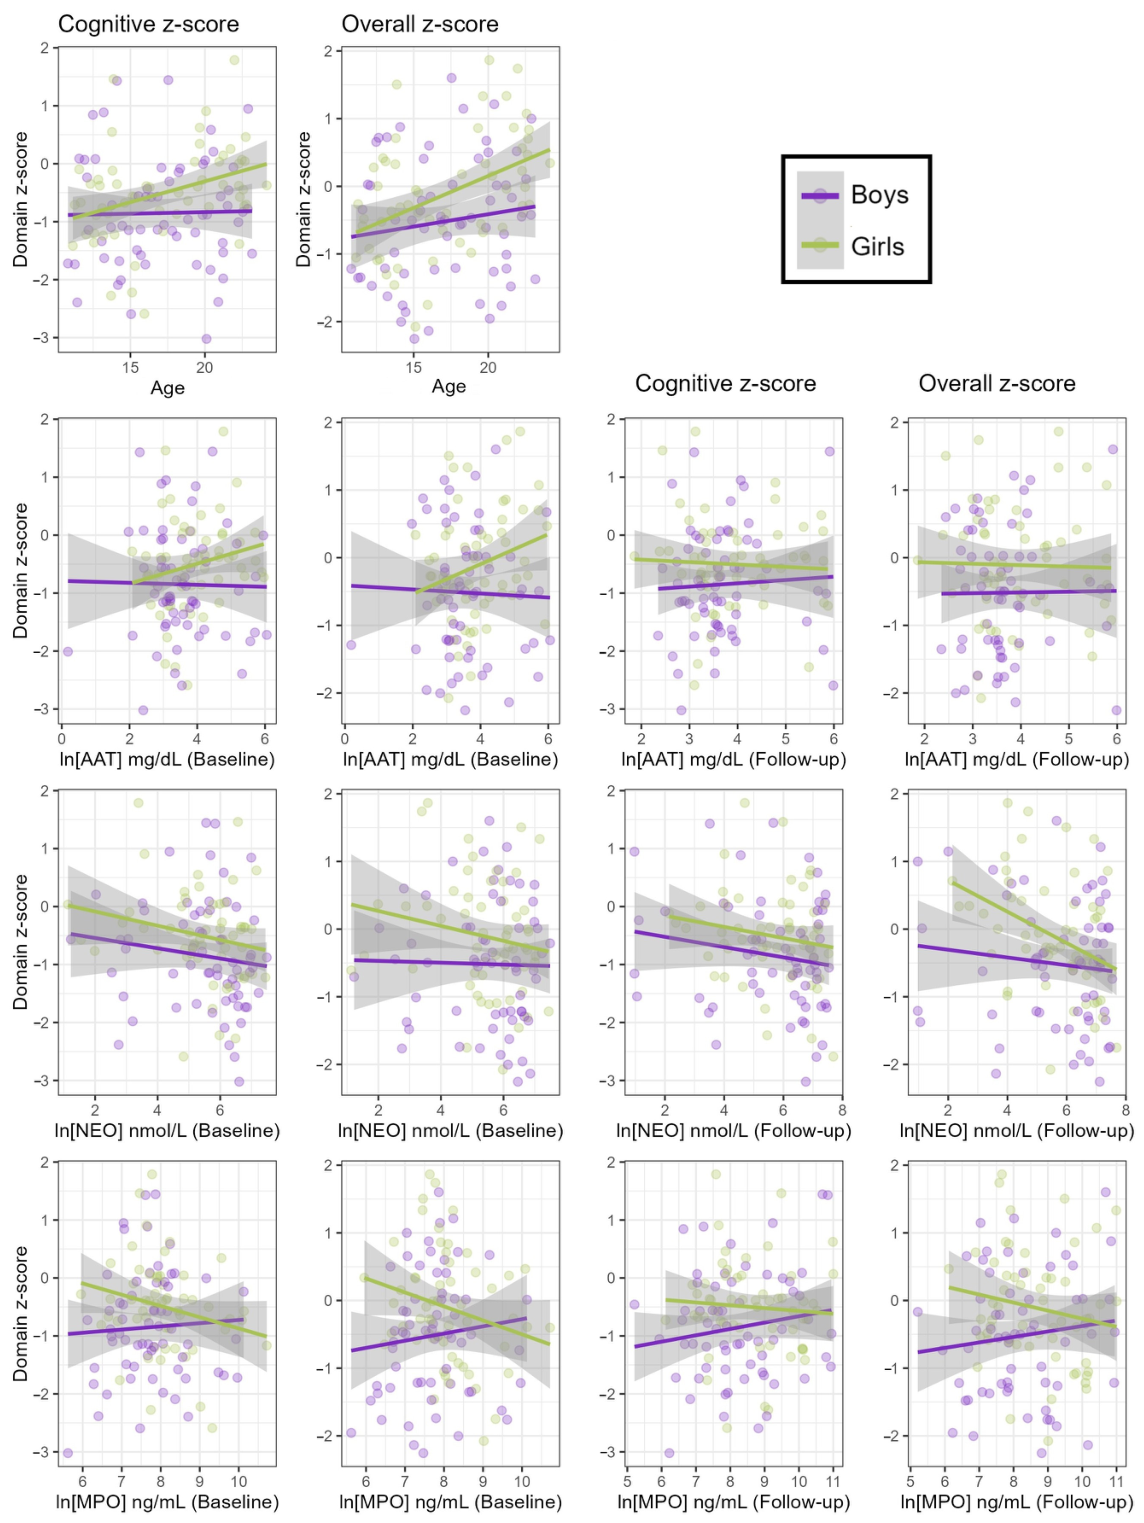
The distribution of CREDI z-scores was below the reference population for all domains (Figure 1), particularly for the cognitive domain (mean = −0.69). Boys had lower scores than girls in all but the motor domain. Boys’ mean z-scores were between −0.16 and −0.42 below that of girls, with the lowest score among boys being the cognitive domain (mean = −0.85). Girls’ highest score was the overall domain (mean = −0.11) and lowest was the cognitive domain (mean = −0.50). The differences between boys and girls were statistically significant (p < 0.05) in all domains except motor development (p = 0.28). All CREDI domains were highly correlated at p < 0.001 (Supplementary Table S1). Both overall and cognitive z-scores increased with age in boys and girls (Figure 2). Increasing NEO levels at either time points trended towards lower CREDI z-scores, while associations were less clear for AAT and MPO.
Descriptive statistics of the sample population are presented in Table 1. One hundred and nineteen (119) infants provided complete data, with one participant from the overarching study lost to follow-up. Most infants (66.7%) resided in households with average monthly expenses up to Rp. 2 million. Unimproved sanitation facilities were present in 37.0% of infants’ households and 70.6% obtained water from a village spring. At both baseline and follow-up, approximately one third of infants had at least one diarrhoea episode in the last 3 months. Stool AAT, NEO, and MPO were elevated in most infants at both baseline and follow-up.
Key covariates were associated with all development domains (Supplementary Table S2). For every 1-month increase in infants’ age, overall development z-scores increased by 0.08 (95% CI = 0.03, 0.12, p < 0.01). Higher z-scores were observed in all domains amongst infants who were still breastfed at follow-up, with the strongest associations for language (β = 0.59, 95% CI = 0.11, 1.07, p < 0.05) and overall development (β = 0.56, 95% CI = 0.13, 0.99, p < 0.05). Increasing daily serves of animal-source foods was associated with higher cognitive z-score (β = 0.15, 95% CI = 0.00, 0.29, p < 0.05). Infants who had more than one episode of diarrhoea over the period of recall had a 0.47 points higher overall development z-score (β = 0.47, 95% CI = 0.11, 0.83, p < 0.05) and a non-significant higher cognitive z-score (β = 0.25, 95% CI = −0.12, 0.62, p = 0.18). Socio-economic factors were weakly associated with development z-scores. Mother’s education and household expenses showed no significant associations with any z-score; however, infants whose mothers worked outside the home had higher cognitive z-score (β = 0.25, 95% CI = 0.00, 0.70, p < 0.05) and borderline higher overall development (β = 0.30, 95% CI = −0.04, 0.64, p = 0.08). The data collector administering the CREDI questionnaire did not explain any variance in development z-scores (Supplementary Table S2). Together, these key covariates and socio-economic indicators explained between 16 and 26% of the variance in development z-scores.

3.2. Association Between EED Biomarkers and ECD

The associations between EED biomarkers and cognitive (Table 2) and overall development (Supplementary Table S4) were complex and bidirectional. Stool NEO concentrations above the 75th percentile or below the 25th percentile was not statistically significantly associated with cognitive development, although they trended towards a linear association. For overall development z-score, the associations between the quartile comparisons trended towards a linear relationship and follow-up NEO showed a negative association (β = −0.12, 95% CI = −0.21, −0.02, p < 0.05). AAT was not associated with cognitive z-score at either baseline or follow-up. However, compared to the interquartile range, infants with follow-up AAT below the 25th percentile had notably higher overall development z-score but the association was not statistically significant (β = 0.31, 95% CI = −0.05, 0.68, p = 0.09). The patterns for MPO were bi-directional; infants with baseline MPO above the 75th percentile had a strong association with lower cognitive z-score (β = −0.63, 95% CI = −0.99, −0.26, p < 0.001) whilst follow-up MPO above the 75th percentile was positively associated with cognitive z-score (β = 0.41, 95% CI = 0.03, 0.79, p < 0.05). The same pattern was observed between MPO quartiles and overall development but were not statistically significant. Infants with worse WASH conditions had borderline lower cognitive and significantly lower overall development z-score (β = −0.36, 95% CI = −0.70 to −0.05, p < 0.05) (Supplementary Table S5).

4. Discussion

This follow-up study of early child development of our cohort of rural Indonesian infants found that development z-scores were below that of the reference population with a mean cognitive z-score of −0.69 and overall development z-score of −0.33. Notably, cognitive z-scores were particularly low amongst boys (mean = −0.85) who also had substantially worse linear growth than girls [19]. These findings are consistent with the general view that cognitive development is sub-par in children raised in resource-limited environments [29] and in poor WASH conditions [30]. The substantially lower mean cognitive z-score in boys may be a result of increased malnutrition and enteropathy but also may reflect cultural differences in caregiver attention and stimulation provided dependent on infants’ sex [30] as well as unmeasured variables.
Our results are not the first to identify mixed cross-sectional associations between EED biomarkers and cognitive development. Etheredge and colleagues found a positive correlation whereby higher cognitive scores were associated with anti-LPS IgG, anti-flagellin IgA, and IgG but suggested that these antibodies might be acting as a protective immune response, thus providing neurocognitive benefits [31]. This highlights one of the central challenges, which is the ambiguity between biomarkers of EED and the severity of EED itself, which remains under-researched. Higher stool NEO concentrations, in particular NEO at follow-up, was associated with lower cognitive and overall z-scores, which is consistent with the theory that high inflammation may correlate with poor cognitive development [18], although this contrasted with the finding of Donowitz and colleagues, who found higher stool NEO levels to be associated with better neurodevelopment [32]. The association between MPO and cognitive score was intriguing, where high (>75th percentile) MPO at baseline predicted lower cognitive development but high MPO at follow-up predicted higher score. This is an unexpected finding that requires replication in other studies. Residual confounding may explain this association. Future studies could investigate if high MPO can act as a function of intestinal immune function and reserve, whereby high baseline MPO could be signalling high faecal pathogen exposure with negative consequences for cognitive development, whereas high follow-up MPO could be a sign of a well-performing immune response in adaptation to chronic faecal pathogen exposure, an adaptation with potential survival benefits [21]. However, this remains speculation as we did not measure pathogen exposure. The associations between the inflammatory biomarkers NEO and MPO we observed may be driven by other unmeasured confounders or chance considering the small sample size. More discernible biomarkers such as a higher lactulose to mannitol urine ratio, an indicator of intestinal damage and permeability, were associated with reduced verbal and non-verbal learning amongst shantytown children in Brazil [33].
Low (<25th percentile) AAT at follow-up, which is an indicator of intestinal protein loss/leakage, was associated with higher overall development score. Jiang and colleagues found, while elevated levels of interleukins IL-1β and IL-6 were associated with lower motor scores amongst rural Bangladeshi infants, elevated IL-4 was associated with improved cognitive development scores, suggesting that particular immune responses may be more beneficial for growth and development [34]. To our knowledge, this cannot be deduced from the levels of stool AAT, NEO, and MPO, highlighting the need for an improved diagnostic panel of EED biomarkers and overall better understanding of the pathology and immunology of EED. In addition, the associations between EED biomarkers and development outcomes may be partially confounded by age and gut maturation, although we have adjusted for this in regression models.
An unexpected finding was that infants who had more frequent diarrhoea had higher cognitive and significantly higher overall development z-scores (Supplementary Table S2). This may be related to caregiver bias, where mothers overreport the development of infants who are frequently sick. However, it may also be that infants with more frequent diarrhoea have greater exploratory play and therefore improved development. Although, this is an untested hypothesis and so should be considered more critically in future research.
There are some noteworthy limitations that should be considered in assessing our results. This study was not powered to model the relationships between WASH, EED, and anthropometry with early child development using the more rigorous structured equation modelling or mediation analysis. In addition, caregiving behaviour, infant play, and EED biomarkers are likely transient; thus, two point-estimates may not be sufficient to capture the full trajectory of environmental pathogen and play exposure necessary to fully mediate associations. Early child development is influenced by an array of factors, of which not all were measured in this study; thus, there may be some residual confounding not accounted for. Our findings are still reliable in demonstrating the concurrence of below-standard cognitive development in a setting of elevated EED biomarkers and growth faltering, however. Whilst desirability bias is particularly relevant for CREDI, it is unlikely to have a major impact in this study because (1) this bias is unlikely to be systematically related to EED biomarker levels and (2) lower overall z-scores were observed in mothers with high education, suggesting that there was unlikely bias whereby mothers “matched” the reporting of their infant’s development to the expected standard assumed by a mother with higher education. However, as CREDI is caregiver-reported, there may be unmeasured systematic bias in the reporting of infants’ milestones and so caregiver bias may confound associations found in this study. We did not apply multiple testing adjustment due to the exploratory nature of this research and the small sample size. However, readers should consider the inflated type I error in this article and treat findings as requiring replication in larger studies. Lastly, these findings may not be generalisable to infants older than two years and to other countries and settings outside of rural areas in Java where contextual and cultural factors differ. Whilst linear growth, EED and development during the first two years of life is a critical period, early child development trajectories continue to develop beyond this period and understanding associations between pathogen exposure or EED with development in older children than the infants in this study is also of great importance.

5. Conclusions

This research project highlights that, in a rural area where growth stunting and elevated intestinal permeability and inflammation persist, cognitive deficits in tandem are seen. However, EED biomarkers were rarely associated with early child development. Further research into EED and identification of new biomarkers will be pivotal in better capturing the progression of EED and measuring its association with early child development.

Supplementary Materials

The following supporting information can be downloaded at: https://www.mdpi.com/article/10.3390/ijerph23091210/s1, Table S1. Pearson correlations between the CREDI domain z-scores. All correlations are statistically significant at p < 0.001. n = 119; Table S2. Socio-economic, demographic, and health factors associated with CREDI domain z-scores modelled with an ordinary least squares linear regression. Significant associations in bold typeface; Table S3. Intra-class correlations for variance in CREDI z-scores attributed to data collector bias from a mixed-effects linear model with and without key covariates employing a random intercept for data collector; Table S4. Association between EED biomarkers and CREDI overall z-score. Results obtained from a linear regression model; Table S5. Association between WASH score and infant outdoor soiled surface play time with CREDI cognitive and overall z-score. Models are linear regressions adjusted for demographic, health, and socio-economic covariates; Table S6. Scoring of the WASH score variable. A score of 1 is achieved for every WASH risk category met. Unimproved sanitation was defined in accordance with the Joint Monitoring Program criteria; Table S7. List of covariates included, maximum variance inflation factor (VIF) and observations per variable in regression models for cognitive and overall z-scores; Figure S1. Model assumptions for ordinary least squares linear regression models fitting EED biomarkers in association with cognitive z-score outcome. Density plots (left) show the distribution of residuals and scatterplots (right) show the distribution of residuals across fitted values.

Author Contributions

C.L.: Conceptualisation; data curation, formal analysis, investigation, methodology, project administration, writing—original draft, writing—review and editing. T.A.: methodology, writing—review and editing. M.H.: methodology, writing—review and editing. H.S.: methodology, writing—review and editing. I.N.S.: writing—review and editing. S.N.: writing—review and editing. D.G.: funding acquisition, methodology, writing—review and editing. M.K.: methodology, writing—review and editing. All authors have read and agreed to the published version of the manuscript.

Funding

This research was funded by QIMR Berghofer Medical Research Institute.

Institutional Review Board Statement

The study was conducted in accordance with the Declaration of Helsinki and approved by the Health Research Ethics Committee, National Research and Innovation Agency, Indonesia (protocol code 28062023000007 approved on 25 March 2024).

Informed Consent Statement

Informed consent was obtained from all infants’ mothers participating in the study.

Data Availability Statement

The data presented in this study are available from the corresponding author upon reasonable request.

Acknowledgments

We thank the study participants for giving up their time for the participation in this research project. We also thank local village heads, midwives and health cadres for their assistance in the project.

Conflicts of Interest

The authors declare no conflicts of interest.

References

  1. Vaivada, T.; Akseer, N.; Akseer, S.; Somaskandan, A.; Stefopulos, M.; Bhutta, Z.A. Stunting in childhood: An overview of global burden, trends, determinants, and drivers of decline. Am. J. Clin. Nutr. 2020, 112, 777S–791S. [Google Scholar] [CrossRef] [Scilit] [PubMed]
  2. UNICEF. Conceptual Framework for Nutrition; United Nations Children’s Fund: New York, NY, USA, 2013; Available online: https://www.unicef.org/documents/conceptual-framework-nutrition (accessed on 23 March 2025).
  3. Alam, M.A.; Richard, S.A.; Fahim, S.M.; Mahfuz, M.; Nahar, B.; Das, S.; Shrestha, B.; Koshy, B.; Mduma, E.; Seidman, J.C.; et al. Impact of early-onset persistent stunting on cognitive development at 5 years of age: Results from a multi-country cohort study. PLoS ONE 2020, 15, e0227839. [Google Scholar] [CrossRef] [Scilit] [PubMed]
  4. McGovern, M.E.; Krishna, A.; Aguayo, V.M.; Subramanian, S.V. A review of the evidence linking child stunting to economic outcomes. Int. J. Epidemiol. 2017, 46, 1171–1191. [Google Scholar] [CrossRef] [Scilit] [PubMed]
  5. De Sanctis, V.; Soliman, A.; Alaaraj, N.; Ahmed, S.; Alyafei, F.; Hamed, N. Early and Long-term Consequences of Nutritional Stunting: From Childhood to Adulthood. Acta Biomed. 2021, 92, e2021168. [Google Scholar] [CrossRef] [Scilit] [PubMed]
  6. McCoy, D.C.; Peet, E.D.; Ezzati, M.; Danaei, G.; Black, M.M.; Sudfeld, C.R.; Fawzi, W.; Fink, G. Early Childhood Developmental Status in Low- and Middle-Income Countries: National, Regional, and Global Prevalence Estimates Using Predictive Modeling. PLoS Med. 2016, 13, e1002034. [Google Scholar] [PubMed]
  7. Leroy, J.L.; Frongillo, E.A. Perspective: What Does Stunting Really Mean? A Critical Review of the Evidence. Adv. Nutr. 2019, 10, 196–204. [Google Scholar] [CrossRef] [Scilit] [PubMed]
  8. Muhoozi, G.K.M.; Atukunda, P.; Diep, L.M.; Mwadime, R.; Kaaya, A.N.; Skaare, A.B.; Willumsen, T.; Westerberg, A.C.; Iversen, P.O. Nutrition, hygiene, and stimulation education to improve growth, cognitive, language, and motor development among infants in Uganda: A cluster-randomized trial. Matern. Child Nutr. 2018, 14, e12527. [Google Scholar] [CrossRef] [Scilit] [PubMed]
  9. Aboud, F.E.; Yousafzai, A.K. Global health and development in early childhood. Annu. Rev. Psychol. 2015, 66, 433–457. [Google Scholar] [CrossRef] [Scilit] [PubMed]
  10. Miller, A.C.; Murray, M.B.; Thomson, D.R.; Arbour, M.C. How consistent are associations between stunting and child development? Evidence from a meta-analysis of associations between stunting and multidimensional child development in fifteen low- and middle-income countries. Public Health Nutr. 2016, 19, 1339–1347. [Google Scholar] [CrossRef] [Scilit] [PubMed]
  11. Frongillo, E.A.; Leroy, J.L.; Lapping, K. Appropriate Use of Linear Growth Measures to Assess Impact of Interventions on Child Development and Catch-Up Growth. Adv. Nutr. 2019, 10, 372–379. [Google Scholar] [CrossRef] [Scilit] [PubMed]
  12. Ngure, F.M.; Reid, B.M.; Humphrey, J.H.; Mbuya, M.N.; Pelto, G.; Stoltzfus, R.J. Water, sanitation, and hygiene (WASH), environmental enteropathy, nutrition, and early child development: Making the links. Ann. N. Y. Acad. Sci. 2014, 1308, 118–128. [Google Scholar] [CrossRef] [Scilit] [PubMed]
  13. Wolf, J.; Johnston, R.B.; Ambelu, A.; Arnold, B.F.; Bain, R.; Brauer, M.; Brown, J.; Caruso, B.A.; Clasen, T.; Colford, J.M.; et al. Burden of disease attributable to unsafe drinking water, sanitation, and hygiene in domestic settings: A global analysis for selected adverse health outcomes. Lancet 2023, 401, 2060–2071. [Google Scholar] [CrossRef] [Scilit] [PubMed]
  14. Harper, K.M.; Mutasa, M.; Prendergast, A.J.; Humphrey, J.; Manges, A.R. Environmental enteric dysfunction pathways and child stunting: A systematic review. PLoS Neglected Trop. Dis. 2018, 12, e0006205. [Google Scholar] [CrossRef] [Scilit] [PubMed]
  15. Oriá, R.B.; Murray-Kolb, L.E.; Scharf, R.J.; Pendergast, L.L.; Lang, D.R.; Kolling, G.L.; Guerrant, R.L. Early-life enteric infections: Relation between chronic systemic inflammation and poor cognition in children. Nutr. Rev. 2016, 74, 374–386. [Google Scholar] [CrossRef] [Scilit] [PubMed]
  16. Guerrant, R.L.; Oriá, R.B.; Moore, S.R.; Oriá, M.O.; Lima, A.A. Malnutrition as an enteric infectious disease with long-term effects on child development. Nutr. Rev. 2008, 66, 487–505. [Google Scholar] [CrossRef] [Scilit] [PubMed]
  17. Tickell, K.D.; Atlas, H.E.; Walson, J.L. Environmental enteric dysfunction: A review of potential mechanisms, consequences and management strategies. BMC Med. 2019, 17, 181. [Google Scholar] [CrossRef] [Scilit] [PubMed]
  18. Hagberg, H.; Gressens, P.; Mallard, C. Inflammation during fetal and neonatal life: Implications for neurologic and neuropsychiatric disease in children and adults. Ann. Neurol. 2012, 71, 444–457. [Google Scholar] [CrossRef] [Scilit] [PubMed]
  19. Lowe, C.; Arjuna, T.; Hasanbasri, M.; Sarma, H.; Sutarsa, I.N.; Navarro, S.; Gray, D.; Kelly, M. Elevated levels of environmental enteric dysfunction biomarkers among rural Indonesian infants: Associations with water, sanitation, hygiene and linear growth. Trop. Med. Infect. Dis. 2026, 71, 251. [Google Scholar] [CrossRef] [Scilit]
  20. Strygler, B.; Nicar, M.J.; Santangelo, W.C.; Porter, J.L.; Fordtran, J.S. α1-antitrypsin excretion in stool in normal subjects and in patients with gastrointestinal disorders. Gastroenterology 1990, 99, 1380–1387. [Google Scholar] [CrossRef] [Scilit] [PubMed]
  21. Klebanoff, S.J. Myeloperoxidase: Friend and foe. J. Leukoc. Biol. 2005, 77, 598–625. [Google Scholar] [CrossRef] [Scilit] [PubMed]
  22. Husain, N.; Tokoro, K.; Popov, J.M.; Naides, S.J.; Kwasny, M.J.; Buchman, A.L. Neopterin Concentration as an Index of Disease Activity in Crohn’s Disease and Ulcerative Colitis. J. Clin. Gastroenterol. 2013, 47, 246–251. [Google Scholar] [CrossRef] [Scilit] [PubMed]
  23. McCoy, D.C.; Sudfeld, C.R.; Bellinger, D.C.; Muhihi, A.; Ashery, G.; Weary, T.E.; Fawzi, W.; Fink, G. Development and validation of an early childhood development scale for use in low-resourced settings. Popul. Health Metr. 2017, 15, 3. [Google Scholar] [CrossRef] [Scilit] [PubMed]
  24. Waldman, M.; McCoy, D.C.; Seiden, J.; Cuartas, J.; CREDI Field Team; Fink, G. Validation of motor, cognitive, language, and socio-emotional subscales using the Caregiver Reported Early Development Instruments: An application of multidimensional item factor analysis. Int. J. Behav. Dev. 2021, 45, 368–377. [Google Scholar] [CrossRef] [Scilit]
  25. WHO. WHO AnthroPlus for Personal Computers Manual: Software for Assessing Growth of the World’s Children and Adolescents; World Health Organization: Geneva, Switzerland, 2009. [Google Scholar]
  26. De Onis, M.; Onyango, A.W. The WHO child growth standards. Pediatr. Nutr. Pract. 2008, 113, 254–269. [Google Scholar] [CrossRef] [Scilit]
  27. Riley, R.D.; Ensor, J.; Snell, K.I.E.; Harrell, F.E.; Martin, G.P.; Reitsma, J.B.; Moons, K.G.M.; Collins, G.; van Smeden, M. Calculating the sample size required for developing a clinical prediction model. BMJ 2020, 368, m441. [Google Scholar] [CrossRef] [Scilit] [PubMed]
  28. McCormick, B.J.J.; Lee, G.O.; Seidman, J.C.; Haque, R.; Mondal, D.; Quetz, J.; Lima, A.A.M.; Babji, S.; Kang, G.; Shrestha, S.K.; et al. Dynamics and Trends in Fecal Biomarkers of Gut Function in Children from 1–24 Months in the MAL-ED Study. Am. J. Trop. Med. Hyg. 2017, 96, 465–472. [Google Scholar] [CrossRef] [Scilit] [PubMed]
  29. Blair, C.; Raver, C.C. Poverty, Stress, and Brain Development: New Directions for Prevention and Intervention. Acad. Pediatr. 2016, 16, S30–S36. [Google Scholar] [CrossRef] [Scilit] [PubMed]
  30. Orgill-Meyer, J. The Evidence Base for Cognitive, Nutrition, and Other Benefits From Water, Sanitation, and Hygiene Interventions; Oxford University Press: Oxford, UK, 2022. [Google Scholar]
  31. Etheredge, A.J.; Manji, K.; Kellogg, M.; Tran, H.; Liu, E.; McDonald, C.M.; Kisenge, R.; Aboud, S.; Fawzi, W.; Bellinger, D.; et al. Markers of Environmental Enteric Dysfunction Are Associated With Neurodevelopmental Outcomes in Tanzanian Children. J. Pediatr. Gastroenterol. Nutr. 2018, 66, 953–959. [Google Scholar] [CrossRef] [Scilit] [PubMed]
  32. Donowitz, J.R.; Cook, H.; Alam, M.; Tofail, F.; Kabir, M.; Colgate, E.R.; Carmolli, M.P.; Kirkpatrick, B.D.; Nelson, C.A.; Ma, J.Z.; et al. Role of maternal health and infant inflammation in nutritional and neurodevelopmental outcomes of two-year-old Bangladeshi children. PLoS Neglected Trop. Dis. 2018, 12, e0006363. [Google Scholar] [CrossRef] [Scilit] [PubMed]
  33. Mitter, S.S.; Oriá, R.B.; Kvalsund, M.P.; Pamplona, P.; Joventino, E.S.; Mota, R.M.S.; Gonçalves, D.C.; Patrick, P.D.; Guerrant, R.L.; Lima, A.A.M. Apolipoprotein E4 influences growth and cognitive responses to micronutrient supplementation in shantytown children from northeast Brazil. Clinics 2012, 67, 11–18. [Google Scholar] [CrossRef] [Scilit] [PubMed]
  34. Jiang, N.M.; Tofail, F.; Moonah, S.N.; Scharf, R.J.; Taniuchi, M.; Ma, J.Z.; Hamadani, J.D.; Gurley, E.S.; Houpt, E.R.; Azziz-Baumgartner, E.; et al. Febrile illness and pro-inflammatory cytokines are associated with lower neurodevelopmental scores in Bangladeshi infants living in poverty. BMC Pediatr. 2014, 14, 50. [Google Scholar] [CrossRef] [Scilit] [PubMed]
Figure 1. Distribution of CREDI domain z-scores across age, sex and relationship with EED biomarkers. Kernel density histograms present the overall distribution and the accompanying boxplots are stratified by sex. Vertical lines show the mean scores for boys and girls.
Ijerph 23 01210 g001
Figure 2. Scatterplots showing the relationship between cognitive and overall CREDI domain z-scores with age and log-transformed EED biomarkers. Scatterplots are stratified by sex (purple = boys; green = girls). The grey bands show the 95% confidence interval of a basic linear regression line stratified by sex. Age measured in months. AAT; alpha-1-antitrypsin. NEO; neopterin. MPO; myeloperoxidase.
Ijerph 23 01210 g002
Table 1. Demographic, socio-economic, WASH, and EED biomarker descriptive statistics of the study sample. n = 119 infants. AAT; alpha-1-antitrypsin. NEO; neopterin. MPO; myeloperoxidase. Stunting prevalence defined as HAZ ≤ −2. 1 Reference concentrations derived from McCormick et al. (2017) [28] as follows: AAT (<27 mg/dL), NEO (<70 nmol/L), MPO (<2000 ng/mL).
n = 119 n (%)
Age in months at time of CREDI measurement—median and range 16.9 (10.8 to 24.1)
Female sex 56 (47.1)
Currently breastfed Baseline108 (90.8)
Follow-up99 (83.2)
Household average expenses per month <Rp. 1 million18 (15.0)
Rp. 1 to 2 million62 (51.7)
>Rp. 2 million40 (33.3)
Mother’s highest education Primary38 (31.9)
Middle school42 (35.3)
Secondary or higher39 (32.8)
Father’s occupation Farmer39 (32.5)
Manual labour28 (23.3)
Small/micro business20 (16.7)
Employee/Other31 (27.5)
At least one diarrhoeal episode in last 3-months Baseline40 (33.6)
Follow-up36 (30.3)
Consume ≥ 1.5 serves of animal-source foods daily Baseline56 (47.1)
Follow-up67 (56.3)
Stunting prevalence Baseline33 (27.7)
Follow-up24 (20.2)
Spring water source (vs. municipal) 84 (70.6)
Unimproved sanitation 44 (37.0)
Infant faeces disposed unsafely 36 (30.2)
Partial dirt/earth floors (vs. fully cemented/tiled) 35 (29.4)
Average daily play time soiled surfaces > 30 minBaseline30 (25.2)
Follow-up49 (41.2)
Father handles livestock or livestock faeces 44 (36.7)
Mother washes hands with soap before preparing meals 78 (65.5)
Infants’ foods are stored at room temperature for prolonged periods 59 (49.6)
Stool AAT elevated 1 Baseline75 (63.0)
Follow-up81 (68.7)
Stool NEO elevated 1 Baseline99 (83.2)
Follow-up94 (79.0)
Stool MPO elevated 1 Baseline79 (66.4)
Follow-up85 (71.4)
Table 2. Association between EED biomarkers and CREDI cognitive z-score. Results obtained from a linear regression model. Partially adjusted model is adjusted for the demographic, health and socio-economic covariates with EED biomarkers modelled iteratively. Fully adjusted model includes the partially adjusted model and HAZ, the WASH variables (WASH index score and average daily outdoor play time), as well as mutual adjustment for EED biomarkers at the same time point of measurement if p < 0.25. AAT; alpha-1-antitrypsin, NEO; neopterin, MPO; myeloperoxidase. Biomarkers are natural-log transformation of their concentrations in stool with the raw units AAT (mg/dL), NEO (nmol/L), MPO (ng/mL). 25th–75th percentiles: AAT (BL): 21.4 to 70.7 mg/dL, AAT (FU): 24.4 to 64.3 mg/dL, NEO (BL): 135.6 to 661.4 nmol/L, NEO (FU): 106.0 to 1041.3 nmol/L, MPO (BL): 1458.50 to 4276.0 ng/mL, MPO (FU): 1841.8 to 12,589.9 ng/mL.
Partially AdjustedFully Adjusted
B (95% CI)pB (95% CI)p
Comparison of upper and lower quartiles—reference = 25th–75th percentile
AAT (Baseline) < 25th 0.09 (−0.29, 0.48)0.630.08 (−0.29, 0.46)0.66
AAT (Baseline) > 75th0.16 (−0.23, 0.56)0.410.09 (−0.30, 0.47)0.65
AAT (Follow-up) < 25th 0.07 (−0.31, 0.45)0.720.05 (−0.33, 0.43)0.81
AAT (Follow-up) > 75th0.03 (−0.37, 0.42)0.900.07 (−0.32, 0.46)0.72
NEO (Baseline) < 25th 0.12 (−0.32, 0.55)0.600.08 (−0.34, 0.50)0.70
NEO (Baseline) > 75th−0.18 (−0.56, 0.20)0.34−0.11 (−0.48, 0.26)0.55
NEO (Follow-up) < 25th 0.17 (−0.21, 0.55)0.390.07 (−0.30, 0.45)0.70
NEO (Follow-up) > 75th−0.12 (−0.50, 0.27)0.55−0.17 (−0.54, 0.21)0.38
MPO (Baseline) < 25th −0.24 (−0.62, 0.14)0.22−0.11 (−0.48, 0.26)0.56
MPO (Baseline) > 75th−0.61 (−0.98, −0.23)<0.05−0.63 (−0.99, −0.26)<0.001
MPO (Follow-up) < 25th 0.002 (−0.38, 0.38)0.9960.05 (−0.32, 0.41)0.80
MPO (Follow-up) > 75th0.29 (−0.10, 0.68)0.150.41 (0.03, 0.79)<0.05
Disclaimer/Publisher’s Note: The statements, opinions and data contained in all publications are solely those of the individual author(s) and contributor(s) and not of MDPI and/or the editor(s). MDPI and/or the editor(s) disclaim responsibility for any injury to people or property resulting from any ideas, methods, instructions or products referred to in the content.