Article

Agreement Between Six-Minute Walk Test-Based Equations and Bruce-Derived Aerobic-Fitness Estimates in Adults with Metabolic Syndrome: A Single-City Cross-Sectional Method-Comparison Study


by
Anahy Ordóñez-Zea
1,
Alberto Urzúa
2,*,
Jorge Méndez-Cornejo
3,
Edgardo Rojas-Mancilla
4,
Carmen Zambrano-Bravo
5,
Esteban Oñate-Henríquez
6,
Trinidad Parada
7 and
Cristian Vidal-Silva
8,*
1
Facultad de Salud y Servicios Sociales, Universidad Estatal de Milagro (UNEMI), Milagro 091002, Ecuador
2
Escuela de Kinesiología, Facultad de Salud, Universidad Santo Tomás, Campus Talca, Talca 3460000, Chile
3
Department of Physical Activity Sciences, Faculty of Education Sciences, Universidad Católica del Maule, Talca 3460000, Chile
4
Fundación Arturo López Pérez OECI Cancer Center, Laboratorio Clínico, Santiago 7500000, Chile
5
Departamento de Ciencias del Movimiento Humano, Facultad de Ciencias de la Salud, Universidad de Talca, Talca 3460000, Chile
6
Departamento de Ergonomía, Facultad de Ciencias Biológicas, Universidad de Concepción, Concepción 4070386, Chile
7
Servicio Local de Educación Pública Los Álamos, Linares 3580000, Chile
8
Facultad de Ingeniería y Negocios, Universidad de Las Américas, Manuel Montt 948, Providencia, Santiago 7500975, Chile
*
Authors to whom correspondence should be addressed.
Int. J. Environ. Res. Public Health 2026, 23(9), 1170; https://doi.org/10.3390/ijerph23091170
Submission received: 31 July 2026 / Revised: 27 August 2026 / Accepted: 3 September 2026 / Published: 7 September 2026

Highlights

Public health relevance—How does this work relate to a public health issue?
  • Adults with metabolic syndrome require accessible assessment of functional capacity and aerobic fitness in community and primary-healthcare settings, where cardiopulmonary exercise testing may be unavailable.
  • Six-Minute Walk Test-based equations offer low-cost estimates, but their agreement with treadmill-duration-derived values must be evaluated before individual or programmatic use.
Public health significance—Why is this work of significance to public health?
  • Participant-level analyses showed systematic underestimation and wide limits of agreement for two equations expressed in mass-specific oxygen-uptake units.
  • A third equation produced percentage-predicted VO 2 p e a k and could not be interpreted on the same numerical scale as the Bruce-derived estimates.
Public health implications—What are the key implications or messages for practitioners, policy makers and/or researchers in public health?
  • Community programs should report observed 6MWT distance separately from equation-derived aerobic-fitness estimates.
  • Direct validation against measured oxygen uptake is required before the evaluated equations are used for exercise prescription, risk classification, surveillance, or resource-allocation decisions.

Abstract

Accessible assessment of aerobic fitness is important for adults with metabolic syndrome when cardiopulmonary exercise testing is unavailable. This study aimed to evaluate participant-level agreement between Six-Minute Walk Test (6MWT)-based equations and estimates derived from total Bruce treadmill duration. Using a single-city cross-sectional method-comparison design, 105 newly recruited adults, comprising 67 women and 38 men, completed standardized 6MWT and graded treadmill assessments. Agreement was evaluated using mean bias, mean absolute error (MAE), root mean square error (RMSE), Pearson correlation, calibration, proportional-bias regression, and Bland–Altman limits of agreement. Mean Bruce-derived estimated peak oxygen uptake ( VO 2 p e a k ) was 23.42 ± 1.87 mL·kg−1 · min−1. Model 1 produced 15.90 ± 1.72 , with a mean bias of 7.53 , an RMSE of 7.77, and limits of agreement from 11.29 to 3.76 . Model 3 produced 16.78 ± 3.28 , with a mean bias of 6.65 , an RMSE of 7.11, and limits from 11.60 to 1.70 . Both models systematically underestimated Bruce-derived values, and Model 3 showed proportional bias. Model 2 produced 99.31 ± 4.82 % on its original age- and sex-adjusted percentage-predicted scale. It was not converted to mass-specific units because the participant-specific reference values required for a valid back-conversion were unavailable. The observed bias and limits of agreement indicated that Models 1 and 3 did not achieve close participant-level agreement with the Bruce-derived approach. Validation against directly measured oxygen uptake remains necessary before clinical or public-health use.

1. Introduction

Metabolic syndrome (MetS) is a multifactorial cardiometabolic condition characterized by central adiposity, impaired glucose regulation, dyslipidemia, elevated blood pressure, insulin resistance, and interrelated vascular abnormalities [1,2,3]. Its worldwide prevalence and clinical burden have increased, although estimates vary according to population characteristics and diagnostic criteria [4,5]. MetS is associated with type 2 diabetes mellitus, cardiovascular disease, chronic kidney disease, functional decline, and premature mortality [6,7,8]. Prevention, early identification, functional assessment, and integrated management are, therefore, important priorities for public health and primary healthcare [9,10].
Reduced cardiorespiratory fitness and impaired physical function are frequently observed among adults with obesity, insulin resistance, and related metabolic abnormalities [11,12,13]. Cardiorespiratory fitness is also a strong predictor of cardiovascular morbidity, chronic-disease outcomes, and all-cause mortality [14,15]. Cardiopulmonary exercise testing (CPET) provides the most comprehensive physiological assessment of aerobic capacity, but its equipment, personnel, participant-preparation, and laboratory requirements limit routine availability in community programs, primary healthcare, and resource-constrained settings [16,17]. Field tests and prediction equations are consequently used when direct measurement of oxygen uptake is unavailable [18,19].
The Six-Minute Walk Test (6MWT) is an inexpensive and practical assessment of submaximal functional performance across diverse clinical populations [18,19,20]. Its directly observed outcome is walking distance rather than oxygen uptake. Equations have nevertheless been proposed to convert 6MWT distance and related demographic, anthropometric, and cardiovascular variables into estimated aerobic-fitness indicators [21,22]. Such conversion may be useful when direct physiological measurement is unavailable, but equation performance depends on the derivation population, predictor definitions, output scale, test implementation, and external validation [19,23].
The performance of a 6MWT-based prediction equation should not be assumed to remain unchanged across clinical populations. The equations proposed by Cahalin et al. were derived in patients with advanced heart failure, whereas the present sample comprised adults with MetS who were screened to exclude unstable cardiovascular disease [21]. Differences in clinical setting, exercise-limiting factors, test implementation, and the definition and timing of equation inputs can influence model performance [18,19]. Consequently, applying an equation outside its derivation context requires explicit assessment of calibration and participant-level agreement, and a plausible group mean or significant correlation does not by itself demonstrate small individual error [24,25].
Accordingly, this study aimed to evaluate participant-level agreement and error of selected 6MWT-based aerobic-fitness equations in adults with MetS. Specifically, it sought to compare mass-specific estimates from Models 1 and 3 with sex-specific estimates derived from total Bruce treadmill duration; quantify mean bias, mean absolute error (MAE), root mean square error (RMSE), Pearson correlation, calibration, and Bland–Altman limits of agreement; examine proportional bias and sex-stratified performance; and describe separately the percentage-predicted output produced by Model 2. Because respiratory gas exchange was not measured, the comparison was intended to assess agreement with an indirect Bruce-derived comparator rather than physiological validity against directly measured peak oxygen uptake ( VO 2 p e a k ).

2. Materials and Methods

2.1. Participants

Adults aged 40–65 years were recruited between March and November 2025 from three primary-healthcare centers and a community cardiometabolic-health program in Talca, Chile. Eligibility required fulfillment of the modified National Cholesterol Education Program Adult Treatment Panel III criteria for MetS [3,6]. Exclusion criteria comprised unstable cardiovascular disease, resting systolic blood pressure above 180 mmHg or diastolic blood pressure above 110 mmHg, acute respiratory disease, severe musculoskeletal or neurological limitations, pregnancy, cognitive impairment affecting comprehension of the testing instructions, and any medical condition considered incompatible with safe completion of the 6MWT or graded treadmill assessment.
Participant flow from eligibility assessment to analytical inclusion is summarized in Table 1. The final analytical sample comprised 105 adults, including 67 women (63.8%) and 38 men (36.2%). Inclusion in the analytical sample additionally required complete 6MWT and Bruce treadmill assessments and availability of all variables needed to calculate the evaluated equations (Table 2). Mean age was 54.0 ± 5.7 years; mean body mass index was 31.2 ± 3.3 kg·m−2; and mean waist circumference was 105.0 ± 8.2 cm. Complete demographic, anthropometric, resting-hemodynamic, and exercise-test characteristics are presented in Table 3. The analysis included all participants who completed both exercise assessments and had the variables required for the evaluated equations during the predefined recruitment period, and no formal a priori sample-size calculation was performed.
The analytical dataset contained demographic, anthropometric, resting-hemodynamic, and exercise-test variables. It did not contain structured participant-level fields for smoking status, joint disease, chronic pulmonary disease, cancer history, antidepressant use, or frailty. These characteristics could, therefore, not be summarized or included as covariates. The study was conducted in accordance with the Declaration of Helsinki and was approved by the Scientific Ethics Committee of the Maule Health Service, Chile (Approval Code: CEC-SSM-2025-021; Date of Approval: 22 January 2025). Participant recruitment began only after ethical approval had been obtained. All participants received written and verbal information about the study and provided written informed consent before enrollment and completion of the exercise assessments.
Table 1. Participant flow from eligibility assessment to analytical inclusion.
Recruitment StageNumber
Adults assessed for eligibility124
Excluded before exercise testing14
   Did not meet MetS criteria7
   Uncontrolled hypertension3
   Musculoskeletal limitation2
   Declined participation2
Participants initiating exercise assessments110
   Incomplete Bruce treadmill assessment3
   Incomplete 6MWT1
   Missing equation input1
Final analytical sample105
All participants included in the analytical sample had complete 6MWT, Bruce treadmill, demographic, anthropometric, blood-pressure, and heart-rate information.

2.2. Study Design

A cross-sectional method-comparison design was used in a cohort recruited in Talca, Chile. All participants completed a standardized 6MWT and a graded Bruce treadmill assessment, allowing participant-level comparison between aerobic-fitness estimates generated from the evaluated 6MWT-based equations and estimates derived from total treadmill duration. The order of the two exercise assessments was determined using a computer-generated random sequence. Tests were conducted 48–72 h apart and at approximately the same time of day for each participant to reduce the potential influence of fatigue, recovery, and diurnal variation. Participants were instructed to maintain their usual medication schedule and avoid vigorous physical activity, alcohol consumption, and large meals during the 24 h preceding each assessment.

2.3. Six-Minute Walk Test

Functional capacity was assessed using the 6MWT, a practical field-based assessment of submaximal exercise performance [18,20,22]. The assessment was conducted on a flat, level, and unobstructed 30 m walking course with turning points identified using floor markings and signaling cones. Participants wore comfortable clothing and walking shoes, avoided food intake during the two hours preceding the assessment, and rested for 10–15 min before testing. Participants were instructed to walk, without running, as far as possible during six minutes at a self-selected pace. Total walking distance was recorded in meters using a Roto-Sure 1000 Range distance-measuring wheel (Roto-Plastics (Pty) Ltd., Boksburg, South Africa), and test duration was controlled using digital stopwatches (Casio Computer Co., Ltd., Tokyo, Japan). Heart rate, systolic and diastolic blood pressure, peripheral oxygen saturation, symptoms, and clinical responses were assessed before and immediately after the test by trained healthcare personnel. Blood pressure was evaluated using a manual sphygmomanometer (Welch Allyn, Inc., Skaneateles Falls, NY, USA) and a Littmann stethoscope (3M Health Care, St. Paul, MN, USA), and peripheral oxygen saturation was assessed using a Model 8600 pulse oximeter (Nonin Medical, Inc., Plymouth, MN, USA). Total 6MWT distance was treated as the directly observed functional outcome. Because the test did not include respiratory gas analysis, walking distance was not interpreted as a direct measurement of oxygen uptake.

2.4. Bruce Treadmill Protocol

The standard Bruce treadmill protocol was performed on a motorized treadmill (Trackmaster TMX428, Full Vision Inc., Newton, KS, USA) and consisted of successive three-minute stages with progressive increases in treadmill speed and grade, producing a continuous incremental workload until symptom-limited termination [26,27]. Testing continued until volitional exhaustion, participant request to stop, or termination by the supervising healthcare professional because of symptoms or an abnormal clinical response. Respiratory gas exchange was not measured. Therefore, the resulting values represented treadmill-duration-derived estimates rather than directly measured VO 2 m a x or VO 2 p e a k [16,17]. Estimated relative VO 2 p e a k was calculated from total treadmill duration T in minutes using the sex-specific equations documented in the study protocol:
VO ^ 2 p e a k = 8.33 + 2.94 T , for men ,
VO ^ 2 p e a k = 8.05 + 2.74 T , for women .
Equation (1) was applied to the 38 men and Equation (2) was applied to the 67 women. The resulting estimates were expressed in mL·kg−1 · min−1 and are referred to throughout the manuscript as Bruce-derived estimated relative VO 2 p e a k . The Bruce-duration-derived estimate was selected as the analytical comparator because all participants completed the same standardized graded treadmill protocol and the sex-specific duration equations produced mass-specific estimates on the same numerical scale as Models 1 and 3. It provided a laboratory-based estimate derived independently of the 6MWT inputs. However, because respiratory gas exchange was not measured, it was treated as an indirect comparison method rather than a physiological criterion standard.

2.5. Six-Minute Walk Test-Based Equations

Three models were evaluated. Models 1 and 2 incorporated 6MWT distance, age, body weight, height, and a scaled resting rate–pressure product, whereas Model 3 used mean walking speed. For Models 1 and 2, the scaled rate–pressure product was calculated as RPP s = [ SBP rest × HR rest ] × 10 3 using systolic blood pressure and heart rate measured after the standardized 10–15 min seated rest period and before participants received the final instructions for the 6MWT. Distance entered Models 1 and 2 directly, whereas for Model 3 it was converted to mean walking speed as V = D / 6 in m·min−1. Because resting rather than exercise-related hemodynamic measurements were used, Models 1 and 2 were evaluated as adapted resting-hemodynamic implementations of the archived equations. Table 2 records the equations, input definitions, output scales, and source of each model. Resting hemodynamic inputs were used because they were the only participant-level systolic blood pressure and heart rate values available in the analytical dataset. Although post-6MWT hemodynamic responses were assessed for clinical safety, the participant-level post-test values required to recalculate Models 1 and 2 using the original exercise-related input definition were not available in the analytical dataset. Consequently, the requested sensitivity analysis using post-6MWT rate–pressure product could not be performed, and Models 1 and 2 remain explicitly identified as adapted resting-hemodynamic implementations. Models 1 and 3 generated outputs expressed in the same mass-specific unit as the Bruce-derived estimates and were, therefore, included in the participant-level agreement analyses. Model 2 was originally developed to estimate age- and sex-adjusted percentage-predicted VO 2 p e a k rather than VO 2 p e a k in mL·kg−1 · min−1 [21]. Converting its output to a mass-specific estimate would require the participant-specific reference value represented by 100% predicted VO 2 p e a k , according to VO ^ 2 p e a k , i = ( P i / 100 ) × VO 2 p e a k , reference , i . Within the original percentage-predicted construct, 100% represents equality with the participant-specific age- and sex-adjusted reference value used to define the original model output. Values above or below 100% indicate a proportion of that reference value. They do not represent directly measured oxygen uptake and do not indicate agreement with the Bruce-derived estimate. The required reference values and the complete implementation of the original age- and sex-adjusted reference equation were not available in the present dataset or archived study documentation. Applying the Bruce-derived estimate or a different normative equation as the reference would alter the construct and create a new hybrid calculation. Model 2 was, therefore, retained on its original percentage-predicted scale and summarized separately.
Table 2. Six-Minute Walk Test-based models and output scales.
ModelEquationOutputSource
Model 1 VO ^ 2 p e a k = 0.02 D 0.191 A 0.07 W + 0.09 H + 0.26 RPP s + 2.45 Estimated relative VO 2 p e a k (mL·kg−1 · min−1) [21]
Model 2 % VO ^ 2 p e a k = 0.05 D 0.22 A + 0.27 W + 0.14 H + 0.78 RPP s + 26.16 Age- and sex-adjusted percentage-predicted VO 2 p e a k (%) [21]
Model 3 VO ^ 2 = 0.10 V + 3.5 for 50 V 100 ; VO ^ 2 = 0.15 V + 3.5 for 100 < V 130 m·min−1Historical speed-based estimate (mL·kg−1 · min−1) [26]
D denotes 6MWT distance (m); A, age (years); W, body weight (kg); H, height (cm); RPP s , scaled resting rate–pressure product; SBP rest , resting systolic blood pressure; HR rest , resting heart rate; and V, mean walking speed in m·min−1.
The original primary derivation source for the piecewise coefficients used in Model 3 was not independently recovered beyond the historical doctoral documentation. Its derivation sample, coefficient-estimation procedure, residual error, validation status, and intended population, therefore, could not be verified. Moreover, the change from a coefficient of 0.10 to 0.15 above 100 m·min−1 creates a discontinuity at a 6MWT distance of 600 m. Model 3 was consequently included as an evaluation of a historical conversion used in previous local analyses rather than as external validation of a fully documented prediction model. A post hoc exploratory sensitivity analysis summarized its performance separately for participants at or below and above the speed threshold.

2.6. Statistical Analysis

The primary analytical outcomes were participant-level mean bias and 95% limits of agreement for Models 1 and 3 relative to the sex-specific Bruce-derived estimates. Secondary analytical outcomes included mean absolute error (MAE), root mean square error (RMSE), Pearson correlation, calibration intercept and slope, proportional bias, and sex-stratified performance. Bias was defined as the equation-derived estimate minus the corresponding Bruce-derived estimate. Negative values, therefore, indicated underestimation relative to the comparator. No clinically acceptable agreement threshold or equivalence margin was defined before the analysis. Accordingly, the analyses were used to characterize participant-level agreement and error and were not interpreted as demonstrating numerical equivalence between the 6MWT-based and Bruce-derived estimates. No formal a priori sample-size calculation was performed for the agreement analyses. Sample adequacy was, therefore, considered in terms of the achieved precision of the principal complete-sample estimates rather than through post hoc statistical power. With 105 paired observations, the 95% confidence-interval half-width for mean bias was 0.37 mL·kg−1 · min−1 for Model 1 and 0.49 mL·kg−1 · min−1 for Model 3. This precision supports estimation of complete-sample average bias but does not establish equivalence or definitive external validity. The sex-stratified analyses, comprising 67 women and 38 men, were exploratory and were not independently powered for between-sex comparisons. Participant characteristics and exercise-test outcomes were summarized for the complete sample and separately for women and men. Continuous variables were reported as mean and standard deviation, and categorical variables were summarized as frequencies and percentages. Distributional assumptions were evaluated using the Shapiro–Wilk test, histograms, and quantile–quantile plots. All comparisons between Models 1 and 3 and the Bruce-derived estimates were based on paired participant-level observations. Mean bias, MAE, and RMSE were calculated to quantify the direction and magnitude of individual discrepancies. Paired-samples Student’s t-tests were used to compare equation-derived and Bruce-derived estimates because the paired differences showed no substantial departure from normality. Associations were examined using Pearson’s correlation coefficient. Because correlation does not demonstrate agreement, Bland–Altman analyses were used to estimate mean bias and 95% limits of agreement [24]. Proportional bias was evaluated by regressing participant-level differences on the corresponding pairwise means. Calibration was explored using ordinary least-squares linear regression, with the equation-derived estimate as the dependent variable and the Bruce-derived estimate as the predictor:
VO ^ 2 p e a k , model , i = α + β VO ^ 2 p e a k , Bruce , i + ε i .
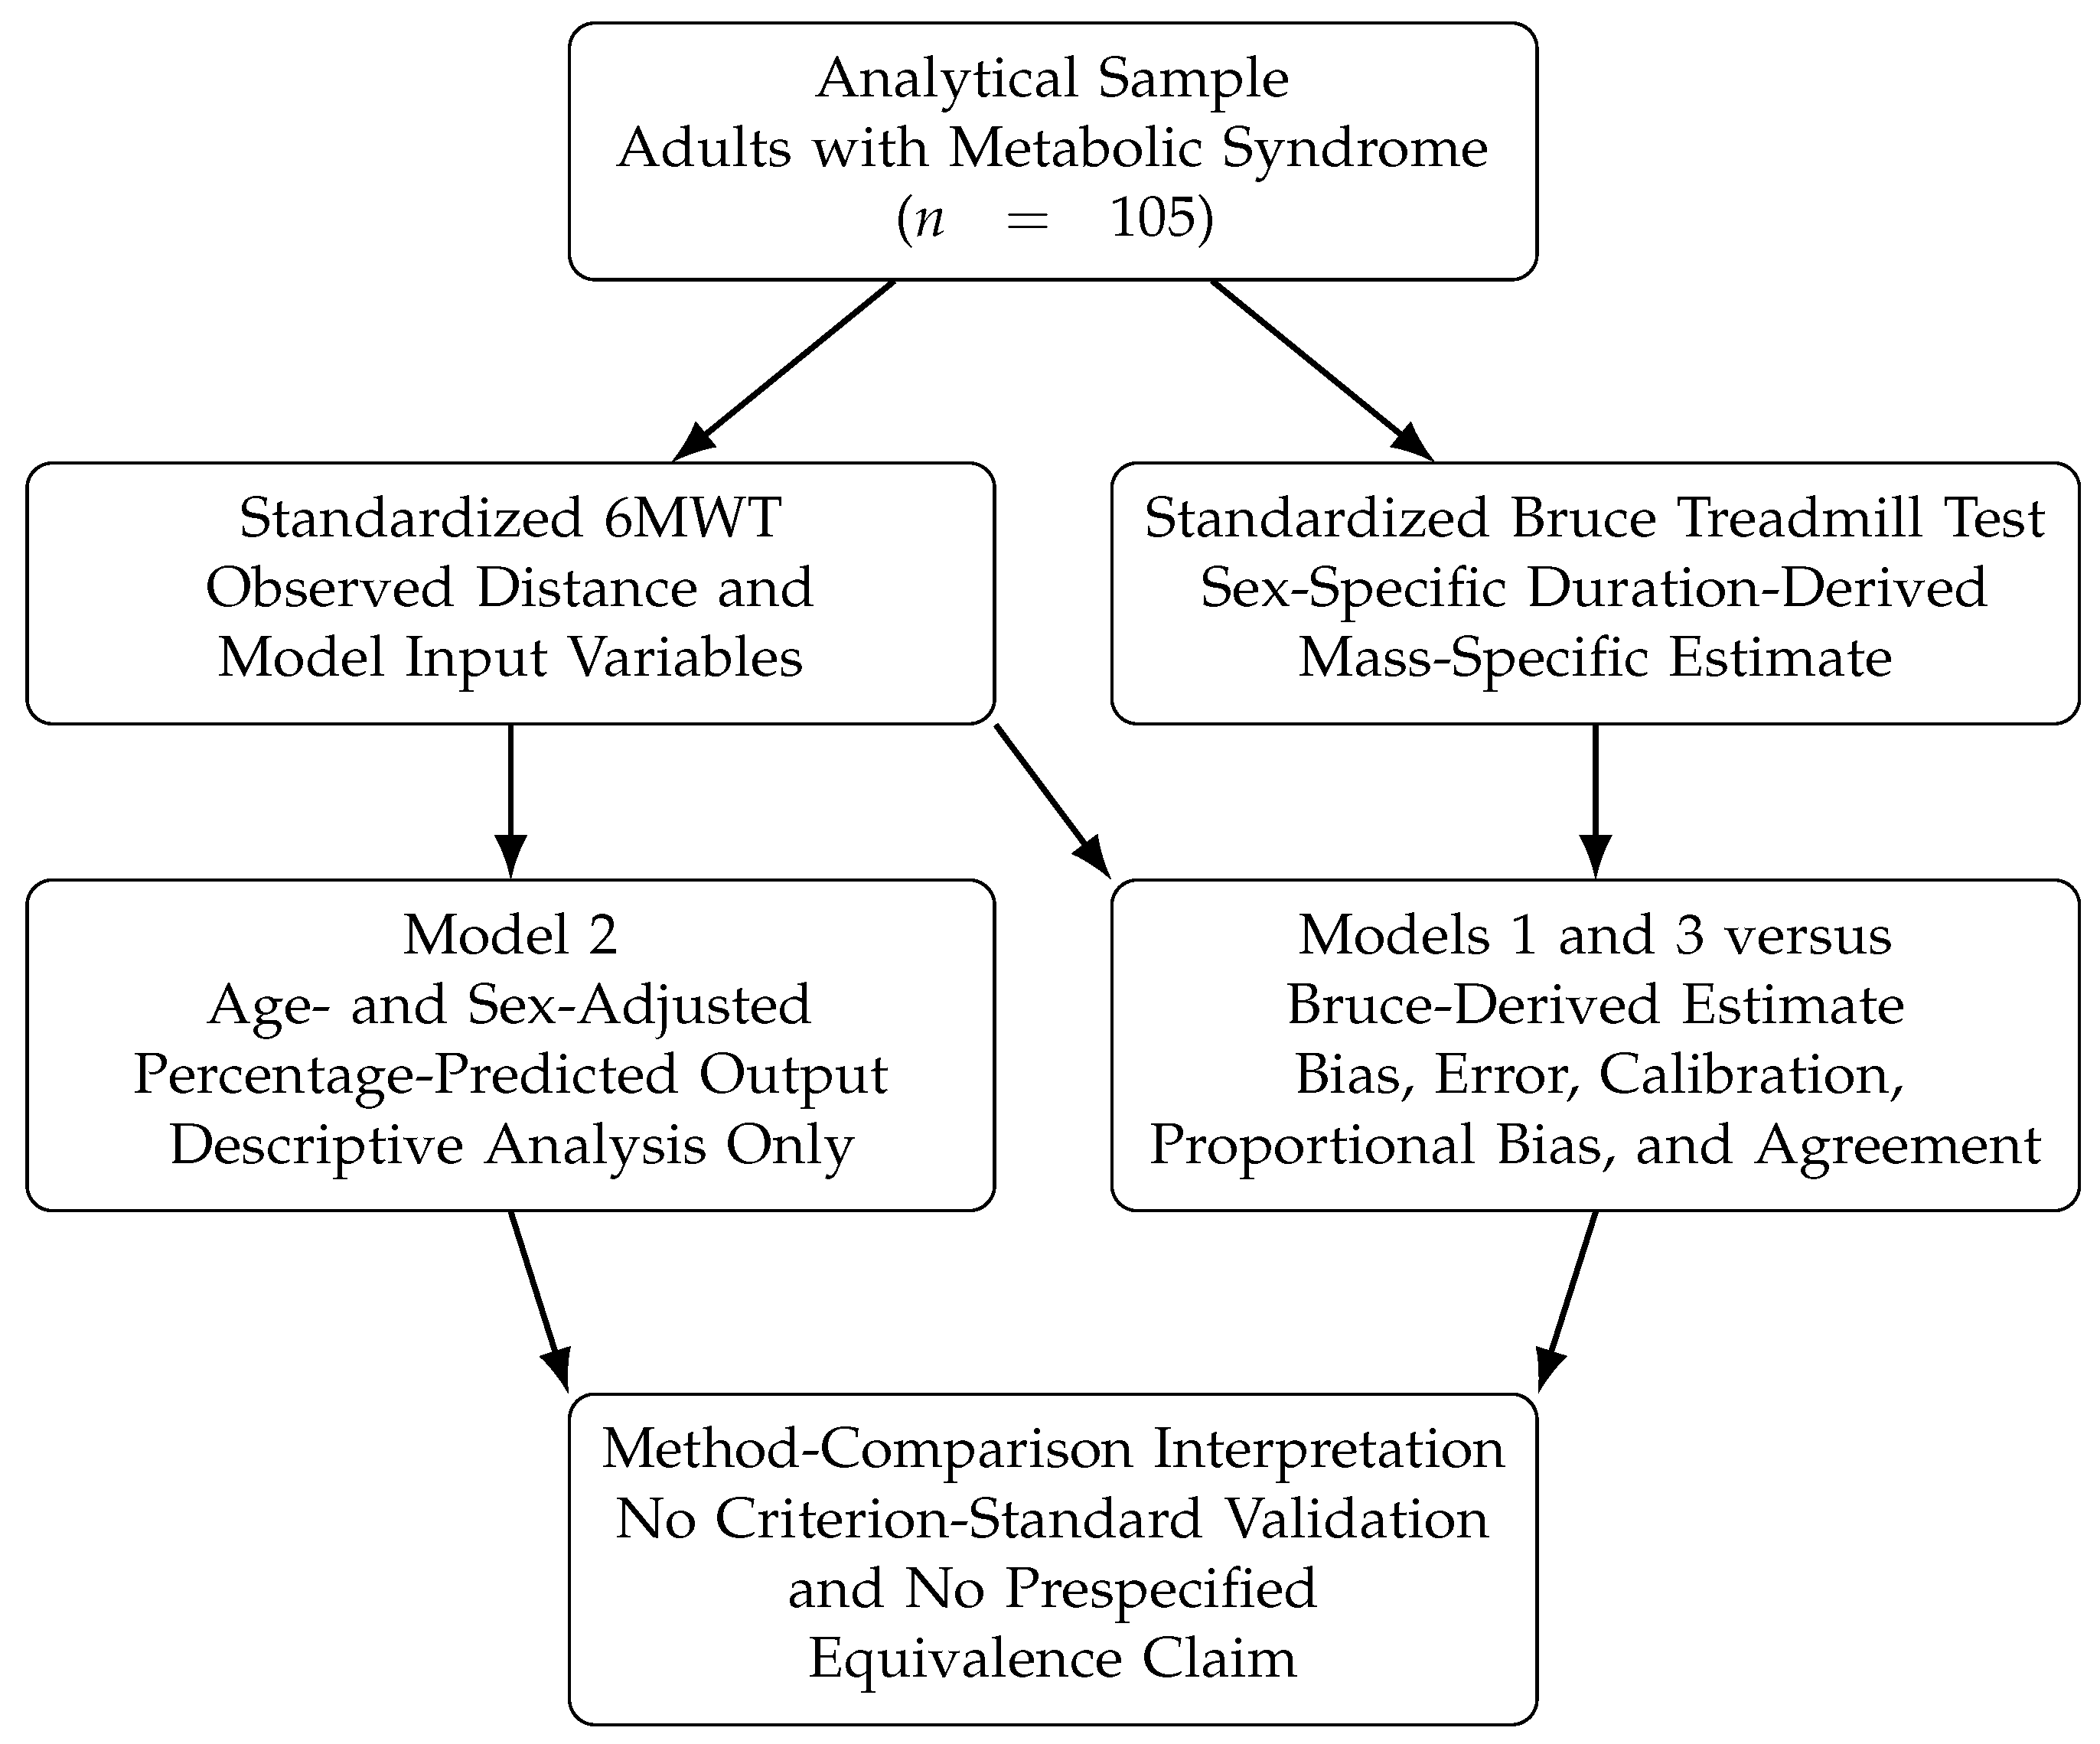
The calibration intercept α and slope β were reported with 95% confidence intervals. Relative to the indirect Bruce-derived comparator, ideal calibration would correspond to α = 0 and β = 1 [25]. Analyses were conducted for the complete sample and separately for women and men. Differences in mean bias between women and men were evaluated using Welch’s independent-samples t-tests. A post hoc exploratory analysis compared Model 3 bias between participants assigned to the two speed branches. Because branch allocation was determined by observed walking speed rather than random assignment, this comparison was interpreted descriptively and was not used to isolate the causal effect of the piecewise-equation threshold. Model 2 was summarized descriptively for the complete sample and separately for women and men on its original age- and sex-adjusted percentage-predicted scale. No conversion to mL·kg−1 · min−1 was performed because the participant-specific reference values represented by 100% predicted VO 2 p e a k were unavailable. Using the Bruce-derived estimates as the reference for this conversion would have incorporated the comparator into the converted Model 2 values and introduced mathematical dependence between the two methods. Consequently, no direct error, calibration, or Bland–Altman analysis was conducted between Model 2 and the Bruce-derived estimates. Statistical analyses were performed using IBM SPSS Statistics, version 29.0 (IBM Corp., Armonk, NY, USA), and R, version 4.4.2 (R Foundation for Statistical Computing, Vienna, Austria). All tests were two-sided, and statistical significance was established at p < 0.05 . Reporting was informed by established principles for transparent evaluation of prediction models, while recognizing that the present study compared existing equations and did not develop a new model [28]. The overall methodological and analytical workflow is summarized in Figure 1.

3. Results

3.1. Participant Flow and Characteristics

Participant flow from eligibility assessment to analytical inclusion is reported in Table 1, and the demographic, anthropometric, resting-hemodynamic, and exercise-test characteristics of the analytical sample are summarized in Table 3. No serious adverse events occurred during either exercise assessment. Bruce treadmill assessments terminated because of fatigue or dyspnea were stopped according to the prespecified safety criteria, symptoms resolved during supervised recovery, and no emergency medical intervention was required.
Table 3. Characteristics of the newly recruited participants.
VariableTotal ( n = 105 )Women ( n = 67 )Men ( n = 38 )
Age (years) 54.0 ± 5.7 53.3 ± 5.6 55.4 ± 5.6
Body weight (kg) 86.3 ± 11.7 82.2 ± 10.7 93.5 ± 9.9
Height (cm) 166.1 ± 8.6 161.2 ± 5.1 174.8 ± 6.3
Body mass index (kg·m−2) 31.2 ± 3.3 31.6 ± 3.5 30.6 ± 2.9
Body mass index category, n (%)
   Overweight (25.0–29.9 kg·m−2)42 (40.0)24 (35.8)18 (47.4)
   Obesity class I (30.0–34.9 kg·m−2)48 (45.7)31 (46.3)17 (44.7)
   Obesity class II (35.0–39.9 kg·m−2)15 (14.3)12 (17.9)3 (7.9)
   Obesity class III (≥ 40.0 kg·m−2)0 (0.0)0 (0.0)0 (0.0)
Waist circumference (cm) 105.0 ± 8.2 103.7 ± 8.2 107.4 ± 7.7
Resting heart rate (beats·min−1) 75.1 ± 6.9 75.3 ± 7.1 74.8 ± 6.5
Systolic blood pressure (mmHg) 137.8 ± 10.3 137.5 ± 10.7 138.2 ± 9.8
Diastolic blood pressure (mmHg) 84.8 ± 6.7 84.4 ± 6.4 85.3 ± 7.2
6MWT distance (m) 608.2 ± 44.6 595.3 ± 40.3 631.0 ± 43.3
Bruce treadmill duration (min) 5.42 ± 0.50 5.21 ± 0.39 5.79 ± 0.45
Bruce-derived VO 2 p e a k 23.42 ± 1.87 22.33 ± 1.08 25.36 ± 1.33
Continuous variables are reported as mean ± standard deviation, and body mass index categories are reported as n (%). Bruce-derived VO2peak is expressed in mL·kg−1·min−1.

3.2. Six-Minute Walk and Bruce Treadmill Performance

Observed 6MWT and Bruce treadmill performance outcomes are summarized for the complete sample and by sex in Table 3. Bruce-derived and compatible equation-based mean estimates are reported in Table 4 and Table 5.

3.3. Participant-Level Comparison of Compatible Estimates

Complete-sample mean estimates and participant-level agreement results are summarized in Table 4. Models 1 and 3 systematically underestimated the Bruce-derived comparator. Although Model 3 showed a smaller average error than Model 1, neither model achieved close participant-level agreement.

3.4. Agreement, Proportional Bias, and Calibration

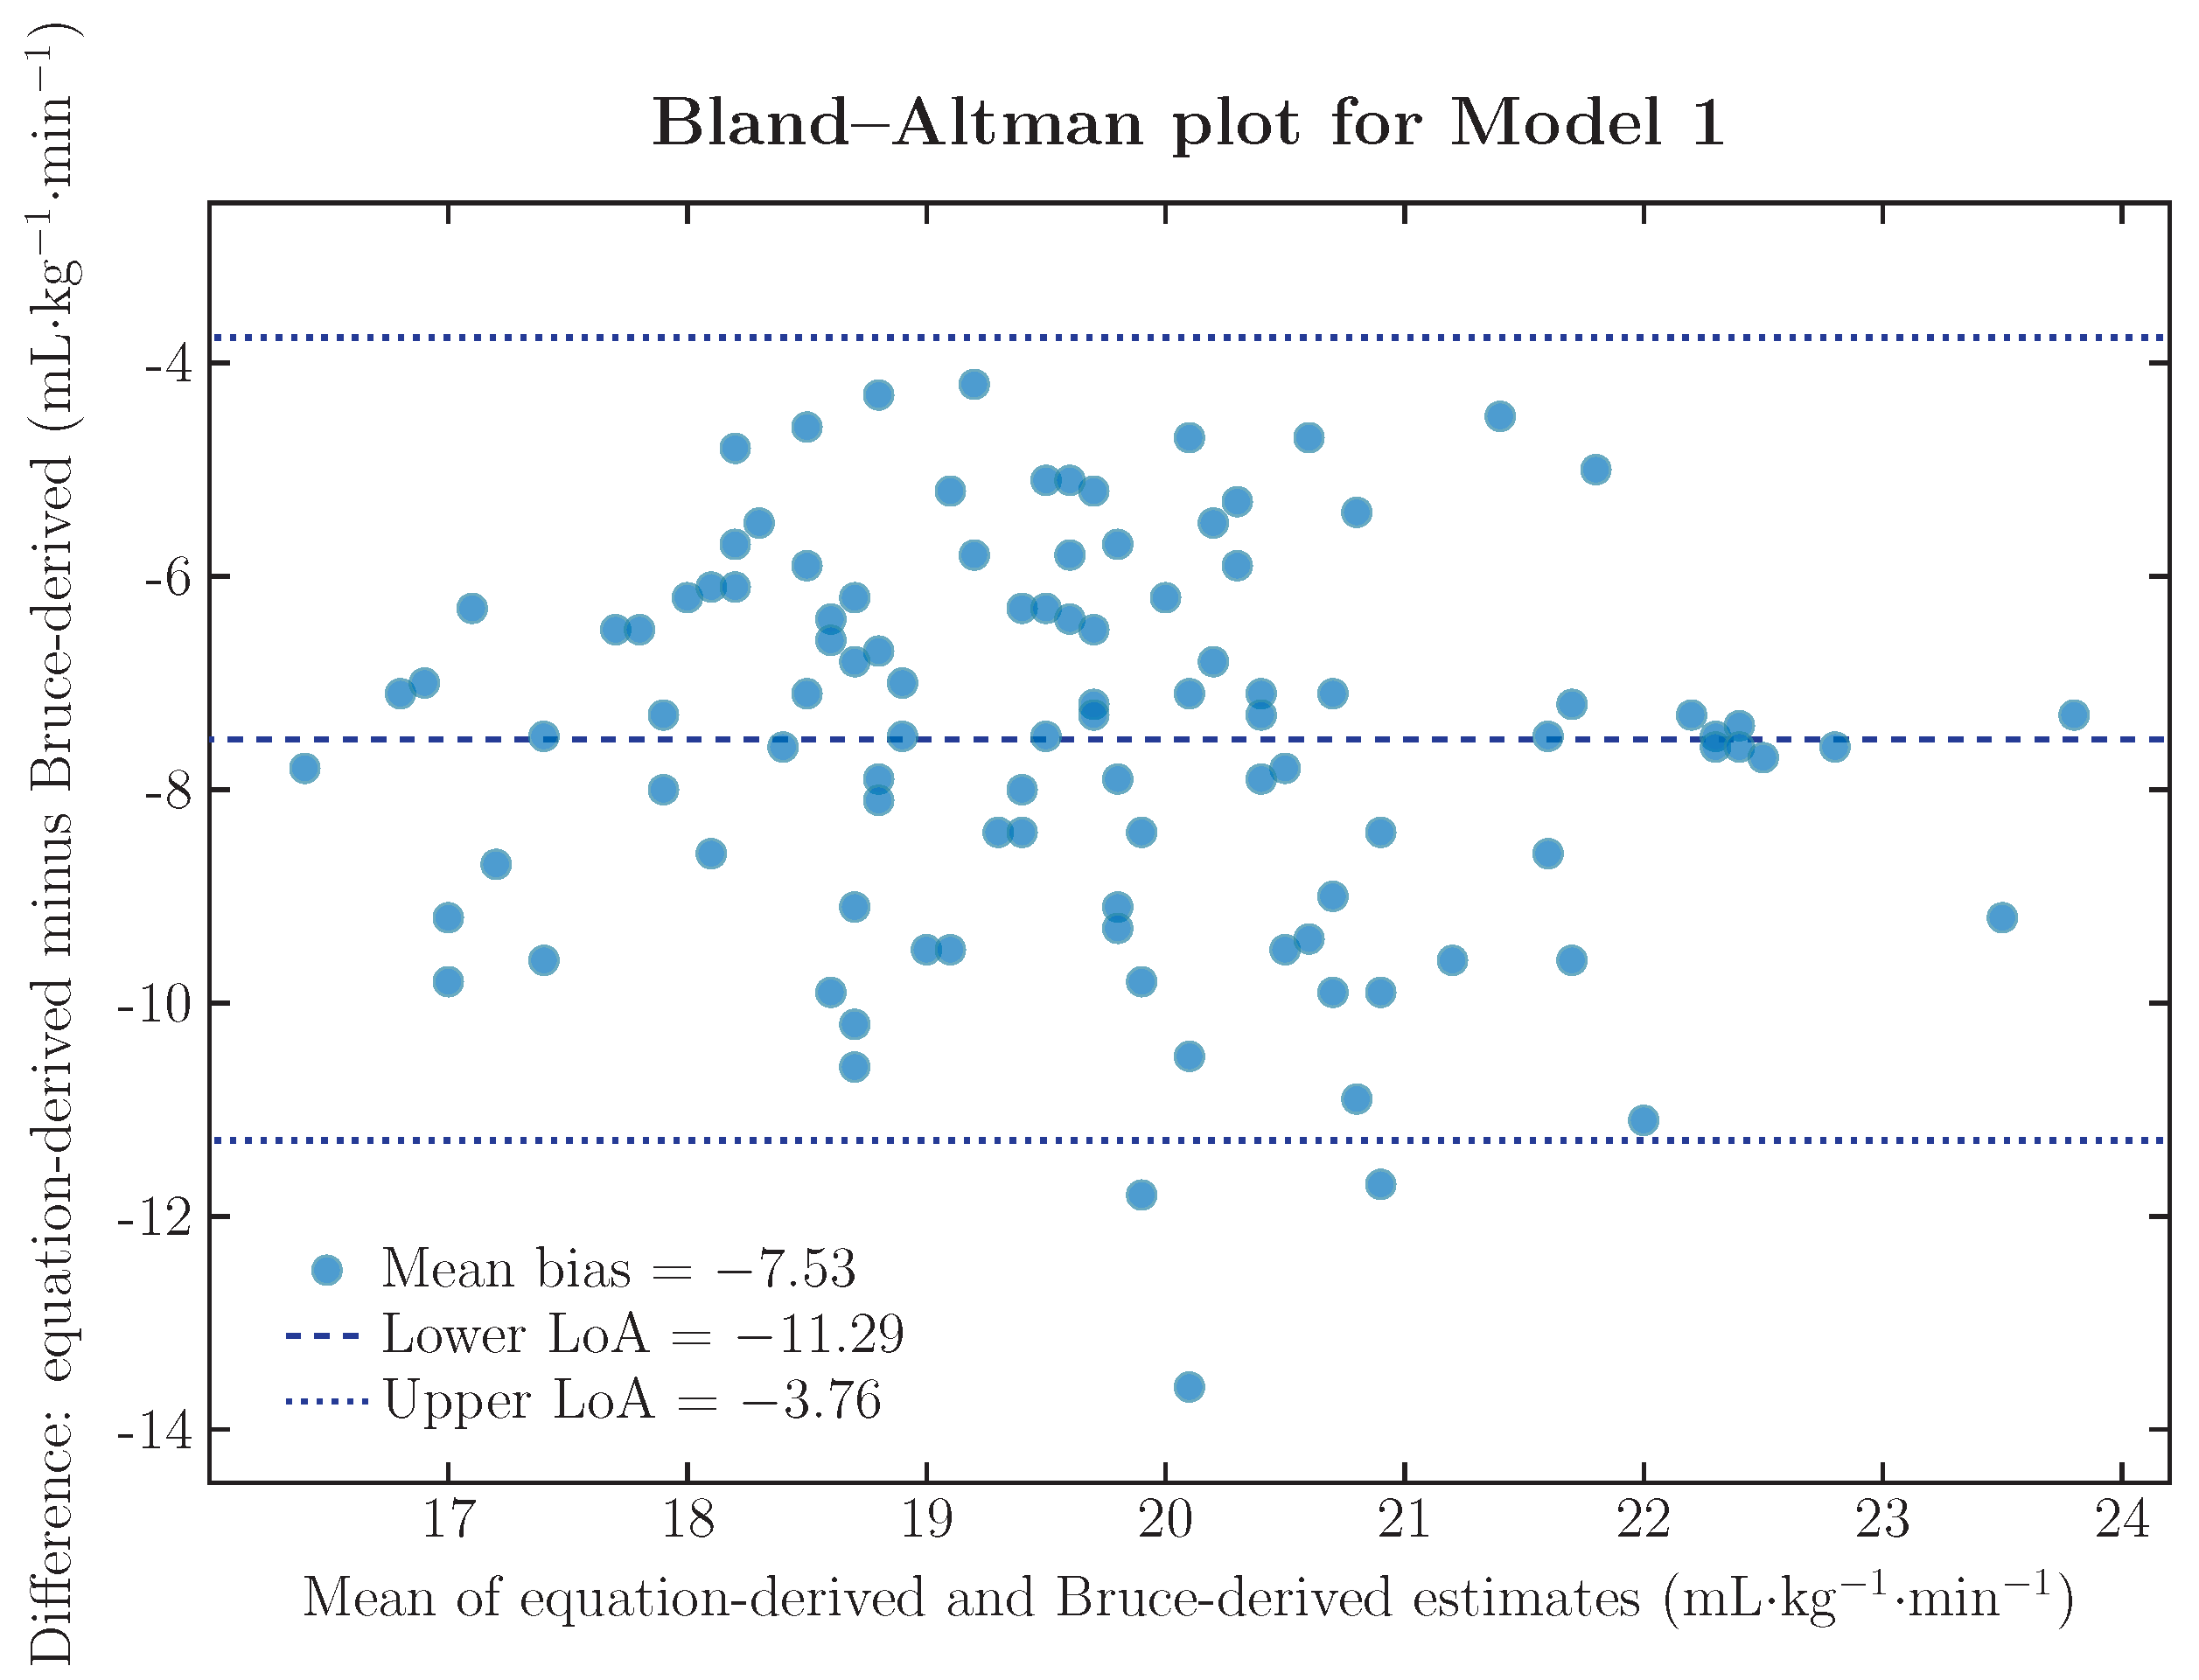
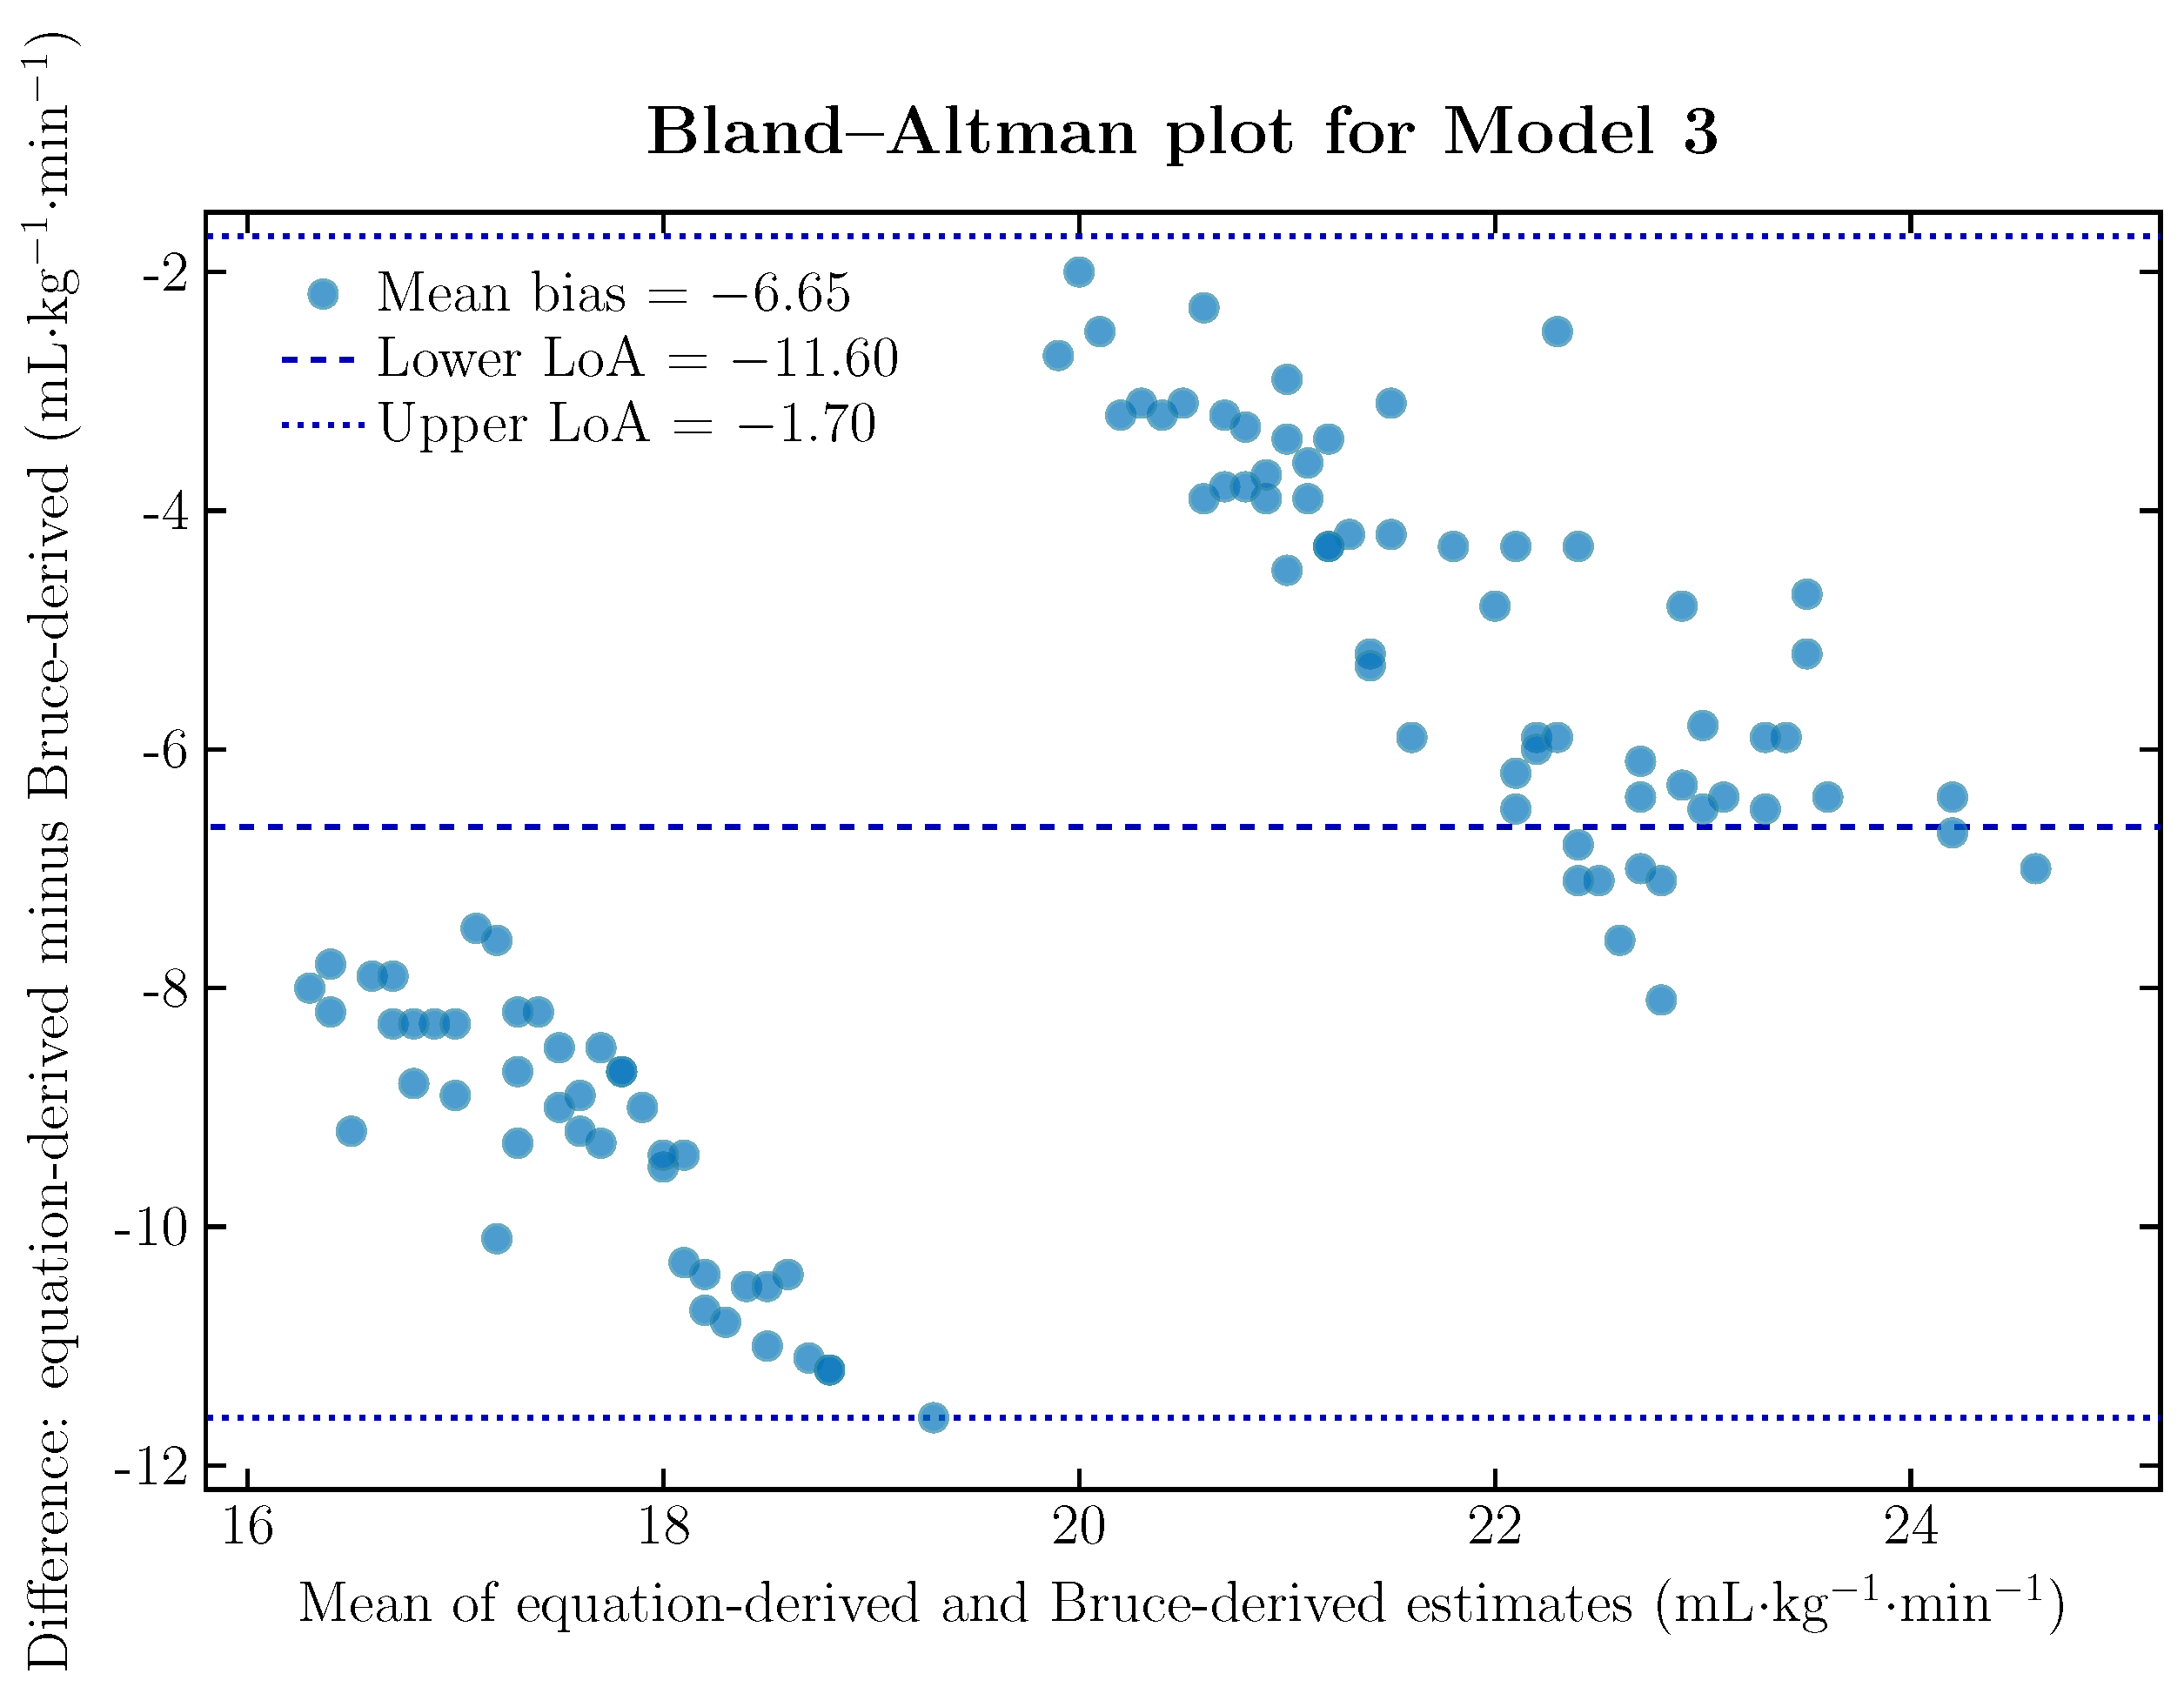
Agreement, proportional-bias, and calibration results are reported in Table 4 and visualized in Figure 2 and Figure 3. Model 1 showed systematic but comparatively uniform underestimation across the observed range. Model 3 showed a stronger association with the comparator but also marked proportional bias, indicating that the magnitude of its error changed across the measurement range.

3.5. Sex-Stratified Analyses

Sex-stratified estimates and agreement statistics are summarized in Table 5. Both models underestimated the Bruce-derived comparator among women and men, and the 95% confidence intervals for mean bias excluded zero in every subgroup. For Model 1, the between-sex difference in mean bias was more negative among men, and its confidence interval excluded zero. For Model 3, the confidence interval for the corresponding between-sex difference included zero. These analyses remain exploratory because the male subgroup was relatively small and the comparisons were not independently powered.
Table 5. Exploratory sex-stratified aerobic-fitness estimates and participant-level agreement relative to the Bruce-derived comparator.
MetricModel 1Model 3
Women ( n = 67 )
Bruce-derived comparator, mean ± SD 22.33 ± 1.08
Model estimate, mean ± SD 15.63 ± 1.62 15.93 ± 3.22
Mean bias (95% CI) 6.70 ( 7.09 to 6.32 ) 6.40 ( 7.07 to 5.74 )
MAE6.706.40
RMSE6.886.95
Pearson correlation, r0.3730.596
95% limits of agreement 9.79 to 3.61 11.74 to 1.07
Men ( n = 38 )
Bruce-derived comparator, mean ± SD 25.36 ± 1.33
Model estimate, mean ± SD 16.37 ± 1.81 18.27 ± 2.84
Mean bias (95% CI) 8.98 ( 9.51 to 8.46 ) 7.08 ( 7.77 to 6.39 )
MAE8.987.08
RMSE9.127.38
Pearson correlation, r0.5280.720
95% limits of agreement 12.09 to 5.88 11.20 to 2.97
Estimates, bias, MAE, RMSE, and limits of agreement are expressed in mL·kg−1 · min−1. CI, confidence interval; MAE, mean absolute error; RMSE, root mean square error; SD, standard deviation. The between-sex difference in mean bias, calculated as men minus women, was 2.28 (95% CI: 2.92 to 1.64 ; p < 0.001 ) for Model 1 and 0.68 (95% CI: 1.62 to 0.26; p = 0.156 ) for Model 3. These comparisons were exploratory.

3.6. Post Hoc Model 3 Threshold Analysis

The post hoc comparison of the two Model 3 speed branches is summarized in Table 6. The branches showed different error distributions, but their non-random composition prevents separation of the numerical effect of the equation threshold from differences in participant characteristics and functional performance.

3.7. Age- and Sex-Adjusted Percentage-Predicted Output from Model 2

Model 2 outputs on their original age- and sex-adjusted percentage-predicted scale are summarized in Table 7. These values were retained on their original scale because the participant-specific reference values required for conversion to mL·kg−1 · min−1 were unavailable. Model 2 was, therefore, not included in the direct error, calibration, or Bland–Altman analyses against the Bruce-derived estimates.

4. Discussion

4.1. Principal Findings

The present single-city cross-sectional method-comparison study evaluated 6MWT-based aerobic-fitness equations using complete paired observations from 105 newly recruited adults with MetS. Models 1 and 3 produced estimates substantially below the sex-specific Bruce-duration-derived estimates. Model 3 showed a smaller mean negative bias and slightly lower RMSE than Model 1, but its wider limits of agreement and marked proportional bias indicated considerable participant-level variability. Model 1 showed more uniform underestimation across the observed range but was implemented using an adapted resting-hemodynamic input.
Directly comparable external evidence supports a cautious interpretation of Model 1. In adults with chronic heart failure, Ribeiro-Samora et al. evaluated the same multivariable Cahalin equation and reported 30% underestimation of CPET-measured VO 2 p e a k , a moderate correlation of r = 0.55 , and elevated limits of agreement [29]. The concordant direction and approximate magnitude of error are consistent with the present Model 1 findings. Direct numerical equivalence between the studies cannot be assumed, however, because the previous investigation used respiratory-gas measurement as the reference, whereas the present study used an indirect Bruce-duration-derived comparator and calculated the rate–pressure product from resting measurements.
Other studies similarly distinguish plausible group means from acceptable individual prediction. Ross et al. analyzed 1083 participants with diverse cardiopulmonary conditions and found that their generalized 6MWT equation estimated mean VO 2 p e a k across groups more accurately than it estimated individual values. The individual standard error of estimate was 3.82 mL·kg−1 · min−1, equivalent to 26.7% of the mean measured VO 2 p e a k [30]. Deka et al. subsequently found that a simpler distance-based Cahalin equation produced a mean estimate close to the mean CPET value in adults with stable heart failure, while cautioning that individual values could still be substantially overestimated or underestimated [31]. In a longitudinal cardiac-rehabilitation study, Chirico et al. also identified proportional bias and poor agreement between changes in measured VO 2 p e a k and changes estimated from 6MWT equations [32].
Evidence from healthier adult populations further demonstrates the dependence of 6MWT-based prediction on the target population and predictor specification. Burr et al. studied healthy working-age adults and found a moderate association between 6MWT distance and measured VO 2 m a x . Predictive performance improved when body weight, sex, resting heart rate, and age were incorporated into a multivariable equation [33]. Mänttäri et al. subsequently developed sex-specific equations in healthy adults using different combinations of walking distance, age, body size, and post-6MWT heart rate, with standard errors of estimate of approximately 3.5–3.6 mL·kg−1 · min−1 [34]. These equations are not directly transferable to adults with MetS, but they illustrate that equation performance depends on the target population, predictor definitions, test implementation, and independent validation.
The moderate correlations observed for Models 1 and 3 should, therefore, not be interpreted as evidence of agreement. Correlation evaluates association, whereas participant-level agreement requires examination of systematic bias, individual differences, and limits of agreement [24]. The present bias and limits of agreement are consistent with the broader observation that a 6MWT equation may reproduce a plausible sample mean while retaining substantial error for individual participants [29,30,31,32]. Decision-impact analyses and clinically acceptable error thresholds were not evaluated in the present study.

4.2. Interpretation of Model 1

Model 1 was derived in patients with advanced heart failure and incorporates walking distance, age, body weight, height, and rate–pressure product [21]. Its performance cannot be assumed to transport unchanged to adults with MetS who were screened to exclude unstable cardiovascular disease [25]. Ribeiro-Samora et al. found that the same multivariable equation underestimated directly measured VO 2 p e a k in a heart-failure sample with greater walking capacity than the original derivation cohort [29]. Taken together, those findings and the present results indicate that equation performance can change with clinical setting, functional-capacity distribution, and implementation of the predictor variables.
The present analysis additionally calculated the rate–pressure product from resting systolic blood pressure and resting heart rate rather than from exercise-related hemodynamic measurements. The systematic differences observed here may, therefore, reflect both between-population transport and the adapted hemodynamic input, and their independent contributions cannot be separated. The calibration slope of 0.397 indicates that this implementation generated a compressed range of estimates relative to the Bruce-derived comparator. Greater underestimation among men indicates differential performance by sex in this sample but does not establish a sex-specific physiological mechanism.
Absence of statistically significant proportional bias does not imply acceptable agreement. Model 1 retained a large negative mean bias, and its complete 95% limits-of-agreement interval remained below zero. The relatively stable direction of error, therefore, represents consistent underestimation rather than close correspondence between the two estimation approaches [24,29].

4.3. Interpretation of Model 3 and the Speed Threshold

Model 3 produced the smaller average negative bias, but its apparent advantage was offset by proportional bias and by a mathematical discontinuity at 100 m·min−1, corresponding to a 6MWT distance of 600 m. At exactly 100 m·min−1, the lower branch produces an estimate of 13.5 mL·kg−1 · min−1. Immediately above that threshold, the upper branch approaches 18.5 mL·kg−1 · min−1. Consequently, an arbitrarily small increase in walking distance across 600 m produces an upward change of approximately 5.0 mL·kg−1 · min−1, or approximately 37% relative to the value generated by the lower branch at the boundary.
The post hoc branch results are consistent with this structural feature but do not isolate its causal contribution. Participants at or below 600 m had a mean Model 3 estimate of 12.92 mL·kg−1 · min−1 and a mean bias of 9.22 , whereas participants above 600 m had a mean estimate of 19.45 and a mean bias of 4.87 mL·kg−1 · min−1. Part of this difference is mechanically imposed by the change in coefficient, while another part may reflect genuine differences in functional capacity and participant characteristics between the non-randomly formed speed groups. The smaller bias above 600 m, therefore, cannot be interpreted as evidence that 600 m represents a physiological threshold or that the upper branch is independently more valid.
Published 6MWT-based VO 2 p e a k equations, evaluated by Ross et al., Ribeiro-Samora et al., and Deka et al., are continuous regression functions of walking distance and participant characteristics and do not introduce a discrete change in predicted oxygen uptake at a single walking distance [29,30,31]. A recent evaluation of speed-to-MET conversion methods reported limited applicability of conventional formulas, particularly at higher 6MWT distances, and proposed that the relationship between distance and energy expenditure may be nonlinear [23]. Nonlinearity, however, does not by itself justify the specific discontinuity, coefficients, or 600 m boundary used in Model 3, and that investigation did not validate the archived Model 3 formula.
No independently recovered derivation evidence establishes that the two Model 3 branches were estimated from participant data, that continuity was examined, or that 600 m was selected through physiological or statistical validation. Model 3 should, therefore, be interpreted as an evaluation of a historical conversion rather than as external validation of a fully documented prediction equation. Its threshold findings remain exploratory and do not support clinical classification, exercise prescription, or decision-making based on whether a participant walks marginally below or above 600 m.

4.4. Sex-Stratified Findings

Men achieved longer walking distances, longer treadmill durations, and higher Bruce-derived estimates than women. Model 1 underestimation was significantly greater among men, whereas the sex difference in Model 3 bias was not statistically significant. Evaluation by sex is relevant because cardiorespiratory-fitness distributions and clinical reference values are commonly sex-specific [14,15]. The Bruce comparator used in the present study also applies different duration equations to women and men [27]. Consequently, the observed bias differences may reflect characteristics of both the 6MWT equations and the sex-specific comparator.
The sex-stratified analyses were exploratory because the sample contained fewer men than women. Greater Model 1 underestimation among men should not be attributed to an unmeasured physiological mechanism. Larger external-validation samples should determine whether differential error persists after accounting for age, body composition, medication use, baseline fitness, test implementation, and the definition of the comparator. Future reports should provide sex-specific calibration and agreement statistics rather than relying exclusively on pooled associations [25].

4.5. Public Health and Primary-Healthcare Implications

The 6MWT retains substantial public-health value as a directly observed measure of submaximal functional performance. Community and primary-healthcare programs can administer the test with relatively limited equipment and use walking distance to monitor functional status, provided that standardized procedures and safety criteria are maintained [18,19,20]. Its accessibility is important because cardiorespiratory fitness is strongly associated with morbidity and mortality, while directly measured CPET remains unavailable in many routine settings [14,15,16].
Evidence supporting the 6MWT as a functional assessment should be distinguished from evidence supporting conversion of its distance into individual VO 2 p e a k . Previous investigations have repeatedly found that equation-derived values may correlate with CPET measurements or reproduce a group mean while retaining wide participant-level error, proportional bias, or poor agreement for longitudinal change [29,30,31,32]. Reporting an equation-derived value as though it were directly measured may, therefore, obscure uncertainty relevant to individual exercise prescription, risk classification, and follow-up.
Model 2 further illustrates the importance of preserving the original output construct. Its percentage-predicted value is defined relative to an age- and sex-adjusted reference rather than expressed directly in mL·kg−1 · min−1. Without the corresponding participant-specific reference value, conversion to a mass-specific estimate is not justified. Applying an alternative normative equation would produce a hybrid calculation with different assumptions and unestablished measurement properties.
Community-based interventions can contribute to cardiometabolic prevention through physical activity, health education, participant engagement, and locally adapted implementation [35,36]. Translation of assessment tools into routine services additionally requires implementation capacity, knowledge transfer, and adequate resources [37,38]. Feasibility does not establish measurement validity. The present findings do not support use of the evaluated equation-derived estimates to determine individual exercise intensity, classify risk, establish eligibility, allocate resources, or replace directly measured CPET.

4.6. Strengths and Limitations

The principal strengths were the use of a newly recruited independent sample, standardized administration of both exercise assessments, and participant-level evaluation of bias, absolute error, RMSE, correlation, calibration, proportional bias, and Bland–Altman limits of agreement. This analytical framework addresses the distinction between association and agreement emphasized in previous evaluations of 6MWT-based VO 2 p e a k equations [24,29,32]. Randomization of assessment order and separation of the tests by 48–72 h reduced the likelihood that fatigue from one assessment substantially influenced the other.
Several limitations require consideration. The Bruce-derived comparator was calculated from total treadmill duration rather than obtained through breath-by-breath respiratory gas analysis and should, therefore, be regarded as an indirect reference method rather than a physiological criterion standard. Consequently, the present results cannot be compared numerically with CPET-validation studies as though the reference methods were equivalent. Recruitment in one Chilean city and the absence of a formal a priori sample-size calculation limit the precision and transportability of the findings. Accordingly, the study should be interpreted as an exploratory single-city method comparison rather than definitive external validation. The body-size distribution was also concentrated in the higher-BMI range. A total of 40.0% of participants were classified as overweight and 60.0% as having class I or class II obesity. The findings should, therefore, be generalized only to clinically similar middle-aged adults with MetS and comparable body-size distributions. The smaller number of men further reduced the precision of the sex-stratified estimates. Participant-specific reference values required to convert Model 2 from percentage-predicted VO 2 p e a k to mL·kg−1 · min−1 were unavailable.
Models 1 and 2 were implemented using resting rather than post-6MWT hemodynamic measurements, limiting direct comparison with the original Cahalin implementation and external studies using exercise-related rate–pressure product values [21,29]. The derivation sample, coefficient-estimation procedure, residual error, validation status, and rationale for the Model 3 threshold could not be independently verified. Although recent research supports further evaluation of nonlinear relationships between 6MWT distance and estimated energy expenditure, it does not validate the discontinuous Model 3 specification [23]. The cross-sectional design additionally does not establish whether any equation accurately detects within-participant change, an application for which previous research has identified poor agreement [32]. Smoking status, non-excluding joint or musculoskeletal disease, stable chronic pulmonary disease, previous cancer diagnoses, medication classes, including antidepressants, and frailty were not available as structured variables. Residual confounding by these unmeasured clinical characteristics cannot, therefore, be excluded, and the agreement estimates should be interpreted as unadjusted with respect to these potential modifiers of exercise performance.

4.7. Future Research

Future external-validation studies should compare 6MWT-based equations directly with breath-by-breath CPET, prespecify clinically acceptable error thresholds, retain complete paired participant-level data, and report calibration, proportional bias, and limits of agreement by sex and relevant clinical subgroups [24,25,28]. Group-level accuracy and individual agreement should be reported separately because previous studies demonstrate that an equation can reproduce a sample mean while retaining substantial error for individual participants [30,31]. Longitudinal validation is also required before equations are used to monitor intervention-related changes [32]. Further evaluation of Model 3 should not proceed as though the 600 m boundary were established. Either its complete primary derivation and validation evidence should be recovered or a continuous, physiologically plausible model should be developed and externally validated using measured oxygen uptake [23].

5. Conclusions

In this single-city sample of 105 adults aged 40–65 years with MetS, all of whom were classified as overweight or as having class I or class II obesity, Models 1 and 3 systematically produced lower aerobic-fitness estimates than the sex-specific Bruce-duration-derived equations. Model 3 showed a smaller mean bias and lower RMSE than Model 1. However, its proportional bias, wide limits of agreement, and piecewise threshold behavior indicated insufficiently close participant-level agreement with the Bruce-derived estimates. Model 1, implemented using a resting rate–pressure product, also demonstrated greater underestimation among men.
Model 2 could not be directly compared with the Bruce-derived values because it produced percentage-predicted VO 2 p e a k rather than relative VO 2 p e a k expressed in mL·kg−1 · min−1. Outputs from these approaches should, therefore, not be combined or interpreted on a common numerical scale.
Community and primary-healthcare programs may continue using observed 6MWT distance as a practical measure of functional walking performance. The present findings do not support replacing treadmill-based assessment with the evaluated equation-derived estimates for individual exercise prescription, risk classification, or clinical decision-making. Direct validation against measured oxygen uptake, use of the intended hemodynamic inputs, and prespecified clinically acceptable error thresholds are required before such applications can be considered. Because no clinical acceptability threshold or equivalence margin was prespecified, these analyses characterize empirical disagreement but do not constitute a formal test of clinical acceptability, equivalence, or interchangeability. The findings should not be extrapolated to adults without MetS, populations with substantially different body-size or fitness distributions, or other geographical and healthcare settings without external validation.

Author Contributions

Conceptualization, A.O.-Z., A.U. and C.V.-S.; methodology, A.O.-Z., A.U., J.M.-C. and C.V.-S.; formal analysis, A.O.-Z. and C.V.-S.; investigation, A.O.-Z., A.U., J.M.-C. and E.R.-M.; resources, A.U.; data curation, A.O.-Z., A.U. and C.V.-S.; writing—original draft preparation, A.O.-Z., A.U. and C.V.-S.; writing—review and editing, A.O.-Z., A.U., J.M.-C., E.R.-M., C.Z.-B., E.O.-H., T.P. and C.V.-S.; visualization, A.O.-Z. and C.V.-S.; supervision, A.U. and C.V.-S.; project administration, A.U. All authors have read and agreed to the published version of the manuscript.

Funding

This research received no external funding.

Institutional Review Board Statement

The study was conducted in accordance with the Declaration of Helsinki and was approved by the Scientific Ethics Committee of the Maule Health Service, Chile (Approval Code: CEC-SSM-2025-021; Date of Approval: 22 January 2025). Participant recruitment began after ethical approval in March 2025.

Informed Consent Statement

Written informed consent was obtained from all participants before enrollment and completion of the exercise assessments.

Data Availability Statement

The participant-level data are not publicly available because they contain sensitive health information and are subject to the conditions of the institutional ethics approval. De-identified aggregate results and the analytical code may be made available from the corresponding author upon reasonable request, subject to institutional authorization and applicable data-protection requirements.

Conflicts of Interest

The authors declare no conflicts of interest.

References

  1. Mannozzi, J.; Massoud, L.; Stavres, J.; Al-Hassan, M.H.; O’Leary, D.S. Altered Autonomic Function in Metabolic Syndrome: Interactive Effects of Multiple Components. J. Clin. Med. 2024, 13, 895. [Google Scholar] [CrossRef] [Scilit] [PubMed]
  2. Neeland, I.J.; Lim, S.; Tchernof, A.; Gastaldelli, A.; Rangaswami, J.; Ndumele, C.E.; Powell-Wiley, T.M.; Després, J.P. Metabolic syndrome. Nat. Rev. Dis. Primers 2024, 10, 77. [Google Scholar] [CrossRef] [Scilit] [PubMed]
  3. Grundy, S.M.; Cleeman, J.I.; Daniels, S.R.; Donato, K.A.; Eckel, R.H.; Franklin, B.A.; Gordon, D.J.; Krauss, R.M.; Savage, P.J.; Smith, S.C.; et al. Diagnosis and Management of the Metabolic Syndrome: An American Heart Association/National Heart, Lung, and Blood Institute Scientific Statement. Circulation 2005, 112, 2735–2752. [Google Scholar] [CrossRef] [Scilit] [PubMed]
  4. Noubiap, J.J.; Nansseu, J.R.; Nyaga, U.F.; Ndoadoumgue, A.L.; Ngouo, A.T.; Tounouga, D.N.; Tianyi, F.L.; Foka, A.J.; Lontchi-Yimagou, E.; Nkeck, J.R.; et al. Worldwide trends in metabolic syndrome from 2000 to 2023: A systematic review and modelling analysis. Nat. Commun. 2025, 17, 573. [Google Scholar] [CrossRef] [Scilit] [PubMed]
  5. Ferrari, C.K.B. Epidemiology of Metabolic Syndrome: Global Scenario. In Metabolic Syndrome: From Mechanisms to Interventions; Elsevier: Amsterdam, The Netherlands, 2024; pp. 59–71. [Google Scholar] [CrossRef] [Scilit]
  6. Alberti, K.G.M.M.; Eckel, R.H.; Grundy, S.M.; Zimmet, P.Z.; Cleeman, J.I.; Donato, K.A.; Fruchart, J.C.; James, W.P.T.; Loria, C.M.; Smith, S.C. Harmonizing the Metabolic Syndrome: A Joint Interim Statement of the International Diabetes Federation Task Force on Epidemiology and Prevention and Related Organizations. Circulation 2009, 120, 1640–1645. [Google Scholar] [CrossRef] [Scilit] [PubMed]
  7. Patial, R.; Batta, I.; Thakur, M.; Sobti, R.C.; Agrawal, D.K. Etiology, Pathophysiology, and Treatment Strategies in the Prevention and Management of Metabolic Syndrome. Arch. Intern. Med. Res. 2024, 7, 273–283. [Google Scholar] [CrossRef] [Scilit] [PubMed]
  8. Lu, X.; Xie, Q.; Pan, X.; Zhang, R.; Zhang, X.; Peng, G.; Zhang, Y.; Shen, S.; Tong, N. Type 2 diabetes mellitus in adults: Pathogenesis, prevention and therapy. Signal Transduct. Target. Ther. 2024, 9, 262. [Google Scholar] [CrossRef] [Scilit] [PubMed]
  9. Peterseim, C.M.; Jabbour, K.; Mulki, A.K. Metabolic Syndrome: An Updated Review on Diagnosis and Treatment for Primary Care Clinicians. J. Prim. Care Community Health 2024, 15, 1–11. [Google Scholar] [CrossRef] [Scilit] [PubMed]
  10. Bogale, S.K.; Sarma, H.; Alamnia, T.T.; Kelly, M. Workplace-Based Education Interventions for Managing Metabolic Syndrome in Low- and Middle-Income Countries: A Realist Review. Public Health Chall. 2024, 3, e224. [Google Scholar] [CrossRef] [Scilit] [PubMed]
  11. Villamil-Parra, W.; Moscoso-Loaiza, L. Effects of Physical Exercise on Irisin and BDNF Concentrations, and Their Relationship with Cardiometabolic and Mental Health of Individuals with Metabolic Syndrome: A Systematic Review. Exp. Gerontol. 2024, 198, 112640. [Google Scholar] [CrossRef] [Scilit] [PubMed]
  12. Reljic, D.; Herrmann, H.J.; Neurath, M.F.; Zopf, Y. Impact of Different Low-Volume Concurrent Training Regimens on Cardiometabolic Health, Inflammation, and Fitness in Obese Metabolic Syndrome Patients. Nutrients 2025, 17, 561. [Google Scholar] [CrossRef] [Scilit] [PubMed]
  13. Nuuttila, O.P.; Matomäki, P.; Raitanen, J.; Sievänen, H.; Vasankari, T. Effects of Low-Intensity Endurance Training on Aerobic Fitness and Risk Factors of Cardiometabolic Health in Working-Age Adults: A Systematic Review and Meta-Analysis. Scand. J. Med. Sci. Sports 2026, 36, e70208. [Google Scholar] [CrossRef] [Scilit] [PubMed]
  14. Lang, J.J.; Prince, S.A.; Merucci, K.; Cadenas-Sanchez, C.; Chaput, J.P.; Fraser, B.J.; Manyanga, T.; McGrath, R.; Ortega, F.B.; Singh, B.; et al. Cardiorespiratory fitness is a strong and consistent predictor of morbidity and mortality among adults: An overview of meta-analyses representing over 20.9 million observations from 199 unique cohort studies. Br. J. Sports Med. 2024, 58, 556–566. [Google Scholar] [CrossRef] [Scilit] [PubMed]
  15. Kaminsky, L.A.; Myers, J.; Brubaker, P.H.; Franklin, B.A.; Bonikowske, A.R.; German, C.; Arena, R. 2023 update: The importance of cardiorespiratory fitness in the United States. Prog. Cardiovasc. Dis. 2024, 83, 3–9. [Google Scholar] [CrossRef] [Scilit] [PubMed]
  16. Harber, M.P.; Myers, J.; Bonikowske, A.R.; Muntaner-Mas, A.; Molina-Garcia, P.; Arena, R.; Ortega, F.B. Assessing Cardiorespiratory Fitness in Clinical and Community Settings: Lessons and Advancements in the 100th Year Anniversary of VO2max. Prog. Cardiovasc. Dis. 2024, 83, 36–42. [Google Scholar] [CrossRef] [Scilit] [PubMed]
  17. Bonikowske, A.R.; Taylor, J.L.; Larson, K.F.; Hardwick, J.; Ozemek, C.J.; Harber, M.P.; Lavie, C.J. Evaluating Current Assessment Techniques of Cardiorespiratory Fitness. Expert Rev. Cardiovasc. Ther. 2024, 22, 231–241. [Google Scholar] [CrossRef] [Scilit] [PubMed]
  18. Ishaaya, E.; Yee, N.; DeCato, T.W. Six-Minute Walk Testing: Performance, Properties, and Clinical Applications. Clin. Chest Med. 2025, 46, 467–479. [Google Scholar] [CrossRef] [Scilit] [PubMed]
  19. Pepera, G.; Antoniou, V.; Karagianni, E.; Batalik, L.; Su, J.J. Validity and Reliability of the Six-Minute Walking Test Compared to Cardiopulmonary Exercise Test in Individuals with Heart Failure: Systematic Review and Meta-Analysis. J. Clin. Med. 2025, 14, 8303. [Google Scholar] [CrossRef] [Scilit] [PubMed]
  20. American Thoracic Society. ATS Statement: Guidelines for the Six-Minute Walk Test. Am. J. Respir. Crit. Care Med. 2002, 166, 111–117. [Google Scholar] [CrossRef] [Scilit] [PubMed]
  21. Cahalin, L.P.; Mathier, M.A.; Semigran, M.J.; Dec, G.W.; DiSalvo, T.G. The Six-Minute Walk Test Predicts Peak Oxygen Uptake and Survival in Patients with Advanced Heart Failure. Chest 1996, 110, 325–332. [Google Scholar] [CrossRef] [Scilit] [PubMed]
  22. Cahalin, L.P. Six-Minute Walk Test: Clinical Applications and Interpretation. Cardiopulm. Phys. Ther. J. 2009, 20, 9–13. [Google Scholar]
  23. Szczegielniak, J.; Bogacz, K.; Szczegielniak, A.; Wierzbicki, M.; Łuniewski, J.; Stanisławski, R.; Tomaszewski, M. Estimation and Performance Evaluation of Speed-to-MET Conversion Methods Using the 6-Minute Walk Distance. Respir. Med. 2026, 259, 108890. [Google Scholar] [CrossRef] [Scilit] [PubMed]
  24. Bland, J.M.; Altman, D.G. Statistical Methods for Assessing Agreement between Two Methods of Clinical Measurement. Lancet 1986, 1, 307–310. [Google Scholar] [CrossRef] [Scilit]
  25. Steyerberg, E.W.; Vickers, A.J.; Cook, N.R.; Gerds, T.; Gonen, M.; Obuchowski, N.; Pencina, M.J.; Kattan, M.W. Assessing the Performance of Prediction Models: A Framework for Traditional and Novel Measures. Epidemiology 2010, 21, 128–138. [Google Scholar] [CrossRef] [Scilit] [PubMed]
  26. Alul, L.A.U. Modelo de Intervención Integral No Farmacológica en Pacientes con Síndrome Metabólico de la Ciudad de Talca. Doctoral Dissertation, Universidad de Córdoba, Córdoba, Spain, 2010. [Google Scholar]
  27. Bruce, R.A.; Kusumi, F.; Hosmer, D. Maximal Oxygen Intake and Nomographic Assessment of Functional Aerobic Impairment in Cardiovascular Disease. Am. Heart J. 1973, 85, 546–562. [Google Scholar] [CrossRef] [Scilit] [PubMed]
  28. Collins, G.S.; Reitsma, J.B.; Altman, D.G.; Moons, K.G.M. Transparent Reporting of a Multivariable Prediction Model for Individual Prognosis or Diagnosis (TRIPOD): The TRIPOD Statement. Br. J. Surg. 2015, 102, 148–158. [Google Scholar] [CrossRef] [Scilit] [PubMed]
  29. Ribeiro-Samora, G.A.; Montemezzo, D.; Pereira, D.A.G.; Tagliaferri, T.L.; Vieira, O.A.; Britto, R.R. Could Peak Oxygen Uptake Be Estimated from Proposed Equations Based on the Six-Minute Walk Test in Chronic Heart Failure Subjects? Braz. J. Phys. Ther. 2017, 21, 100–106. [Google Scholar] [CrossRef] [Scilit] [PubMed]
  30. Ross, R.M.; Murthy, J.N.; Wollak, I.D.; Jackson, A.S. The Six Minute Walk Test Accurately Estimates Mean Peak Oxygen Uptake. BMC Pulm. Med. 2010, 10, 31. [Google Scholar] [CrossRef] [Scilit] [PubMed]
  31. Deka, P.; Pozehl, B.J.; Pathak, D.; Williams, M.; Norman, J.F.; Alonso, W.W.; Jaarsma, T. Predicting Maximal Oxygen Uptake from the 6 Min Walk Test in Patients with Heart Failure. ESC Heart Fail. 2021, 8, 47–54. [Google Scholar] [CrossRef] [Scilit] [PubMed]
  32. Chirico, D.; Davidson, T.W.; Terada, T.; Scott, K.; Keast, M.-L.; Reid, R.D.; Pipe, A.L.; Reed, J.L. Using the 6-min Walk Test to Monitor Peak Oxygen Uptake Response to Cardiac Rehabilitation in Patients with Heart Failure. J. Cardiopulm. Rehabil. Prev. 2020, 40, 378–382. [Google Scholar] [CrossRef] [Scilit] [PubMed]
  33. Burr, J.F.; Bredin, S.S.D.; Faktor, M.D.; Warburton, D.E.R. The 6-Minute Walk Test as a Predictor of Objectively Measured Aerobic Fitness in Healthy Working-Aged Adults. Physician Sportsmed. 2011, 39, 133–139. [Google Scholar] [CrossRef] [Scilit] [PubMed]
  34. Mänttäri, A.; Suni, J.; Sievänen, H.; Husu, P.; Vähä-Ypyä, H.; Valkeinen, H.; Tokola, K.; Vasankari, T. Six-Minute Walk Test: A Tool for Predicting Maximal Aerobic Power (VO2max) in Healthy Adults. Clin. Physiol. Funct. Imaging 2018, 38, 1038–1045. [Google Scholar] [CrossRef] [Scilit] [PubMed]
  35. Dhanjani, S.; Allen, H.; Varman, B.; Callender, C.; Dave, J.M.; Thompson, D. Community-Based Participatory Obesity Prevention Interventions in Rural Communities: A Scoping Review. Nutrients 2024, 16, 2201. [Google Scholar] [CrossRef] [Scilit] [PubMed]
  36. Stover, J.; Avadhanula, L.; Sood, S. A review of strategies and levels of community engagement in strengths-based and needs-based health communication interventions. Front. Public Health 2024, 12, 1231827. [Google Scholar] [CrossRef] [Scilit] [PubMed]
  37. King, O.; West, E.; Alston, L.; Beks, H.; Callisaya, M.; Huggins, C.E.; Murray, M.; Namara, K.M.; Pang, M.; Payne, W.; et al. Models and approaches for building knowledge translation capacity and capability in health services: A scoping review. Implement. Sci. 2024, 19, 7. [Google Scholar] [CrossRef] [Scilit] [PubMed]
  38. Weber, P.; Birkholz, L.; Straub, R.; Kohler, S.; Helsper, N.; Dippon, L.; Pfeifer, K.; Rütten, A.; Semrau, J. The Limitations and Potentials of Evaluating Economic Aspects of Community-Based Health Promotion: A Critical Review. Appl. Health Econ. Health Policy 2024, 22, 165–179. [Google Scholar] [CrossRef] [Scilit] [PubMed]
Figure 1. Methodological and analytical workflow. Models 1 and 3 were evaluated through paired comparison with the indirect Bruce-duration-derived estimates. Model 2 was retained on its original percentage-predicted scale and summarized separately.
Ijerph 23 01170 g001
Figure 2. Bland–Altman plot for Model 1 versus the sex-specific Bruce-derived estimate ( n = 105 ). The central dashed line represents the mean difference calculated as Model 1 minus the Bruce-derived estimate, and the outer dotted lines represent the 95% limits of agreement. Model 1 was implemented using the resting rate–pressure product.
Ijerph 23 01170 g002
Figure 3. Bland–Altman plot for Model 3 versus the sex-specific Bruce-derived estimate ( n = 105 ). The central dashed line represents the mean difference calculated as Model 3 minus the Bruce-derived estimate, and the outer dotted lines represent the 95% limits of agreement. The fitted relationship between the pairwise mean and the difference indicates proportional bias.
Ijerph 23 01170 g003
Table 4. Mean aerobic-fitness estimates and participant-level performance relative to the Bruce-derived comparator.
MetricModel 1Model 3
Participants, n105105
Bruce-derived comparator, mean ± SD 23.42 ± 1.87
Model estimate, mean ± SD 15.90 ± 1.72 16.78 ± 3.28
Mean bias 7.53 6.65
95% CI for bias 7.90 to 7.16 7.14 to 6.16
MAE7.536.65
RMSE7.777.11
Pearson correlation, r0.4310.642
95% limits of agreement 11.29 to 3.76 11.60 to 1.70
Proportional-bias coefficient, β 0.116 0.654
Proportional-bias p value0.351< 0.001
Calibration intercept (95% CI)6.60 (2.79 to 10.41) 9.56 ( 15.73 to 3.40 )
Calibration slope (95% CI)0.397 (0.235 to 0.559)1.124 (0.862 to 1.387)
Paired comparison p value< 0.001 < 0.001
Estimates, bias, MAE, RMSE, and limits of agreement are expressed in mL·kg−1 · min−1. CI, confidence interval; MAE, mean absolute error; RMSE, root mean square error; SD, standard deviation. Both model correlations had p < 0.001 . All participant-level differences were negative; therefore, MAE was numerically identical to the absolute mean bias. No clinically acceptable agreement threshold was prespecified.
Table 6. Post hoc exploratory comparison of the two Model 3 speed branches.
Model 3 Branchn6MWT Distance (m)Model 3 EstimateMean Bias
50 V 100 m·min−143 565.2 ± 25.8 12.92 ± 0.43 9.22 ± 1.07
100 < V 130 m·min−162 638.0 ± 27.1 19.45 ± 0.68 4.87 ± 1.49
Model 3 estimates and mean bias are expressed in mL·kg−1 · min−1. The between-branch difference in bias had p < 0.001 . Branch assignment depended on observed walking speed. Therefore, the comparison does not estimate the independent causal effect of the piecewise threshold.
Table 7. Age- and sex-adjusted percentage-predicted VO 2 p e a k from Model 2.
GroupnMean ± SD (%)
Complete sample105 99.31 ± 4.82
Women67 97.04 ± 4.13
Men38 103.30 ± 3.04
SD, standard deviation. On the original Model 2 scale, 100% denotes the participant-specific age- and sex-adjusted reference value embedded in the percentage-predicted construct. Values are not expressed in mL·kg−1 · min−1 and were not compared directly with the Bruce-derived estimates.
Disclaimer/Publisher’s Note: The statements, opinions and data contained in all publications are solely those of the individual author(s) and contributor(s) and not of MDPI and/or the editor(s). MDPI and/or the editor(s) disclaim responsibility for any injury to people or property resulting from any ideas, methods, instructions or products referred to in the content.