
The Positive Influence of Individual-Level Disaster Preparedness on the Odds of Individual-Level Pandemic Preparedness—Insights from FEMA’s 2021–2023 National Household Survey

Abstract
1. Introduction
2. Background
2.1. Individual-Level Preparedness in the U.S.
2.2. Previous Work
3. Methods
3.1. Data Source
3.2. Study Population
3.3. Measures
3.3.1. Primary Outcome Variable
3.3.2. Primary Covariate
3.3.3. Influencers of Preparedness
3.3.4. Demographics
3.4. Statistical Analysis
4. Results
4.1. Weighted Descriptive Statistics
4.2. Logistic Regression Analysis
5. Discussion
Limitations
6. Conclusions
Supplementary Materials
Author Contributions
Funding
Institutional Review Board Statement
Informed Consent Statement
Data Availability Statement
Conflicts of Interest
Abbreviations
| CDC | Centers for Disease Control and Prevention |
| DHS | Department of Homeland Security |
| FEMA | Federal Emergency Management Agency |
| HHS | Department of Health and Human Services |
| NHS | National Household Survey |
| OR | Odds Ratio |
| PHEP | Public Health Emergency Preparedness |
| SE | Standard Error |
References
- Kohn, S.; Eaton, J.L.; Feroz, S.; Bainbridge, A.A.; Hoolachan, J.; Barnett, D.J. Personal Disaster Preparedness: An Integrative Review of the Literature. Disaster Med. Public Health Prep. 2012, 6, 217–231. [Google Scholar] [CrossRef]
- Federal Emergency Management Agency. Individuals and Communities. Available online: https://www.fema.gov/emergency-managers/individuals-communities (accessed on 2 December 2024).
- U.S. Department of Homeland Security. About the Ready Campaign. Available online: https://www.ready.gov/about-us (accessed on 3 December 2024).
- Federal Emergency Management Agency. Guide for All-Hazard Emergency Operations Planning; Federal Emergency Management Agency: Washington, DC, USA, 1996. [Google Scholar]
- Schmeller, D.S.; Courchamp, F.; Killeen, G. Biodiversity Loss, Emerging Pathogens and Human Health Risks. Biodivers. Conserv. 2020, 29, 3095–3102. [Google Scholar] [CrossRef]
- Daszak, P.; Neves, C.; Hayman, D.; Kuiken, T.; Roche, B.; Zambrana-Torrelio, C.; Buss, P.; Dundarova, H.; Feferholtz, Y.; Foldvari, G.; et al. IPBES: Workshop Report on Biodiversity and Pandemics of the Intergovernmental Platform on Biodiversity and Ecosystem Services; IPBES Secretariat: Bonn, Germany, 2020. [Google Scholar]
- Haileamlak, A. Pandemics Will Be More Frequent. Ethiop. J. Health Sci. 2022, 32, 228. [Google Scholar] [CrossRef]
- Morens, D.M.; Folkers, G.K.; Fauci, A.S. What Is a Pandemic? J. Infect. Dis. 2009, 200, 1018–1021. [Google Scholar] [CrossRef]
- World Health Organization. International Health Regulations (2005); World Health Organization: Geneva, Switzerland, 2024. [Google Scholar]
- Ferreira, R.; Cannon, C.E.; Buttell, F.; Davidson, T. Explaining Disaster and Pandemic Preparedness at the Nexus of Personal Resilience and Social Vulnerability: An Exploratory Study. Disaster Med. Public Health Prep. 2023, 17, e416. [Google Scholar] [CrossRef]
- Clay, L.A.; Goetschius, J.B.; Papas, M.A.; Trainor, J.; Martins, N.; Kendra, J.M. Does Preparedness Matter? The Influence of Household Preparedness on Disaster Outcomes During Superstorm Sandy. Disaster Med. Public Health Prep. 2020, 14, 71–79. [Google Scholar] [CrossRef] [PubMed]
- Kohler, K.; Hauri, A.; Roth, F.; Scharte, B. Measuring Individual Disaster Preparedness; ETH Zurich: Zurich, Switzerland, 2020. [Google Scholar]
- Murphy, S.T.; Cody, M.; Frank, L.B.; Glik, D.; Ang, A. Predictors of Emergency Preparedness and Compliance. Disaster Med. Public Health Prep. 2009, 3, 1–10. [Google Scholar] [CrossRef] [PubMed]
- Bourque, L.B.; Regan, R.; Kelley, M.M.; Wood, M.M.; Kano, M.; Mileti, D.S. An Examination of the Effect of Perceived Risk on Preparedness Behavior. Environ. Behav. 2013, 45, 615–649. [Google Scholar] [CrossRef]
- Ablah, E.; Konda, K.; Kelley, C.L. Factors Predicting Individual Emergency Preparedness: A Multi-State Analysis of 2006 BRFSS Data. Biosecurity Bioterrorism Biodefense Strategy Pract. Sci. 2009, 7, 317–330. [Google Scholar] [CrossRef] [PubMed]
- Bell, S.A.; Singer, D.; Solway, E.; Kirch, M.; Kullgren, J.; Malani, P. Predictors of Emergency Preparedness Among Older Adults in the United States. Disaster Med. Public Health Prep. 2021, 15, 624–630. [Google Scholar] [CrossRef] [PubMed]
- Faupel, C.E.; Kelley, S.P.; Petee, T. The Impact of Disaster Education on Household Preparedness for Hurricane Hugo. Int. J. Mass Emergencies Disasters 1992, 10, 5–24. [Google Scholar] [CrossRef]
- Federal Emergency Management Agency. 2021 FEMA National Household Survey; Federal Emergency Management Agency: Washington, DC, USA, 2022. [Google Scholar]
- Chen, Z.; Cong, Z. The Impacts of Age and Preparation Information on Perceived and Actual Preparedness for a Pandemic: A Latent Class Analysis. Int. J. Disaster Risk Reduct. 2024, 105, 104374. [Google Scholar] [CrossRef]
- Federal Emergency Management Agency. About Us. Available online: https://www.fema.gov/about (accessed on 2 December 2024).
- Department of Homeland Security. Plan and Prepare for Disasters. Available online: https://www.dhs.gov/archive/plan-and-prepare-disasters (accessed on 3 December 2024).
- U.S. Department of Homeland Security. Ready in Your Language. Available online: https://www.ready.gov/ready-your-language (accessed on 3 December 2023).
- Federal Emergency Management Agency. Disaster Declarations Summaries; Federal Emergency Management Agency: Washington, DC, USA, 2024. [Google Scholar]
- Centers for Disease Control and Prevention. Public Health Emergency Preparedness (PHEP) Program and Guidance. Available online: https://www.cdc.gov/readiness/php/phep/index.html (accessed on 3 December 2024).
- Centers for Disease Control and Prevention. CDC H1N1 Flu | Preparing for the Flu: A Communication Toolkit. Available online: https://archive.cdc.gov/#/details?q=Preparing%20for%20the%20Flu&start=0&rows=10&url=https://www.cdc.gov/h1n1flu/faithbased/index.htm (accessed on 30 September 2024).
- Centers for Disease Control and Prevention. Stay Safe from COVID-19. Available online: https://archive.cdc.gov/#/details?q=Stay%20Healthy,%20Stay%20Safe&start=0&rows=10&url=https://www.cdc.gov/coronavirus/2019-ncov/easy-to-read/prevent-getting-sick/stay-safe.html (accessed on 2 December 2024).
- Rao, S.; Doherty, F.C.; Teixeira, S. Are You Prepared? Efficacy, Contextual Vulnerability, and Disaster Readiness. Int. J. Disaster Risk Reduct. 2022, 77, 103072. [Google Scholar] [CrossRef]
- Federal Emergency Management Agency. 2021 National Household Survey Public Summary; Federal Emergency Management Agency: Washington, DC, USA, 2022. [Google Scholar]
- Federal Emergency Management Agency. 2022 National Household Survey on Disaster Preparedness Public Summary; Federal Emergency Management Agency: Washington, DC, USA, 2023. [Google Scholar]
- Federal Emergency Management Agency. 2023 National Household Survey on Disaster Preparedness Public Summary; Federal Emergency Management Agency: Washington, DC, USA, 2023. [Google Scholar]
- Federal Emergency Management Agency. FEMA Data Digest: 2022 National Household Survey on Disaster Preparedness. Available online: https://community.fema.gov/PreparednessConnect/s/article/FEMA-Data-Digest-2022-National-Household-Survey-on-Disaster-Preparedness (accessed on 30 September 2024).
- Clay, L.A.; Kendra, J. Differences in Household Preparedness and Adaptation for COVID-19. Disaster Med. Public Health Prep. 2023, 17, e339. [Google Scholar] [CrossRef] [PubMed]
- Federal Emergency Management Agency. National Household Survey. Available online: https://www.fema.gov/about/openfema/data-sets/national-household-survey (accessed on 16 September 2024).
- Federal Emergency Management Agency. 2023 National Household Survey on Disaster Preparedness Methodology Report; Federal Emergency Management Agency: Washington, DC, USA, 2023. [Google Scholar]
- Federal Emergency Management Agency. 2022 FEMA National Household Survey; Federal Emergency Management Agency: Washington, DC, USA, 2023. [Google Scholar]
- Federal Emergency Management Agency. 2023 FEMA National Household Survey; Federal Emergency Management Agency: Washington, DC, USA, 2023. [Google Scholar]
- Federal Emergency Management Agency. 2021 National Household Survey on Disaster Preparedness: Survey Instrument (English); Federal Emergency Management Agency: Washington, DC, USA, 2022. [Google Scholar]
- Federal Emergency Management Agency. 2022 National Household Survey on Disaster Preparedness: Survey Instrument (English); Federal Emergency Management Agency: Washington, DC, USA, 2023. [Google Scholar]
- Federal Emergency Management Agency. 2023 National Household Survey on Disaster Preparedness: Survey Instrument (English); Federal Emergency Management Agency: Washington, DC, USA, 2023. [Google Scholar]
- Schober, P.; Boer, C.; Schwarte, L.A. Correlation Coefficients: Appropriate Use and Interpretation. Anesth. Analg. 2018, 126, 1763–1768. [Google Scholar] [CrossRef] [PubMed]


| Survey Year | 2021 | 2022 | 2023 | ||||||
|---|---|---|---|---|---|---|---|---|---|
| Unprepared | Prepared | Total | Unprepared | Prepared | Total | Unprepared | Prepared | Total | |
| N | 2907 (46.0%) | 3414 (54.0%) | 6321 | 3498 (56.7%) | 2673 (43.3%) | 6171 | 3757 (58.7%) | 2647 (41.3%) | 6404 |
| At Least 3 Disaster Preparedness Actions in the Past Year b | |||||||||
| Unprepared | 2082 (71.6%) | 319 (9.4%) | 2401 (38.0%) | 2215 (63.3%) | 360 (13.5%) | 2576 (41.7%) | 2157 (57.4%) | 345 (13.0%) | 2502 (39.1%) |
| Prepared | 825 (28.4%) | 3095 (90.6%) | 3920 (62.0%) | 1283 (36.7%) | 2313 (86.5%) | 3596 (58.3%) | 1599 (42.6%) | 2303 (87.0%) | 3902 (60.9%) |
| Awareness of Disaster Preparedness Information | |||||||||
| No | 377 (13.0%) | 57 (1.7%) | 434 (6.9%) | 503 (14.4%) | 72 (2.7%) | 575 (9.3%) | 507 (13.5%) | 42 (1.6%) | 549 (8.6%) |
| Yes | 2530 (87.0%) | 3357 (98.3%) | 5887 (93.1%) | 2995 (85.6%) | 2601 (97.3%) | 5597 (90.7%) | 3250 (86.5%) | 2605 (98.4%) | 5855 (91.4%) |
| Awareness of Pandemic Preparedness Information | |||||||||
| No | 161 (5.5%) | 23 (0.7%) | 183 (2.9%) | 235 (6.7%) | 27 (1.0%) | 262 (4.2%) | 331 (8.8%) | 31 (1.2%) | 362 (5.6%) |
| Yes | 2746 (94.5%) | 3392 (99.3%) | 6138 (97.1%) | 3263 (93.3%) | 2647 (99.0%) | 5909 (95.8%) | 3426 (91.2%) | 2616 (98.8%) | 6042 (94.4%) |
| Previous Pandemic Experience | |||||||||
| No | 1120 (38.8%) | 912 (26.8%) | 2033 (32.3%) | 1826 (52.2%) | 1009 (37.7%) | 2835 (45.9%) | 912 (24.3%) | 493 (18.6%) | 1406 (21.9%) |
| Yes | 1768 (61.2%) | 2496 (73.2%) | 4264 (67.7%) | 1672 (47.8%) | 1665 (62.3%) | 3337 (54.1%) | 2844 (75.7%) | 2154 (81.4%) | 4998 (78.1%) |
| Pandemic Confidence/Self-efficacy | |||||||||
| Not at all confident | 137 (4.7%) | 50 (1.5%) | 186 (2.9%) | 193 (5.5%) | 26 (1.0%) | 218 (3.5%) | 152 (4.0%) | 20 (0.8%) | 172 (2.7%) |
| Slightly confident | 465 (16.0%) | 304 (8.9%) | 769 (12.2%) | 320 (9.1%) | 94 (3.5%) | 414 (6.7%) | 335 (8.9%) | 76 (2.9%) | 411 (6.4%) |
| Somewhat confident | 905 (31.1%) | 721 (21.1%) | 1626 (25.7%) | 1025 (29.3%) | 484 (18.1%) | 1509 (24.4%) | 981 (26.1%) | 387 (14.6%) | 1368 (21.4%) |
| Moderately confident | 883 (30.4%) | 1209 (35.4%) | 2092 (33.1%) | 1140 (32.6%) | 997 (37.3%) | 2136 (34.6%) | 1271 (33.8%) | 979 (37.0%) | 2250 (35.1%) |
| Extremely confident | 517 (17.8%) | 1132 (33.1%) | 1649 (26.1%) | 820 (23.5%) | 1073 (40.1%) | 1894 (30.7%) | 1019 (27.1%) | 1184 (44.7%) | 2203 (34.4%) |
| Pandemic Risk Perception | |||||||||
| Unlikely | 439 (15.1%) | 335 (9.8%) | 773 (12.2%) | 633 (18.1%) | 289 (10.8%) | 922 (14.9%) | 765 (20.4%) | 330 (12.4%) | 1094 (17.1%) |
| Likely | 1285 (44.2%) | 1223 (35.8%) | 2508 (39.7%) | 1522 (43.5%) | 1006 (37.6%) | 2528 (41.0%) | 1755 (46.7%) | 1069 (40.4%) | 2824 (44.1%) |
| Very likely | 1184 (40.7%) | 1856 (54.4%) | 3040 (48.1%) | 1344 (38.4%) | 1379 (51.6%) | 2722 (44.1%) | 1237 (32.9%) | 1249 (47.2%) | 2485 (38.8%) |
| Top Disaster Preparedness Actions (% of Respondents) | Top Pandemic Preparedness Actions (% of Respondents) | |||||
| 2021 | Make your home safer (46.8%) | Assemble or update supplies (46.7%) | Save for a rainy day (45.7%) | Make your home safer (46.1%) | Assemble or update supplies (43.4%) | Save for a rainy day (41.3%) |
| 2022 | Sign up for alerts and warnings (47.8%) | Make a plan (42.6%) | Save for a rainy day (37.8%) | Make your home safer (34.1%) | Save for a rainy day (32.3%) | Sign up for alerts and warnings (30.4%) |
| 2023 | Assemble or update supplies (50.0%) | Make a plan (39.3%) | Make your home safer (37.9%) | Assemble or update supplies (38.1%) | Make your home safer (31.4%) | Make a plan (28.1%) |
| Top Disaster Awareness Subjects (% of Respondents) | Top Pandemic Awareness Subjects (% of Respondents) | |||||
| 2021 | Make a plan (57.7%) | Sign up for alerts and warnings (53.7%) | Save for a rainy day (51.8%) | Protecting yourself/family (74.3%) | Vaccines (72.4%) | Avoiding infection (70.0%) |
| 2022 | Make a plan (53.0%) | Sign up for alerts and warnings (50.1%) | Save for a rainy day (44.8%) | Vaccines (75.3%) | Protecting yourself/family (66.3%) | Testing (65.4%) |
| 2023 | Make a plan (57.6%) | Assemble or update supplies (52.8%) | Know your evacuation routes (51.2%) | Avoiding infection (63.5%) | Protecting yourself/family (60.8%) | Testing (60.6%) |
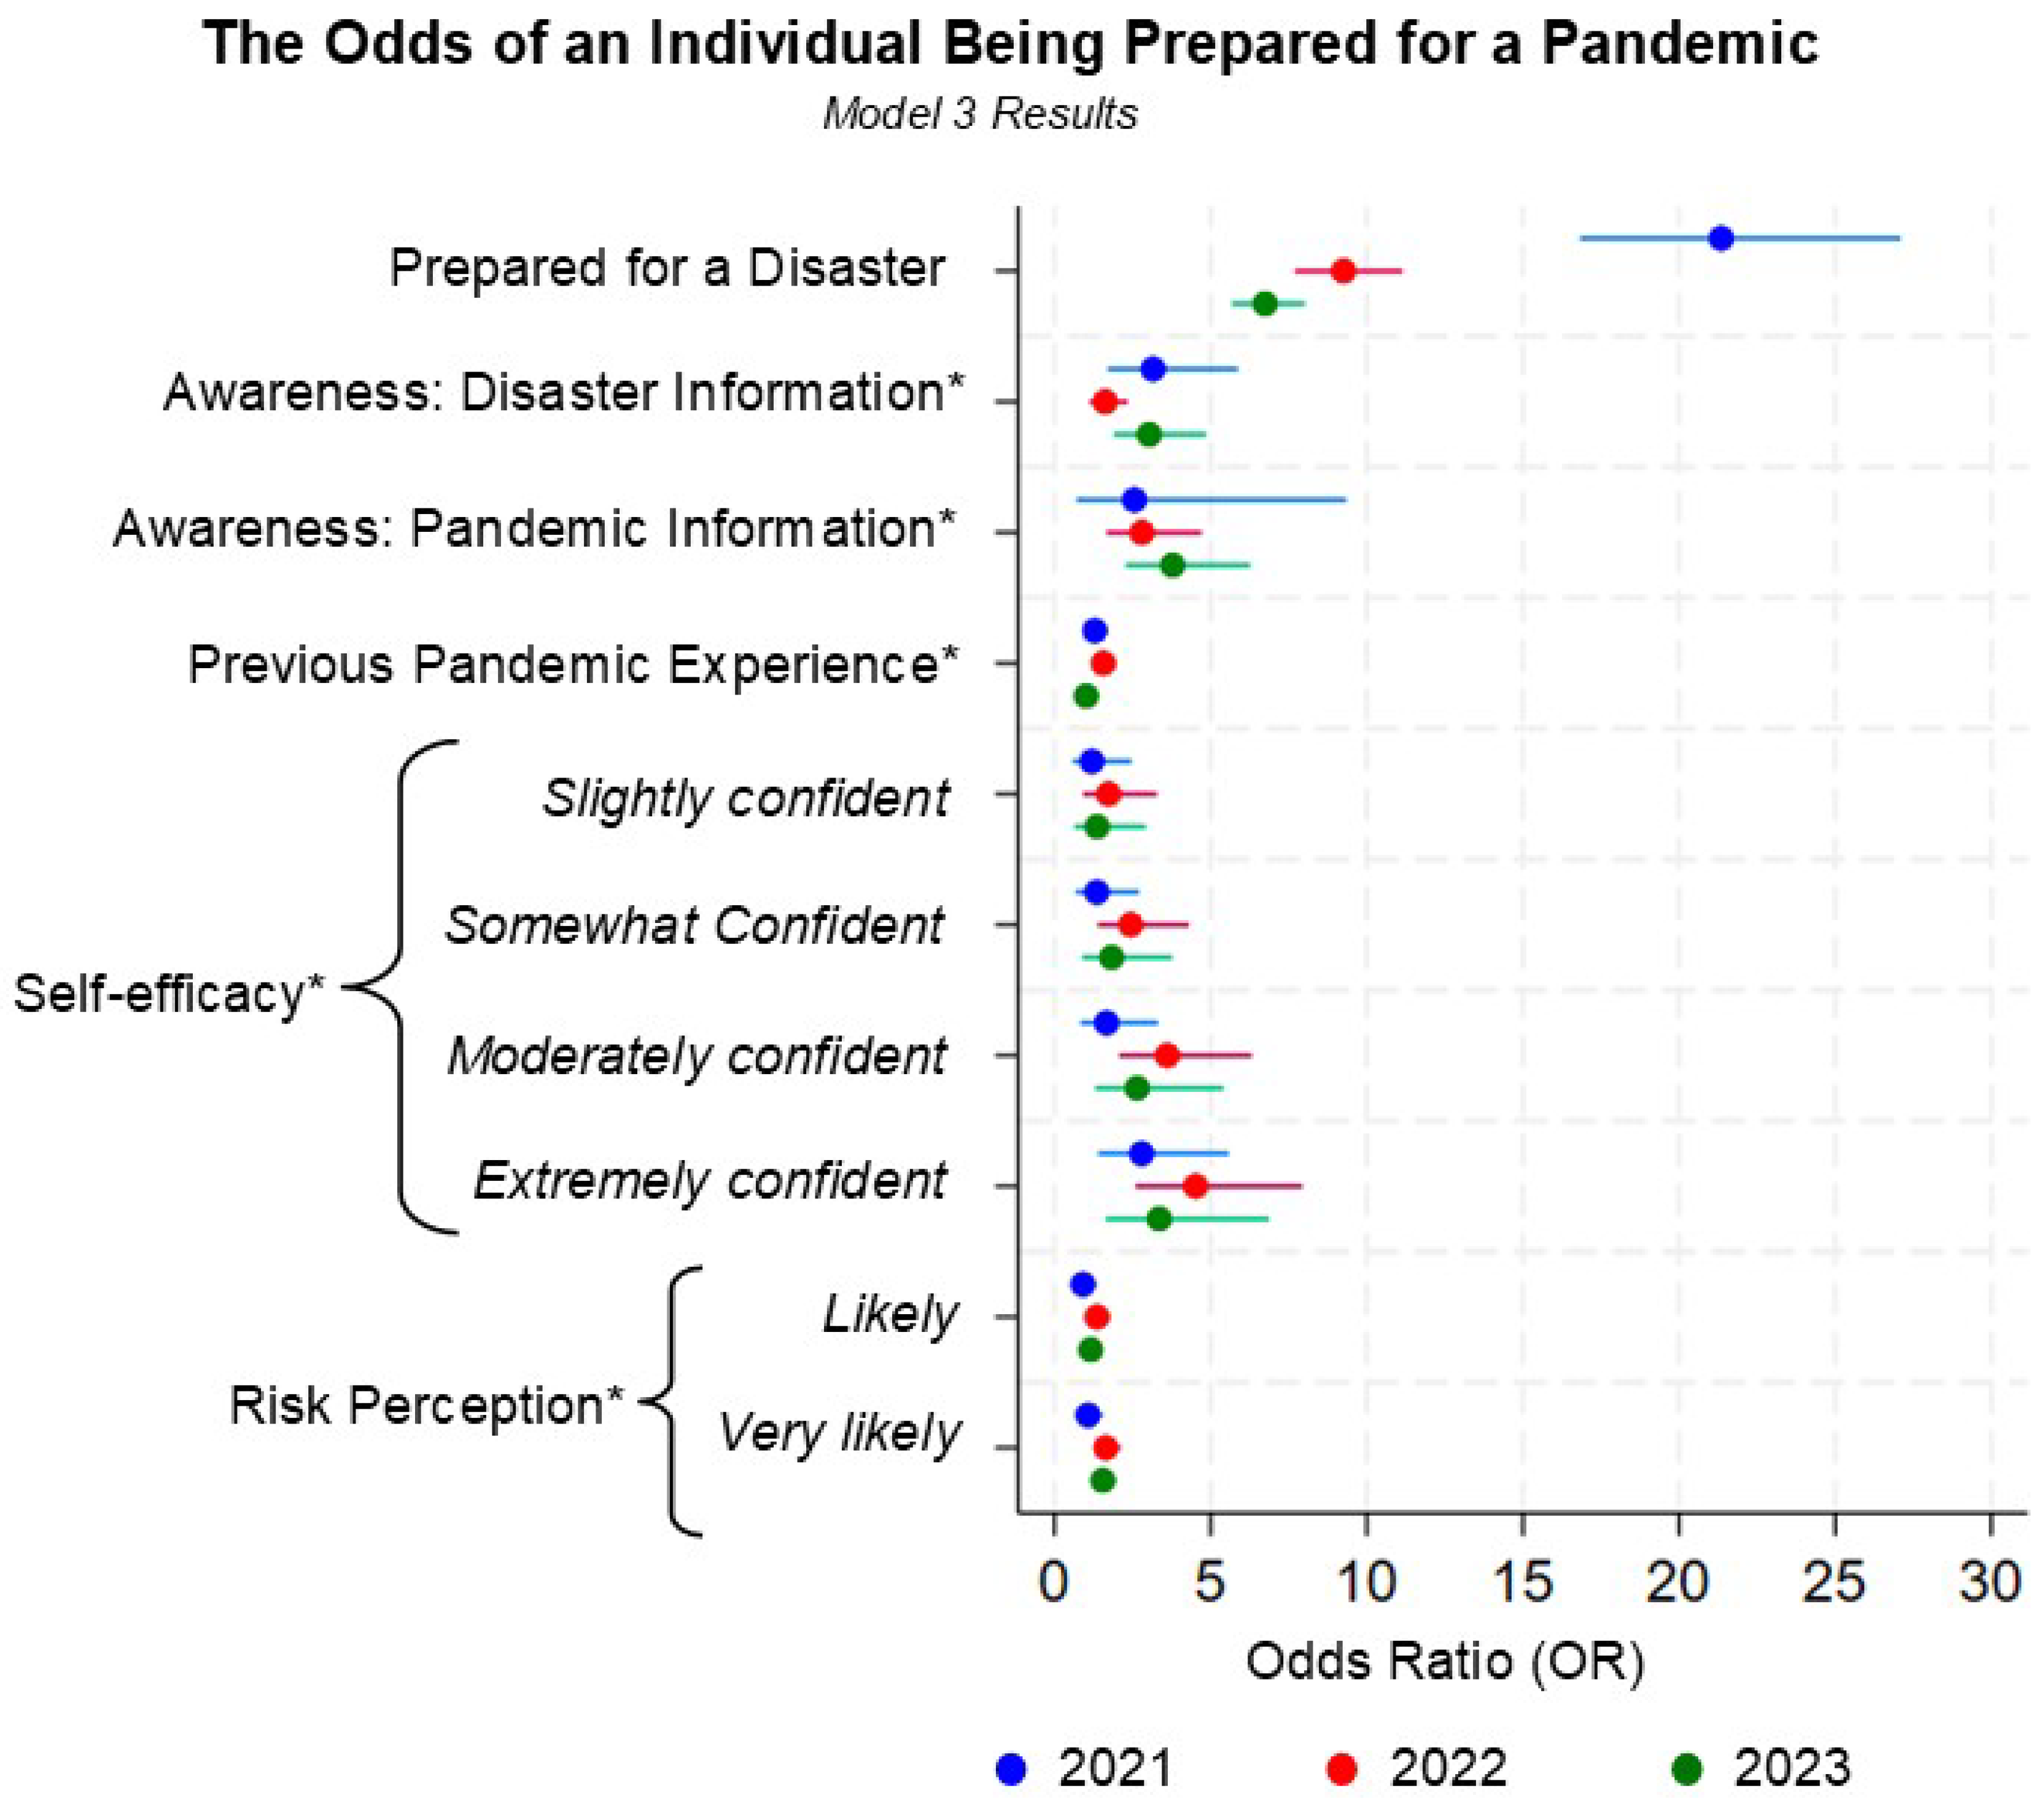
| Survey Year | 2021 | 2022 | 2023 | ||||||
|---|---|---|---|---|---|---|---|---|---|
| Regression Type b | Model 1 OR(SE) | Model 2 OR(SE) | Model 3 OR(SE) | Model 1 OR(SE) | Model 2 OR(SE) | Model 3 OR(SE) | Model 1 OR(SE) | Model 2 OR(SE) | Model 3 OR(SE) |
| Prepared for a Disaster c (Ref: No) | 24.46 *** (2.85) | 17.97 *** (4.55) | 21.35 *** (2.59) | 11.08 *** (0.96) | 11.69 *** (2.42) | 9.26 *** (0.87) | 9.01 *** (0.74) | 9.16 *** (1.83) | 6.75 *** (0.59) |
| Awareness of Disaster Preparedness Information (Ref: No) | 8.78 *** (2.19) | 3.06 *** (0.97) | 3.16 *** (1.00) | 6.06 *** (1.00) | 1.61 * (0.30) | 1.62 ** (0.30) | 9.58 *** (2.13) | 3.02 *** (0.74) | 3.04 *** (0.73) |
| Awareness of Pandemic Preparedness Information (Ref: No) | 8.80 *** (3.82) | 2.67 (1.78) | 2.56 (1.69) | 7.17 *** (1.62) | 2.79 *** (0.73) | 2.80 *** (0.74) | 8.10 *** (1.84) | 3.79 *** (0.98) | 3.78 *** (0.98) |
| Previous Pandemic Experience (Ref: No) | 1.73 *** (0.15) | 1.28 * (0.15) | 1.29 * (0.15) | 1.80 *** (0.12) | 1.55 *** (0.13) | 1.56 *** (0.13) | 1.40 *** (0.11) | 1.01 (0.10) | 1.01 (0.10) |
| Pandemic Confidence/Self-efficacy (Ref: Not at all confident) | |||||||||
| Slightly confident | 1.80 (0.55) | 1.22 (0.44) | 1.20 (0.44) | 2.20 ** (0.61) | 1.71 (0.56) | 1.73 (0.57) | 1.69 (0.55) | 1.37 (0.54) | 1.36 (0.53) |
| Somewhat confident | 2.20 ** (0.64) | 1.38 (0.48) | 1.36 (0.48) | 3.53 *** (0.89) | 2.42 ** (0.70) | 2.44 ** (0.71) | 2.93 *** (0.89) | 1.84 (0.68) | 1.83 (0.68) |
| Moderately confident | 3.78 *** (1.09) | 1.74 (0.59) | 1.67 (0.58) | 6.54 *** (1.61) | 3.56 *** (1.02) | 3.61 *** (1.03) | 5.72 *** (1.71) | 2.68 ** (0.98) | 2.65 ** (0.97) |
| Extremely confident | 6.04 *** (1.76) | 2.87 ** (0.99) | 2.79 ** (0.99) | 9.79 *** (2.41) | 4.49 *** (1.29) | 4.52 *** (1.30) | 8.63 *** (2.58) | 3.41 *** (1.25) | 3.36 *** (1.23) |
| Pandemic Risk Perception (Ref: Unlikely) | |||||||||
| Likely | 1.25 (0.17) | 0.92 (0.17) | 0.91 (0.17) | 1.45 *** (0.16) | 1.37 * (0.18) | 1.36 * (0.18) | 1.41 *** (0.13) | 1.18 (0.14) | 1.16 (0.14) |
| Very likely | 2.06 *** (0.28) | 1.06 (0.20) | 1.08 (0.20) | 2.25 *** (0.24) | 1.65 *** (0.21) | 1.65 *** (0.21) | 2.34 *** (0.22) | 1.53 *** (0.19) | 1.55 *** (0.19) |
| Intercept | 0.01 *** (0.01) | 0.01 *** (0.01) | 0.01 *** (0.00) | 0.01 *** (0.00) | 0.01 *** (0.00) | 0.01 *** (0.00) | |||
Disclaimer/Publisher’s Note: The statements, opinions and data contained in all publications are solely those of the individual author(s) and contributor(s) and not of MDPI and/or the editor(s). MDPI and/or the editor(s) disclaim responsibility for any injury to people or property resulting from any ideas, methods, instructions or products referred to in the content. |
© 2025 by the authors. Licensee MDPI, Basel, Switzerland. This article is an open access article distributed under the terms and conditions of the Creative Commons Attribution (CC BY) license (https://creativecommons.org/licenses/by/4.0/).
Share and Cite
Mitcham, D.; Watson, C.R. The Positive Influence of Individual-Level Disaster Preparedness on the Odds of Individual-Level Pandemic Preparedness—Insights from FEMA’s 2021–2023 National Household Survey. Int. J. Environ. Res. Public Health 2025, 22, 702. https://doi.org/10.3390/ijerph22050702
Mitcham D, Watson CR. The Positive Influence of Individual-Level Disaster Preparedness on the Odds of Individual-Level Pandemic Preparedness—Insights from FEMA’s 2021–2023 National Household Survey. International Journal of Environmental Research and Public Health. 2025; 22(5):702. https://doi.org/10.3390/ijerph22050702
Chicago/Turabian StyleMitcham, Dionne, and Crystal R. Watson. 2025. "The Positive Influence of Individual-Level Disaster Preparedness on the Odds of Individual-Level Pandemic Preparedness—Insights from FEMA’s 2021–2023 National Household Survey" International Journal of Environmental Research and Public Health 22, no. 5: 702. https://doi.org/10.3390/ijerph22050702
APA StyleMitcham, D., & Watson, C. R. (2025). The Positive Influence of Individual-Level Disaster Preparedness on the Odds of Individual-Level Pandemic Preparedness—Insights from FEMA’s 2021–2023 National Household Survey. International Journal of Environmental Research and Public Health, 22(5), 702. https://doi.org/10.3390/ijerph22050702