
Green Environments for Sustainable Brains: Parameters Shaping Adaptive Neuroplasticity and Lifespan Neurosustainability—A Systematic Review and Future Directions


Abstract
1. Introduction
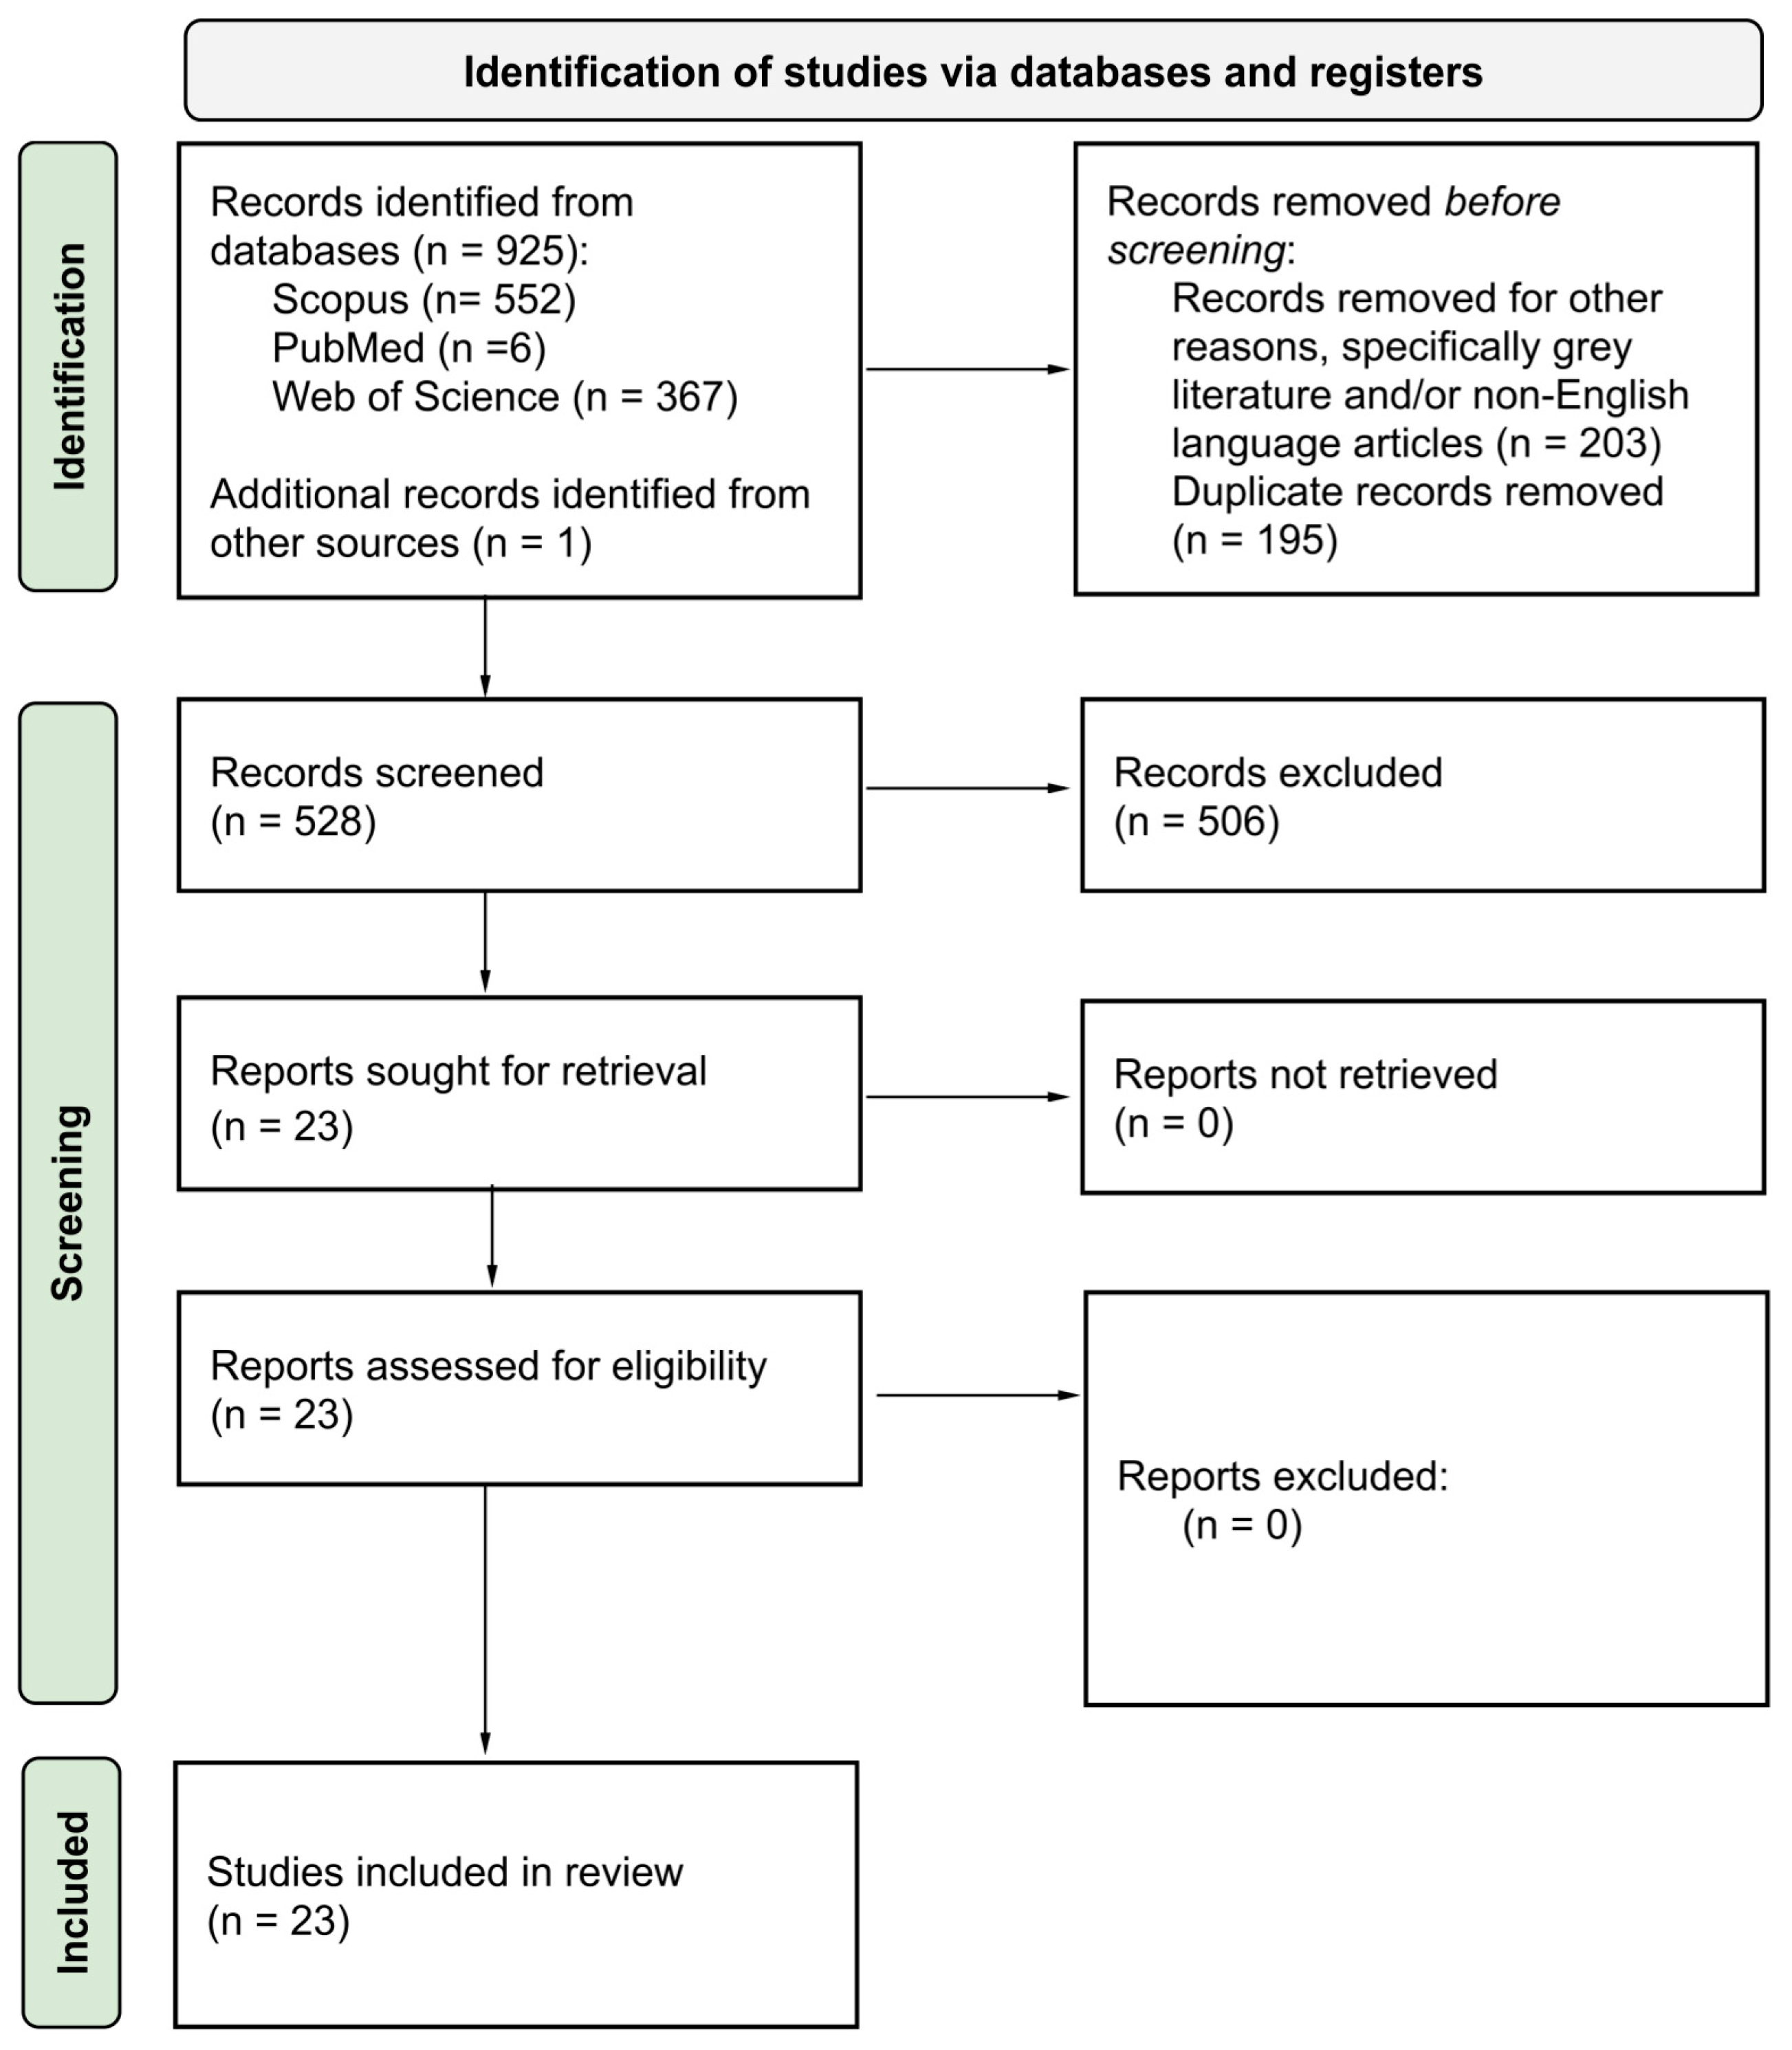
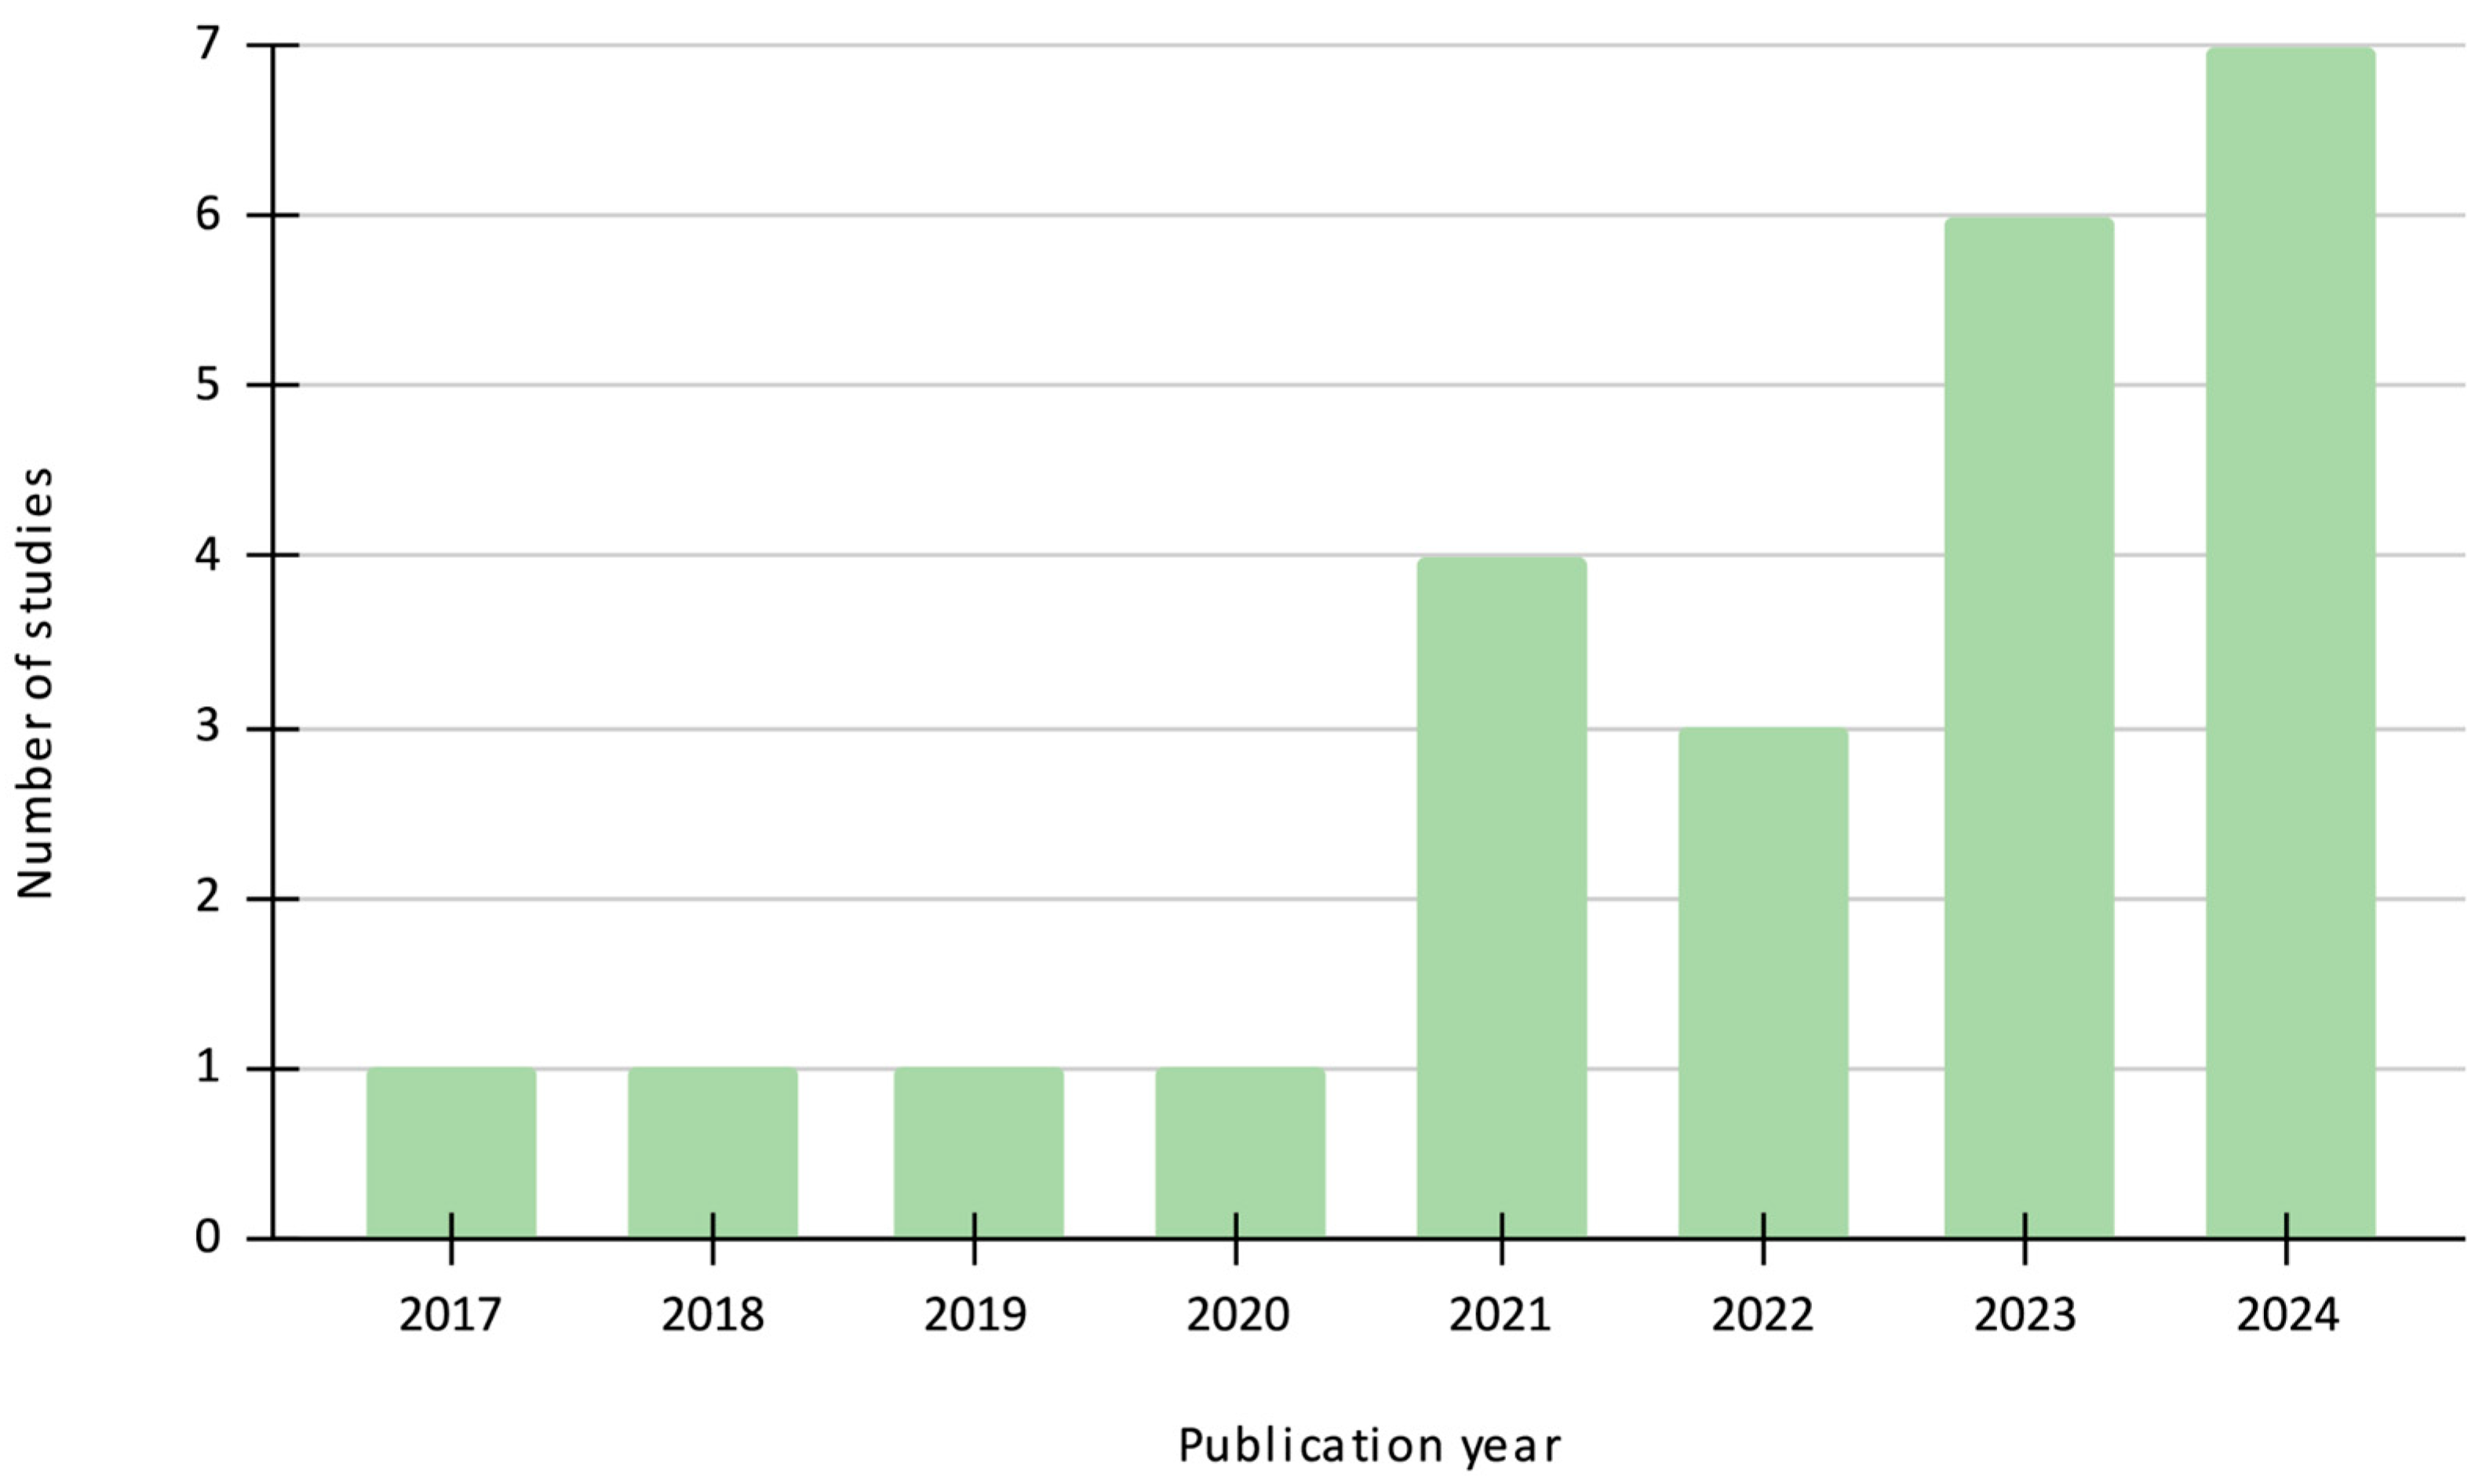
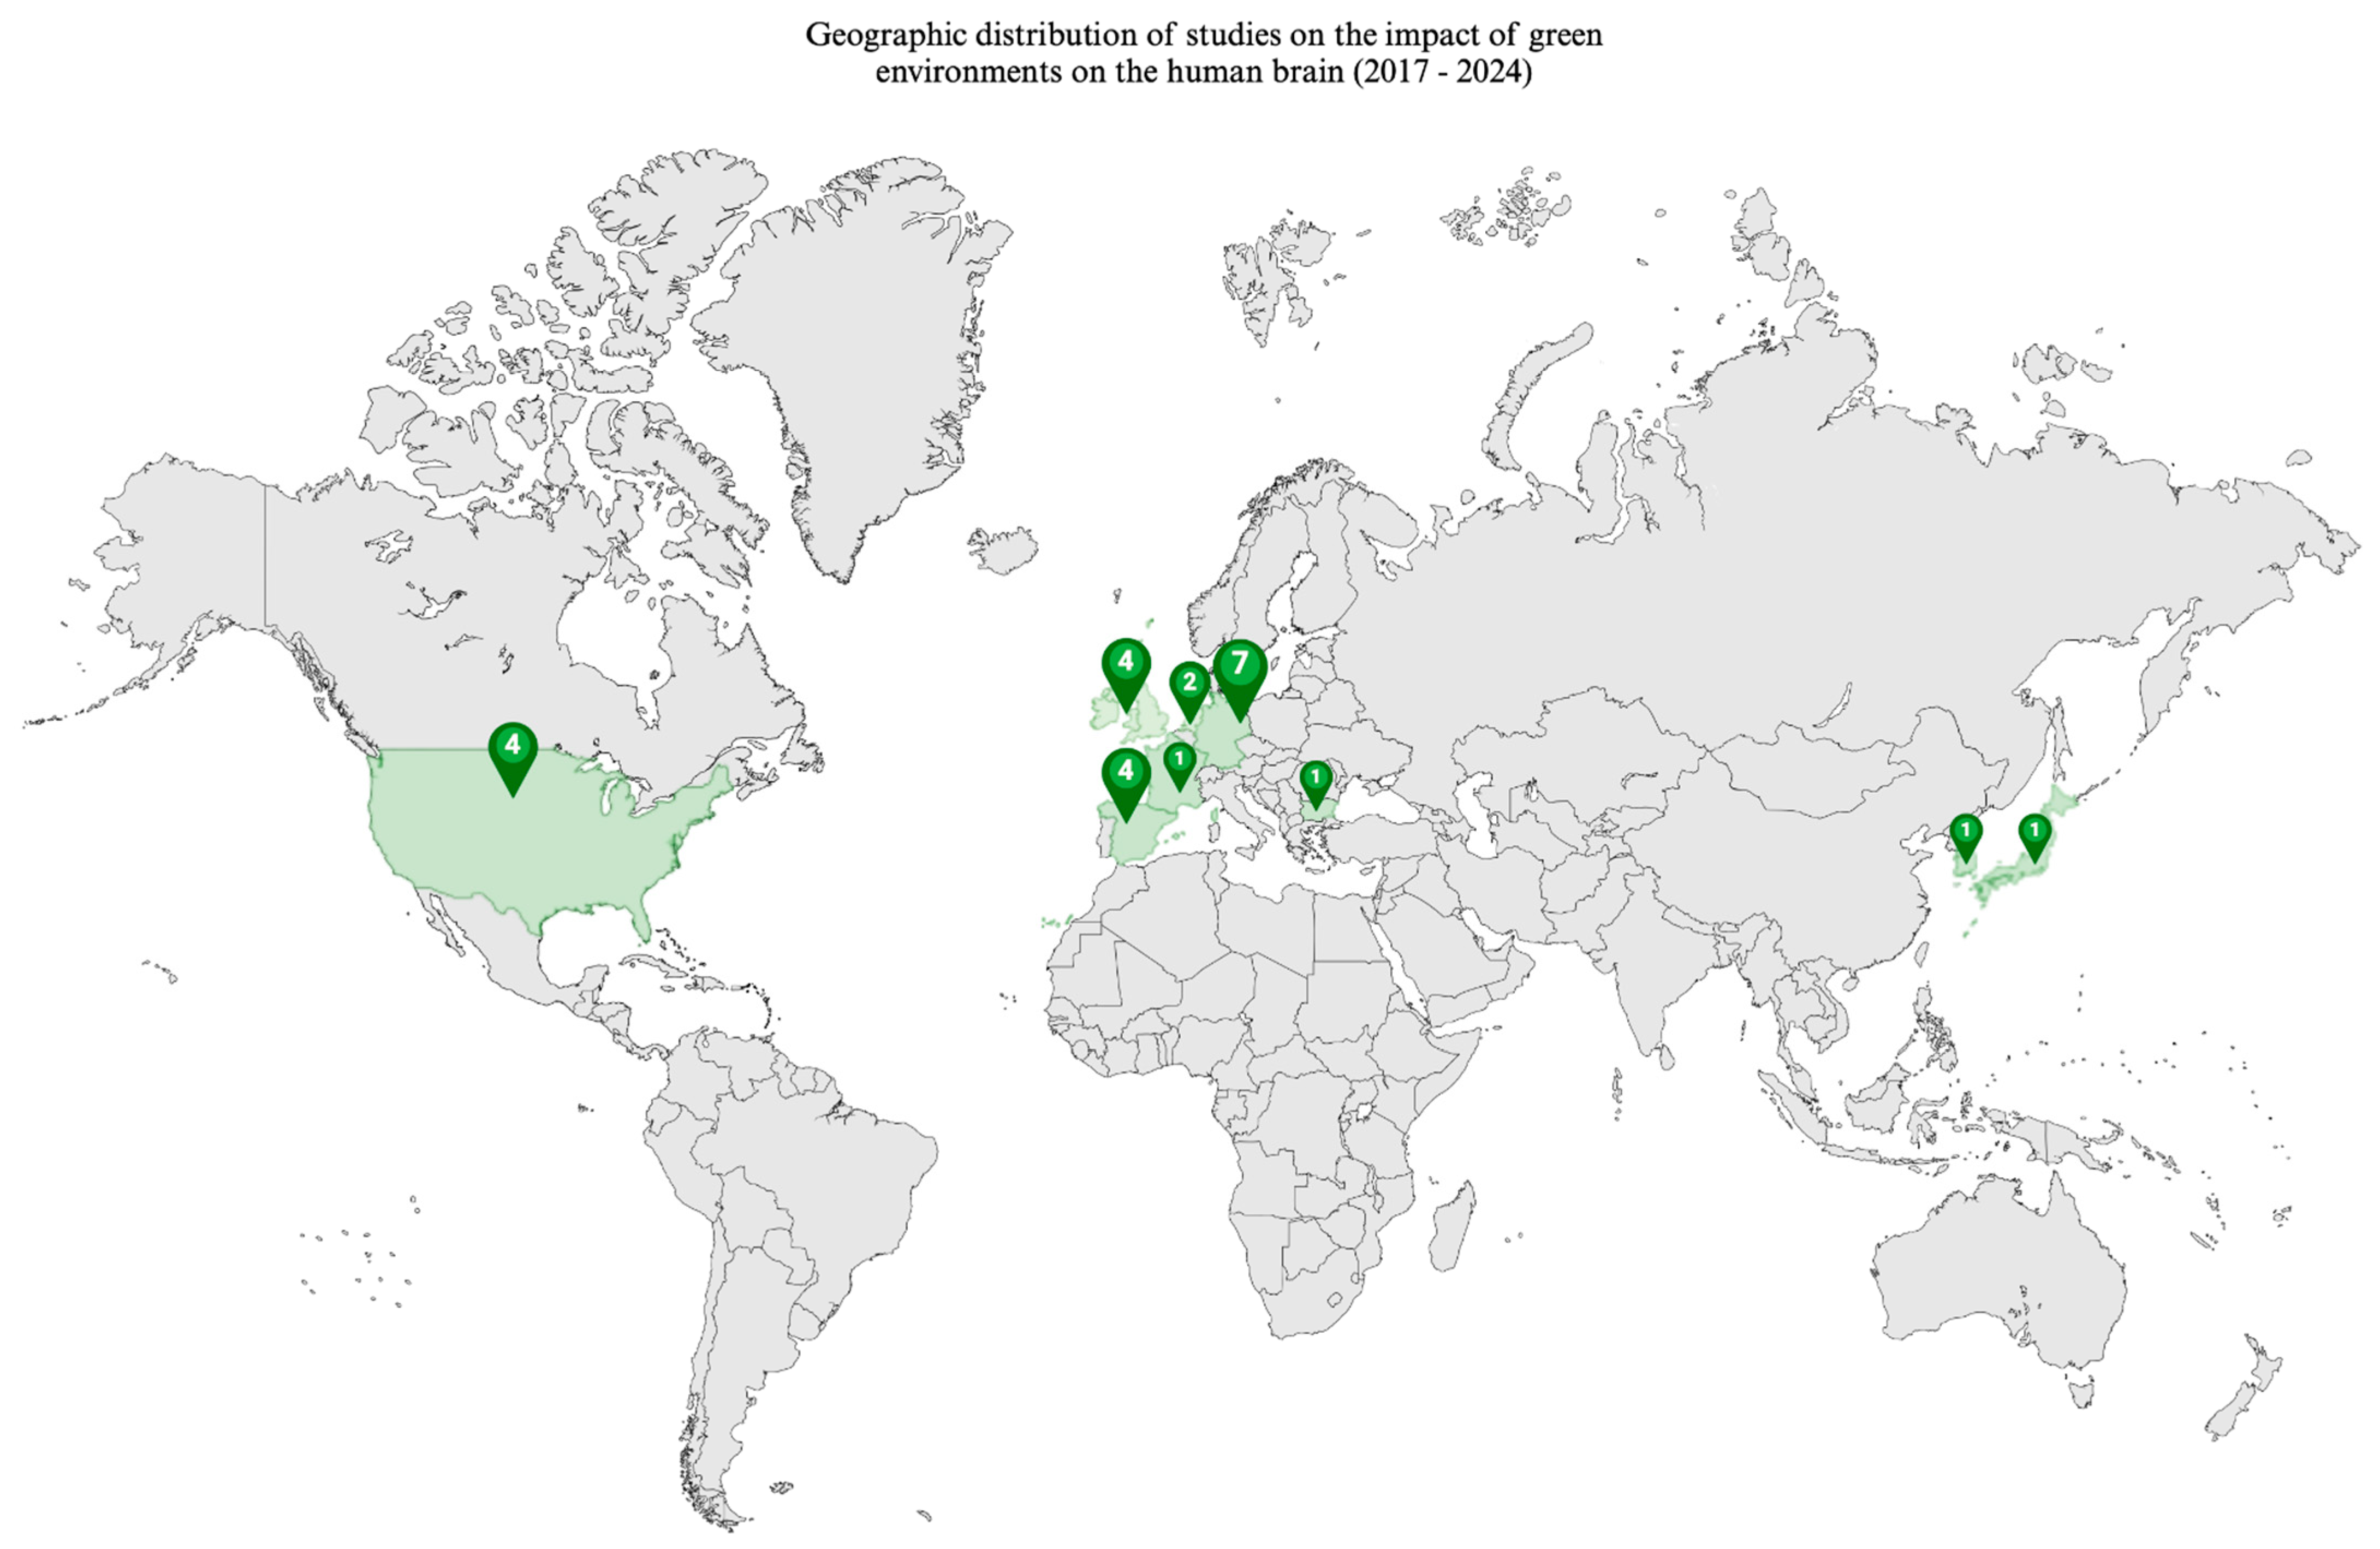
2. Materials and Methods
3. Results

| Reference | Sample Size | Age Group | Relevant Aim/s of the Study to this Systematic Review | Results About Brain Changes |
|---|---|---|---|---|
| Kühn et al. [10] | 341 | Older adults | Identify geographical characteristics that constitute an enriched environment for the amygdala, pregenual anterior cingulate cortex (pACC), and dorsolateral prefrontal cortex (DLPFC). | Forest coverage (not correlated with wealthier residential areas) was positively associated with amygdala integrity. Urban green and water are not associated with brain structure. |
| Dettweiler et al. [11] | 48 | Children | Explore the impact of studying in the forest over one school year on brain development. | Cerebral structural change is best explained by age; however, studying in the forest has a positive direct effect on the maturation of the anterior cingulate cortex. |
| Xu et al. [12] | 156,075; 14,988 (with MRI) | Older adults | Investigate the associations between environments and psychiatric symptoms mediated by brain volume changes. | Found distinct urban environmental profiles (e.g., social deprivation, air pollution, urban density, or conversely protective green spaces) associated with specific psychiatric symptom groups, and observed mediation by regional brain volumes. |
| Sudimac and Kühn [13] | 60 | Young adults | Explore the causal relationship between exposure to each the natural and urban environments and the hippocampal formation. | Participants who walked in the forest had an increase in subiculum volume, while no change was observed after the urban walk. |
| Pu et al. [14] | 34,588 | Older adults | Examine the associations between air pollution, green space, blue space, and brain volumes, brain age, and frailty. | Green spaces are associated with positive variance in brain volume, gray matter and white matter, particularly in the supplementary motor cortex. Levels of pollution and noise had similar antagonistic effects on brain volumes. |
| Shang et al. [15] | 34,454 | Older adults | Examine the associations between greenspace and natural environment exposure on brain volumes. | Positive changes in total brain volume, grey matter, and white matter volumes are influenced by greenness and exposure to nature. |
| Baena-Extremera et al. [16] | 47 | Adults | Compare the frontal brain thickness of adults exercising in green outdoor spaces versus urban indoor environments. | The green exercise group exhibited increased thickness in the right anterior cingulate cortex (rACC) and the right superior frontal sulcus (rSFS). |
| Binter et al. [17] | 2820 | Prenatal and children | Assess the impact of urban built environment and natural spaces exposure during pregnancy and childhood on white matter microstructure in pre-adolescents. | Greater distance to the nearest major green space during pregnancy was associated with higher whole-brain fractional anisotropy (FA). Higher road-traffic noise exposure mediated the association between lower surrounding greenness and lower FA probably due to releasing stress hormones. |
| Webb et al. [18] | 288 (trauma survivors with MRI) | Adults | Examine how greenspace interacts to affect PTSD outcomes and neural reactivity to reward. | Greenspace exposure was associated with neural reactivity to reward, specifically in the amygdala, and with increased likelihood of being assigned to a resilient PTSD trajectory. |
| Besser et al. [19] | 1260 | Older adults | Examine the combined effect of neighborhood greenspace and median income on white matter (WM) grade and ventricle size changes. | The combination of lower neighbourhood income and lower greenspace may be a risk factor for worsening WM grade, but not the greenspace alone dichotomised at median 37% for WM or ventricle grade. |
| Kühn et al. [20] | 95 | Children | Investigate the relationship between tree cover density (TCD), open green space (OGS), and sky visibility (sky view factor (SVF)) since birth on brain structure. | Positive association with GM volume in bilateral prefrontal cortex and temporal cortex for OGS; negative association with TCD in frontal and temporal brain regions. SVF was the most significant predictor of GM volume in the medial prefrontal cortex. |
| Kühn et al. [21] | 677 | Young adults | Investigate the relationship between tree cover density (TCD) and brain structure. | Current tree cover density at home was positively related to the GM in the right orbitofrontal cortex (rOFC). |
| Gianaros et al. [22] | 699 | Adults | Investigate how the features of communities (e.g., green space) relate to brain morphology. | Green space (≥40%) had significant positive indirect effects on cortical and cardiometabolic risks. Indirect effects on hippocampal volume were weaker in effect size. |
| Tani et al. [23] | 476 | Older adults | Investigate associations between neighbourhood beauty and regional brain volume. | Subjective neighborhood beauty was positively associated with larger mOFC and insula volumes. The association was stronger in participants living in the mountainous area compared to the downtown area. |
| Sudimac et al. [24] | 63 | Young adults | Examine the effect of a one-hour walk in nature (forest) vs. urban environment (busy street) on amygdala activity using fMRI. | Significant decrease in amygdala activity after the nature walk, indicating stress recovery. No significant change after the urban walk. |
| Sudimac and Kühn [25] | 63 | Young adults | Examine the effect of a one-hour walk in nature (forest) vs. urban environment (busy street) on amygdala activity. | Found a significant decrease in amygdala activity in women after the nature walk, with no effect in men. |
| Kühn et al. [26] | 207 | Older adults | Investigate the association between Urban Fabric (representing urbanicity) and Urban Green (green space) in relation to brain structure (perigenual/subgenual anterior cingulate cortex, p/sACC). | Positive association between Urban Green and p/sACC grey matter volume. Negative association between Urban Fabric and p/sACC grey matter volume. No significant mental health associations were found. |
| Besser et al. [27] | 1125 | Older adults | Investigate associations between neighbourhood greenspace and brain-based MRI measures. | No significant association between neighborhood greenspace and hippocampal volume. Borderline association between greater greenspace and lower ventricle grade. |
| Min et al. [28] | 2542 | Older adults | Examines the association between residential greenness (EVI) and cortical thickness (global and regional) in cognitively healthy adults. | Significant positive association between residential greenness and cortical thickness in urban populations, particularly in parietal, occipital, and global cortical regions. |
| Falcón et al. [29] | 212 | Older adults | Identify structural brain imaging correlates of urban environmental exposures in cognitively unimpaired individuals at increased risk of Alzheimer’s disease (AD). | Exposure to greenness was associated with greater gray matter volume in the middle frontal, precentral, and the temporal pole. |
| Crous-Bou et al. [30] | 228 (with MRI) | Older adults | Evaluate the effect of urban environmental exposures on brain structure of cognitively unimpaired individuals at risk for AD. | Increasing greenness indicators was associated with greater cortical thickness in brain regions known to be affected by AD (entorhinal cortex, temporal, precuneus). |
| Dzhambov et al. [31] | 25 (with MRI) | Adults | Investigate the associations between greenness and neurocognitive functions using brain imaging. | Positively correlated with average cortical thickness across both hemispheres, but a correction method revealed insignificant associations. |
| Dadvand et al. [32] | 253 (with MRI) | Children | Investigate the effect of lifelong exposure to residential greenness on brain structure in children. | Greenness exposure is associated with increased GM volume in the prefrontal cortex and premotor cortex, and WM volume in the cerebellum and prefrontal regions, overlapped with working memory and inattentiveness. |
3.1. Neurosustainability from the Prenatal to the Ageing Brain Through Green Environments
3.2. Green Environment Types, Methods and Associated Adaptive Brain Changes
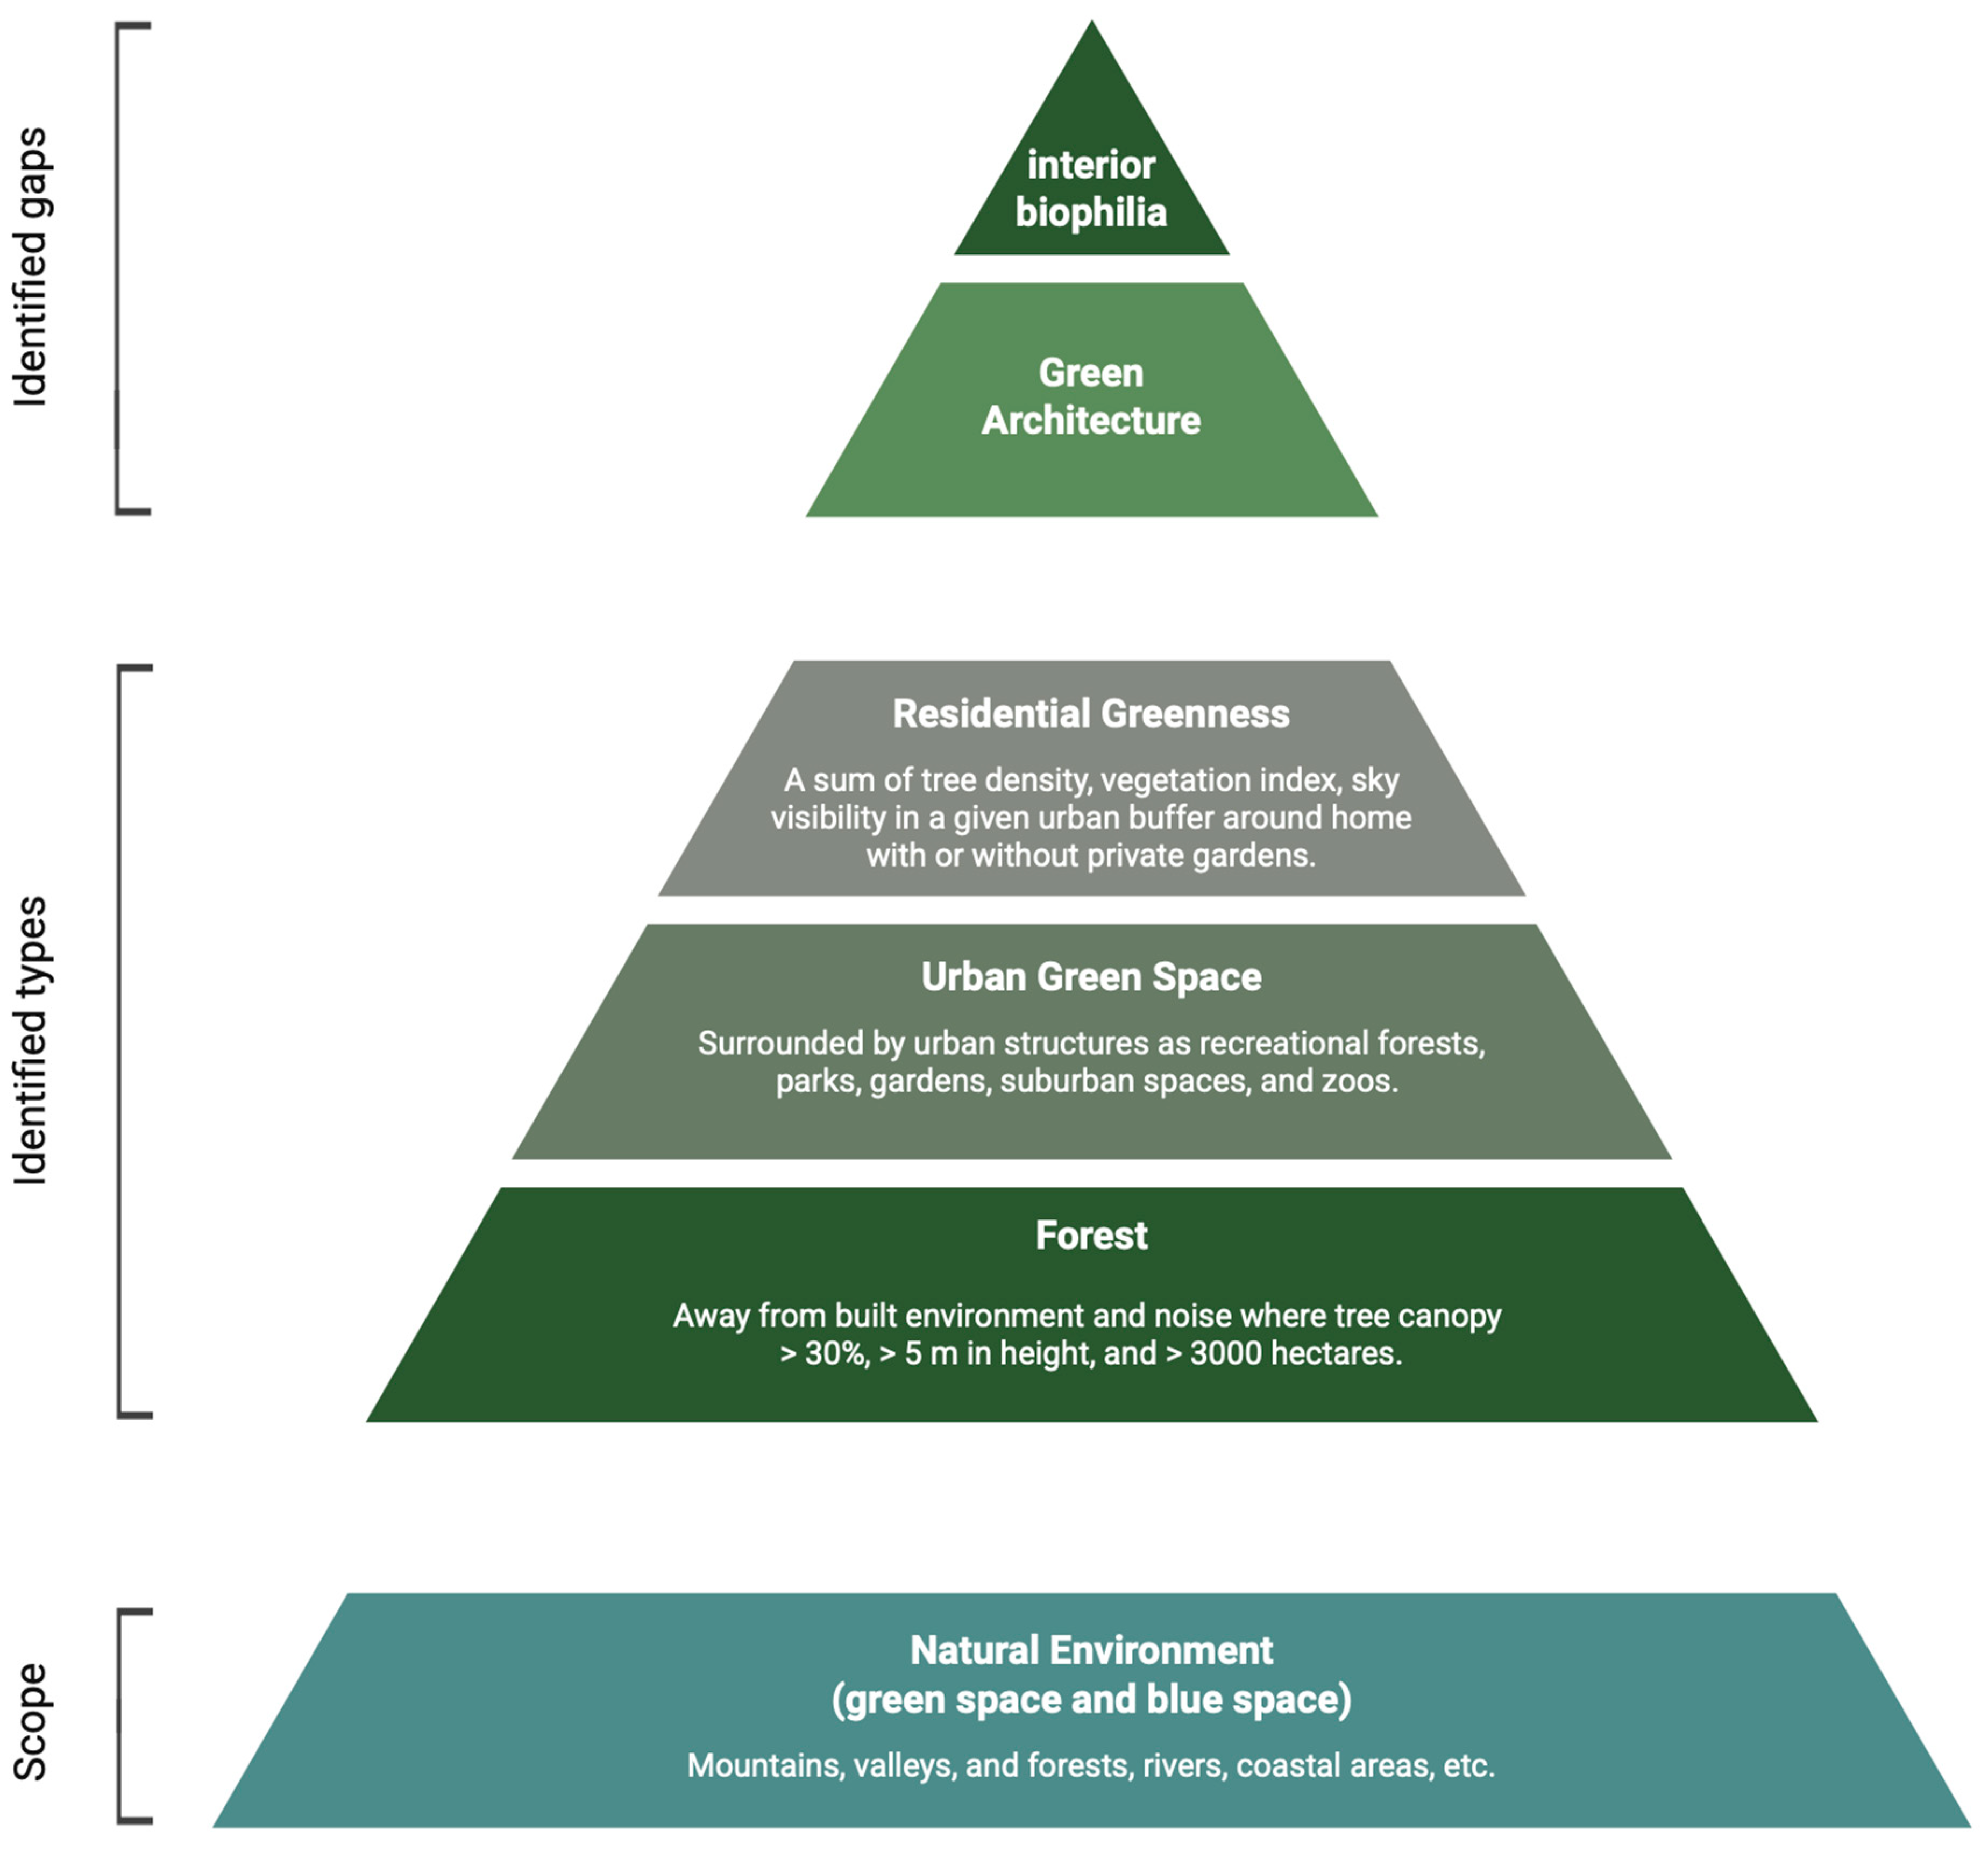
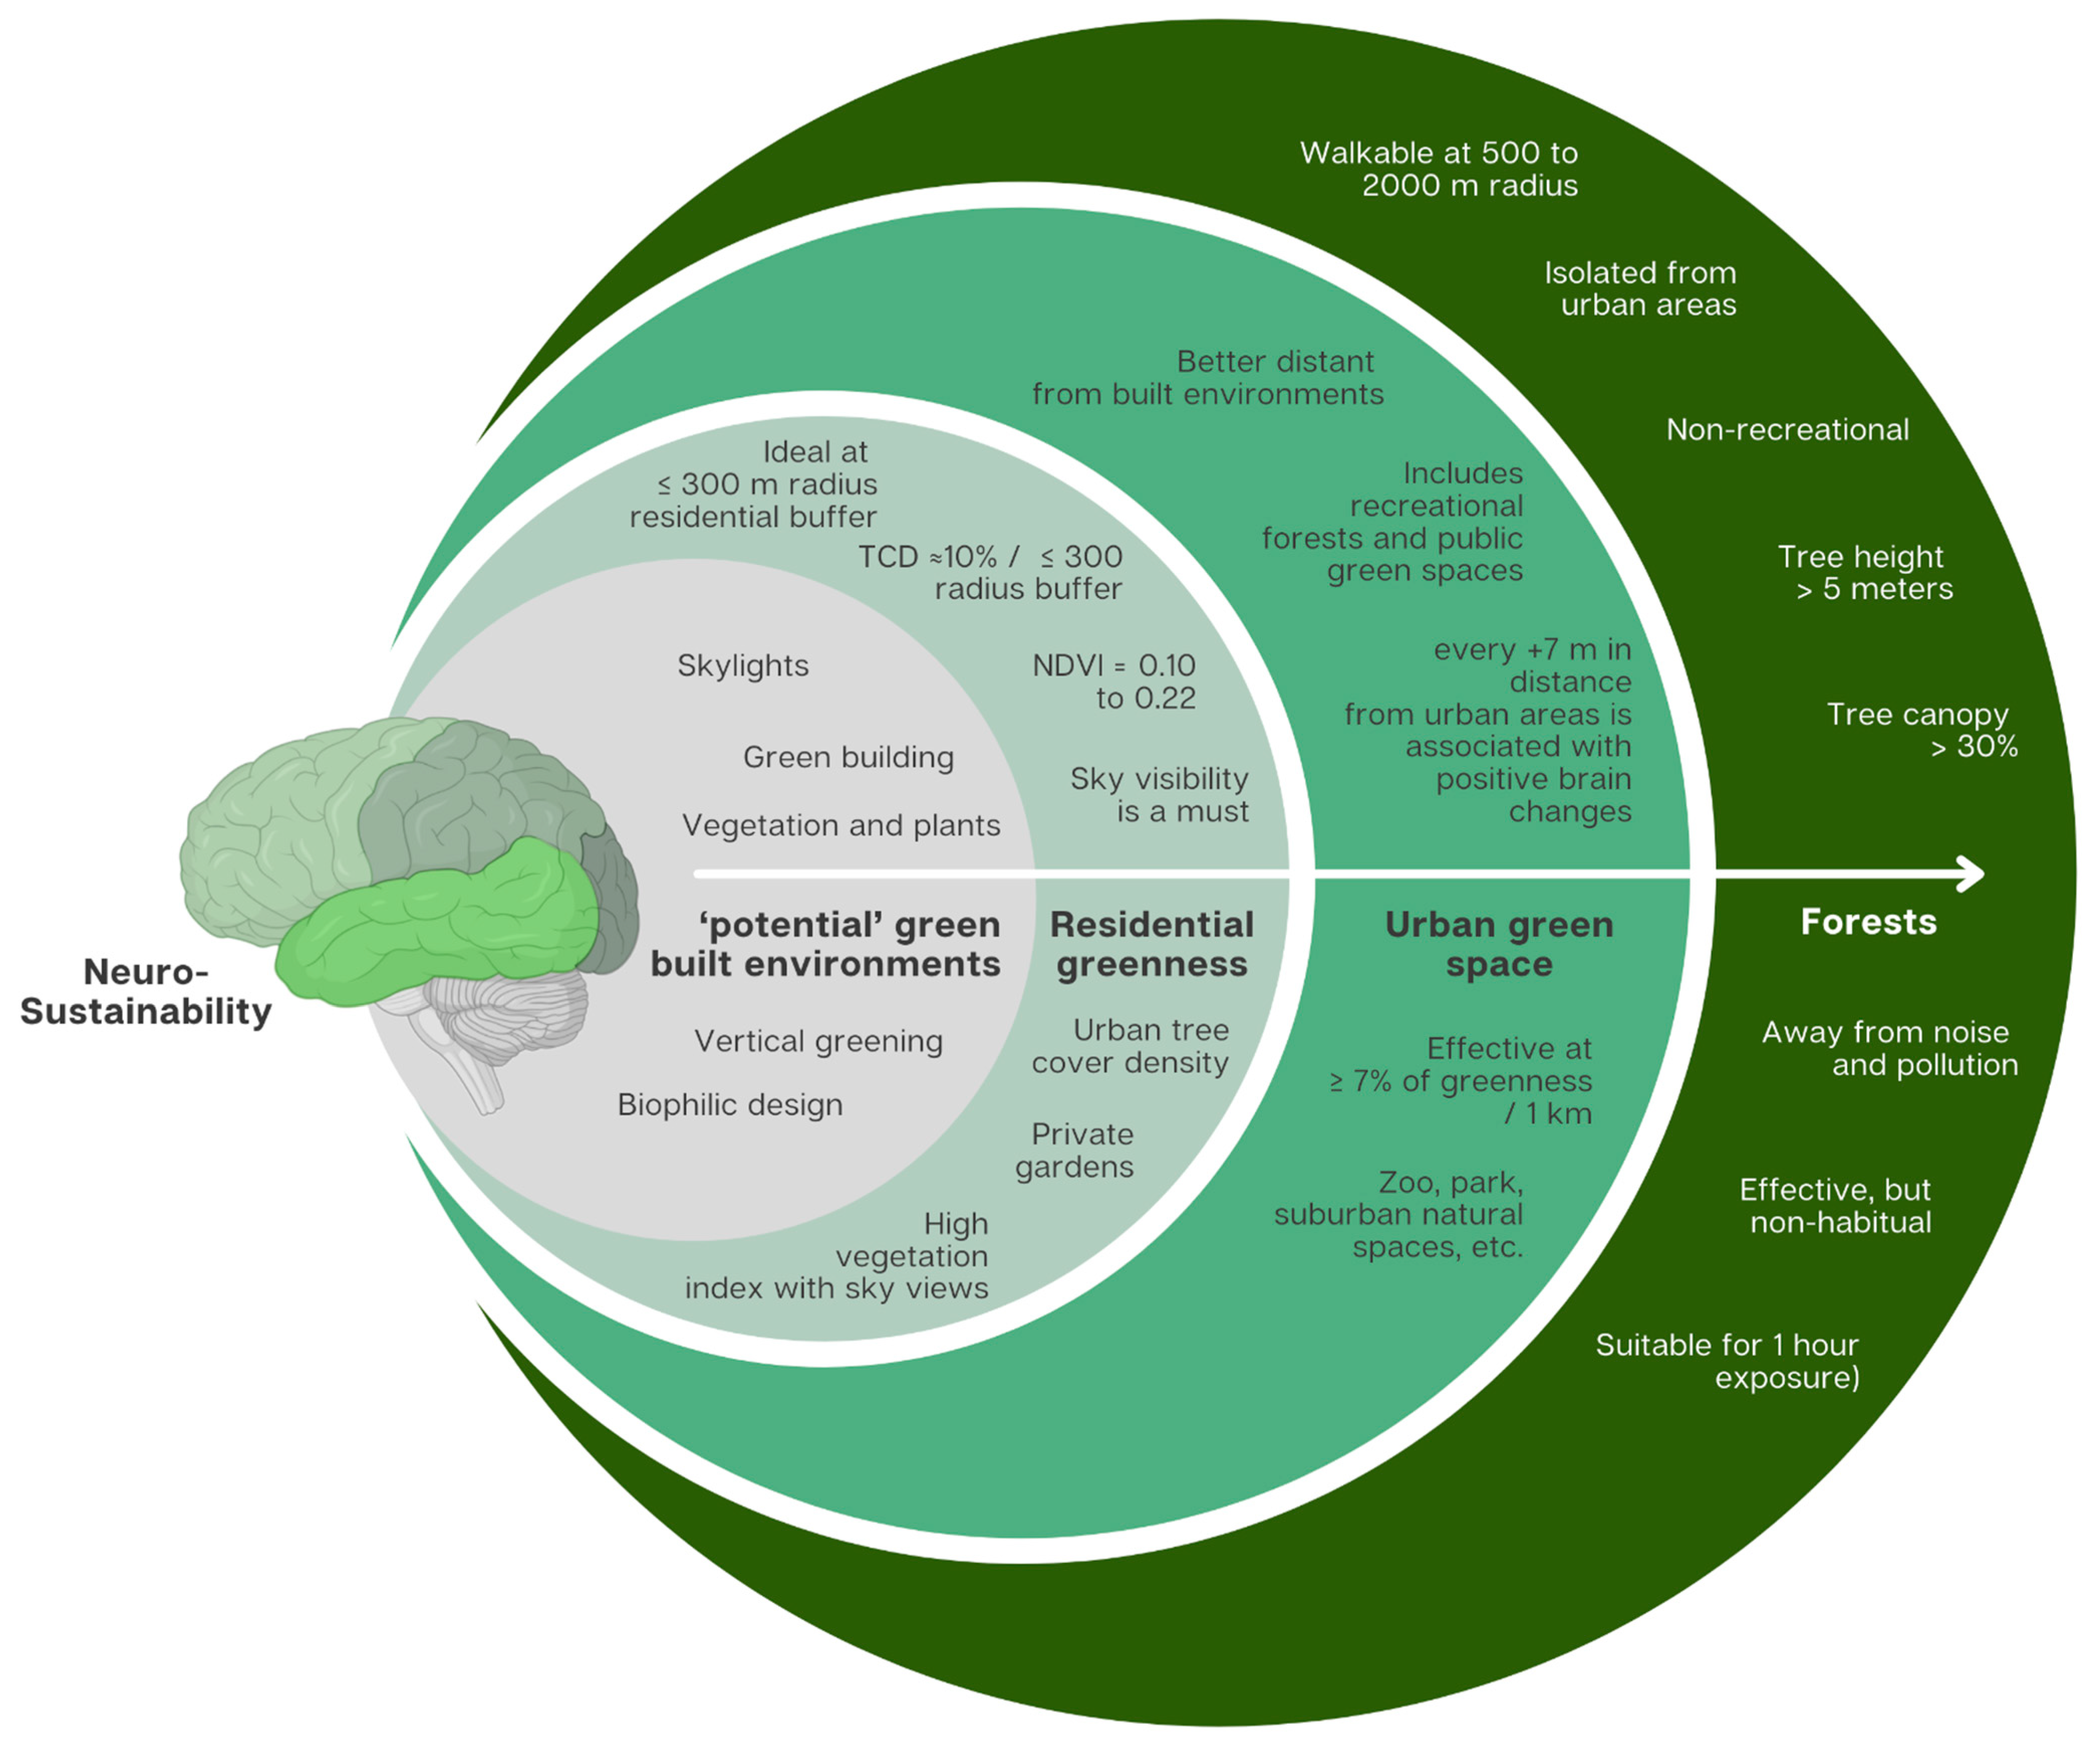
3.3. Green Environment Types’ Effective Parameters for Neurosustainability
3.3.1. Forests
3.3.2. Urban Green Space
3.3.3. Residential Greenness
4. Discussion
- Turning buildings into ‘forest’-like tree canopies through but not limited to adding natural vegetation to the building facades and using natural materials such as wood while maximising sky views in urban environments through setbacks. Green façades are shown to contribute to stress recovery and well-being in high-density cities [42], which supports that green building exteriors may have the same restorative effects that forests have on the amygdala and hippocampal subiculum [13,24,25]. Vertical greening is another trend that can be challenged if it is able to promote adaptive neuroplasticity since health and well-being outcomes are not objectively measured or quantified for studies published until October 2022 on vertical greening [43].
- Maximising tree cover density with sky visibility in urban environments, particularly within 300 radii around home addresses, including private gardens. This conclusion is supported by the findings obtained from this systematic review. The minimum 300 m radius is in line with WHO’s specification that accessibility to a green space should be no more than 300 m linear distance (5 min walk) from home, and with the European Common Indicator of local public open areas given the same 300 m distance from a public open area [44]. However, it appears through this systematic review that residential greenness may perform better than urban green space, which urges urban planners to rethink the parameters needed for a green environment to be effective for neurosustainability.
- Increasing indoor plants and providing sky views through skylights may be another way to maximise the potential impact of greenness due to the direct contact with plants and the sky since people spend more time indoors. To support this hypothesis, studies show that homebodies have poorer cognitive performance and poorer mental health compared to others who venture into the city [45,46], while greater time spent outdoors is found to be positively associated with grey matter volume in the prefrontal cortex [47], which is in line with the findings of this systematic review.
- Increasing vegetation in balconies to maximise short- and long-term exposure to green environments. It is not only plants in balconies that allow direct contact with a green environment, but sky visibility is highly present through this architectural liminality. This is a possible hypothesis that may hold significant potential for neurosustainability if it is difficult to test the indoor environment given the architectural design limitations and confounding variables available.
- Replicating current studies is important to facilitate conducting a meta-analysis for a specific green environment type, exposure duration, age groups, methods, or brain region-related adaptive changes.
- Exploring the feasibility of integrating green environments into unexplored geographic contexts is highly needed to open the door for generalisability.
- Exploring the application of greenness in contexts where forests are not available or in arid environments is challenging and needs more tailored methods.
- Exploring how to achieve the sky–tree–building balance to not have adverse effects on the human brain as a result of increased tree cover density without sky visibility is the future of urban planning- and design-related research.
- Exploring the effects of skylights in indoor spaces with or without natural greenery or biophilia on neuroplasticity changes is highly important since people spend most of their time indoors.
- Exploring the impact of green architecture or biophilic design, architectural or interior, on brain changes after short- and long-term exposure or both can deepen the understanding of the reported dynamics in this systematic review.
- Exploring the architectural materials that can mitigate the antagonistic effects of noise and pollution that may inhibit the effect of green environments is important.
- Exploring how urban environments can minimise the effect of grey space or eliminate it is another problem to solve.
- Exploring the impact of green environments on mental health through neuroplasticity such as depression, PTSD, BPD, bipolar disorder, and others to test whether nature can act as an environmental health-based protocol will further advance our understanding of the impact of green environments on public health.
- Exploring the underlying molecular mechanisms of how green environments lead to brain volume changes will help explore more creative solutions.
- Exploring the impact of private gardens as part of residential greenness needs more investigation since they hold greater potential due to their greater proximity within the residential buffer.
- Exploring the different effects of natural versus artificial or non-natural trees (e.g., liquid trees) that may not capture the profound effects of trees on the human brain is very important at a time when the artificial replication of nature is trending.
5. Conclusions
Funding
Institutional Review Board Statement
Informed Consent Statement
Data Availability Statement
Acknowledgments
Conflicts of Interest
Abbreviations
| FA | Fractional Anisotropy |
| GM | Grey Matter |
| WM | White Matter |
| TCD | Tree Cover Density |
| SVF | Sky View Factor |
| NDVI | Normalised Difference Vegetation Index |
| EVI | Enhanced Vegetation Index |
| NLCD | National Land Cover Database |
| CLC | Corine Land Cover |
| AD | Alzheimer’s Disease |
| ACC | Anterior Cingulate Cortex |
| rACC | Right Anterior Cingulate Cortex |
| rSFS | Right Superior Frontal Sulcus |
| OFC | Orbitofrontal Cortex |
| mOFC | Medial Orbitofrontal Cortex |
| rOFC | Right Orbitofrontal Cortex |
| p/sACC | Perigenual/Subgenual Anterior Cingulate Cortex |
References
- World Health Organization. Urban Green Space and Health: Intervention Impacts and Effectiveness Meeting Report; World Health Organization: Geneva, Switzerland, 2016; pp. 20–21. [Google Scholar]
- World Health Organization. Sustainable Cities: Health at the Heart of Urban Development. 2019. Available online: https://www.who.int/publications/m/item/sustainable-cities (accessed on 23 April 2025).
- Khalil, M.H. Neurosustainability. Front. Hum. Neurosci. 2024, 18, 1436179. [Google Scholar] [CrossRef] [PubMed]
- Van den Berg, M.; Wendel-Vos, W.; van Poppel, M.; Kemper, H.; van Mechelen, W.; Maas, J. Health benefits of green spaces in the living environment: A systematic review of epidemiological studies. Urban For. Urban Green. 2015, 14, 806–816. [Google Scholar] [CrossRef]
- Gianfredi, V.; Buffoli, M.; Rebecchi, A.; Croci, R.; Oradini-Alacreu, A.; Stirparo, G.; Marino, A.; Odone, A.; Capolongo, S.; Signorelli, C. Association between urban greenspace and health: A systematic review of literature. Int. J. Environ. Res. Public health 2021, 18, 5137. [Google Scholar] [CrossRef]
- Jabbar, M.; Yusoff, M.M.; Shafie, A. Assessing the role of urban green spaces for human well-being: A systematic review. GeoJournal 2022, 87, 4405–4423. [Google Scholar] [CrossRef]
- Roberts, H.; van Lissa, C.; Hagedoorn, P.; Kellar, I.; Helbich, M. The effect of short-term exposure to the natural environment on depressive mood: A systematic review and meta-analysis. Environ. Res. 2019, 177, 108606. [Google Scholar] [CrossRef] [PubMed]
- Van den Bosch, M.; Sang, Å. Urban natural environments as nature-based solutions for improved public health–A systematic review of reviews. Environ. Res. 2017, 158, 373–384. [Google Scholar] [CrossRef]
- Zhong, W.; Schröder, T.; Bekkering, J. Biophilic design in architecture and its contributions to health, well-being, and sustainability: A critical review. Front. Archit. Res. 2022, 11, 114–141. [Google Scholar] [CrossRef]
- Kühn, S.; Düzel, S.; Eibich, P.; Krekel, C.; Wüstemann, H.; Kolbe, J.; Martensson, J.; Goebel, J.; Gallinat, J.; Wagner, G.G.; et al. In search of features that constitute an “enriched environment” in humans: Associations between geographical properties and brain structure. Sci. Rep. 2017, 7, 11920. [Google Scholar] [CrossRef] [PubMed]
- Dettweiler, U.; Gerchen, M.; Mall, C.; Simon, P.; Kirsch, P. Choice matters: Pupils’ stress regulation, brain development and brain function in an outdoor education project. Br. J. Educ. Psychol. 2023, 93, 152–173. [Google Scholar] [CrossRef]
- Xu, J.; Liu, N.; Polemiti, E.; Garcia-Mondragon, L.; Tang, J.; Liu, X.; Lett, T.; Yu, L.; Nöthen, M.M.; Feng, J.; et al. Effects of urban living environments on mental health in adults. Nat. Med. 2023, 29, 1456–1467. [Google Scholar] [CrossRef]
- Sudimac, S.; Kühn, S. Can a nature walk change your brain? Investigating hippocampal brain plasticity after one hour in a forest. Environ. Res. 2024, 262, 119813. [Google Scholar] [CrossRef] [PubMed]
- Pu, F.; Chen, W.; Li, C.; Fu, J.; Gao, W.; Ma, C.; Cao, X.; Zhang, L.; Hao, M.; Zhou, J.; et al. Heterogeneous associations of multiplexed environmental factors and multidimensional aging metrics. Nat. Commun. 2024, 15, 4921. [Google Scholar] [CrossRef]
- Shang, X.; Wang, W.; Tian, L.; Shi, D.; Huang, Y.; Zhang, X.; Zhu, Z.; Zhang, X.; Liu, J.; Tang, S.; et al. Association of greenspace and natural environment with brain volumes mediated by lifestyle and biomarkers among urban residents. Arch. Gerontol. Geriatr. 2024, 126, 105546. [Google Scholar] [CrossRef] [PubMed]
- Baena-Extremera, A.; Martín-Pérez, C.; Catena, A.; Fuentesal-García, J. Green exercise versus indoor urban exercise: Related frontal brain thickness and cognitive performance. Ment. Health Phys. Act. 2024, 27, 100649. [Google Scholar] [CrossRef]
- Binter, A.-C.; Granés, L.; Bannier, E.; de Castro, M.; Petricola, S.; Fossati, S.; Vrijheid, M.; Chevrier, C.; El Marroun, H.; Nieuwenhuijsen, M.; et al. Urban environment during pregnancy and childhood and white matter microstructure in preadolescence in two European birth cohorts. Environ. Pollut. 2024, 346, 123612. [Google Scholar] [CrossRef] [PubMed]
- Webb, E.K.; Stevens, J.S.; Ely, T.D.; Lebois, L.A.M.; van Rooij, S.J.H.; Bruce, S.E.; House, S.L.; Beaudoin, F.L.; An, X.; Neylan, T.C.; et al. Neighborhood resources associated with psychological trajectories and neural reactivity to reward after trauma. JAMA Psychiatry 2024, 81, 1090–1100. [Google Scholar] [CrossRef]
- Besser, L.M.; Lovasi, G.S.; Zambrano, J.J.; Camacho, S.; Dhanekula, D.; Michael, Y.L.; Garg, P.; Hirsch, J.A.; Siscovick, D.; Hurvitz, P.M.; et al. Neighborhood greenspace and neighborhood income associated with white matter grade worsening: Cardiovascular Health Study. Alzheimer’s Dement. Diagn. Assess. Dis. Monit. 2023, 15, e12484. [Google Scholar] [CrossRef]
- Kühn, S.; Schmalen, K.; Beijers, R.; Tyborowska, A.; Roelofs, K.; Weerth, C.D. Green is not the same as green: Differentiating between the association of trees and open green spaces with children’s brain structure in the Netherlands. Environ. Behav. 2023, 55, 311–334. [Google Scholar] [CrossRef]
- Kühn, S.; Banaschewski, T.; Bokde, A.L.; Büchel, C.; Quinlan, E.B.; Desrivières, S.; Flor, H.; Grigis, A.; Garavan, H.; Gowland, P.; et al. Trees for brains: Current residential tree cover density and its association with brain structure in young adults. J. Environ. Psychol. 2023, 89, 102047. [Google Scholar] [CrossRef]
- Gianaros, P.J.; Miller, P.L.; Manuck, S.B.; Kuan, D.C.H.; Rosso, A.L.; Votruba-Drzal, E.E.; Marsland, A.L. Beyond neighborhood disadvantage: Local resources, green space, pollution, and crime as residential community correlates of cardiovascular risk and brain morphology in midlife adults. Psychosom. Med. 2023, 85, 378–388. [Google Scholar] [CrossRef]
- Tani, Y.; Fujiwara, T.; Sugihara, G.; Hanazato, M.; Suzuki, N.; Machida, M.; Amagasa, S.; Murayama, H.; Inoue, S.; Shobugawa, Y. Neighborhood beauty and the brain in older Japanese adults. Int. J. Environ. Res. Public Health 2022, 20, 679. [Google Scholar] [CrossRef] [PubMed]
- Sudimac, S.; Sale, V.; Kühn, S. How nature nurtures: Amygdala activity decreases as the result of a one-hour walk in nature. Mol. Psychiatry 2022, 27, 4446–4452. [Google Scholar] [CrossRef]
- Sudimac, S.; Kühn, S. A one-hour walk in nature reduces amygdala activity in women, but not in men. Front. Psychol. 2022, 13, 931905. [Google Scholar] [CrossRef] [PubMed]
- Kühn, S.; Düzel, S.; Mascherek, A.; Eibich, P.; Krekel, C.; Kolbe, J.; Goebel, J.; Gallinat, J.; Wagner, G.G.; Lindenberger, U. Urban green is more than the absence of city: Structural and functional neural basis of urbanicity and green space in the neighbourhood of older adults. Landsc. Urban Plan. 2021, 214, 104196. [Google Scholar] [CrossRef]
- Besser, L.M.; Lovasi, G.S.; Michael, Y.L.; Garg, P.; Hirsch, J.A.; Siscovick, D.; Hurvitz, P.; Biggs, M.L.; Galvin, J.E.; Bartz, T.M.; et al. Associations between neighborhood greenspace and brain imaging measures in non-demented older adults: The Cardiovascular Health Study. Soc. Psychiatry Psychiatr. Epidemiol. 2021, 56, 1575–1585. [Google Scholar] [CrossRef]
- Min, K.D.; Kim, J.S.; Park, Y.H.; Shin, H.Y.; Kim, C.; Seo, S.W.; Kim, S.Y. New assessment for residential greenness and the association with cortical thickness in cognitively healthy adults. Sci. Total Environ. 2021, 778, 146129. [Google Scholar] [CrossRef]
- Falcón, C.; Gascon, M.; Molinuevo, J.L.; Operto, G.; Cirach, M.; Gotsens, X.; Fauria, K.; Arenaza-Urquijo, E.M.; Pujol, J.; Sunyer, J.; et al. Brain correlates of urban environmental exposures in cognitively unimpaired individuals at increased risk for Alzheimer’s disease: A study on Barcelona’s population. Alzheimer’s Dement. Diagn. Assess. Dis. Monit. 2021, 13, e12205. [Google Scholar] [CrossRef]
- Crous-Bou, M.; Gascon, M.; Gispert, J.D.; Cirach, M.; Sánchez-Benavides, G.; Falcon, C.; Arenaza-Urquijo, E.M.; Gotsens, X.; Fauria, K.; Sunyer, J.; et al. Impact of urban environmental exposures on cognitive performance and brain structure of healthy individuals at risk for Alzheimer’s dementia. Environ. Int. 2020, 138, 105546. [Google Scholar] [CrossRef]
- Dzhambov, A.M.; Bahchevanov, K.M.; Chompalov, K.A.; Atanassova, P.A. A feasibility study on the association between residential greenness and neurocognitive function in middle-aged Bulgarians. Arch. Ind. Hyg. Toxicol. 2019, 70, 173–185. [Google Scholar] [CrossRef]
- Dadvand, P.; Pujol, J.; Macià, D.; Martínez-Vilavella, G.; Blanco-Hinojo, L.; Mortamais, M.; Alvarez-Pedrerol, M.; Fenoll, R.; Esnaola, M.; Dalmau-Bueno, A.; et al. The association between lifelong greenspace exposure and 3-dimensional brain magnetic resonance imaging in Barcelona schoolchildren. Environ. Health Perspect. 2018, 126, 027012. [Google Scholar] [CrossRef]
- United Nations. Healthy Forests, Healthy Planet, Healthy Humans. 2023. Available online: https://www.un.org/en/desa/healthy-forests-healthy-planet-healthy-humans (accessed on 23 April 2025).
- Costanza, R.; Daly, L.; Fioramonti, L.; Giovannini, E.; Kubiszewski, I.; Mortensen, L.F.; Pickett, K.E.; Ragnarsdottir, K.V.; De Vogli, R.; Wilkinson, R. Modelling and measuring sustainable wellbeing in connection with the UN Sustainable Development Goals. Ecol. Econ. 2016, 130, 350–355. [Google Scholar] [CrossRef]
- Turner-Skoff, J.B.; Cavender, N. The benefits of trees for livable and sustainable communities. Plants People Planet 2019, 1, 323–335. [Google Scholar] [CrossRef]
- Khalil, M.H. Walking and Hippocampal Formation Volume Changes: A Systematic Review. Brain Sci. 2025, 15, 52. [Google Scholar] [CrossRef]
- Khalil, M.H. Borderline in a linear city: Urban living brings borderline personality disorder to crisis through neuroplasticity—an urgent call to action. Front. Psychiatry 2025, 15, 1524531. [Google Scholar] [CrossRef]
- Ragheb, A.; El-Shimy, H.; Ragheb, G. Green architecture: A concept of sustainability. Procedia-Soc. Behav. Sci. 2016, 216, 778–787. [Google Scholar] [CrossRef]
- Elshafei, G.; Vilčeková, S.; Zeleňáková, M.; Negm, A.M. An extensive study for a wide utilization of green architecture parameters in built environment based on genetic schemes. Buildings 2021, 11, 507. [Google Scholar] [CrossRef]
- Zhong, W.; Schroeder, T.; Bekkering, J. Designing with nature: Advancing three-dimensional green spaces in architecture through frameworks for biophilic design and sustainability. Front. Archit. Res. 2023, 12, 732–753. [Google Scholar] [CrossRef]
- Harris, J.C.; Liuzzi, M.T.; Cardenas-Iniguez, C.; Larson, C.L.; Lisdahl, K.M. Gray space and default mode network-amygdala connectivity. Front. Hum. Neurosci. 2023, 17, 1167786. [Google Scholar] [CrossRef]
- Elsadek, M.; Liu, B.; Lian, Z. Green façades: Their contribution to stress recovery and well-being in high-density cities. Urban For. Urban Green. 2019, 46, 126446. [Google Scholar] [CrossRef]
- Fonseca, F.; Paschoalino, M.; Silva, L. Health and well-being benefits of outdoor and indoor vertical greening systems: A review. Sustainability 2023, 15, 4107. [Google Scholar] [CrossRef]
- World Health Organization. Urban Green Spaces and Health: A Review of Evidence; World Health Organization: Geneva, Switzerland, 2016. [Google Scholar]
- Khalil, M.H.; Steemers, K. Housing environmental enrichment, lifestyles, and public health indicators of neurogenesis in humans: A pilot study. Int. J. Environ. Res. Public Health 2024, 21, 1553. [Google Scholar] [CrossRef]
- McCormick, B.P.; Brusilovskiy, E.; Snethen, G.; Klein, L.; Townley, G.; Salzer, M.S. Getting out of the house: The relationship of venturing into the community and neurocognition among adults with serious mental illness. Psychiatr. Rehabil. J. 2022, 45, 18. [Google Scholar] [CrossRef] [PubMed]
- Kühn, S.; Mascherek, A.; Filevich, E.; Lisofsky, N.; Becker, M.; Butler, O.; Lochstet, M.; Mårtensson, J.; Wenger, E.; Lindenberger, U.; et al. Spend time outdoors for your brain–an in-depth longitudinal MRI study. World J. Biol. Psychiatry 2022, 23, 201–207. [Google Scholar] [CrossRef]
- Yeager, R.A.; Smith, T.R.; Bhatnagar, A. Green environments and cardiovascular health. Trends Cardiovasc. Med. 2020, 30, 241–246. [Google Scholar] [CrossRef] [PubMed]
- Andersen, L.; Corazon, S.S.; Stigsdotter, U.K. Nature exposure and its effects on immune system functioning: A systematic review. Int. J. Environ. Res. Public Health 2021, 18, 1416. [Google Scholar] [CrossRef]
- Egorov, A.I.; Griffin, S.M.; Converse, R.R.; Styles, J.N.; Sams, E.A.; Wilson, A.; Jackson, L.E.; Wade, T.J. Vegetated land cover near residence is associated with reduced allostatic load and improved biomarkers of neuroendocrine, metabolic and immune functions. Environ. Res. 2017, 158, 508–521. [Google Scholar] [CrossRef]
- Shin, J.C.; Parab, K.V.; An, R.; Grigsby-Toussaint, D.S. Greenspace exposure and sleep: A systematic review. Environ. Res. 2020, 182, 109081. [Google Scholar] [CrossRef] [PubMed]
- Stenfors, C.U.; Stengård, J.; Hanson, L.L.M.; Kecklund, L.G.; Westerlund, H. Green sleep: Immediate residential greenspace and access to larger green areas are associated with better sleep quality, in a longitudinal population-based cohort. Environ. Res. 2023, 234, 116085. [Google Scholar] [CrossRef]
- Egorov, A.I.; Griffin, S.M.; Styles, J.N.; Kobylanski, J.; Klein, J.; Wickersham, L.; Ritter, R.; Sams, E.; Hudgens, E.E.; Wade, T.J. Time outdoors and residential greenness are associated with reduced systemic inflammation and allostatic load. Environ. Pollut. 2024, 344, 123408. [Google Scholar] [CrossRef]
- Rufo, J.C.; Paciencia, I.; Ribeiro, A.I. Green environments and allergic diseases in children: A scoping review. Curr. Epidemiol. Rep. 2019, 6, 442–448. [Google Scholar] [CrossRef]
- Jansson, M.; Fors, H.; Lindgren, T.; Wiström, B. Perceived personal safety in relation to urban woodland vegetation–A review. Urban For. Urban Green. 2013, 12, 127–133. [Google Scholar] [CrossRef]
- Jelks, N.T.O.; Jennings, V.; Rigolon, A. Green gentrification and health: A scoping review. Int. J. Environ. Res. Public Health 2021, 18, 907. [Google Scholar] [CrossRef] [PubMed]
- Quinton, J.; Nesbitt, L.; Sax, D. How well do we know green gentrification? A systematic review of the methods. Prog. Hum. Geogr. 2022, 46, 960–987. [Google Scholar] [CrossRef] [PubMed]
| Study | PEDro Scale Items * | ||||||||||
|---|---|---|---|---|---|---|---|---|---|---|---|
| 1 | 2 | 3 | 4 | 5 | 6 | 7 | 8 | 9 | 10 | Total Score | |
| Dettweiler et al. [11] | N | N | N | N | N | N | Y | Y | Y | Y | 4 |
| Sudimac and Kühn [13] | Y | N | Y | N | N | N | Y | Y | Y | Y | 6 |
| Sudimac et al. [24] | Y | N | Y | N | N | N | Y | Y | Y | Y | 6 |
| Sudimac and Kühn [25] | Y | N | Y | N | N | N | Y | Y | Y | Y | 6 |
| Study | ROBINS-I Tool * | |||||||
|---|---|---|---|---|---|---|---|---|
| D1 | D2 | D3 | D4 | D5 | D6 | D7 | Overall | |
| Kühn et al. [10] | + | + | + | + | + | + | + | + |
| Xu et al. [12] | ? | + | + | + | + | + | + | + |
| Pu et al. [14] | ? | + | + | + | + | + | + | + |
| Shang et al. [15] | + | + | + | + | + | + | + | + |
| Baena-Extremera et al. [16] | ? | + | + | ? | + | + | + | ? |
| Binter et al. [17] | + | ? | + | + | + | + | ? | ? |
| Webb et al. [18] | + | + | + | + | + | + | + | + |
| Besser et al. [19] | + | + | + | + | + | + | + | + |
| Kühn et al. [20] | + | + | + | + | + | + | ? | + |
| Kühn et al. [21] | + | + | + | + | + | + | ? | + |
| Gianaros et al. [22] | + | + | + | + | + | + | + | + |
| Tani et al. [23] | + | + | + | + | + | + | + | + |
| Kühn et al. [26] | ? | + | + | + | + | + | + | + |
| Besser et al. [27] | + | + | + | + | + | + | + | + |
| Min et al. [28] | + | + | + | + | + | + | + | + |
| Falcón et al. [29] | + | + | + | + | + | ? | ? | ? |
| Crous-Bou et al. [30] | + | + | + | + | + | + | + | + |
| Dzhambov et al. [31] | + | ? | + | + | + | + | + | + |
| Dadvand et al. [32] | + | + | + | + | + | + | + | + |
 Adults (females) |  Prenatal | 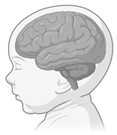 Children | 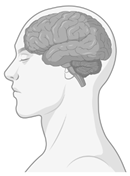 Adults | 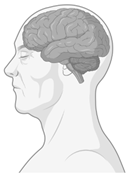 Older adults |
| Reduced amygdala activity to stress [25]. | Higher whole-brain FA [17]. | Bilateral prefrontal cortex, temporal cortex, parietal lobe [20]. Prefrontal cortex, premotor cortex, and cerebellum GM, and WM volumes [32]. | Bilateral subiculum [13], precuneus [14], total brain, WM and GM [15], rACC and rSFS [16], greater amygdala reactivity to reward [18], and rOFC GM [21]. | Amygdala [10,12], cerebellum [12], mOFC and insula [23], p/sACC [26], ventricle grade [27], global cortical, parietal and occipital cortex thickness [28], middle frontal cortex, left precentral cortex, right temporal cortex [29], frontal cortex [12], and cortical thickness [30]. |
| Green Environment | Description |
|---|---|
| Natural environment | A very broad term defined as including mountains, valleys, and forests excluding urban greenspaces such as city parks [15], or defined as to broadly include water, arable land, and coastal areas, as derived from the Land Cover Map 2007 [16]. |
| Forest | A precise term defining forests as areas with the ground coverage of tree canopy greater than 30% and tree height greater than 5 m, covering over 3000 hectares, without built structures and free from traffic noise [10,13,24,25]. |
| Urban green | A term used to refer to land primarily used for recreational purposes, such as parks, gardens, and suburban natural spaces functioning as parks or zoos where forests and green fields are also classified as urban green if they show signs of recreational use and are surrounded by urban structures [10,26]. For instance, tree-covered parks within cities are considered urban green areas. |
| Residential greenness/greenspace | A single concept with multiple identification terms, quantifying the percentage of greenness around a residential area in a given buffer. It is defined as the (a) percentage of land categorised as green within specified buffers around participants’ residential addresses, based on the Generalised Land Use Database (GLUD) [14], (b) percentage of ‘impenetrable surface areas’ (roads, rooftops, parking lots) within a census tract, reversed in coding so higher values represent more green spaces [22], or (c) percentage of greenspace coverage within circular buffers around each home location polygon, calculated as an area-weighted average for each participant [15]. Residential greenness may include private gardens [12]. |
| Adaptive Neuroplasticity Across Primary Brain Regions | Green environment type | |||||
|---|---|---|---|---|---|---|
| Natural env. | Forest | Urban Green Space | Residential Greenness | Green Architecture | Biophilic Interiors | |
| Amygdala | Not sig. for structural integrity [10] | Effective for structural integrity and reduced reactivity [10,24,25] | Not sig. for structural integrity [10] | Effective for greater reward reactivity [18]; and for structural protection [12] | —* | — |
| Hippocampus | — | Effective for subiculum volume increases [13] | — | Effective for the para-hippocampal gyrus [20]; indirectly effective for total volume [22]; Not sig. [27] | — | — |
| Cerebrum (frontal, orbitofrontal; prefrontal, parietal, occipital, premotor, precentral, insular or anterior cingulate cortex). | Not sig. for structural integrity or volume changes [10,14]; but effective for volume increase with exercise [16] | Not sig. for structural integrity [10] | Not sig. for structural integrity [10] | Effective for structural protection [12]; and volume increases [14,21,28,29,32]; through sky visibility [20] | — | — |
| Cerebellum | — | — | — | Effective for structural protection [12]; and volume increase [32] | — | — |
| Ventricle grade | — | — | — | Effective [19,27] | — | — |
| Whole-brain FA | — | — | Effective when more distant [17] | — | — | — |
| Adaptive Neuroplasticity Across Brain Subregions | Exposure to a Green Environment | |
|---|---|---|
| Acute | Long-Term | |
| Amygdala | Sig. [24,25] | Sig. [10,12,18]; developmental influence [11] |
| Hippocampus * | Sig. [13] ‘subiculum’ | Sig. [20,22] for total and parahippocampal gyrus; Not Sig. [27]; developmental influence [11] |
| Frontal/prefrontal cortex | — ** | Sig. [12,20,32] |
| Temporal cortex | — | Sig. [20,29] |
| Parietal cortex | — | Sig. [20,28] |
| Occipital cortex | — | Sig. [20,28] |
| Premotor cortex | — | Sig. [32] |
| Precentral cortex | — | Sig. [29] |
| Precuneus | — | Sig. [14] |
| ACC | — | Sig. [16,26]; age-frequency influenced [11] |
| rSFS | — | Sig. [16] |
| OFC | — | Sig. [21]; but for subjective beauty [23] |
| Insula | — | Sig. for subjective beauty [23] |
| Cerebellum | — | Sig. [12,32] |
| Ventricle grade | — | Sig. [19]; borderline sig. [27] |
| Whole-brain FA | — | Sig. [17] |
| Reference | Age in Years: Mean ± SD | Greenness Buffer | Duration | Greenness Definition | Effectiveness Measurements | Brain Region with Sig. Change | Sig. | Coefficients/Effects Associated Neuroplasticity Outcomes |
|---|---|---|---|---|---|---|---|---|
| Kühn et al. [10] | 70.1 ± 3.89 | 500, 1000 and 2000 m | ≈8 years | Forest, urban green, water | Forest |
a. Amygdala
b. pACC c. DLPFC |
a. 0.010
b. Not sig. c. Not sig. | a. β = 0.232. |
| Dettweiler et al. [11] | Fifth and sixth graders (≈10–12 years) | —* | 1 year (1 day/week) | Forest | Through the given frequency, studying in the forest only had a modest effect on the ACC but was influenced by outliers. | Hippocampus, amygdala, ACC. | — | — |
| Xu et al. [12] | 59.1 ± 8.09; but individuals with neuroimaging are 57.77 ± 7.49 | 300 m | — | a. Natural environment % vs. built b. Green space % c. Domestic garden % Method used (NDVI) | Protective factors like greenness and destination accessibility are inversely correlated with anxiety (r = 0.10, Pperm < 0.001), mediated by emotion-related brain regions, explaining 1.65% of the variance. | Amygdala, cerebellum and regions in the frontal cortex. | <0.001 | — |
| Sudimac and Kühn [13] | Urban: 28.73 ± 7.49; Nature: 25.90 ± 5.67 | — | 1 h | Forest | Walk in the forest not urban environment | Bilateral subiculum volume | 0.010 | t(29) = −2.758 |
| Pu et al. [14] | 55.46 ± 7.37 | 1000 m | ≈4 years | Green space (correlated with blue space) | Green space = (45.21% ± 21.58% at 1000 m buffer) contributed to 39.4% of the variance in brain volume, 49% in white matter volume, and 21.7% in gray matter volume. | Precuneus | 0.002 | β = 0.006 |
| Blue space = (1.26% ± 2.46% at 1000 m buffer) contributed to 6.3% of the variance in brain volume, 12.1% in white matter volume, and 3.8% in gray matter volume. | — | Not sig. | — | |||||
| Shang et al. [15] | 54.7 ± 7.5 at baseline; 63.5 ± 7.6 years at MRI | 300 m and 1000 m | 8.8 years | Residential greenspace | Each 10% increase in greenness at 1000 m. | a. Total brain b. Grey matter c. White matter | a. 0.0065 b. 0.0004 c. 0.0014 | a. β = 0.013 (95% CI: 0.005, 0.020) b. β = 0.013 (95% CI: 0.006, 0.020) c. β = 0.011 (95% CI: 0.004, 0.017) |
| Natural environment | Each 10% increase in natural environment at 1000 m. | a. Total brain b. Grey matter c. White matter | a. Not sig. b. 0.0084 c. 0.0040 | a. β = 0.010 (95% CI: 0.004, 0.017) b. β = 0.009 (95% CI: 0.004, 0.015) c. β = 0.010 (95% CI: 0.004, 0.016) | ||||
| Baena-Extremera et al. [16] | Green exercise: 39.91 ± 6.35; Urban exercise: 40.00 ± 6.19 | N/A | >5 years | Natural environment | Exercise in mountains, valleys, and forests. | a. rACC b. rSFS | a. 0.034 b. 0.037 | a. t = 2.181 b. t = 2.151 |
| Binter et al. [17] | Gen. R cohort: 10.1 ± 0.6; PELAGIE cohort: 10.8 ± 0.3 | 300 m; distance to green space and blue space and area | 9 years | NDVI, Distance to public green space, and public green space area | Greater distance to the nearest major green space during pregnancy was associated with higher whole-brain FA per 7 m increase. | Whole-brain FA | — | a. β = 0.001 (95%CI 0.000; 0.002) |
| Webb et al. [18] | 36.5 ± 13.4 | 100 m | 2 weeks | NDVI | NDVI was associated with greater neural reactivity to reward in the amygdala. | Amygdala | 0.02 | β = 0.18; t277 = 2.83 |
| Besser et al. [19] | 75 ± 4.4 | 1000 m | ≈ 5 years | NLCD | Greenspace alone (split at a median of 37%) was insignificant. | a. WM grade b. Ventricle grade | Not sig: a. 0.09 b. 0.49 | a. OR = 1.36 (95% CI: 0.95–1.95) b. OR = 0.88 (95% CI: 0.62–1.26) |
| Kühn et al. [20] | 12.78 ± 0.27 | 200 m, 500 m, and 1000 m | 12.5 years | TCD, CLC (open green space with the sky view factor (SVF)) | TCD: 9.41% ± 5.43% (200 m buffer) negatively associated with many GM clusters that were visible at the 500 m radius but smaller. No significance at the 1000 m radius. | Clusters within the fronto-median wall, bilateral lateral prefrontal cortex, right middle temporal and left middle occipital gyrus. | <0.001 | Negative associations with Medial orbitofrontal cortex, left and medial superior frontal gyrus, right middle frontal gyrus, right middle temporal gyrus, anterior cingulate cortex, right inferior frontal gyrus, left middle occipital gyrus, right inferior frontal gyrus, left middle frontal gyrus. |
| OGS: 8.73% ± 14.32% (200 m buffer) had positive associations with many GM clusters. Clusters were visible at the 500 m radius but smaller, but there was no significance at the 1000 m radius. | OSG: Clusters within the bilateral prefrontal cortex and temporal cortex. | <0.001 | Positive associations with Left middle temporal gyrus/occipital middle gyrus, right dorsolateral prefrontal cortex, right superior temporal gyrus, left and right inferior and right middle frontal gyrus, left middle temporal gyrus, left middle occipital gyrus, left middle occipital gyrus, left middle frontal gyrus. | |||||
| SVF: Blitaletral areas and parietal lobe. | <0.001 | Positive associations with Left inferior parietal lobe, right parahippocampal gyrus, left frontal mid orbital gyrus, left inferior parietal lobe, left superior frontal gyrus, right middle temporal gyrus, right superior frontal gyrus, right middle frontal gyrus, left frontal mid orbital gyrus, left inferior parietal lobe, left superior medial frontal, left inferior parietal lobe, left superior medial frontal. | ||||||
| Kühn et al. [21] | 22.1 ± 0.67 | 500 m, 1000 m, and 2000 m | — | TCD | TCD = 10.12% (500 m). No significant findings for 1000 m (10.79%) and 2000 m (12.02%). | Right orbitofrontal cortex (rOFC) GM. | <0.001 | — |
| Gianaros et al. [22] | 42.52 ± 0.35 | — | — | Green space percentage <40% and ≥40% | ≥40% greenness. | a. Cortical volume b. Hippocampal volume | Indirect | Mediated by cardiometabolic risk, and weaker for hippocampal volume than cortical volume. |
| Tani et al. [23] | 70.1 ± 5.4 | 1000 m | 30 years | Subjective and objective (NDVI, green space, blue space) | Subjective beauty, which was higher for a mountain area than a downtown area. | a. mOFC b. Insula | a. mOFC: 0.001 left, 0.01 right b. Insula: 0.002 left, <0.0001 right. | a. 242 (95% CI 118, 366) in the left mOFC, and 166 (95% CI 47, 286) in the right mOFC b. 218 (95% CI 79, 356) in the left insula, and 317 (95% CI 162, 472) in the right insula. |
| Sudimac et al. [24] | 27.21 ± 6.61 | — | 1 h | Forest | Walking in the forest, not the urban environment. | Amygdala | 0.014 | t(31) = 2.62 |
| Sudimac and Kühn [25] | 27.21 ± 6.61 | — | 1 h | Forest | Women walking in the forest, not men. | Amygdala | 0.034 | t(14) = 2.35 |
| Kühn et al. [26] | 70.1 ± 3.77 | 1000 m | — | Urban green | Urban green 6.79% ± 9.03%. | Perigenual/subgenual anterior cingulate cortex (p/sACC) | <0.001 | 13% of the variance in the volume of p/sACC is explained by adding urban green to the regression model. |
| Besser et al. [27] | 79.1 ± 4.1 | 1000 m and 5000 m | 5 years | NLCD for 1000 m buffer | Greenspace: 38.3% (SD = 27.6%) 5 y. before MRI, 29.5% (SD = 26.6%) at MRI. | a. Hippocampus b. ventricle grade | a. Not sig. b. 0.06 | a. — b. −0.30 (95% CI: −0.61, 0.00) |
| Min et al. [28] | 68.0 ± 10.1 | 750 m | 1 year | EVI | Urban EVI = 0.28 |
a. Global cortical thickness
b. Parietal cortex c. Occipital cortex d. Frontal cortex |
a. 0.038
b. 0.009 c. 0.021 d. Not sig. |
a. 7 μm (CI: 0–13 μm)
b. 11 μm (3–20 μm) c. 9 μm (1–16 μm) — |
| Falcón et al. [29] | 58.6 ± 7.5 | 300 m | >3 years | NDVI | — | a. Middle frontal cortex b. Left precentral c. Right temporal | <0.001 (uncorrected) | a. 441 voxels b. 528 voxels c. 730 voxels |
| Crous-Bou et al. [30] | 57.7 ± 7.6 | 300 m | >3 years | NDVI | NDVI: 0.22 ± 0.06 |
a. Cortical thickness
b. Hippocampal volume c. ventricles volume |
a. 0.03
b. Not sig. c. Not sig. | a. β = 0.08 |
| Dzhambov et al. [31] | 49.73 ± 3.20 | 500 m | >5 years | NDVI | NDVI: 0.40 ± 0.08 | Cortical thickness | Not sig. | — |
| Dadvand et al. [32] | 8.4 ± 1.3 | 100 m | ≈ 8.5 | NDVI | NDVI: 0.10 ± 0.06 | Prefrontal cortex, premotor cortex, cerebellum | all < 0.05 | GM volume: Left prefrontal cortex (t = 3.05) Right prefrontal cortex (t = 2.7) Left premotor cortex (t = 3.05) WM volume: Right prefrontal region (t = 3.04) Left premotor region (t = 2.97) Cerebellum: left (t = 3.34) Cerebellum: right (t = 3.26). |
Disclaimer/Publisher’s Note: The statements, opinions and data contained in all publications are solely those of the individual author(s) and contributor(s) and not of MDPI and/or the editor(s). MDPI and/or the editor(s) disclaim responsibility for any injury to people or property resulting from any ideas, methods, instructions or products referred to in the content. |
© 2025 by the author. Licensee MDPI, Basel, Switzerland. This article is an open access article distributed under the terms and conditions of the Creative Commons Attribution (CC BY) license (https://creativecommons.org/licenses/by/4.0/).
Share and Cite
Khalil, M.H. Green Environments for Sustainable Brains: Parameters Shaping Adaptive Neuroplasticity and Lifespan Neurosustainability—A Systematic Review and Future Directions. Int. J. Environ. Res. Public Health 2025, 22, 690. https://doi.org/10.3390/ijerph22050690
Khalil MH. Green Environments for Sustainable Brains: Parameters Shaping Adaptive Neuroplasticity and Lifespan Neurosustainability—A Systematic Review and Future Directions. International Journal of Environmental Research and Public Health. 2025; 22(5):690. https://doi.org/10.3390/ijerph22050690
Chicago/Turabian StyleKhalil, Mohamed Hesham. 2025. "Green Environments for Sustainable Brains: Parameters Shaping Adaptive Neuroplasticity and Lifespan Neurosustainability—A Systematic Review and Future Directions" International Journal of Environmental Research and Public Health 22, no. 5: 690. https://doi.org/10.3390/ijerph22050690
APA StyleKhalil, M. H. (2025). Green Environments for Sustainable Brains: Parameters Shaping Adaptive Neuroplasticity and Lifespan Neurosustainability—A Systematic Review and Future Directions. International Journal of Environmental Research and Public Health, 22(5), 690. https://doi.org/10.3390/ijerph22050690