
Linking Household and Service Provisioning Assessments to Estimate a Metric of Effective Health Coverage: A Metric for Monitoring Universal Health Coverage


Abstract
1. Background
- (a)
- Link the household survey, provider assessment, and patient exit survey using exact-match and ecological-linking techniques.
- (b)
- Estimate a metric of effective coverage of healthcare interventions encompassing antenatal, delivery, postnatal, immunization, ambulatory, and inpatient care in the study area.
- (c)
- Compare the effective coverage estimates obtained using exact-match and ecological linking methods.
2. Methodology
2.1. Area Setting
2.2. Study Design, Participants, and Data Collection
2.2.1. Household Survey
2.2.2. Health Facility Assessment
2.2.3. Patient Exit Interviews
2.3. Linking
2.3.1. Individual Linking (Exact Match Linking)
2.3.2. Ecological Linking
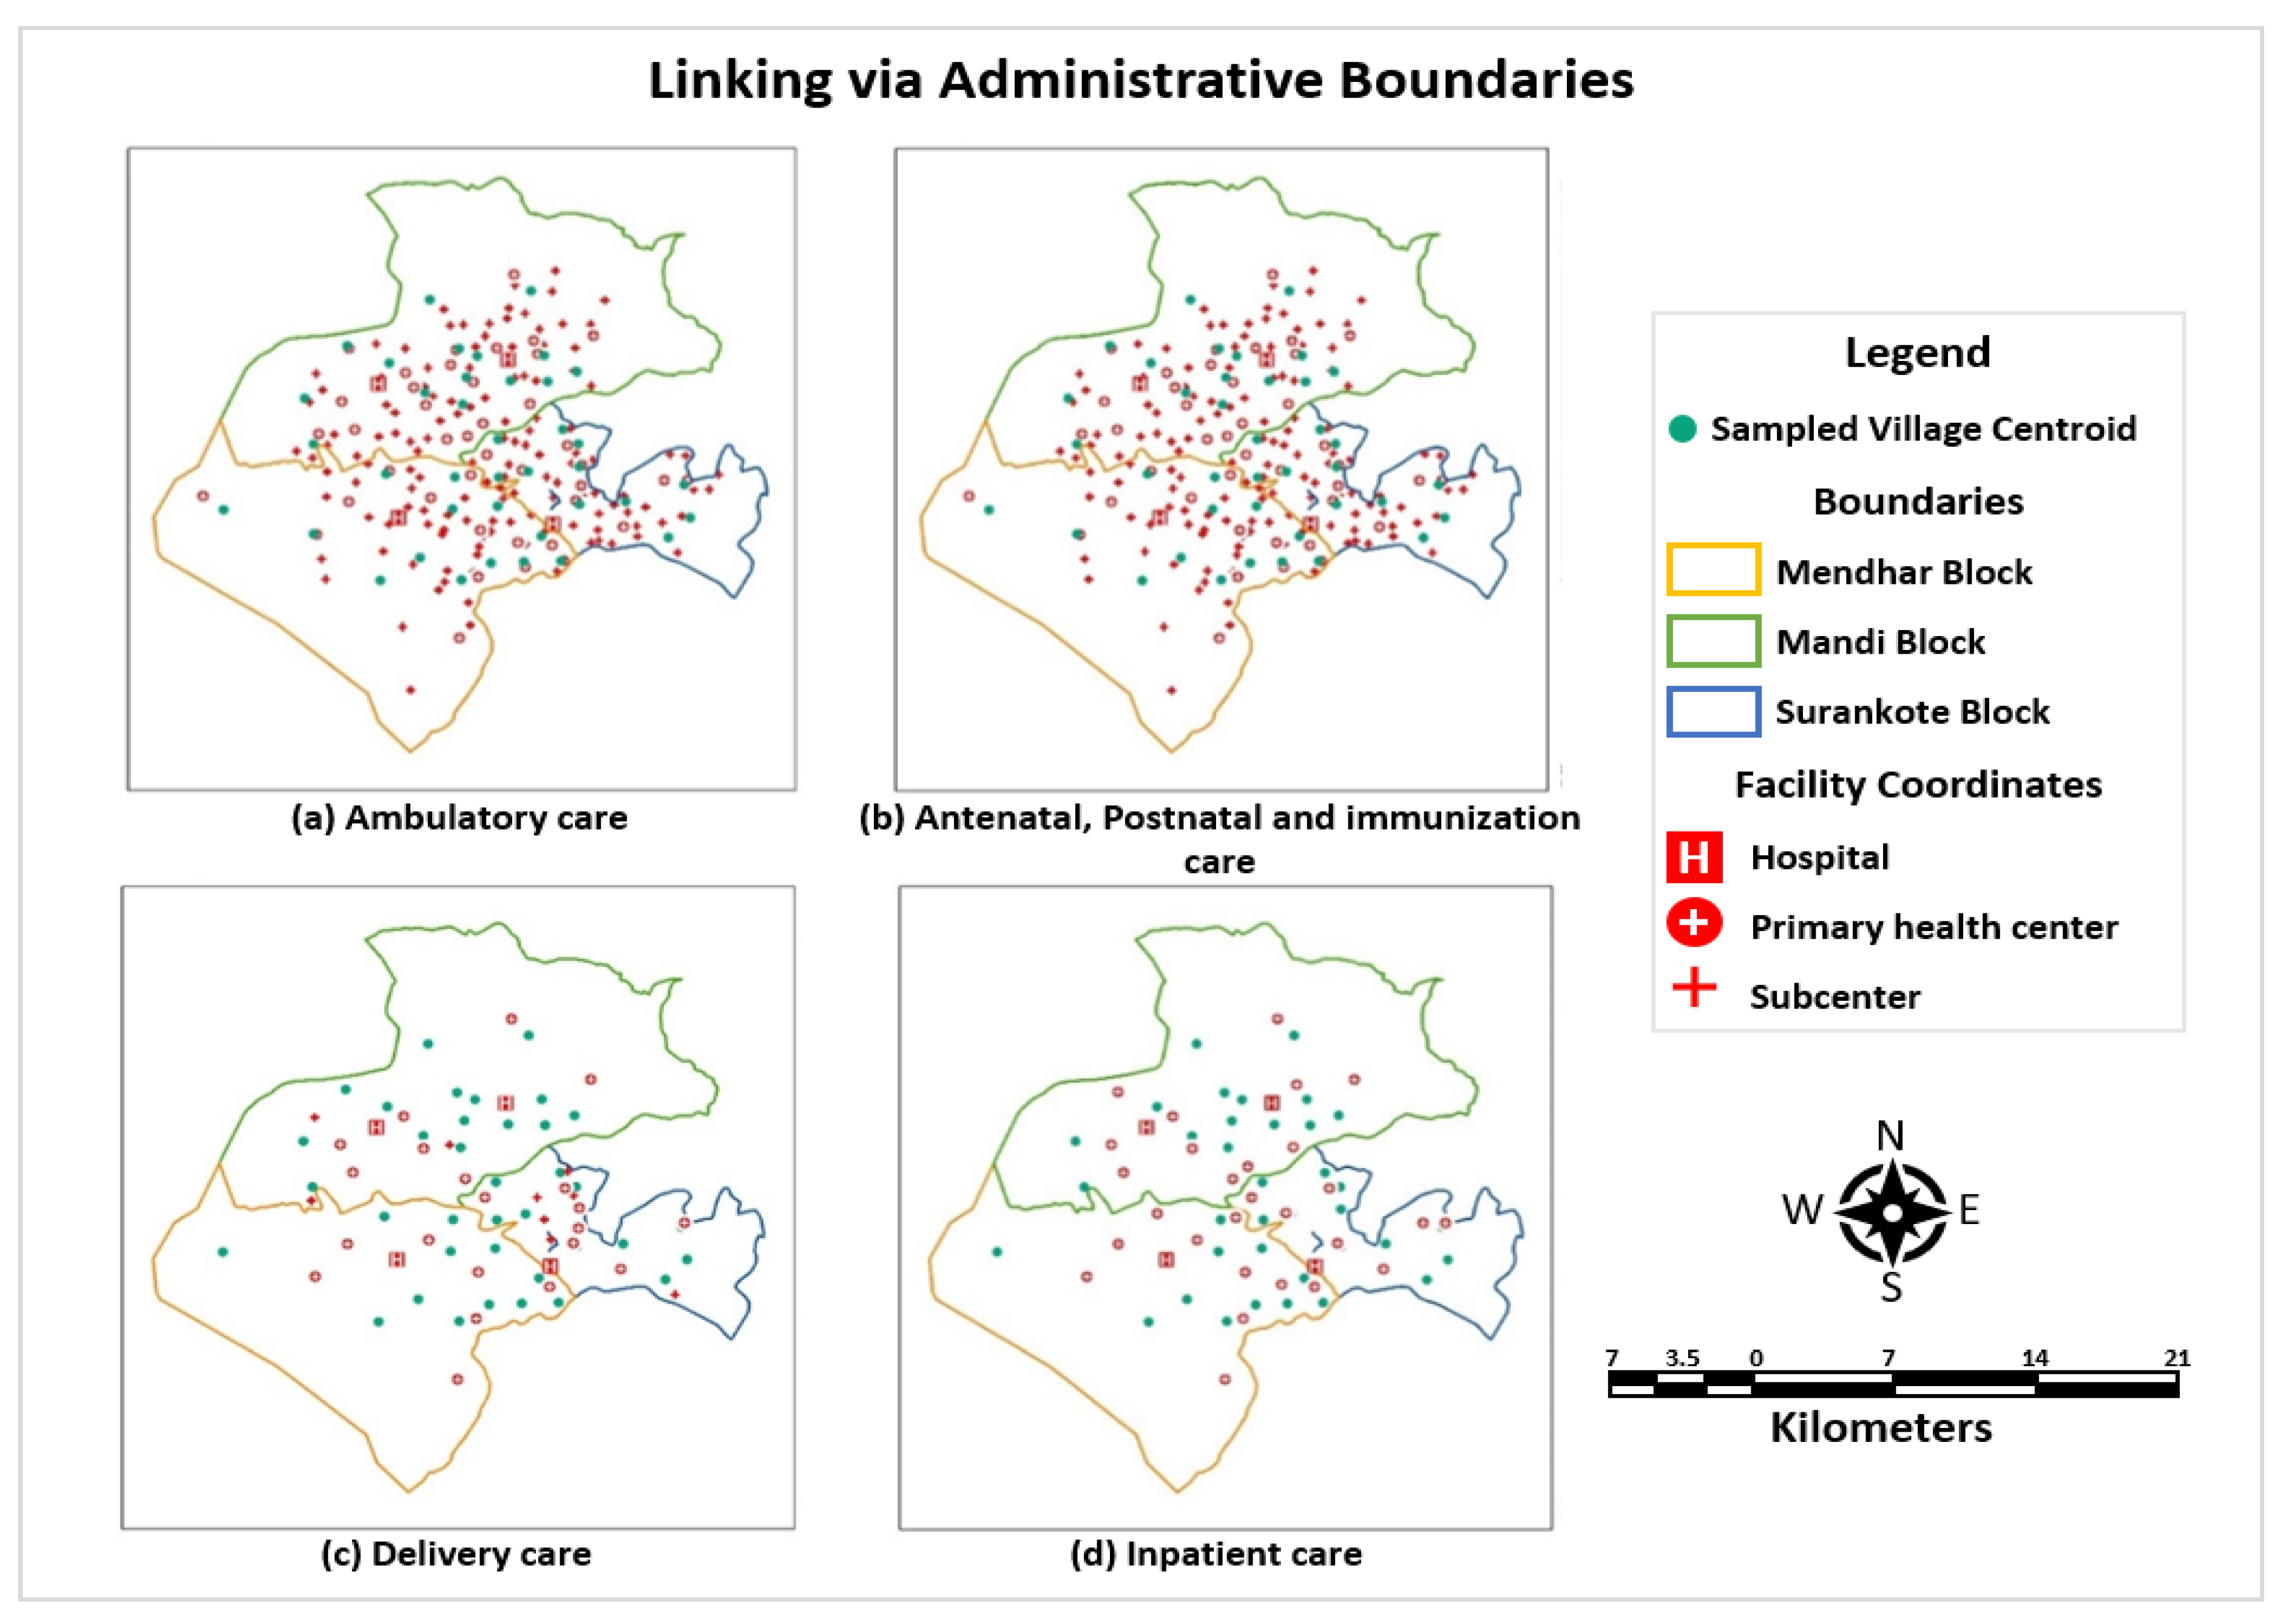
Linking via Administrative Unit: HFCA
Geographical Linking
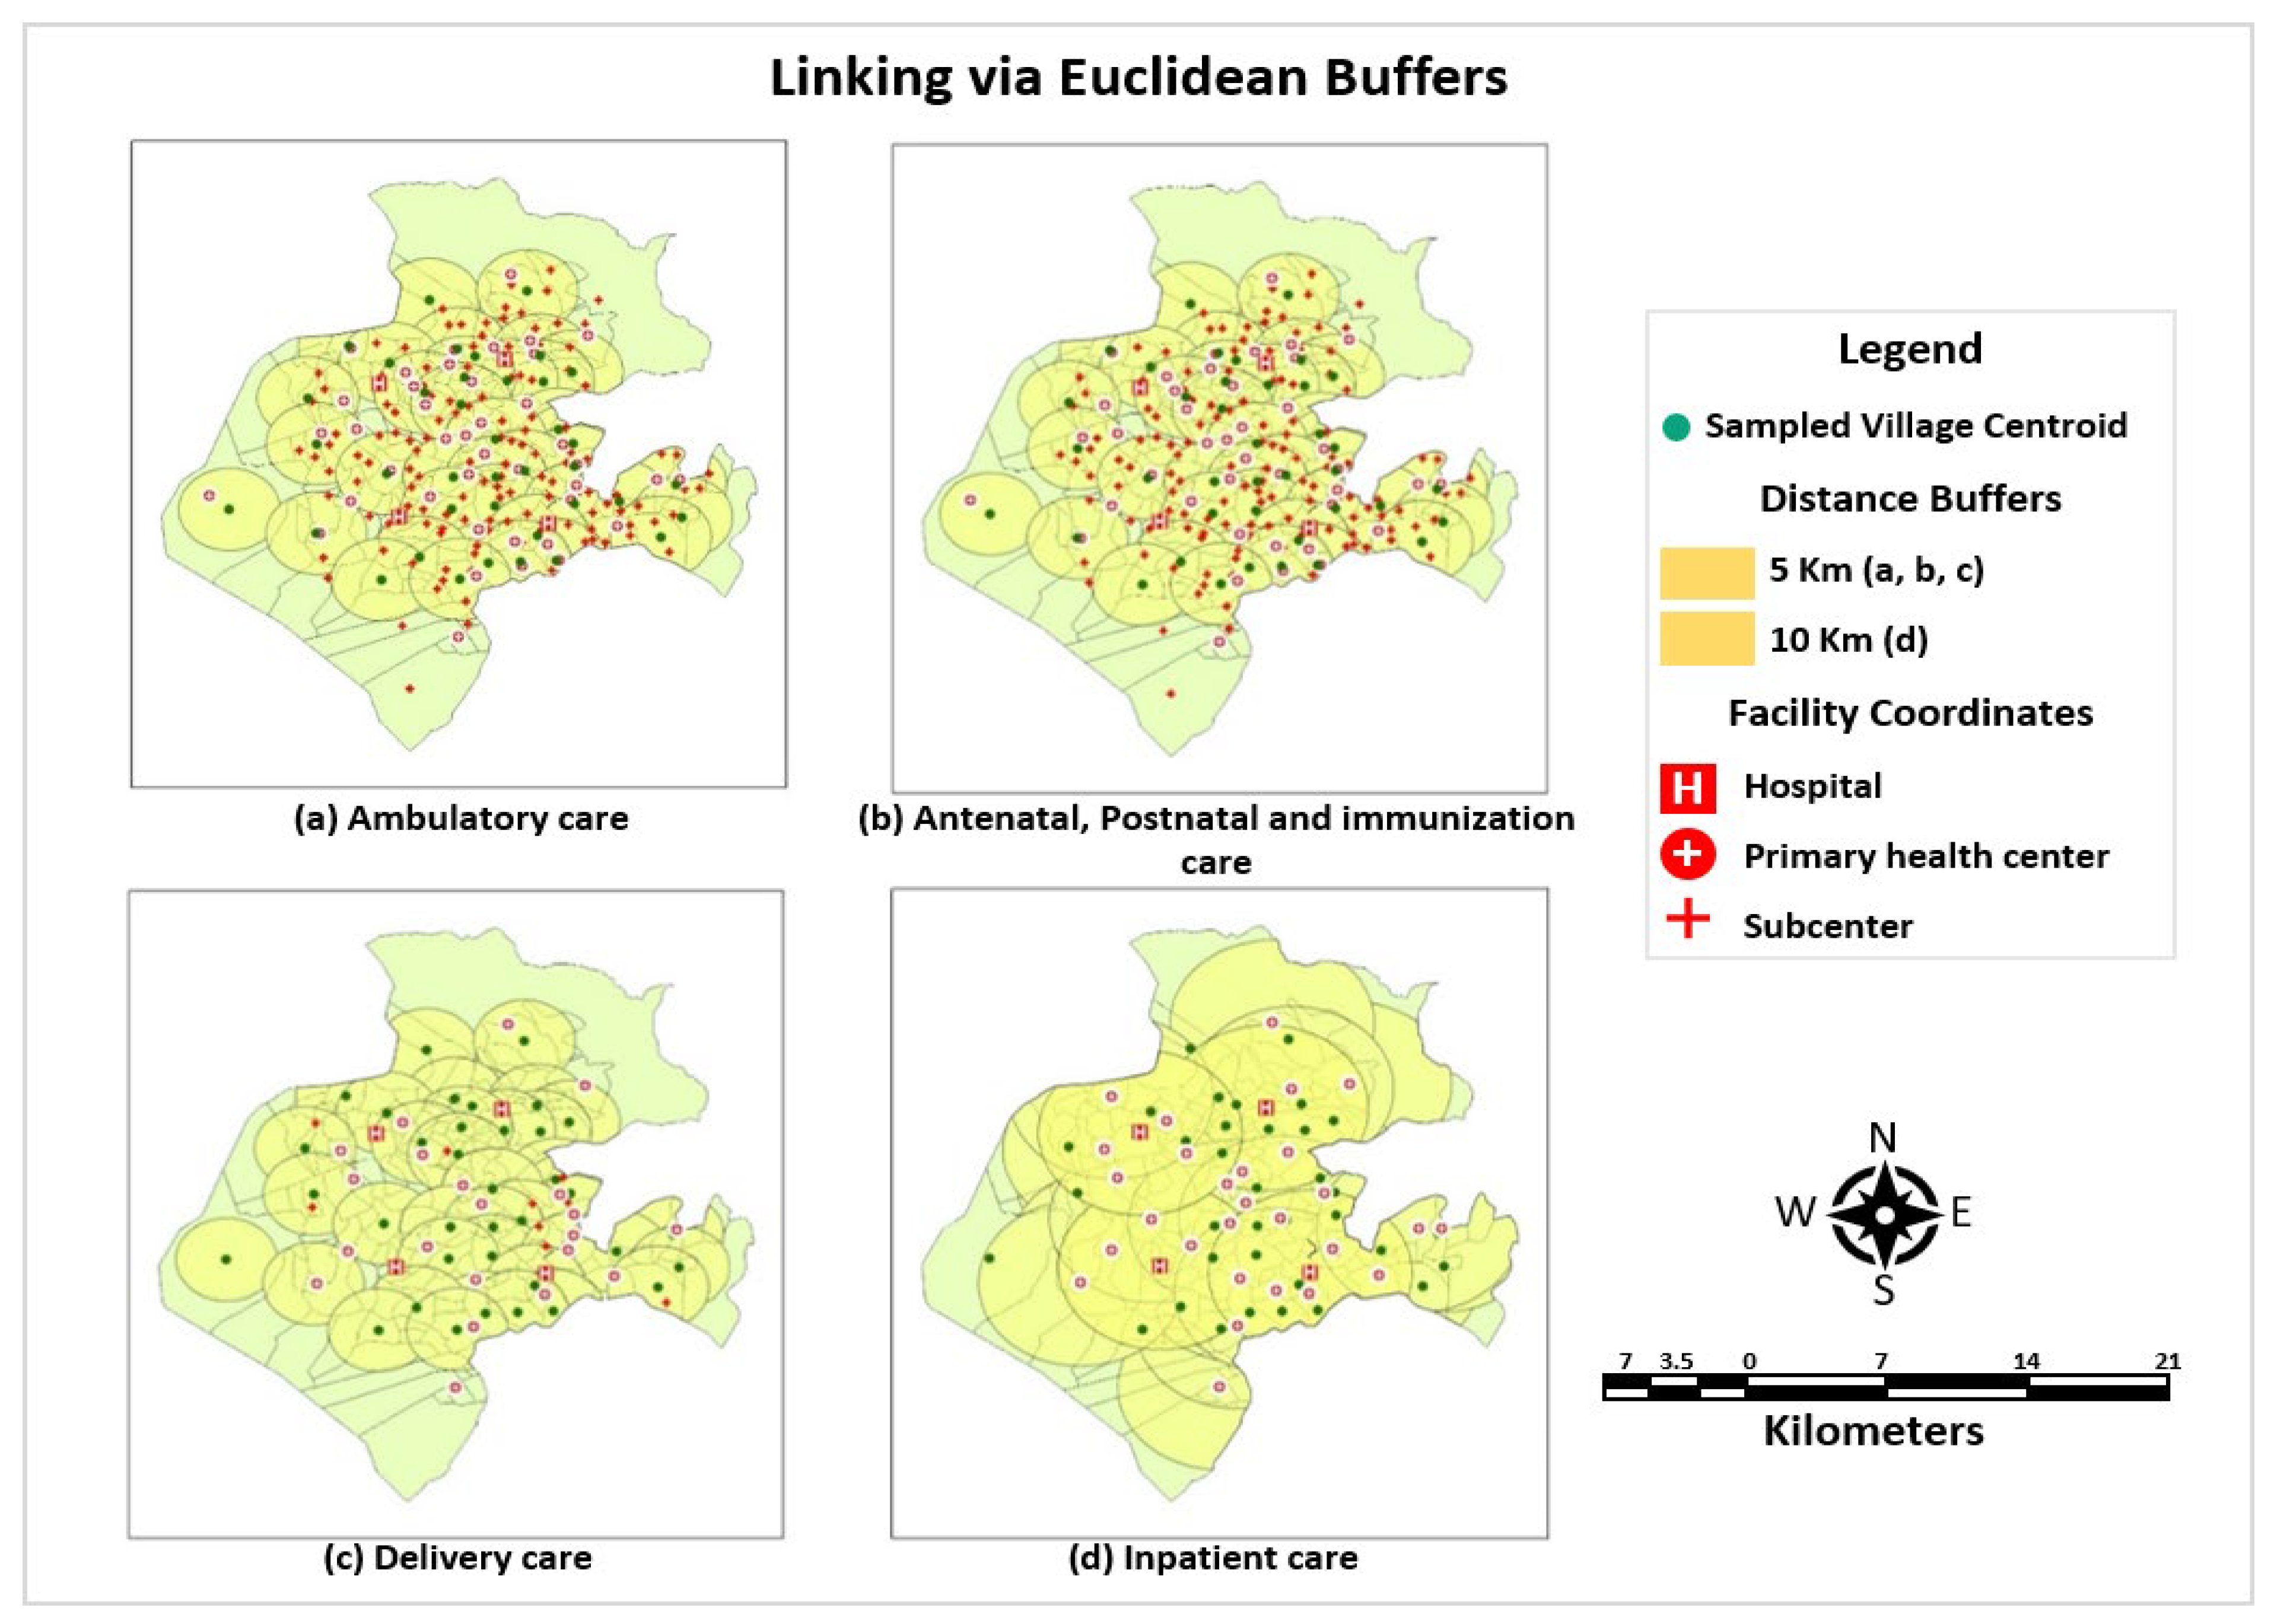
- (a)
- Linking via Euclidean Buffers
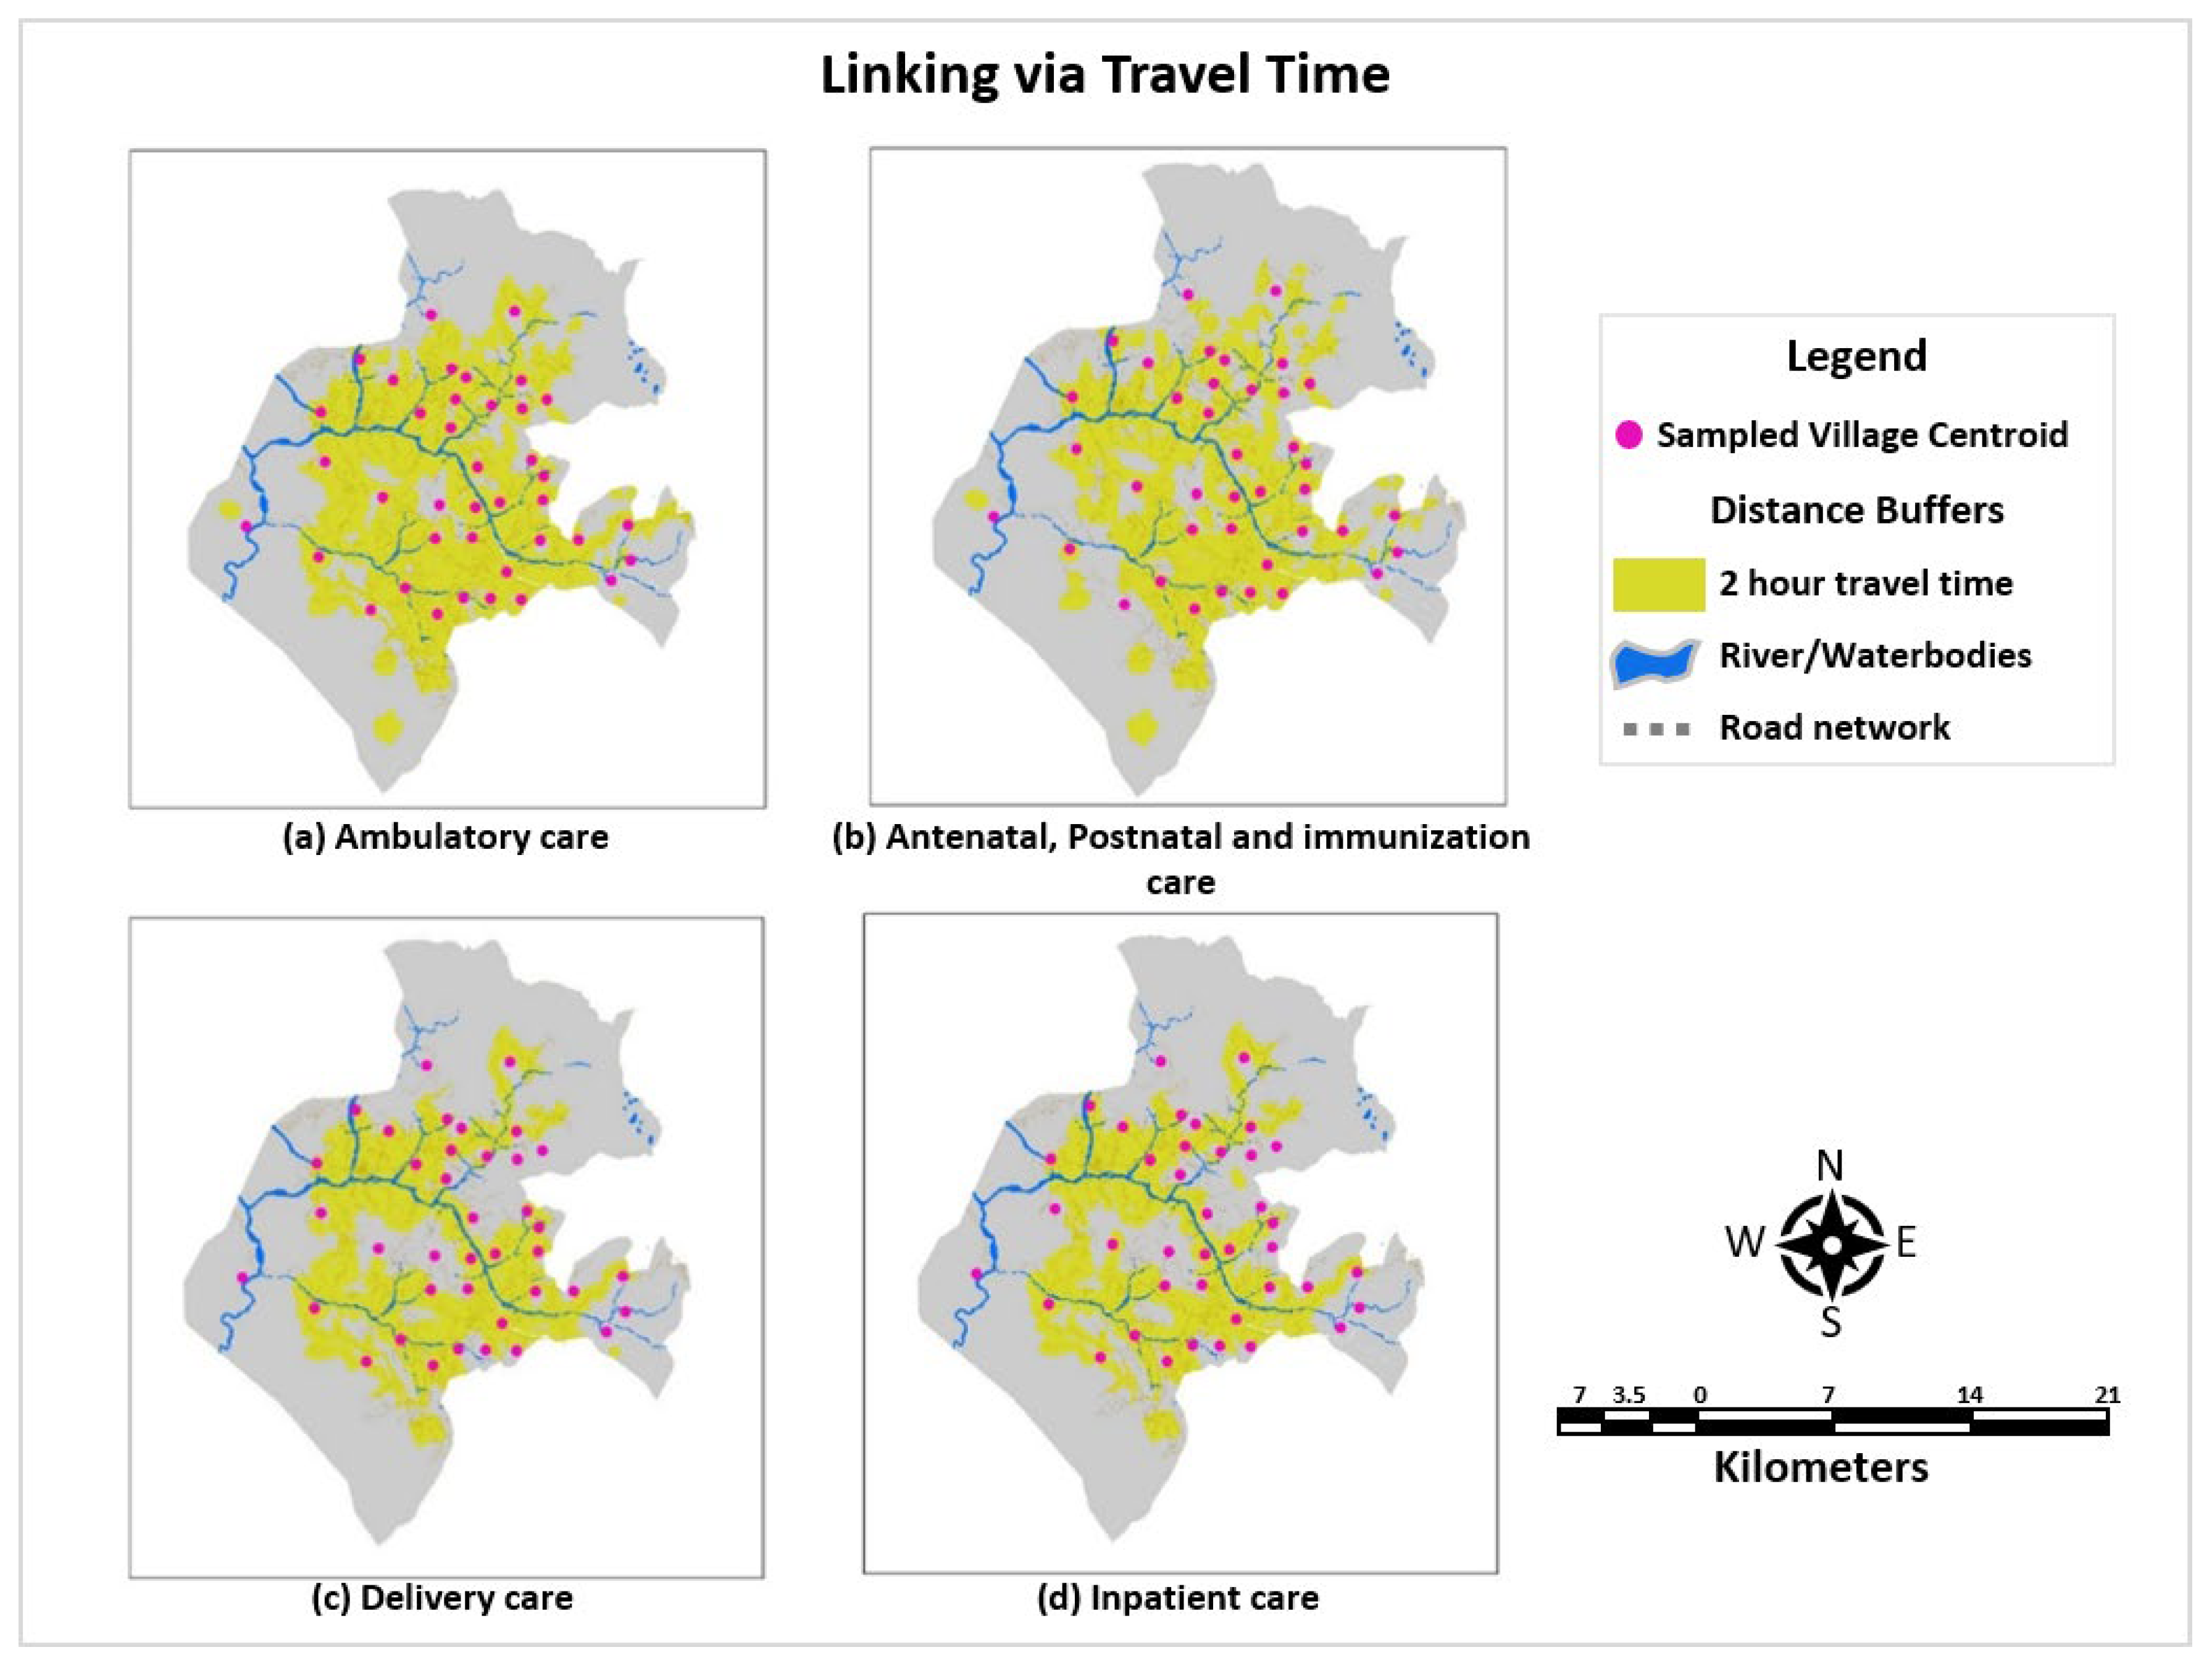
- (b)
- Linking via Raster-Based Travel Time
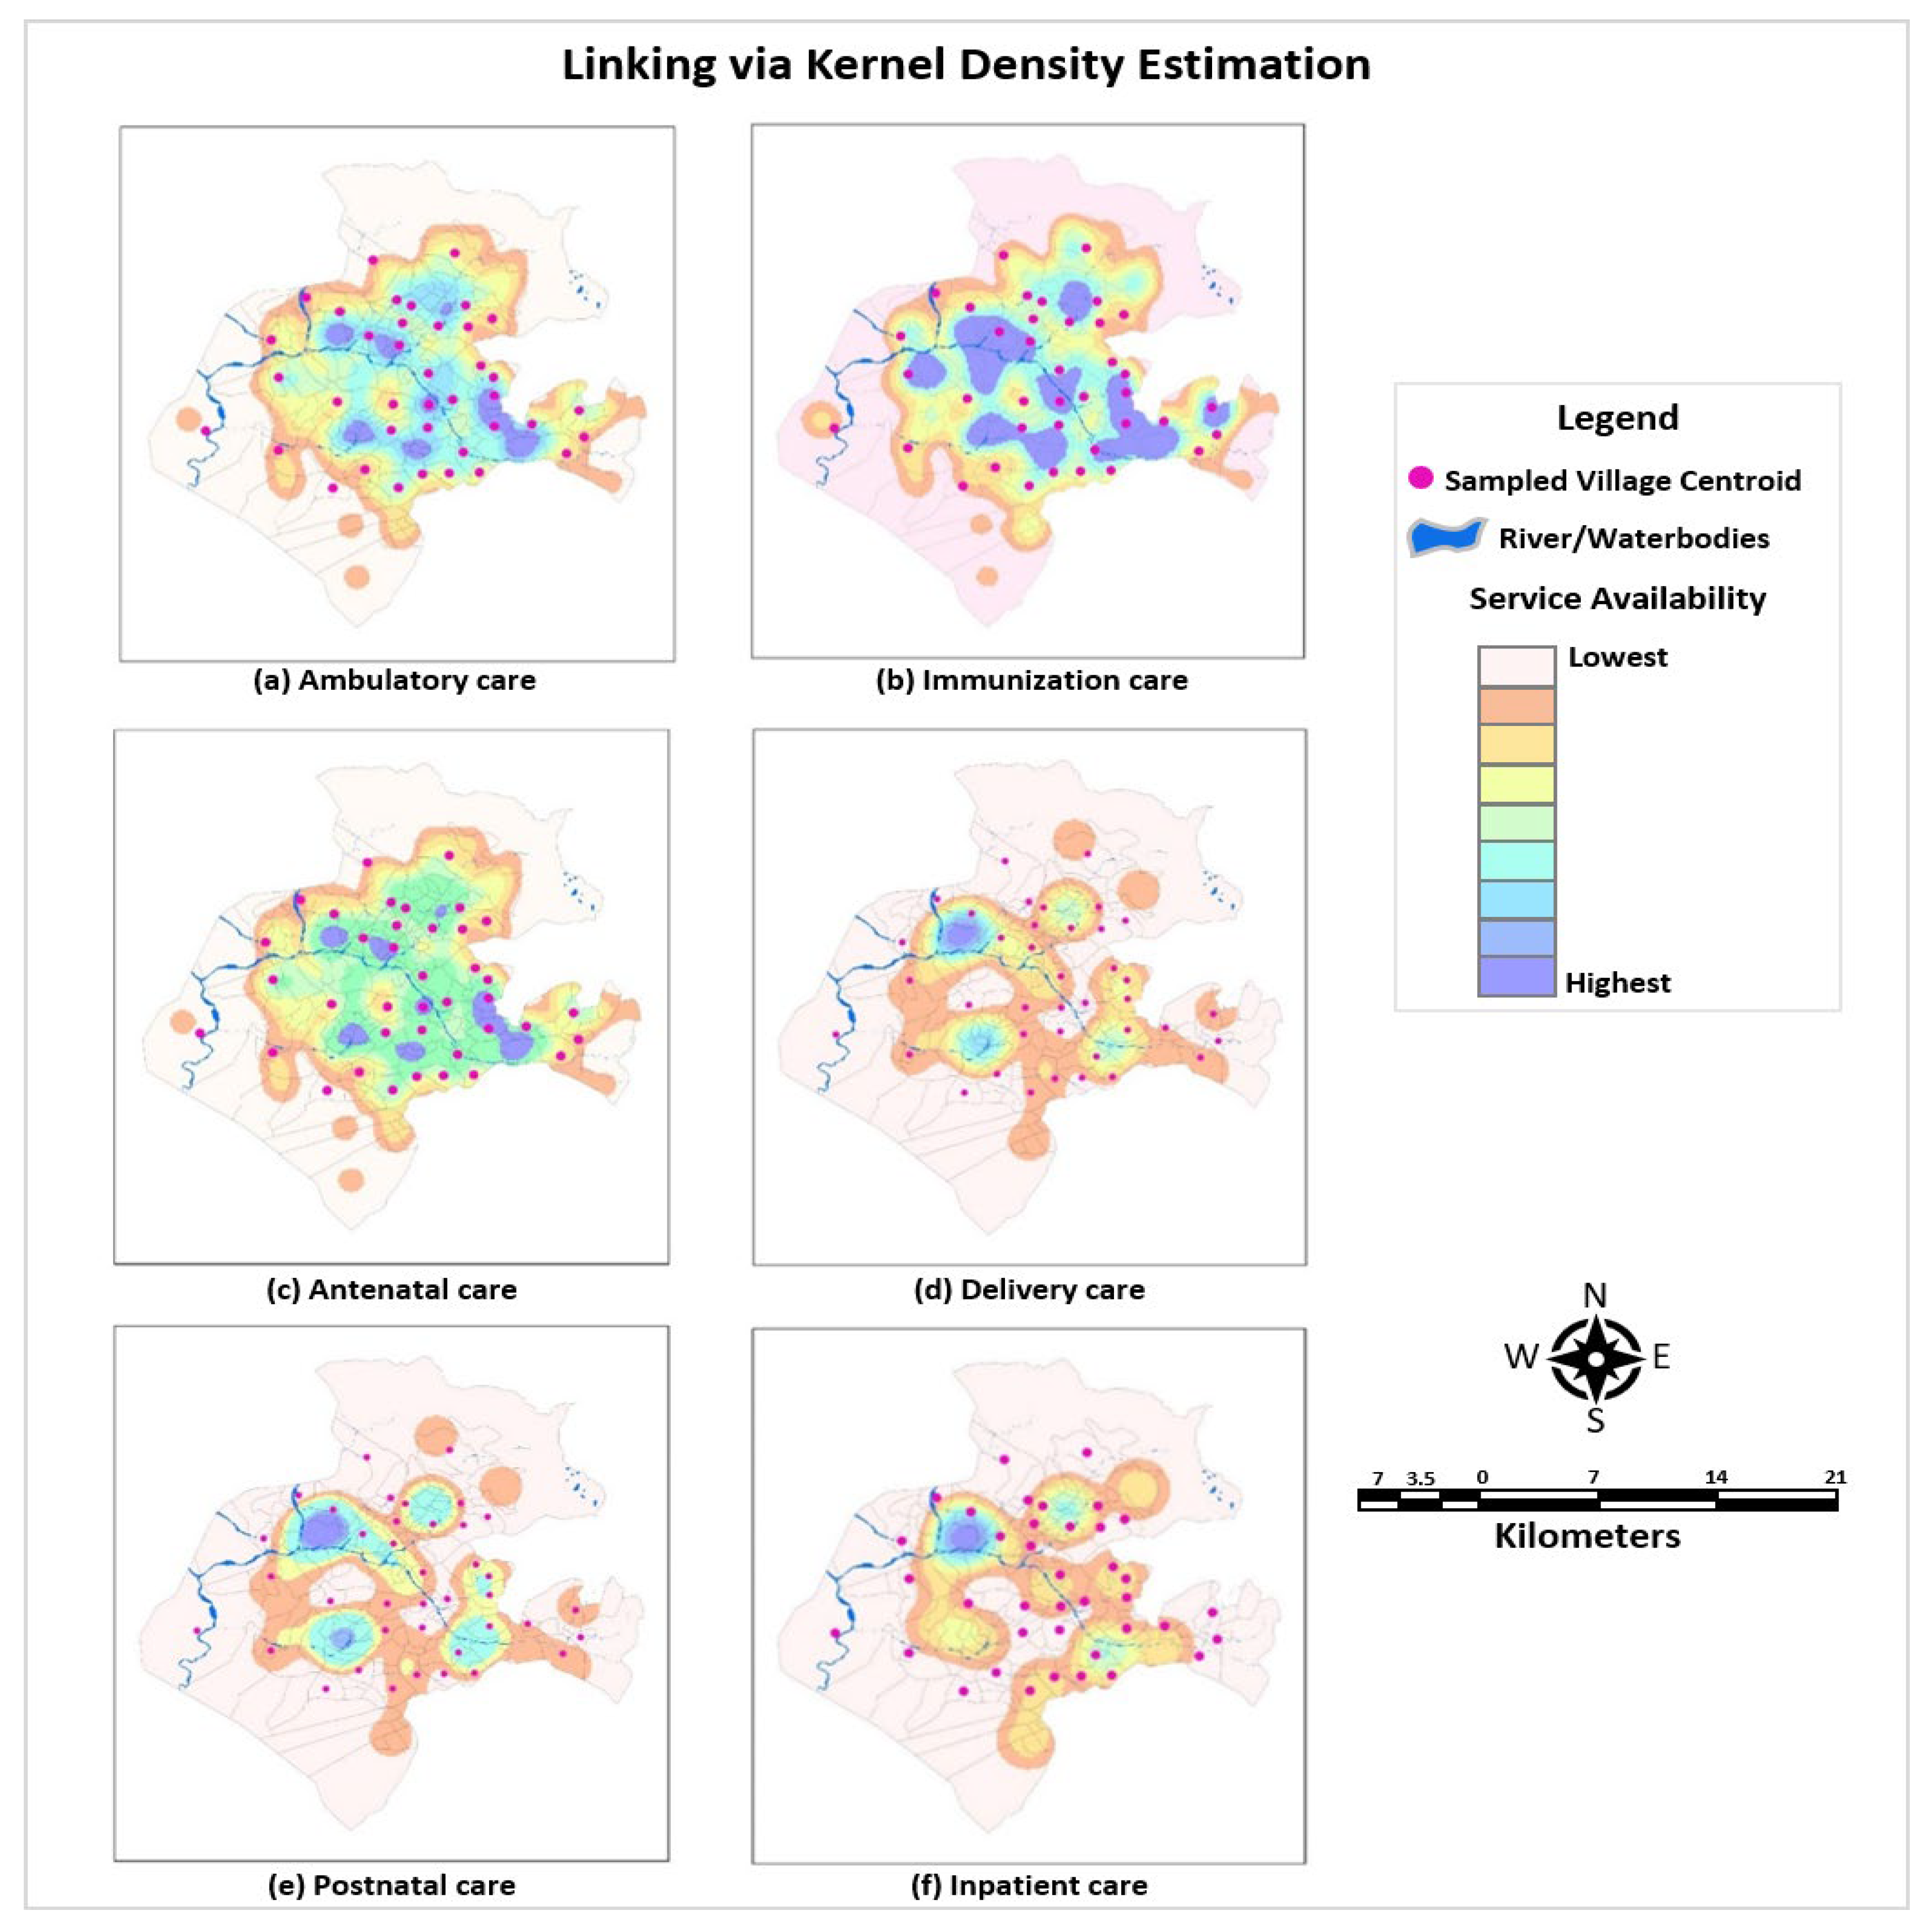
- (c)
- Linking via Kernel Density Estimates
2.4. Estimation of the Effective Coverage Metric
3. Results
3.1. Proportion of the Episodes Linked
3.2. Estimates of Composite Scores
3.2.1. Crude Coverage
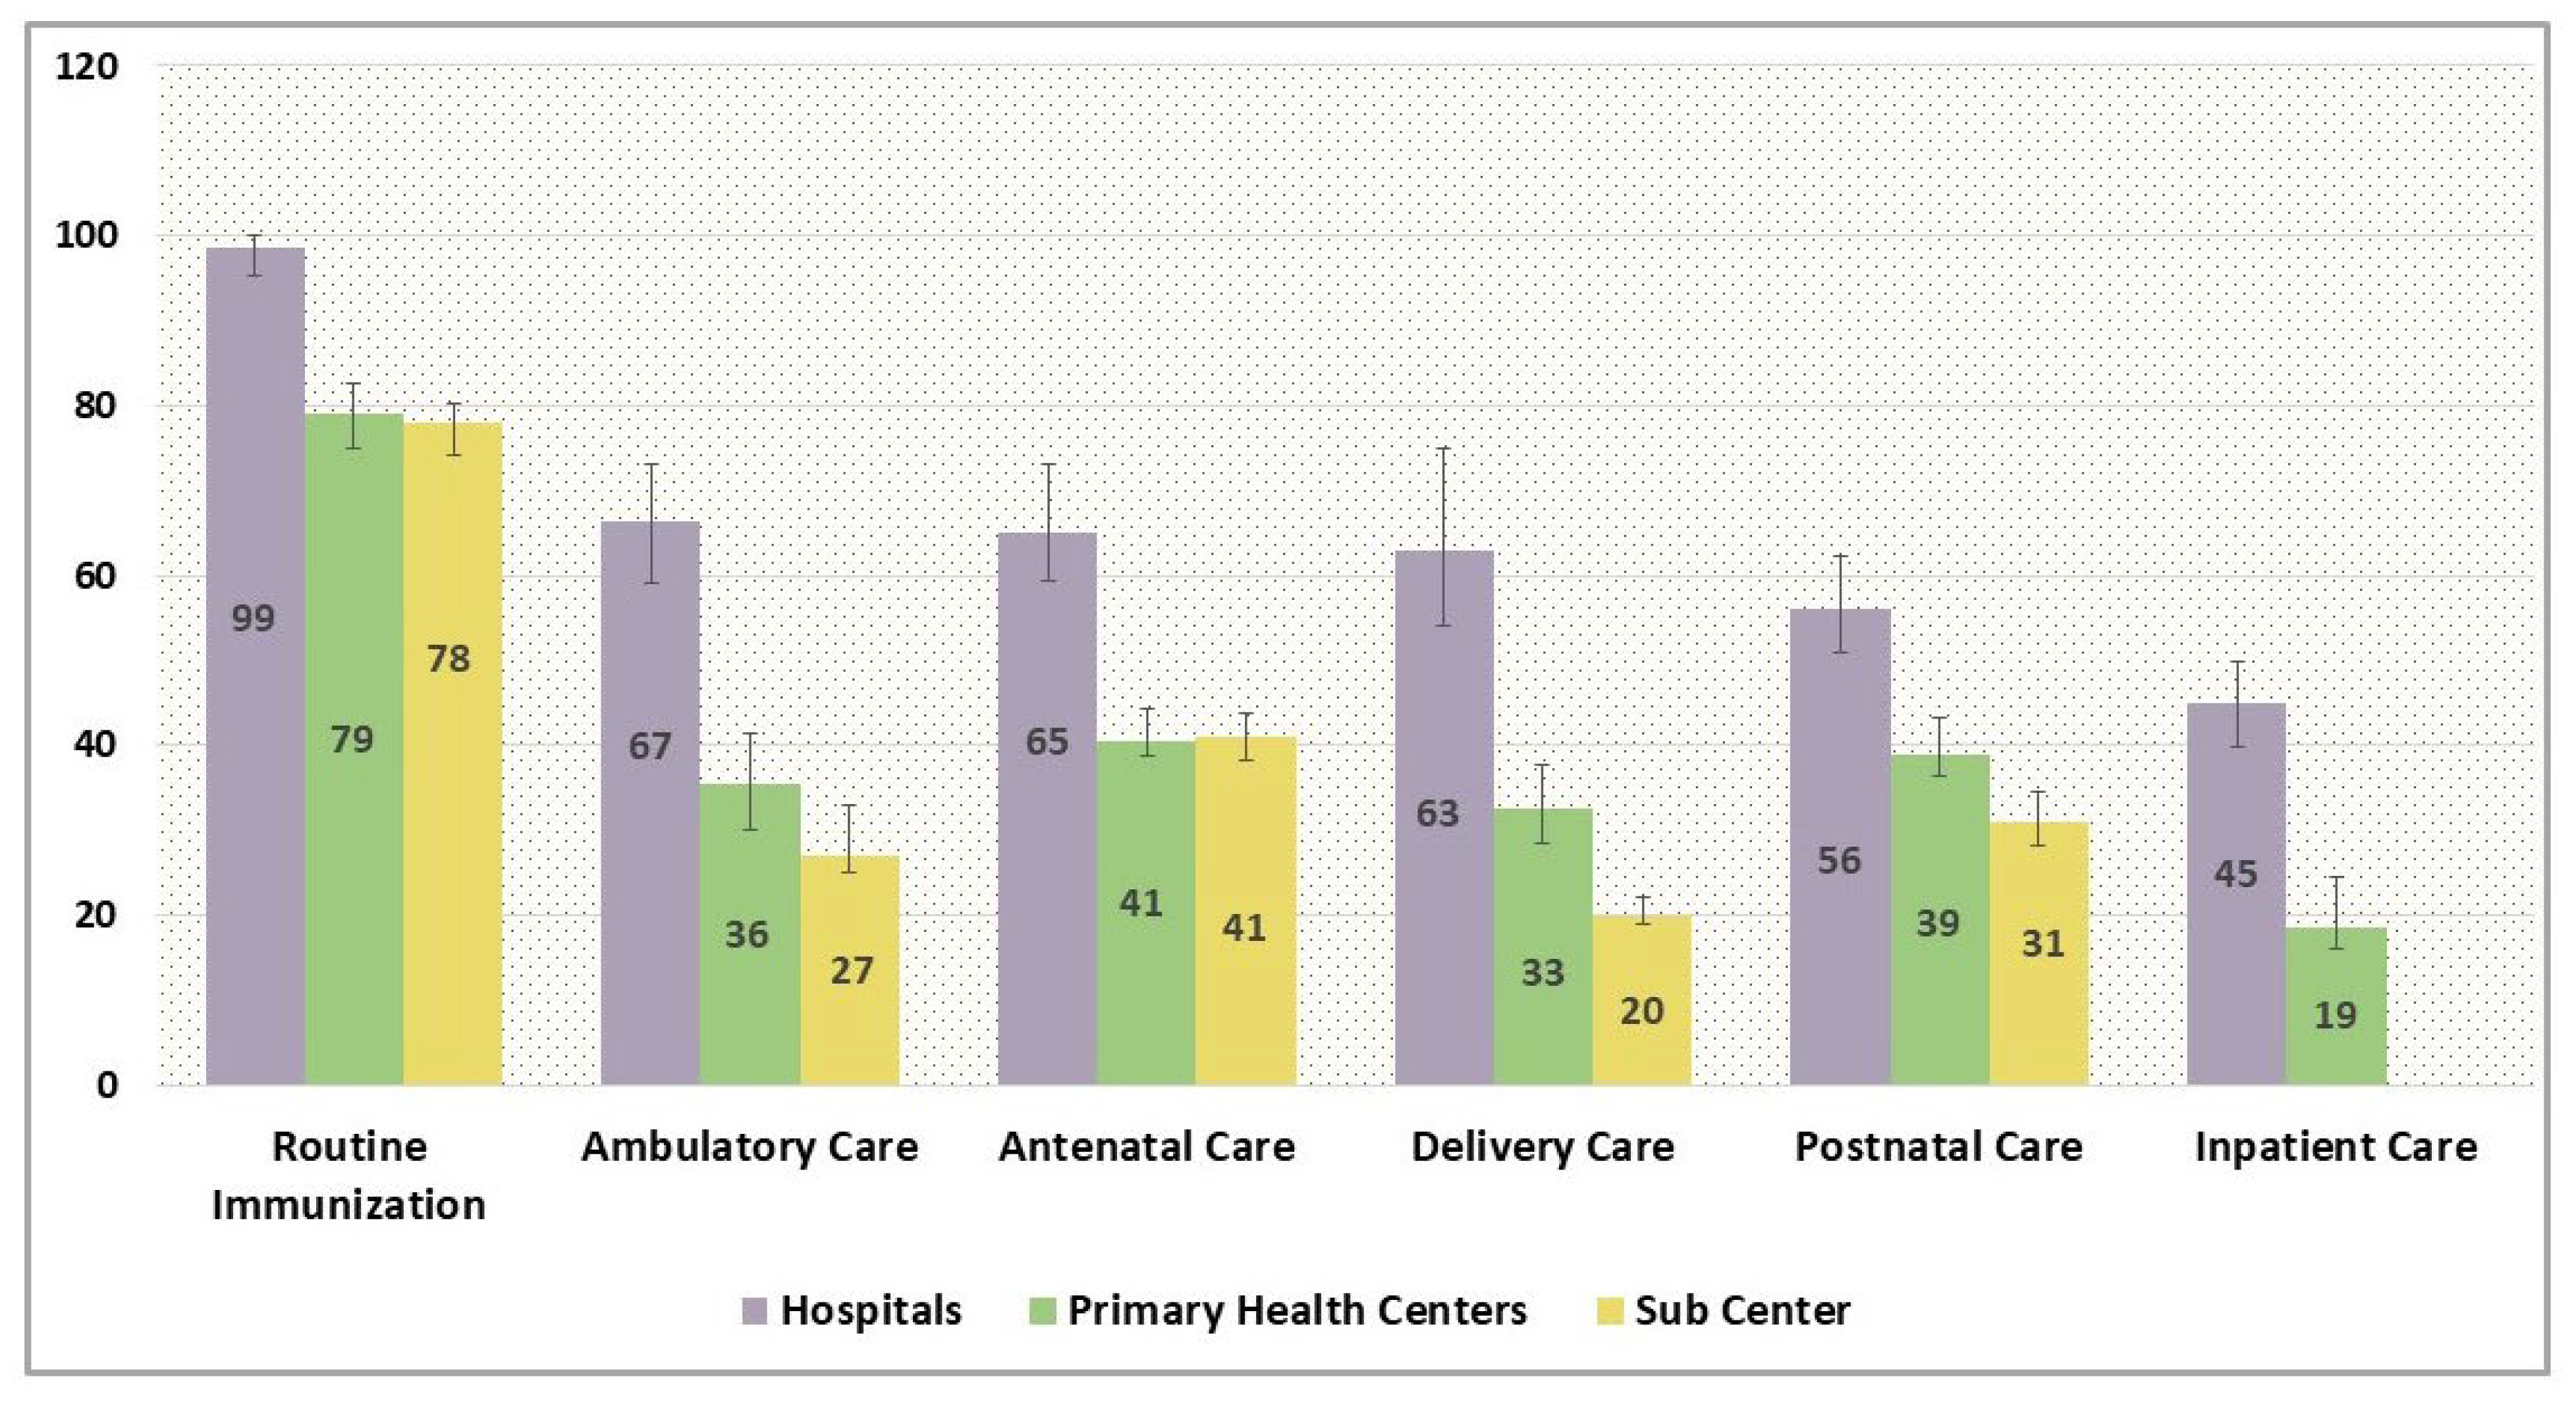
3.2.2. Structural Quality
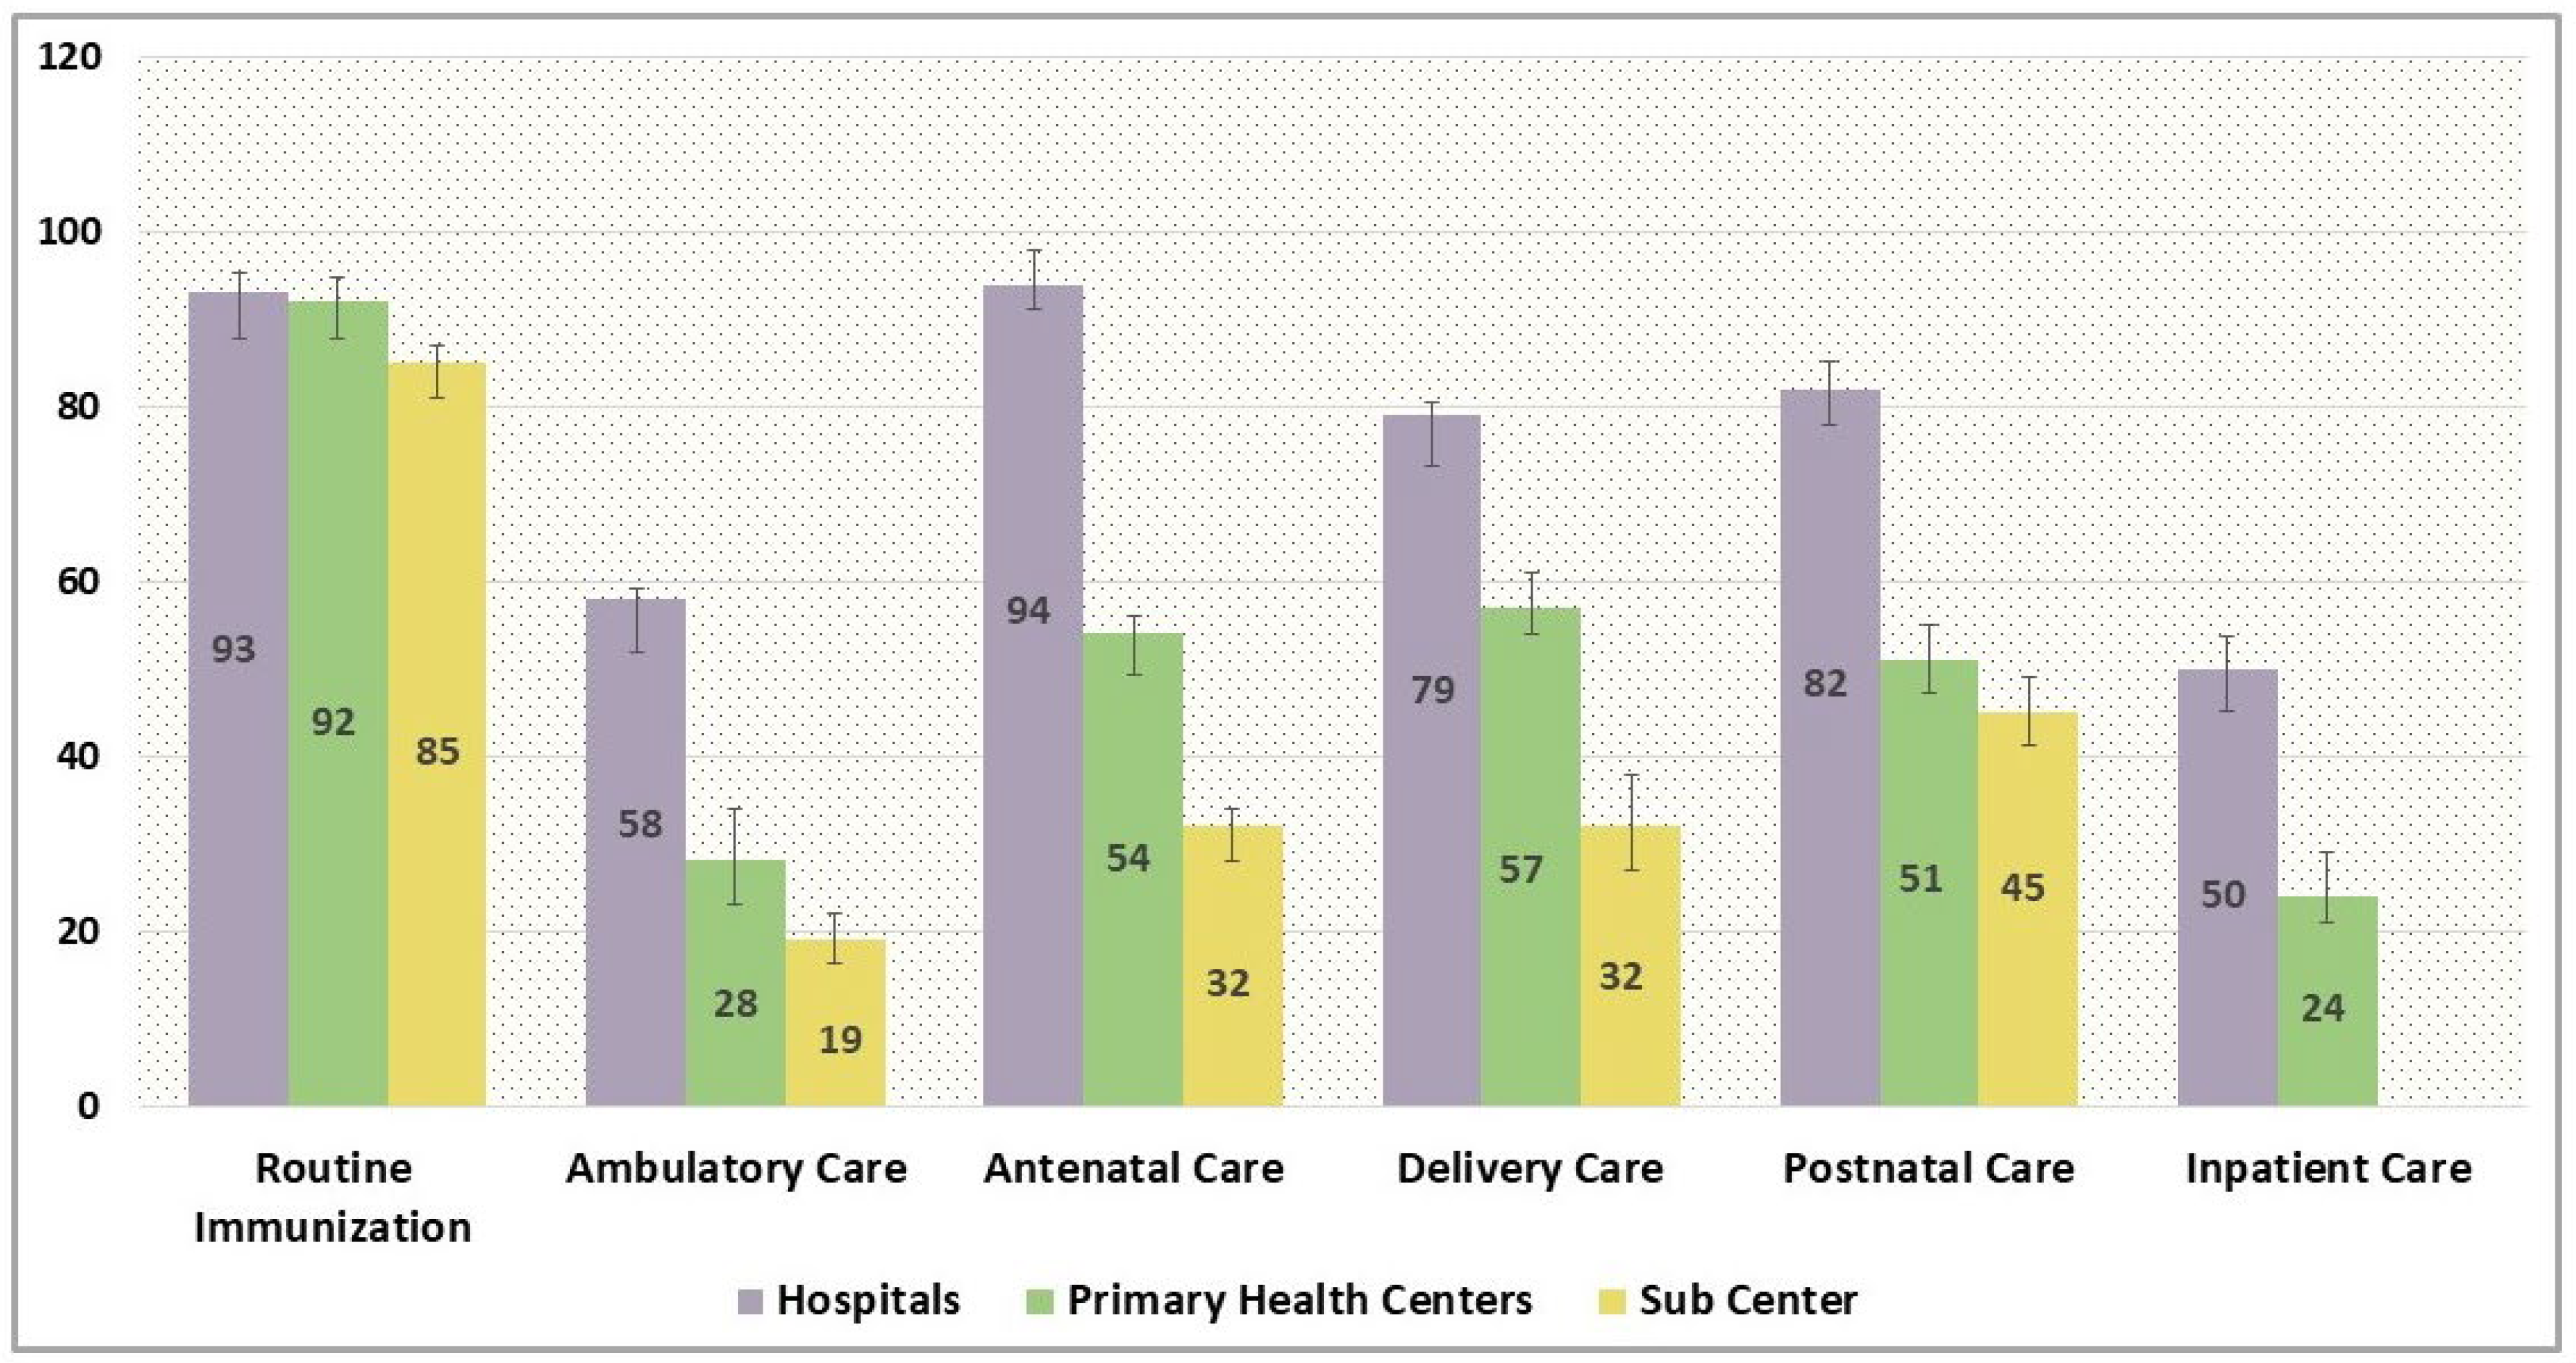
3.2.3. Process Quality
3.3. Estimates of Effective Coverage
3.3.1. Full Immunization
3.3.2. Ambulatory Care
3.3.3. Antenatal Care
3.3.4. Delivery Care
3.3.5. Postnatal Care
3.3.6. Inpatient Care
3.4. Comparison of Varied Linking Methods
4. Discussion
5. Policy Recommendations
6. Strengths and Limitations
7. Conclusions
Supplementary Materials
Author Contributions
Funding
Institutional Review Board Statement
Informed Consent Statement
Data Availability Statement
Acknowledgments
Conflicts of Interest
References
- Ng, M.; Fullman, N.; Dieleman, J.L.; Flaxman, A.D.; Murray, C.J.L.; Lim, S.S. Effective Coverage: A Metric for Monitoring Universal Health Coverage. PLoS Med. 2014, 11, e1001730. [Google Scholar]
- Tanahashi, T. Health service coverage and its evaluation. Bull. World Health Organ. 1978, 56, 295. [Google Scholar]
- World Health Organization. Tracking Universal Health Coverage. First Global Monitoring Report; World Health Organization: Geneva, Switzerland, 2015. [Google Scholar]
- Donabedian, A. The quality of medical care. Science 1978, 200, 856–864. Available online: https://science.sciencemag.org/content/200/4344/856 (accessed on 13 April 2021). [PubMed]
- Mohanan, M.; Hay, K.; Mor, N. Quality of Health Care in India: Challenges, Priorities, And the Road Ahead. Health Aff. 2017, 35, 1753–1758. [Google Scholar] [CrossRef]
- Marchant, T.; Tilley-Gyado, R.D.; Tessema, T.; Singh, K.; Gautham, M.; Umar, N.; Berhanu, D.; Cousens, S.; Schellenberg, J.R.A. Adding Content to Contacts: Measurement of High Quality Contacts for Maternal and Newborn Health in Ethiopia, North East Nigeria, and Uttar Pradesh, India. PLoS ONE 2015, 10, e0126840. [Google Scholar] [CrossRef]
- Peters, M.A. Health Systems Performance and Non-Communicable Diseases: Measuring Effective Coverage of Hypertension Management in Rural Bihar, India. 2021. Available online: https://jscholarship.library.jhu.edu/handle/1774.2/64418 (accessed on 24 November 2021).
- Yadav, R.; Yadav, J.; Shekhar, C. Unmet need for treatment-seeking from public health facilities in India: An analysis of sociodemographic, regional and disease-wise variations. PLOS Glob. Public Health 2022, 2, e0000148. Available online: https://journals.plos.org/globalpublichealth/article?id=10.1371/journal.pgph.0000148 (accessed on 14 December 2023). [CrossRef]
- Dandona, R.; Kumar, G.A.; Majumder, M.; Akbar, M.; Prasad Dora, S.S.; Dandona, L. Poor coverage of quality-adjusted antenatal care services: A population-level assessment by visit and source of antenatal care services in Bihar state of India. Lancet Reg. Health-Southeast Asia 2023, 25, 100332. Available online: http://www.thelancet.com/article/S2772368223001920/fulltext (accessed on 13 December 2023).
- Dandona, R.; Pandey, A.; Dandona, L. A review of national health surveys in India. Bull. World Health Organ. 2016, 94, 286. [Google Scholar] [CrossRef]
- Koulidiati, J.L.; Nesbitt, R.; Hien, H.; Robyn, J.; Souares, A. Quality of care and effective coverage of child health services in rural Burkina Faso. Rev. Epidemiol. Sante Publique 2016, 64, S242. [Google Scholar] [CrossRef]
- Donabedian, A. The Quality of Care: How Can It Be Assessed? JAMA J. Am. Med. 1988, 260, 1743–1748. Available online: https://jamanetwork.com/journals/jama/fullarticle/374139 (accessed on 13 April 2021).
- World Health Organization. Service Availability and Readiness Assessment (SARA): An Annual Monitoring System for Service Delivery: Reference Manual (No. WHO/HIS/HSI/RME/2013/1); World Health Organization: Geneva, Switzerland, 2013. [Google Scholar]
- Leslie, H.H.; Malata, A.; Ndiaye, Y.; Kruk, M.E. Effective coverage of primary care services in eight high-mortality countries. BMJ Glob. Health 2017, 2, e000424. Available online: https://pubmed.ncbi.nlm.nih.gov/29632704/ (accessed on 22 March 2025). [PubMed]
- Kruk, M.E.; Gage, A.D.; Arsenault, C.; Jordan, K.; Leslie, H.H.; Roder-DeWan, S.; Adeyi, O.; Barker, P.; Daelmans, B.; Doubova, S.V.; et al. High-quality health systems in the Sustainable Development Goals era: Time for a revolution. Lancet Glob. Health 2018, 6, e1196–e1252. [Google Scholar]
- Do, M.; Micah, A.; Brondi, L.; Campbell, H.; Marchant, T.; Eisele, T.; Munos, M. Linking household and facility data for better coverage measures in reproductive, maternal, newborn, and child health care: Systematic review. J. Glob. Health 2016, 6, 020501. Available online: www.jogh.org (accessed on 18 February 2021).
- Peters, M.A.; Mohan, D.; Naphini, P.; Carter, E.; Marx, M.A. Linking household surveys and facility assessments: A comparison of geospatial methods using nationally representative data from Malawi. Popul. Health Metr. 2020, 18, 30. Available online: https://pophealthmetrics.biomedcentral.com/articles/10.1186/s12963-020-00242-z (accessed on 20 February 2021). [CrossRef]
- Skiles, M.P.; Burgert, C.R.; Curtis, S.L.; Spencer, J. Geographically linking population and facility surveys: Method-ological considerations. Popul. Health Metr. 2013, 11, 14. Available online: https://pophealthmetrics.biomedcentral.com/articles/10.1186/1478-7954-11-14 (accessed on 5 January 2021). [PubMed]
- Carter, E.D.; Ndhlovu, M.; Eisele, T.P.; Nkhama, E.; Katz, J.; Munos, M. Evaluation of methods for linking household and health care provider data to estimate effective coverage of management of child illness: Results of a pilot study in Southern Province, Zambia. J. Glob. Health 2018, 8, 010607. [Google Scholar] [CrossRef]
- Verma, V.R.; Dash, U. Geographical accessibility and spatial coverage modelling of public health care network in rural and remote India. PLoS ONE 2020, 15, e0239326. Available online: https://journals.plos.org/plosone/article?id=10.1371/journal.pone.0239326 (accessed on 28 June 2022). [CrossRef] [PubMed]
- Spencer, J.; Angeles, G. Kernel density estimation as a technique for assessing availability of health services in Nicaragua. Health Serv. Outcomes Res. Methodol. 2007, 7, 145–157. Available online: https://link.springer.com/article/10.1007/s10742-007-0022-7 (accessed on 9 January 2021).
- Silverman, B.W. Density Estimation for Statistics and Data Analysis Chapter 1 and 2. 2003. Available online: https://books.google.com/books?hl=en&lr=&id=e-xsrjsL7WkC&oi=fnd&pg=PA1&ots=iyKkmp_I-l&sig=BKG23ZQZLuySVHXw2xV8Q9t3ixo (accessed on 9 January 2021).
- McBride, G.B. A proposal for strength-of-agreement criteria for Lin’s concordance correlation coefficient. NIWA Client Rep. 2005, 45, 307–310. [Google Scholar]
- Paul, P.; Nguemdjo, U.; Ngami, A.; Kovtun, N.; Ventelou, B. Do efficiency and equity move together? Cross-dynamics of Health System performance and Universal Health Coverage. Humanit. Soc. Sci. Commun. 2022, 9, 293. Available online: https://www.nature.com/articles/s41599-022-01271-9 (accessed on 22 March 2025). [CrossRef]
- Munos, M.K.; Maiga, A.; Do, M.; Sika, G.L.; Carter, E.D.; Mosso, R.; Dosso, A.; Leyton, A.; Khan, S.M. Linking household survey and health facility data for effective coverage measures: A comparison of ecological and individual linking methods using the Multiple Indicator Cluster Survey in Côte d’Ivoire. J. Glob. Health 2018, 8, 020803. [Google Scholar] [PubMed]
- Das, J.; Bank, W.; Washington, D.C. The Quality of Medical Care in Low-Income Countries: From Providers to Markets. PLoS Med. 2011, 8, e1000432. Available online: https://pmc.ncbi.nlm.nih.gov/articles/PMC3075231/ (accessed on 22 March 2025). [CrossRef] [PubMed]
- Basu, S.; Andrews, J.; Kishore, S.; Panjabi, R.; Stuckler, D. Comparative Performance of Private and Public Healthcare Systems in Low- and Middle-Income Countries: A Systematic Review. PLoS Med. 2012, 9, e1001244. Available online: https://journals.plos.org/plosmedicine/article?id=10.1371/journal.pmed.1001244 (accessed on 22 March 2025).
- Coveney, L.; Musoke, D.; Russo, G. Do private health providers help achieve Universal Health Coverage? A scoping review of the evidence from low-income countries. Health Policy Plan. 2023, 38, 1050–1063. [Google Scholar] [CrossRef]
- Amouzou, A.; Leslie, H.H.; Ram, M.; Fox, M.; Jiwani, S.S.; Requejo, J.; Marchant, T.; Munos, M.K.; Vaz, L.M.E.; Weiss, W.; et al. Advances in the measurement of coverage for RMNCH and nutrition: From contact to effective coverage. BMJ Glob. Health 2019, 4 (Suppl. S4), e001297. Available online: https://gh.bmj.com/content/4/Suppl_4/e001297 (accessed on 22 March 2025).
- Kumah, E. The informal healthcare providers and universal health coverage in low and middle-income countries. Glob. Health 2022, 18, 45. Available online: https://globalizationandhealth.biomedcentral.com/articles/10.1186/s12992-022-00839-z (accessed on 9 February 2024). [CrossRef]
- Boerma, T.; Eozenou, P.; Evans, D.; Evans, T.; Kieny, M.P.; Wagstaff, A. Monitoring Progress towards Universal Health Coverage at Country and Global Levels. PLoS Med. 2014, 11, e1001731. [Google Scholar]
- Wang, W.; Mallick, L.; Allen, C.; Pullum, T. Effective coverage of facility delivery in Bangladesh, Haiti, Malawi, Nepal, Senegal, and Tanzania. PLoS ONE 2019, 14, e0217853. Available online: https://journals.plos.org/plosone/article?id=10.1371/journal.pone.0217853 (accessed on 22 March 2025). [CrossRef] [PubMed]
- Rao, K.D.; Sheffel, A. Quality of clinical care and bypassing of primary health centers in India. Soc. Sci. Med. 2018, 207, 80–88. [Google Scholar] [CrossRef]
- Willey, B.; Waiswa, P.; Kajjo, D.; Munos, M.; Akuze, J.; Allen, E.; Marchant, T. Linking data sources for measurement of ef-fective coverage in maternal and newborn health: What do we learn from individual- vs ecological-linking methods? J. Glob. Health 2018, 8, 010601. Available online: https://pubmed.ncbi.nlm.nih.gov/29497508/ (accessed on 22 March 2025).
- Carter, E.D.; Leslie, H.H.; Marchant, T.; Amouzou, A.; Munos, M.K. Methodological considerations for linking household and healthcare provider data for estimating effective coverage: A systematic review. BMJ Open 2021, 11, e045704. Available online: https://pmc.ncbi.nlm.nih.gov/articles/PMC8395298/ (accessed on 22 March 2025). [CrossRef]
- Goetz, A.M.; Jenkins, R. Hybrid forms of accountability: Citizen engagement in institutions of public-sector oversight in India. Public. Manag. Rev. 2001, 3, 363–383. [Google Scholar]
- Lahariya, C. Ayushman Bharat Program and Universal Health Coverage in India. Indian Pediatr. 2018, 55, 495–506. [Google Scholar] [CrossRef] [PubMed]
- Lahariya, C. Health & Wellness Centers to Strengthen Primary Health Care in India: Concept, Progress and Ways Forward. Indian J. Pediatr. 2020, 87, 916. [Google Scholar] [PubMed]
- Ahmed, S.; Srivastava, S.; Warren, N.; Mayra, K.; Misra, M.; Mahapatra, T.; Rao, K.D. The impact of a nurse mentoring program on the quality of labour and delivery care at primary health care facilities in Bihar, India. BMJ Glob. Health 2019, 4, 1767. Available online: http://gh.bmj.com/ (accessed on 3 May 2021). [CrossRef]
- Jayanna, K.; Bradley, J.; Mony, P.; Cunningham, T.; Washington, M.; Bhat, S.; Rao, S.; Thomas, A.; Rajaram, S.; Kar, A.; et al. Effectiveness of onsite nurse mentoring in improving quality of institutional births in the primary health centres of high priority Districts of Karnataka, South India: A cluster randomized trial. PLoS ONE 2016, 11, e0161957. Available online: http://www.gatesfoundation.org/ (accessed on 7 May 2021). [CrossRef] [PubMed]
- Gopalakrishnan, L.; Buback, L.; Fernald, L.; Walker, D.; Diamond-Smith, N. Using mHealth to improve health care delivery in India: A qualitative examination of the perspectives of community health workers and beneficiaries. PLoS ONE 2020, 15, e0227451. [Google Scholar] [CrossRef]
- Borkum, E.; Sivasankaran, A.; Sridharan, S.; Rotz, D.; Sethi, S.; Manoranjini, M.; Ramakrishnan, L.; Rangarajan, A. Evaluation of the Information and Communication Technology (ICT) Continuum of Care Services (CCS) Intervention in Bihar 2015. Available online: https://gapmaps.3ieimpact.org/evaluation-information-and-communication-technology-ict-continuum-care-services-ccs-intervention (accessed on 21 April 2021).
- Prinja, S.; Bahuguna, P.; Gupta, A.; Nimesh, R.; Gupta, M.; Thakur, J.S. Cost effectiveness of mHealth intervention by community health workers for reducing maternal and newborn mortality in rural Uttar Pradesh, India. Cost Eff. Resour. Alloc. 2018, 16, 25. Available online: https://pubmed.ncbi.nlm.nih.gov/29983645/ (accessed on 30 April 2021). [CrossRef]


| Linking Method | Service Type | |||||
|---|---|---|---|---|---|---|
| Routine Immunization | Ambulatory Care | Antenatal Care | Delivery Care | Postnatal Care | Inpatient Care | |
| 1. Exact-match Linking | 100 | 91.5 | 100 | 96.9 | 96.9 | 92.6 |
| 2. Ecological Linking | ||||||
| 2.1. Administrative Linking | ||||||
| Linking via Sub-District Boundaries | 100 | 100 | 100 | 100 | 100 | 100 |
| 2.2. Geographical Linking | ||||||
| 2.2.1. Euclidean Buffers Linking | 91 | 88 | 86 | 75 | 84 | 86 |
| 2.2.2. Raster-based Travel Time Linking | 40 | 39 | 39 | 30 | 39 | 28 |
| 2.2.3. Kernel Density Estimates Linking | 62 | 48 | 31 | 31 | 31 | 27 |
| Hospitals | Primary Health Centres | Subcentres | Overall | |||||||||
|---|---|---|---|---|---|---|---|---|---|---|---|---|
| Coverage | HI | Inequity Adjusted | Coverage | HI | Inequity Adjusted | Coverage | HI | Inequity Adjusted | Coverage | HI | Inequity Adjusted | |
| Immunization | 15.4 [12.1–19.7] | 0.04 | 14.8 | 17.4 [14.1–22.6] | 0.03 | 16.9 | 61.6 [57.4–64.6] | 0.0 | 61.6 | 94.5 [89.6–98.2] | 0.04 | 90.7 |
| Ambulatory | 19.0 [14.6–21.8] | 0.09 | 17.3 | 8.0 [5.4–12.6] | 0.03 | 7.76 | 7.0 [4.3–11.8] | 0.02 | 6.86 | 33.9 [30.2–38.4] | 0.05 | 32.2 |
| Antenatal | 18.9 [15.2–23.6] | 0.23 | 14.5 | 8.6 [5.7–11.4] | 0.01 | 8.51 | 8.8 [4.9–12.3] | −0.07 | 9.41 | 36.2 [25.1–34.7] | 0.19 | 29.3 |
| Delivery | 71.2 [67.7–74.2] | 0.12 | 62.6 | 10.6 [7.5–14.8] | −0.02 | 10.8 | 9.0 [5.7–12.8] | −0.04 | 9.36 | 90.9 [84.2–93.8] | 0.04 | 87.3 |
| Postnatal | 8.5 [5.3–11.5] | 0.17 | 7.05 | 5.6 [3.1–9.3] | 0.09 | 5.09 | 4.3 [2.4–6.5] | −0.05 | 4.51 | 18.4 [14.2–23.3] | 0.08 | 16.9 |
| Inpatient | 70.0 [67.2–73.5] | 0.23 | 53.9 | 8.9 [5.4–13.6] | 0.04 | 8.54 | NA | NA | NA | 78.9 [73.8–82.4] | 0.18 | 64.7 |
| Crude Coverage | Structure-Adjusted Coverage | Process-Adjusted Coverage | ||||
|---|---|---|---|---|---|---|
| Crude Coverage | Inequity-Adjusted Coverage | Quality-Adjusted Coverage | Quality- and Inequity-Adjusted Coverage | Quality-Adjusted Coverage | Quality- and Inequity-Adjusted Coverage | |
| 1. Exact-Match Linking | ||||||
| Routine Immunization | 94.5 [89.6–98.2] | 90.7 | 75.9 [70.3–80.4] | 73.6 | 81.6 [76.2–83.4] | 79.2 |
| Ambulatory Care | 33.9 [30.2–38.4] | 32.2 | 16.7 [12.5–18.7] | 15.0 | 13.9 [10.6–15.2] | 12.5 |
| Antenatal Care | 36.2 [25.1–34.7] | 29.3 | 19.3 [18.6–24.3] | 15.6 | 26.2 [22.9–29.7] | 21.1 |
| Delivery Care | 90.9 [84.2–93.8] | 87.3 | 50.1 [47.4–55.1] | 48.1 | 64.2 [61.2–68.8] | 61.6 |
| Post-Natal Care | 18.4 [14.2–23.3] | 16.9 | 8.7 [6.2–10.4] | 8.0 | 11.5 [8.7–13.6] | 10.6 |
| Inpatient Care | 78.9 [73.8–82.4] | 64.7 | 33.1 [29.6–36.7] | 27.1 | 35.5 [29.8–38.6] | 29.1 |
| 2. Ecological Linking | ||||||
| 2.1 Administrative Linking | ||||||
| Linking via Sub-District Boundaries | ||||||
| Routine Immunization | 94.5 [89.6–98.2] | 90.7 | 74.1 [69.8–78.1] | 71.1 | 80.4 [77.2–84.1] | 77.2 |
| Ambulatory Care | 33.9 [30.2–38.4] | 32.2 | 15.9 [12.3–17.8] | 15.1 | 12.8 [9.2–14.1] | 12.2 |
| Antenatal Care | 30.2 [25.1–34.7] | 36.2 | 17.6 [14.2–19.9] | 14.2 | 23.1 [20.2–29.4] | 18.7 |
| Delivery Care | 90.9 [84.2–93.8] | 80.0 | 46.7 [41.8–49.9] | 44.8 | 55.3 [51.2–60.3] | 53.1 |
| Post-Natal Care | 18.4 [14.2–23.3] | 12.3 | 7.9 [5.2–10.1] | 7.3 | 11.0 [8.2–16.3] | 10.1 |
| Inpatient Care | 78.9 [73.8–82.4] | 64.7 | 29.1 [25.2–32.1] | 23.9 | 31.3 [26.8–34.2] | 25.7 |
| 2.2 Geographical Linking | ||||||
| 2.2.1 Linking via Euclidean Buffers | ||||||
| Routine Immunization | 94.5 [89.6–98.2] | 90.7 | 75.0 [70.3–78.7] | 72.0 | 78.2 [75.3–82.5] | 75.1 |
| Ambulatory Care | 33.9 [30.2–38.4] | 32.2 | 15.8 [11.4–18.6] | 15.0 | 13.4 [10.3–18.2] | 12.7 |
| Antenatal Care | 30.2 [25.1–34.7] | 36.2 | 17.2 [12.5–21.4] | 13.9 | 23.6 [19.4–29.1] | 19.1 |
| Delivery Care | 90.9 [84.2–93.8] | 80.0 | 46.3 [41.3–50.4] | 44.4 | 60.5 [57.2–63.8] | 58.1 |
| Post-Natal Care | 18.4 [14.2–23.3] | 12.3 | 8.1 [5.0–10.9] | 7.4 | 10.1 [7.2–14.9] | 9.2 |
| Inpatient Care | 78.9 [73.8–82.4] | 64.7 | 29.9 [26.1–34.2] | 24.5 | 32.4 [28.1–36.8] | 26.6 |
| 2.2.2 Linking via Raster-Based Travel Time | ||||||
| Routine Immunization | 94.5 [89.6–98.2] | 90.7 | 71.1 [66.7–74.2] | 68.2 | 78.0 [74.2–83.4] | 74.9 |
| Ambulatory Care | 33.9 [30.2–38.4] | 32.2 | 14.9 [11.8–19.2] | 14.1 | 12.9 [8.5–15.9] | 12.2 |
| Antenatal Care | 30.2 [25.1–34.7] | 36.2 | 18.7 [15.2–22.3] | 15.1 | 24.7 [20.5–29.6] | 20.0 |
| Delivery Care | 90.9 [84.2–93.8] | 80.0 | 48.9 [45.3–52.8] | 46.9 | 62.5 [58.2–66.8] | 60 |
| Post-Natal Care | 18.4 [14.2–23.3] | 12.3 | 8.5 [6.1–10.3] | 7.8 | 10.6 [7.1–14.5] | 9.7 |
| Inpatient Care | 78.9 [73.8–82.4] | 64.7 | 30.9 [27.4–34.5] | 25.3 | 33.2 [28.4–36.1] | 27.2 |
| 2.2.3 Linking via Kernel Density Estimates | ||||||
| Routine Immunization | 94.5 [89.6–98.2] | 90.7 | 70.4 [66.2–73.8] | 67.6 | 78.9 [75.3–82.4] | 75.7 |
| Ambulatory Care | 33.9 [30.2–38.4] | 32.2 | 14.1 [10.2–19.7] | 13.4 | 12.7 [9.8–15.7] | 12.1 |
| Antenatal Care | 30.2 [25.1–34.7] | 36.2 | 18.1 [14.4–22.5] | 14.7 | 25.1 [22.8–29.7] | 20.3 |
| Delivery Care | 90.9 [84.2–93.8] | 80.0 | 48.2 [45.2–52.3] | 46.3 | 62.3 [59.7–66.8] | 59.8 |
| Post-Natal Care | 18.4 [14.2–23.3] | 12.3 | 7.1 [3.9–11.3] | 6.5 | 10.8 [6.8–13.4] | 9.9 |
| Inpatient Care | 78.9 [73.8–82.4] | 64.7 | 30.0 [25.8–35.1] | 24.6 | 33.0 [28.8–36.2] | 27.1 |
| Confidence Interval in Parenthesis | ||||||
| Routine Immunization | Ambulatory Care | Antenatal Care | Delivery Care | Postnatal Care | Inpatient Care | |||||||
|---|---|---|---|---|---|---|---|---|---|---|---|---|
| Structural-Quality-Adjusted Coverage | ||||||||||||
| Abs. | Rel. | Abs. | Rel. | Abs. | Rel. | Abs. | Rel. | Abs. | Rel. | Abs. | Rel. | |
| Exact-Match Linking | Reference | Reference | Reference | Reference | Reference | Reference | ||||||
| Administrative Boundary Linking | −1.8 | −2.37 | −0.8 | −4.79 | −1.7 | −8.81 | −3.4 * | −6.79 | −0.8 | −9.20 | −4 * | −12.08 |
| Euclidean Buffer Linking | −0.9 | −1.19 | −0.9 | −5.39 | −2.1 * | −10.88 | −3.8 * | −7.58 | −0.6 | −6.90 | −3.2 * | −9.67 |
| Raster-Based Travel Time Linking | −4.8 * | −6.32 | −1.8 | −10.78 | −0.6 | −3.11 | −1.2 | −2.40 | −0.2 | −2.30 | −2.2 * | −6.65 |
| Kernel Density Estimate Linking | −5.5 * | −7.25 | −2.6 * | −15.57 | −1.2 | −6.22 | −1.9 | −3.79 | −1.6 | −18.39 | −3.1 * | −9.37 |
| Process-Quality-Adjusted Coverage | ||||||||||||
| Abs. | Rel. | Abs. | Rel. | Abs. | Rel. | Abs. | Rel. | Abs. | Rel. | Abs. | Rel. | |
| Exact Match Linking | Reference | Reference | Reference | Reference | Reference | Reference | ||||||
| Administrative Boundary Linking | −1.2 | −1.47 | −1.1 | −7.91 | −3.1 * | −11.83 | −8.9 * | −13.86 | −0.5 | −4.35 | −4.2 * | −11.83 |
| Euclidean Buffer Linking | −3.4 * | −4.17 | −0.5 | −3.60 | −2.6 * | −9.92 | −3.7 * | −5.76 | −1.4 | −12.17 | −3.1 * | −8.73 |
| Raster-Based Travel Time Linking | −3.6 * | −4.41 | −1 | −7.19 | −1.5 | −5.73 | −1.7 | −2.65 | −0.9 | −7.83 | −2.3 * | −6.48 |
| Kernel Density Estimate Linking | −2.7 * | −3.31 | −1.2 | −8.63 | −1.1 | −4.20 | −1.9 * | −2.96 | −0.7 | −6.09 | −2.5 * | −7.04 |
Disclaimer/Publisher’s Note: The statements, opinions and data contained in all publications are solely those of the individual author(s) and contributor(s) and not of MDPI and/or the editor(s). MDPI and/or the editor(s) disclaim responsibility for any injury to people or property resulting from any ideas, methods, instructions or products referred to in the content. |
© 2025 by the authors. Licensee MDPI, Basel, Switzerland. This article is an open access article distributed under the terms and conditions of the Creative Commons Attribution (CC BY) license (https://creativecommons.org/licenses/by/4.0/).
Share and Cite
Verma, V.R.; Sriram, S.; Dash, U. Linking Household and Service Provisioning Assessments to Estimate a Metric of Effective Health Coverage: A Metric for Monitoring Universal Health Coverage. Int. J. Environ. Res. Public Health 2025, 22, 561. https://doi.org/10.3390/ijerph22040561
Verma VR, Sriram S, Dash U. Linking Household and Service Provisioning Assessments to Estimate a Metric of Effective Health Coverage: A Metric for Monitoring Universal Health Coverage. International Journal of Environmental Research and Public Health. 2025; 22(4):561. https://doi.org/10.3390/ijerph22040561
Chicago/Turabian StyleVerma, Veenapani Rajeev, Shyamkumar Sriram, and Umakant Dash. 2025. "Linking Household and Service Provisioning Assessments to Estimate a Metric of Effective Health Coverage: A Metric for Monitoring Universal Health Coverage" International Journal of Environmental Research and Public Health 22, no. 4: 561. https://doi.org/10.3390/ijerph22040561
APA StyleVerma, V. R., Sriram, S., & Dash, U. (2025). Linking Household and Service Provisioning Assessments to Estimate a Metric of Effective Health Coverage: A Metric for Monitoring Universal Health Coverage. International Journal of Environmental Research and Public Health, 22(4), 561. https://doi.org/10.3390/ijerph22040561