
Machine Learning in Predicting Child Malnutrition: A Meta-Analysis of Demographic and Health Surveys Data


Abstract
1. Introduction
2. Materials and Methods
2.1. Literature Search
2.2. Study Inclusion Criteria
2.3. Study Selection Process
2.4. Data Extraction
2.5. Quality Assessment
2.6. Data Synthesis and Statistical Analysis
2.7. Sensitivity Analysis and Subgroup Analysis
2.8. Publication Bias
3. Results
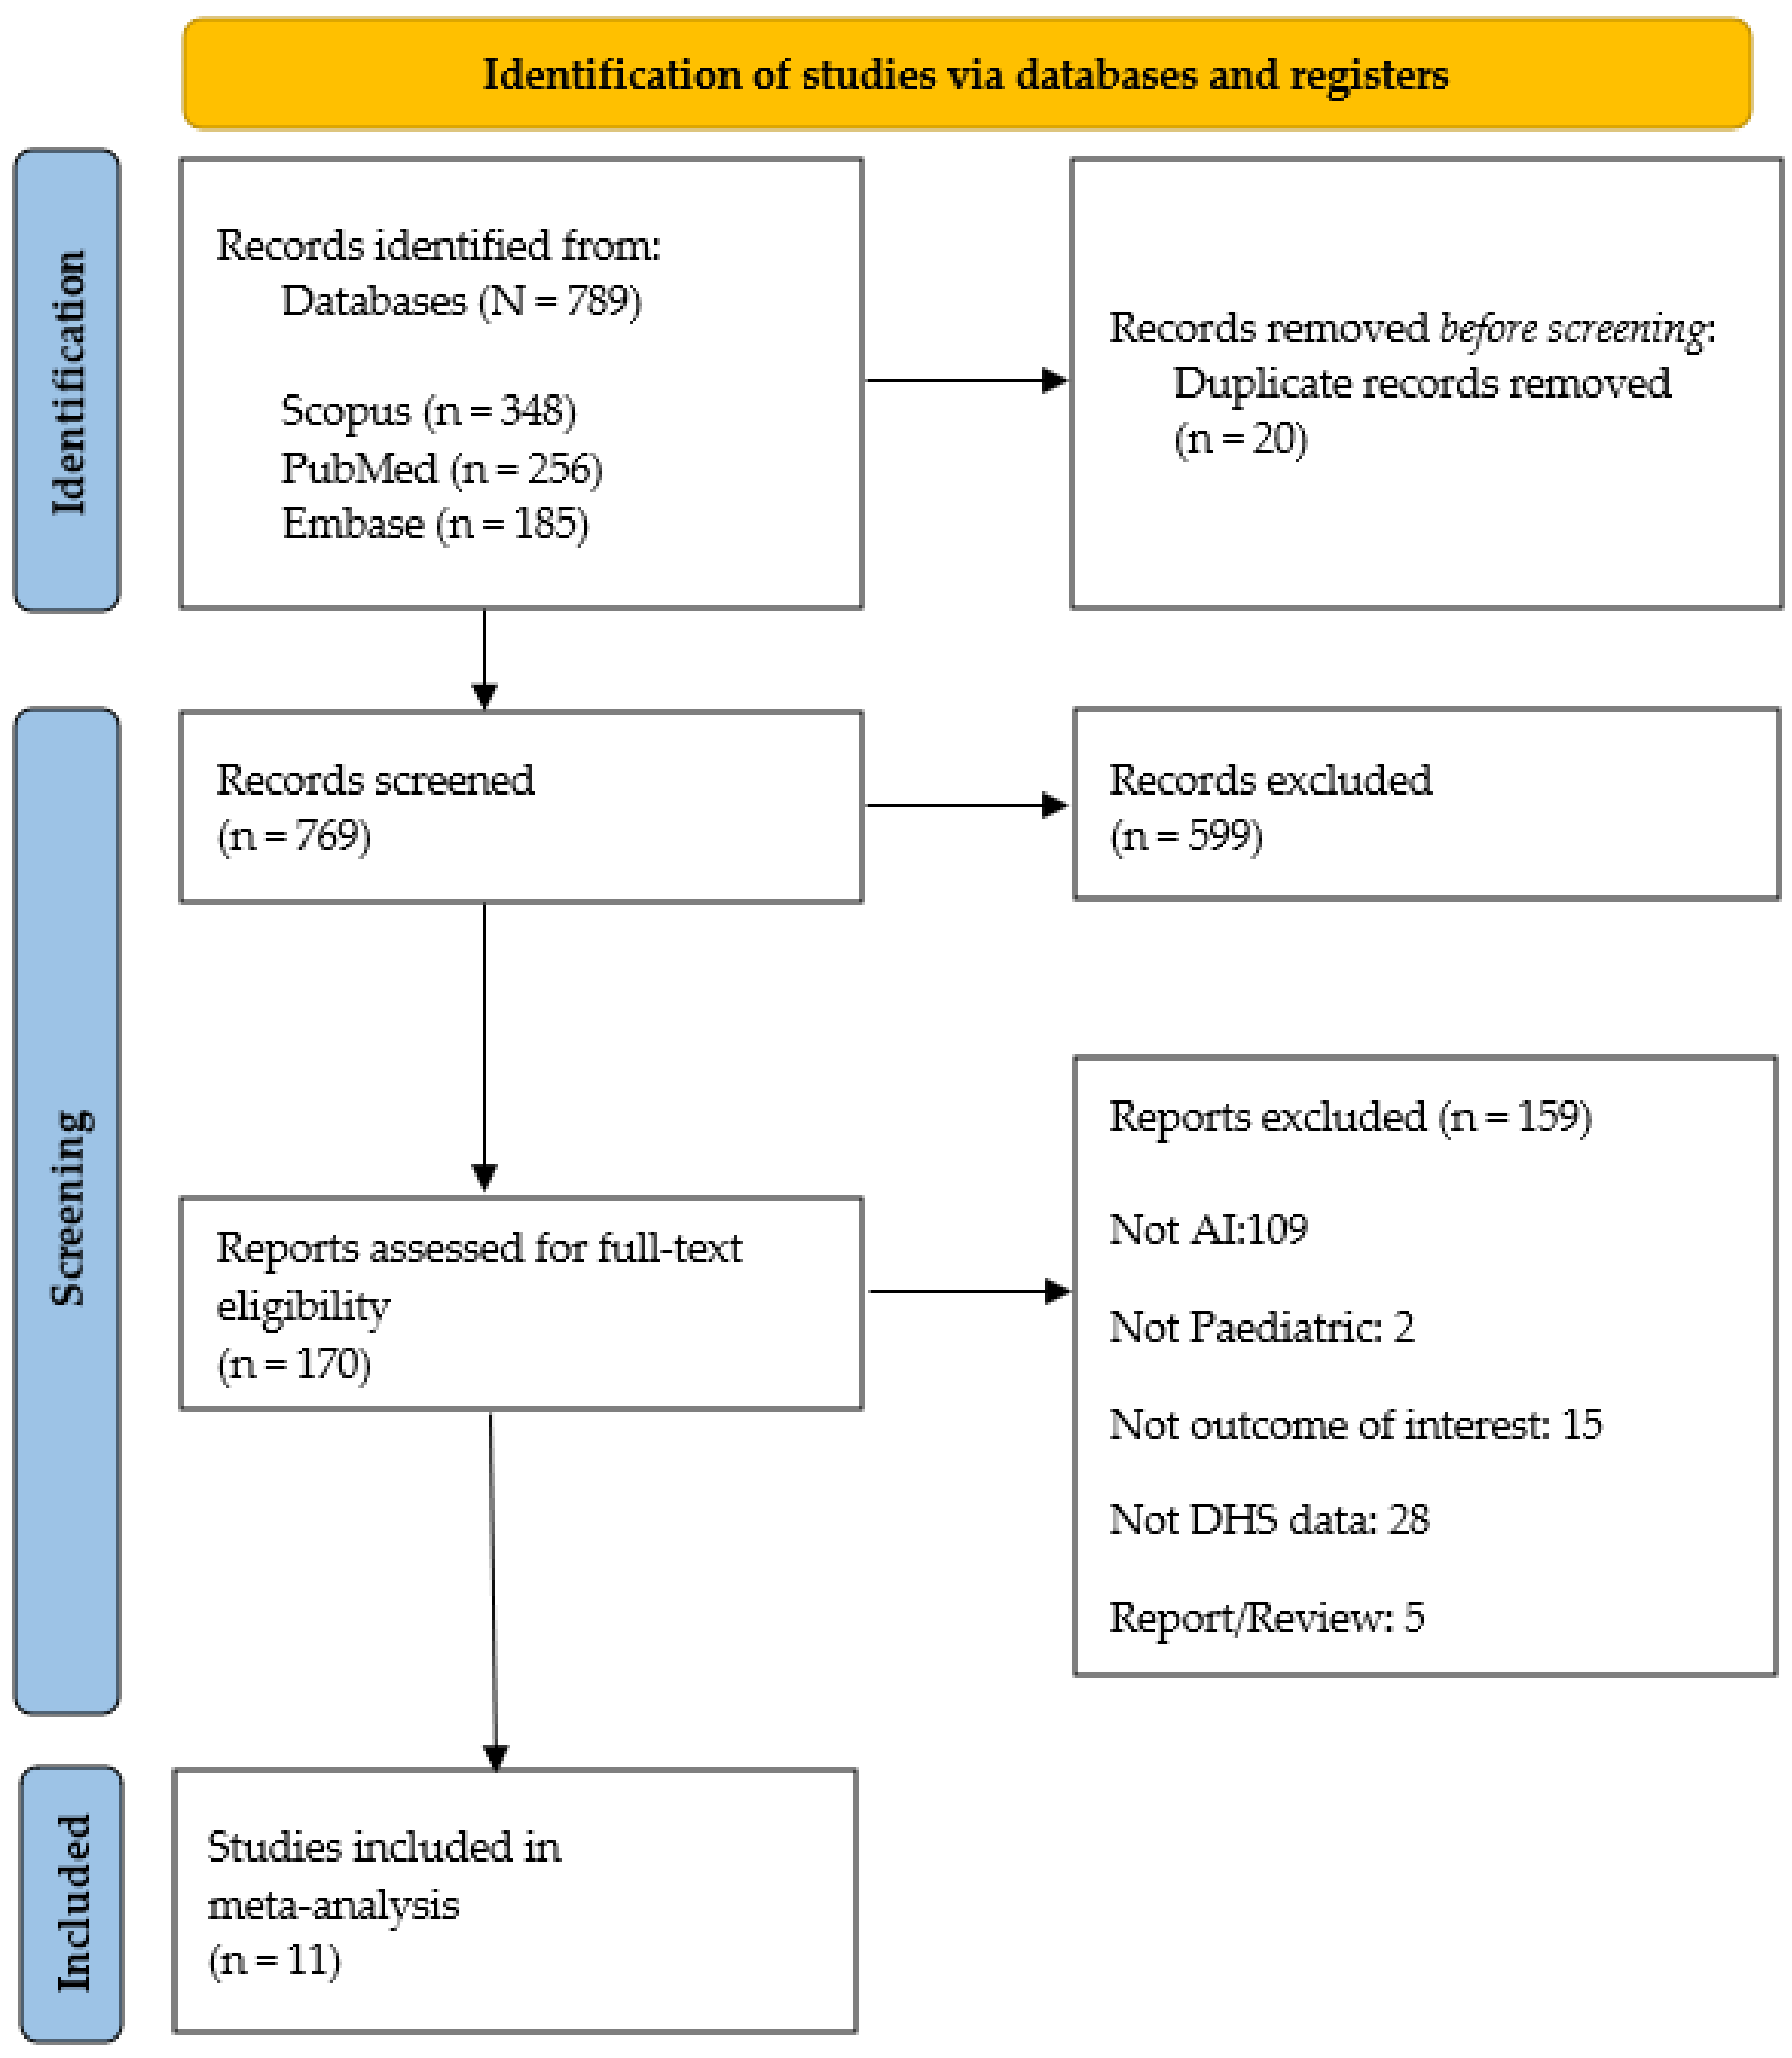
3.1. Search Results and Study Selection Process
3.2. Summary of Included Study Characteristics
3.3. ML in Stunting Assessment
3.4. ML in Wasting Assessment
3.5. ML in Underweight Assessment
3.6. Identified Predictive Features
3.7. Heterogeneity Assessment
3.8. Risk of Bias Assessment
4. Discussion
5. Conclusions
Supplementary Materials
Author Contributions
Funding
Institutional Review Board Statement
Informed Consent Statement
Data Availability Statement
Acknowledgments
Conflicts of Interest
References
- Rafique, S.; Afzal, S. Prevalence and Predictors of Stunting in Children Under Five Years of Age. J. Coll. Physicians Surg. Pakistan 2023, 33, 449–456. [Google Scholar] [CrossRef]
- Mediani, H.S. Predictors of Stunting Among Children Under Five Year of Age in Indonesia: A Scoping Review. Glob. J. Health Sci. 2020, 12, 83. [Google Scholar] [CrossRef]
- Sow, B.; Mukhtar, H.; Ahmad, H.F.; Suguri, H. Assessing the relative importance of social determinants of health in malaria and anemia classification based on machine learning techniques. Inform. Health Soc. Care 2020, 45, 229–241. [Google Scholar] [CrossRef] [PubMed]
- UNICEF. UNICEF-WHO-The World Bank: Joint Child Malnutrition Estimates (JME)—Levels and Trends—2023 Edition; UNICEF: New York, NY, USA, 2023. [Google Scholar]
- World Health Organization. Malnutrition. 2024. Available online: https://www.who.int/news-room/fact-sheets/detail/malnutrition (accessed on 21 October 2024).
- Karlsson, O.; Kim, R.; Bogin, B.; Subramanian, S.V. Maternal Height-standardized Prevalence of Stunting in 67 Low-and Middle-income Countries. J. Epidemiol. 2022, 32, 337–344. [Google Scholar] [CrossRef]
- Rahman, S.M.J.; Ahmed, N.A.M.F.; Abedin, M.M.; Ahammed, B.; Ali, M.; Rahman, M.J.; Maniruzzaman, M. Investigate the risk factors of stunting, wasting, and underweight among under-five Bangladeshi children and its prediction based on machine learning approach. PLoS ONE 2021, 16, e0253172. [Google Scholar] [CrossRef]
- Trivedi, A.; Jain, M.; Gupta, N.K.; Hinsche, M.; Singh, P.; Matiaschek, M.; Behrens, T.; Militeri, M.; Birge, C.; Kaushik, S.; et al. Height Estimation of Children under Five Years using Depth Images. In Proceedings of the 2021 43rd Annual International Conference of the IEEE Engineering in Medicine & Biology Society (EMBC), Virtual, 1–5 November 2021; Volume 4, pp. 3886–3889. [Google Scholar] [CrossRef]
- Sharma, V.; Sharma, V.; Khan, A.; Wassmer, D.J.; Schoenholtz, M.D.; Hontecillas, R.; Bassaganya-Riera, J.; Zand, R.; Abedi, V. Malnutrition, Health and the Role of Machine Learning in Clinical Setting. Front. Nutr. 2020, 7, 44. [Google Scholar] [CrossRef]
- Mahmud, T.; Wara, T.U.; Joy, C.D. Risk factor identification and classification of malnutrition among under-five children in Bangladesh: Machine learning and statistical approach. arXiv 2024, arXiv:2412.05813. [Google Scholar]
- Nguyen, G.; Dlugolinsky, S.; Bobák, M.; Tran, V.; López García, Á.; Heredia, I.; Malík, P.; Hluchý, L. Machine Learning and Deep Learning frameworks and libraries for large-scale data mining: A survey. Artif. Intell. Rev. 2019, 52, 77–124. [Google Scholar] [CrossRef]
- Jin, B.T.; Choi, M.H.; Moyer, M.F.; Kim, D.A. Predicting malnutrition from longitudinal patient trajectories with deep learning. PLoS ONE 2022, 17, e271487. [Google Scholar] [CrossRef]
- Ula, M.; Ulva, A.F.; Saputra, I.; Mauliza, M.; Maulana, I. Implementation of Machine Learning Using the K-Nearest Neighbor Classification Model in Diagnosing Malnutrition in Children. Multica Sci. Technol. J. 2022, 2, 94–99. [Google Scholar] [CrossRef]
- Hasdyna, N.; Dinata, R.K.; Rahmi; Fajri, T.I. Hybrid Machine Learning for Stunting Prevalence: A Novel Comprehensive Approach to Its Classification, Prediction, and Clustering Optimization in Aceh, Indonesia. Informatics 2024, 11, 89. [Google Scholar] [CrossRef]
- El Bouchefry, K.; de Souza, R.S. Learning in Big Data: Introduction to Machine Learning; Elsevier Inc.: Amsterdam, The Netherlands, 2020. [Google Scholar] [CrossRef]
- Di Martino, F.; Delmastro, F.; Dolciotti, C. Explainable AI for Malnutrition Risk Prediction from m-Health and Clinical Data. Smart Health 2023, 30, 100429. [Google Scholar] [CrossRef]
- Demsash, A.W. Using best performance machine learning algorithm to predict child death before celebrating their fifth birthday. Inform. Med. Unlocked 2023, 40, 101298. [Google Scholar] [CrossRef]
- dos Santos, B.S.; Steiner, M.T.A.; Fenerich, A.T.; Lima, R.H.P. Data mining and machine learning techniques applied to public health problems: A bibliometric analysis from 2009 to 2018. Comput. Ind. Eng. 2019, 138, 106120. [Google Scholar] [CrossRef]
- Page, M.J.; McKenzie, J.E.; Bossuyt, P.M.; Boutron, I.; Hoffmann, T.C.; Mulrow, C.D.; Shamseer, L.; Tetzlaff, J.M.; Akl, E.A.; Brennan, S.E.; et al. The PRISMA 2020 statement: An updated guideline for reporting systematic reviews. BMJ 2021, 372, n71. [Google Scholar] [CrossRef]
- de Jong, Y.; Ramspek, C.L.; Zoccali, C.; Jager, K.J.; Dekker, F.W.; van Diepen, M. Appraising prediction research: A guide and meta-review on bias and applicability assessment using the Prediction model Risk of Bias ASsessment Tool (PROBAST). Nephrology 2021, 26, 939–947. [Google Scholar] [CrossRef]
- Cochrane Library. Standard Errors from Confidence Intervals and p Values: Difference Measures. 2024. Available online: https://training.cochrane.org/search/all/Standard+errors+from+confidence+intervals+and+P+values%3A+difference+measures?manual=HandbookCurrent (accessed on 20 April 2024).
- Cochrane Library. 9.5 Heterogeneity. Available online: https://handbook-5-1.cochrane.org/chapter_9/9_5_heterogeneity.htm (accessed on 20 April 2024).
- Cochrane Training. Welcome to RevMan 5.4. 2020. Available online: https://training.cochrane.org/system/files/uploads/protected_file/RevMan5.4_user_guide.pdf (accessed on 20 April 2024).
- Sukumaran Nair, A.; Borkar, N. Sensitivity and subgroup analysis in a meta-analysis—What we should know? Indian J. Anaesth. 2024, 68, 922–924. [Google Scholar] [CrossRef]
- Cochrane Library. 9.6.2 What Are Subgroup Analyses? Available online: https://handbook-5-1.cochrane.org/chapter_9/9_6_2_what_are_subgroup_analyses.htm (accessed on 28 June 2024).
- Ndagijimana, S.; Kabano, I.H.; Masabo, E.; Ntaganda, J.M. Prediction of Stunting among Under-5 Children in Rwanda Using Machine Learning Techniques. J. Prev. Med. Public Health 2023, 56, 41–49. [Google Scholar] [CrossRef]
- Shen, H.; Zhao, H.; Jiang, Y. Machine Learning Algorithms for Predicting Stunting among Under-Five Children in Papua New Guinea. Children 2023, 10, 1638. [Google Scholar] [CrossRef]
- Khan, M.N.A.; Yunus, R.M. A hybrid ensemble approach to accelerate the classification accuracy for predicting malnutrition among under-five children in sub-Saharan African countries. Nutrition 2023, 108, 111947. [Google Scholar] [CrossRef]
- Bitew, F.H.; Sparks, C.S.; Nyarko, S.H. Machine learning algorithms for predicting undernutrition among under-five children in Ethiopia. Public Health Nutr. 2022, 25, 269–280. [Google Scholar] [CrossRef]
- Chilyabanyama, O.N.; Chilengi, R.; Simuyandi, M.; Chisenga, C.C.; Chirwa, M.; Hamusonde, K.; Saroj, R.K.; Iqbal, N.T.; Ngaruye, I.; Bosomprah, S. Performance of Machine Learning Classifiers in Classifying Stunting among Under-Five Children in Zambia. Children 2022, 9, 1082. [Google Scholar] [CrossRef] [PubMed]
- Abid, M.H.; Haque, A.; Kamrul Hossain, M. Factors Causing Stunting Among Under-Five Children in Bangladesh; Springer: Singapore, 2021; Volume 1183. [Google Scholar] [CrossRef]
- Mansur, M.; Afiaz, A.; Hossain, M.S. Sociodemographic risk factors of under-five stunting in Bangladesh: Assessing the role of interactions using a machine learning method. PLoS ONE 2021, 16, e256729. [Google Scholar] [CrossRef] [PubMed]
- Shahriar, M.M.; Iqubal, M.S.; Mitra, S.; Das, A.K. A deep learning approach to predict malnutrition status of 0–59 Month’s Older Children in Bangladesh. In Proceedings of the 2019 IEEE International Conference on Industry 4.0, Artificial Intelligence, and Communications Technology (IAICT), Bali, Indonesia, 1–3 July 2019; pp. 145–149. [Google Scholar]
- Khan, J.R.; Tomal, J.H.; Raheem, E. Model and variable selection using machine learning methods with applications to childhood stunting in Bangladesh. Inform. Health Soc. Care 2021, 46, 425–442. [Google Scholar] [CrossRef] [PubMed]
- Talukder, A.; Ahammed, B. Machine learning algorithms for predicting malnutrition among under-five children in Bangladesh. Nutrition 2020, 78, 110861. [Google Scholar] [CrossRef]
- PRISMA. PRISMA Flow Diagram. 2024. Available online: https://www.prisma-statement.org/prisma-2020-flow-diagram (accessed on 10 February 2025).
- Saroj, R.K.; Yadav, P.K.; Singh, R.; Chilyabanyama, O.N. Machine Learning Algorithms for understanding the determinants of under-five Mortality. BioData Min. 2022, 15, 20. [Google Scholar] [CrossRef]
- Khare, S.; Kavyashree, S.; Gupta, D.; Jyotishi, A. Investigation of Nutritional Status of Children based on Machine Learning Techniques using Indian Demographic and Health Survey Data. Procedia Comput. Sci. 2017, 115, 338–349. [Google Scholar] [CrossRef]
- Momand, Z.; Mongkolnam, P.; Kositpanthavong, P.; Chan, J.H. Data mining based prediction of malnutrition in Afghan children. In Proceedings of the 2020 12th International Conference on Knowledge and Smart Technology (KST), Pattaya, Thailand, 29 January–1 February 2020; pp. 12–17. [Google Scholar] [CrossRef]
- Vasu, S.R.; Khare, S.; Gupta, D.; Jyotishi, A. Features Explaining Malnutrition in India: A Machine Learning Approach to Demographic and Health Survey Data. In Communications in Computer and Information Science; Springer Science and Business Media: Berlin/Heidelberg, Germany, 2021; Volume 1367, pp. 87–99. [Google Scholar] [CrossRef]
- Jana, A.; Dey, D.; Ghosh, R. Contribution of low birth weight to childhood undernutrition in India: Evidence from the national family health survey 2019–2021. BMC Public Health 2023, 23, 1336. [Google Scholar] [CrossRef]
- Ashikul Islam Pollob, S.M.; Abedin, M.M.; Islam, M.T.; Islam, M.M.; Maniruzzaman, M. Predicting risks of low birth weight in Bangladesh with machine learning. PLoS ONE 2022, 17, e0267190. [Google Scholar] [CrossRef]
- Meitei, A.J.; Saini, A.; Mohapatra, B.B.; Singh, K.J. Predicting child anaemia in the North-Eastern states of India: A machine learning approach. Int. J. Syst. Assur. Eng. Manag. 2022, 13, 2949–2962. [Google Scholar] [CrossRef]
- Amusa, L.B.; Bengesai, A.V.; Khan, H.T.A. Childhood stunting and subsequent educational outcomes: A marginal structural model analysis from a South African longitudinal study. Public Health Nutr. 2022, 25, 3016–3024. [Google Scholar] [CrossRef] [PubMed]
- Kebede Kassaw, A.; Yimer, A.; Abey, W.; Molla, T.L.; Zemariam, A.B. The application of machine learning approaches to determine the predictors of anemia among under five children in Ethiopia. Sci. Rep. 2023, 13, 22919. [Google Scholar] [CrossRef] [PubMed]
- Saihood, Q.; Sonuç, E. The Efficiency of Classification Techniques in Predicting Anemia Among Children: A Comparative Study; Springer International Publishing: Cham, Switzerland, 2022; Volume 1548. [Google Scholar] [CrossRef]
- Hosseinzadeh Kasani, P.; Lee, J.E.; Park, C.; Yun, C.H.; Jang, J.W.; Lee, S.A. Evaluation of nutritional status and clinical depression classification using an explainable machine learning method. Front. Nutr. 2023, 10, 1–22. [Google Scholar] [CrossRef] [PubMed]
- Salih, A.M.; Raisi-Estabragh, Z.; Galazzo, I.B.; Radeva, P.; Petersen, S.E.; Lekadir, K.; Menegaz, G. A Perspective on Explainable Artificial Intelligence Methods: SHAP and LIME. Adv. Intell. Syst. 2024, 7, 1165854. [Google Scholar] [CrossRef]
- Janssen, S.M.; Bouzembrak, Y.; Tekinerdogan, B. Artificial Intelligence in Malnutrition: A systematic literature review. Adv. Nutr. 2024, 15, 100264. [Google Scholar] [CrossRef]
- Díaz, G.; Maria, M.I.; Gonzalez, M.C.; Reyes, M. The global leadership initiative on malnutrition criteria for the diagnosis of malnutrition in patients admitted to the intensive care unit: A systematic review and meta-analysis. Clin. Nutr. 2023, 42, 182–189. [Google Scholar] [CrossRef]
- Das, M.; Verma, M.; Sahoo, S.S.; Gupta, M. Regional Water Availability and WASH Indicators as Predictors of Malnutrition in Under-5 Children: Analysis of the National Family Health Survey, India (2015–2016). J. Trop. Pediatr. 2022, 68, fmac030. [Google Scholar] [CrossRef]
- Rahut, D.B.; Mishra, R.; Bera, S. Geospatial and environmental determinants of stunting, wasting, and underweight: Empirical evidence from rural South and Southeast Asia. Nutrition 2024, 120, 112346. [Google Scholar] [CrossRef]
- Ulahannan, S.K.; Wilson, A.; Chhetri, D.; Soman, B.; Prashanth, N.S. Alarming level of severe acute malnutrition in Indian districts. BMJ Glob. Health 2022, 7, e007798. [Google Scholar] [CrossRef]
- Getnet, M.; Sisay, W.S.; Zeleke Alem, A. Spatial distribution and associated factors of co-occurrence of overweight/obesity and Anemia among women in the reproductive age in sub-Saharan Africa: A multilevel analysis, DHS 2016–2021. PLoS ONE 2024, 19, e0299519. [Google Scholar] [CrossRef]
- Rohini, A. Global Hunger Index 2023: India Reports Highest Child Wasting Rate; Slips 4 Notches on Ranking. 2023. Available online: https://www.downtoearth.org.in/health/global-hunger-index-2023-india-reports-highest-child-wasting-rate-slips-4-notches-on-ranking-92282 (accessed on 3 November 2024).
- Wang, Y.; Chen, H.J.; Shaikh, S.; Mathur, P. Is obesity becoming a public health problem in India? Examine the shift from under- to overnutrition problems over time. Obes. Rev. 2009, 10, 456–474. [Google Scholar] [CrossRef]
- Sahiledengle, B.; Mwanri, L.; Petrucka, P.; Tadesse, H.; Agho, K.E. Co-existence of maternal overweight/obesity, child undernutrition, and anaemia among mother-child pairs in Ethiopia. PLoS Glob. Public Health 2024, 4, e0002831. [Google Scholar] [CrossRef]

| Reference | Country | Purpose of Study | Source of Data | Form of Malnutrition Addressed | Prevalence | Missing Value Imputation |
|---|---|---|---|---|---|---|
| [26] | Rwanda | Predicting childhood stunting | RDHS (2019–2020) | Stunting | 33.35% | K-nearest-neighbors imputer |
| [27] | Papua New Guinea | Predicting stunting and the key predictors | PNG DHS (2016–2018) | Stunting | 39.70% | Missing indicator method (MIM) |
| [28] | Sub-Saharan Africa | Predicting malnutrition | DHS data from 14 SSA countries | Stunting | Malnourished 39.3% | Manual elimination of missing/irrelevant information |
| [29] | Ethiopia | Predicting malnutrition | EDHS-2016 | Stunting Wasting Underweight | (Stunted 38.4%) (Wasted 10%) (Underweight 23.3%) (Malnutrition 46.6%) | NR |
| [30] | Zambia | Predicting childhood stunting | ZDHS-2018 | Stunting | 34.2% | Missing instances were dropped |
| [31] | Bangladesh | Predicting stunting and the key predictors | BDHS-2014 | Stunting | 36.4% | Filtering procedure |
| [7] | Bangladesh | Predicting malnutrition and the key predictors | BDHS-2014 | Stunting Wasting Underweight | (Stunted 35.4%) (Wasted 5.4%) (Underweight 32.8%) | NR |
| [32] | Bangladesh | Predicting stunting and interaction between the predictors | BDHS-2014 | Stunting | 36.50% | Excluded the missing values |
| [33] | Bangladesh | Predicting malnutrition with the ANN approach | BDHS-2014 | Stunting Wasting Underweight | NR | NR |
| [34] | Bangladesh | Predicting childhood stunting | BDHS-2014 | Stunting | 36.18% | Excluded the missing values |
| [35] | Bangladesh | Predicting childhood malnutrition | BDHS-2014 | Underweight | 32.90% | Excluded the missing values |
| Reference | Sample Size | Train and Test (%) | Feature Selection | ML Algorithms | Performance Metrics | Method of Validation | Feature Importance |
|---|---|---|---|---|---|---|---|
| [26] | 3814 | NR | Chi-square and SMOTE for balancing data | Support vector machines, naïve Bayes, random forest, logistic regression, and extreme gradient boosting | Confusion matrix, receiver operating characteristic curve, accuracy, sensitivity, specificity, F1 score, and area under the curve (AUC). | 10-fold cross-validation | NR |
| [27] | 3380 | Training 90% and test 10% | Embedded LASSO and the wrapped random forest–recursive feature elimination (RF-RFE) | Logistic regression, a conditional decision tree, a support vector machine with a radial basis function kernel, and an extreme gradient boosting machine (XGBoost) | AUC, accuracy, precision, recall, F1 score | 10-fold cross-validation | Shapley additive explanations (SHAP) |
| [28] | 56,243 | Training 80% and test 20% | Gini importance | The research used bagging, boosting, and voting on random forest, decision tree, extreme gradient boosting, and k-nearest neighbors to generate the MVBHE model. | Accuracy, precision, recall, and the F1 score | 10-fold cross-validation | NR |
| [29] | 9471 | Training 70% and test 30% | Based on retrospective information | XGBoost, generalized linear model (GLM), NNet, RF, k-NN) using ‘Stacking’ | Confusion matrix, prediction, accuracy, sensitivity, and specificity | 10-fold cross-validation | Mean decrease Gini |
| [30] | 6799 | Training 70% and test 30% | Random forest | Logistic regression, random forest, support vector machine (SVM), naïve Bayes, and extreme gradient boosting (XGBoost) | Accuracy, recall, sensitivity, specificity, precision, F1 score, Cohen’s kappa, and area under the curve (AUC) | 3-fold cross-validation | Random forest |
| [31] | 7256 | Training 70% and test 30% | Decision tree algorithm, Support vector machine (SVM) and artificial neural network (ANN) | Precision, recall, F1 score | N/A | ||
| [7] | 7079 | NR | Chi-square analysis | Support vector machine (SVM), random forest (RF), and LR | Accuracy and area under the curve (AUC) | 10-fold CV | NR |
| [32] | 6170 | NR | Based on the literature review and pre-analysis | Classification tree, ensemble of trees | Accuracy, sensitivity, specificity, and the area under the receiver operating characteristic curve (ROC) | 10-fold cross-validation | NR |
| [33] | 6995 | Training 90% and test 10% | Literature review | Support vector machine (SVM) classifier, decision tree classifier, naïve Bayes classifier, and random forest classifier besides the artificial neural network (ANN) | Accuracy | 10-fold cross-validation | Backward elimination on the predictive model |
| [34] | 6044 | Training 66.67% and test 33.33% | Bivariate analysis, logistic regression model with stepwise variable selection | Gradient boosting, random forests, support vector machines, classification tree, logistic regression, linear discriminant analysis, neural network, regularized discriminant analysis, and logistic regression | Sensitivity, specificity, area under the receiver operating characteristic curve (AUC), and F-measure | 3-fold cross-validation | NR |
| [35] | 6863 | Training 75% and test 25% | Chi-square analysis | Linear discriminant analysis, K-nearest neighbors, support vector machines, random forest, and logistic regression | Accuracy, sensitivity, specificity, and Cohen’s k statistic | 10-fold cross-validation | RF feature selection |
| Reference | Findings | Best Predictive Features | Conclusion | Software/Tool Used |
|---|---|---|---|---|
| [26] | Gradient boosting classifier significantly outperformed other methods, identifying stunted children at 79.33% accuracy. | Mother’s height, water source distance, child’s age, birth weight, anemia history. | Model can help detect early stages of stunting and wasting. | Python as statistical software. |
| [27] | LASSO-XGB combined model provided best predictions. | Highlands region, age of the child, breastfeeding duration, maternal BMI. | Combining LASSO and XGBoost best predicted outcomes. | Data processing: STATA 17.0, Analyses: RStudio 4.1.2 |
| [28] | Random forest algorithm had the highest accuracy. | Mother’s age, income index, birth order, child’s weight, anemia history. | The MVBHE model is recommended for its accuracy and robustness. | SPSS version 26 for experimental run. |
| [29] | XGBTree algorithm worked best for stunting and wasting. | Time to water source, anemia history, child birth weight, mother’s education level. | Findings support improvement in access to clean water and maternal education. | The R programming language (version 3.6.0). |
| [30] | Random forest was the best performing model for the dataset. | Child’s and mother’s social and economic features. | Study demonstrates potential of machine learning in health outcome prediction. | Python version 3.10.2. |
| [31] | Decision tree accuracy was 74%, SVM was 72%, and KNN was 69%. | Mother’s highest education level, child’s age, birth order, child’s weight. | Addressing demographic, socioeconomic, and nutritional factors can improve outcomes. | SPSS version 23.0 for data cleaning. |
| [7] | RF accurately classified stunting, wasting, and underweight categories. | Region, child’s age, father’s education, mother’s BMI. | Identification and prediction of childhood malnutrition using RF. | STATA version 14 and R i386 4.0.0. |
| [32] | Decision tree rules yielded more accurate results compared to other models. | Wealth, area and division of residence, mother’s education level. | Tailored interventions based on socioeconomic and demographic factors are needed. | R (version 3.6.0). |
| [33] | ANN approach showed best results with accuracy higher than other models. | Residence, sex of the child, father’s education, mother’s BMI, household size. | Deep learning can effectively determine malnutrition status. | Python “numpy” library, Tensorflow (https://www.tensorflow.org), “Keras”. |
| [34] | GBOOST had the highest accuracy among the methods evaluated. | Child age, wealth index, maternal education, previous birth interval. | ML can support building accurate prediction models for malnutrition. | NR |
| [35] | RF algorithm demonstrated the best performance for classification tasks. | Child’s age, mother’s education, wealth index, mother’s BMI. | Recommends RF classification with RF regression for precise results. | NR |
Disclaimer/Publisher’s Note: The statements, opinions and data contained in all publications are solely those of the individual author(s) and contributor(s) and not of MDPI and/or the editor(s). MDPI and/or the editor(s) disclaim responsibility for any injury to people or property resulting from any ideas, methods, instructions or products referred to in the content. |
© 2025 by the authors. Licensee MDPI, Basel, Switzerland. This article is an open access article distributed under the terms and conditions of the Creative Commons Attribution (CC BY) license (https://creativecommons.org/licenses/by/4.0/).
Share and Cite
Rao, B.; Rashid, M.; Hasan, M.G.; Thunga, G. Machine Learning in Predicting Child Malnutrition: A Meta-Analysis of Demographic and Health Surveys Data. Int. J. Environ. Res. Public Health 2025, 22, 449. https://doi.org/10.3390/ijerph22030449
Rao B, Rashid M, Hasan MG, Thunga G. Machine Learning in Predicting Child Malnutrition: A Meta-Analysis of Demographic and Health Surveys Data. International Journal of Environmental Research and Public Health. 2025; 22(3):449. https://doi.org/10.3390/ijerph22030449
Chicago/Turabian StyleRao, Bhagyajyothi, Muhammad Rashid, Md Gulzarull Hasan, and Girish Thunga. 2025. "Machine Learning in Predicting Child Malnutrition: A Meta-Analysis of Demographic and Health Surveys Data" International Journal of Environmental Research and Public Health 22, no. 3: 449. https://doi.org/10.3390/ijerph22030449
APA StyleRao, B., Rashid, M., Hasan, M. G., & Thunga, G. (2025). Machine Learning in Predicting Child Malnutrition: A Meta-Analysis of Demographic and Health Surveys Data. International Journal of Environmental Research and Public Health, 22(3), 449. https://doi.org/10.3390/ijerph22030449