
Extending a COVID-19 Job Exposure Matrix: The SARS-CoV-2 or COVID-19 Job Exposure Matrix Module (SCoVJEM Module) for Population-Based Studies

 , ,
, ,
Abstract
1. Introduction
2. Materials and Methods
2.1. Dimensions
2.1.1. Talking Loudly
2.1.2. Physical Activity
2.1.3. Cold and Hot Environments
2.1.4. Index
2.2. Workforce Estimates
2.3. Comparison to 2018 Occupational Requirements Survey
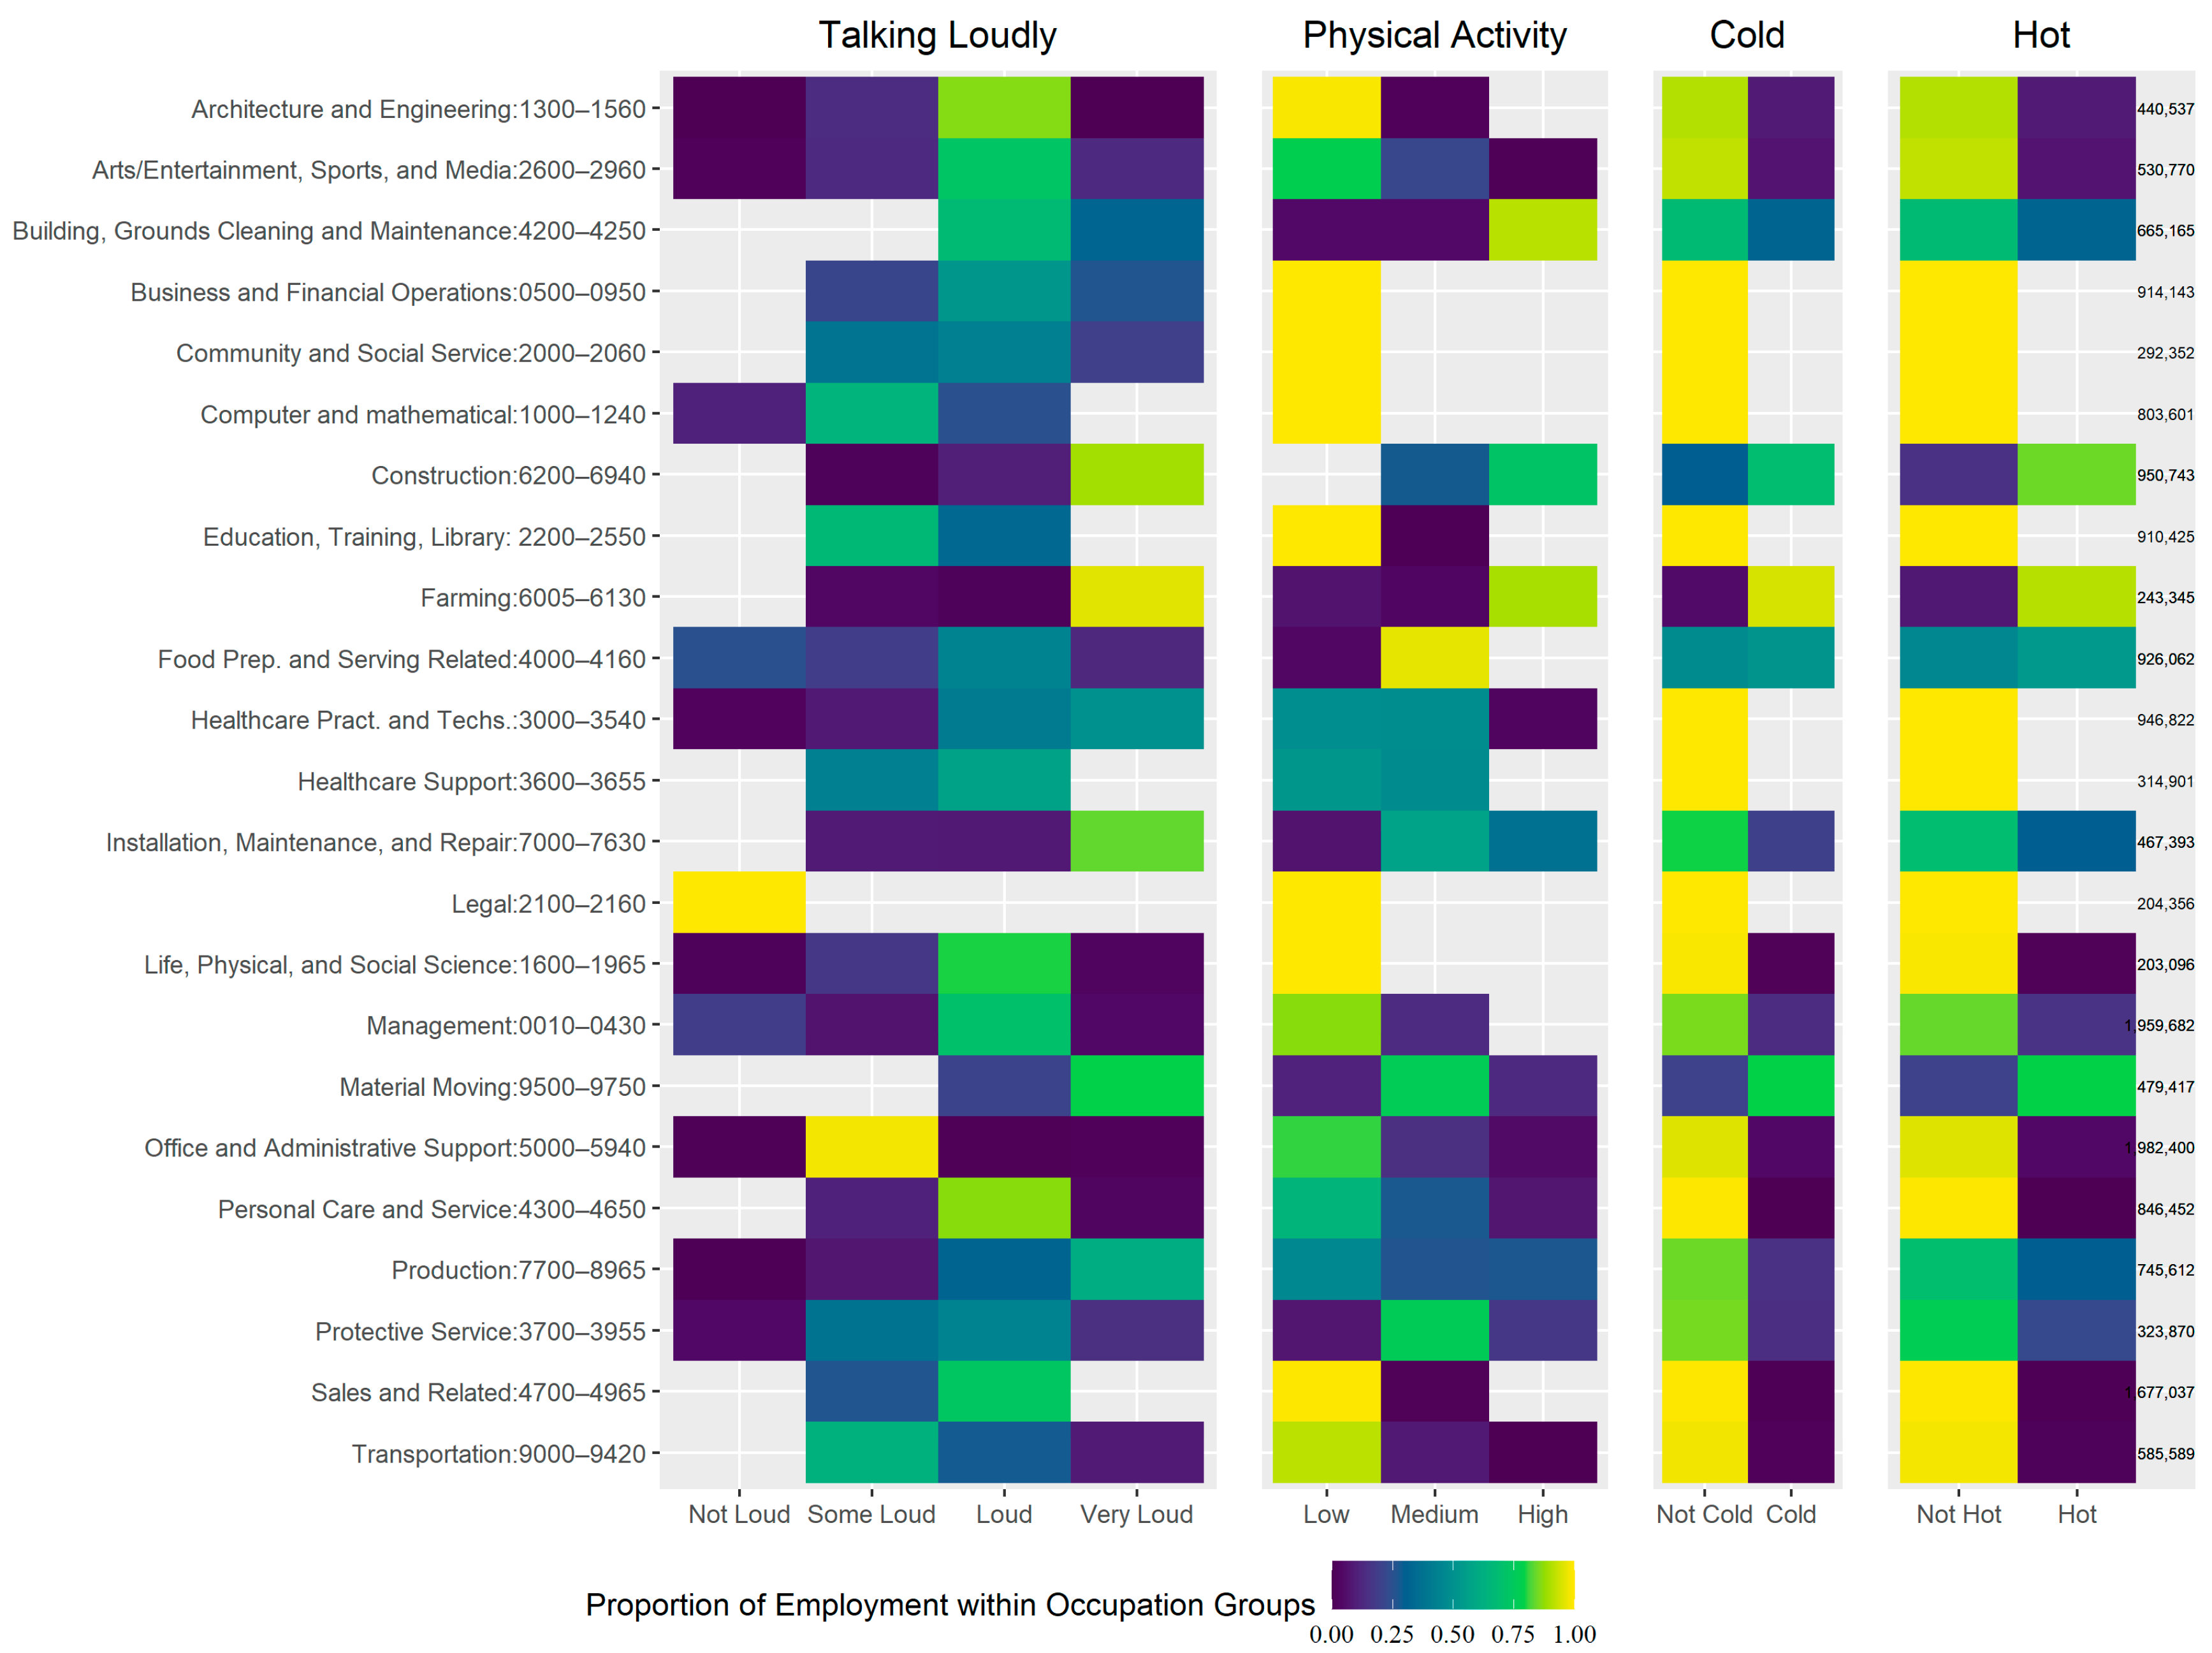
3. Results
3.1. Overall Description
3.1.1. By Occupation
3.1.2. By Race/Latino Ethnicity
3.1.3. By Sex
3.1.4. By Index
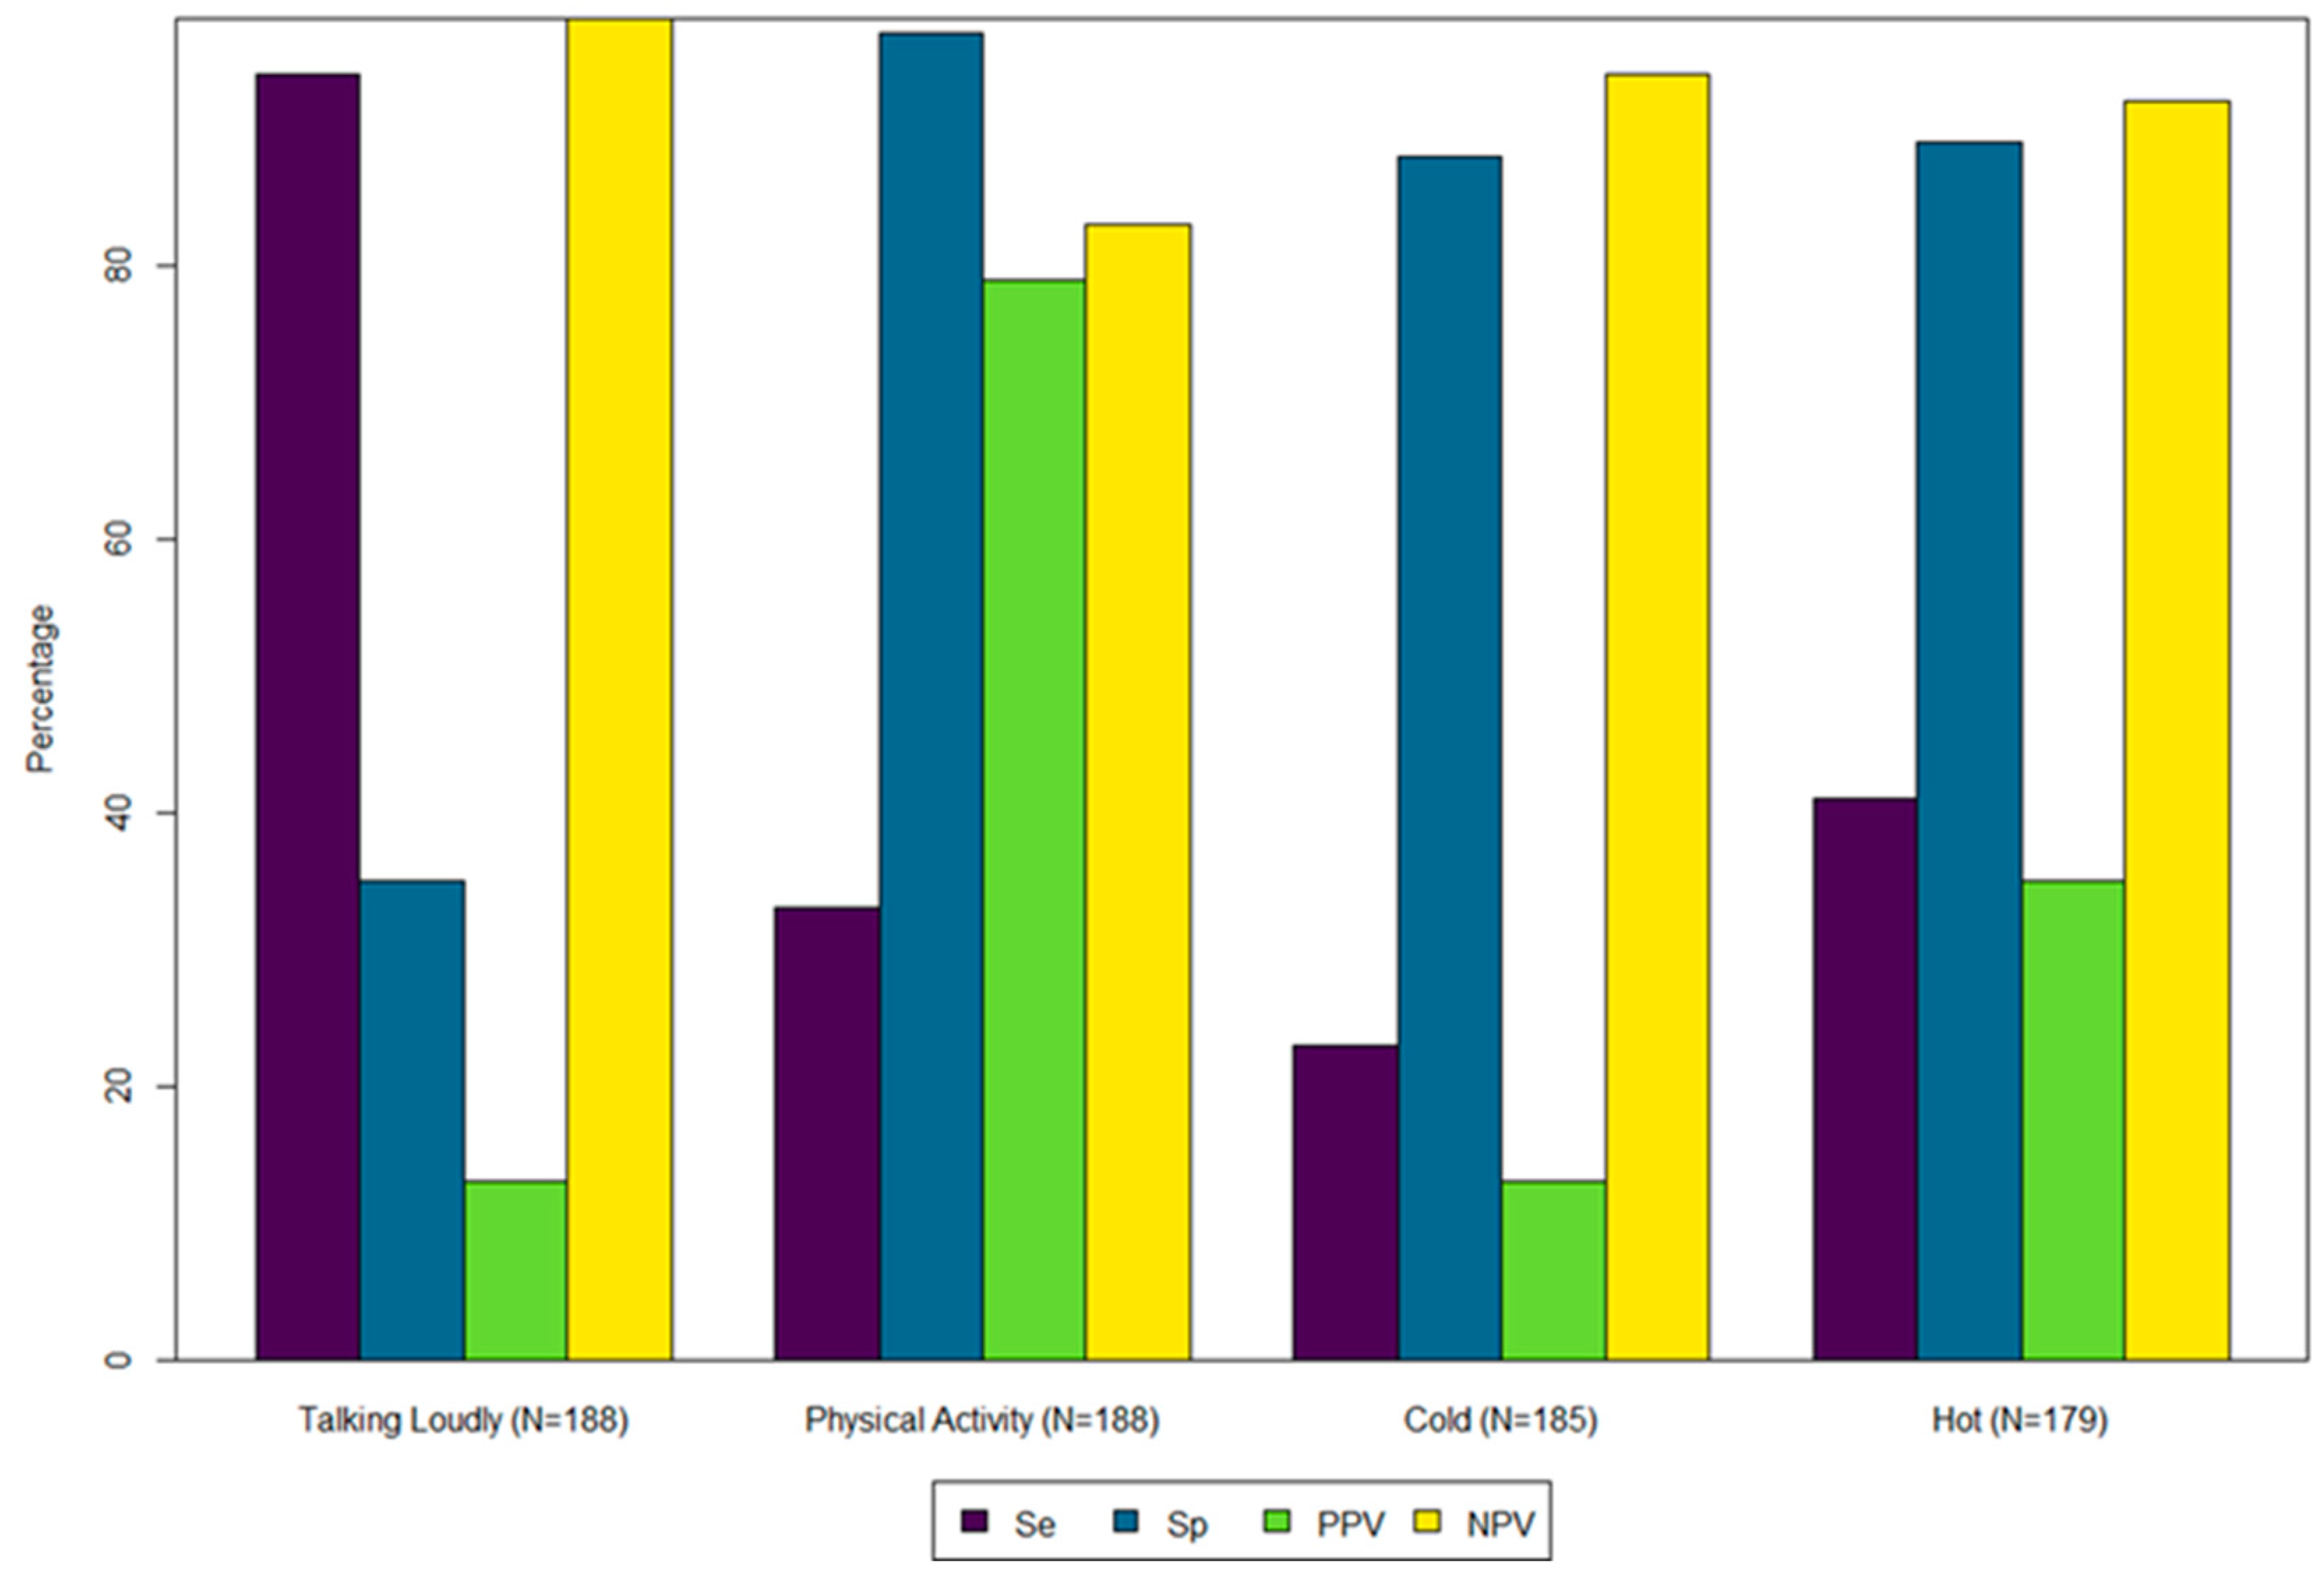
3.2. Comparison
4. Discussion
5. Conclusions
Supplementary Materials
Author Contributions
Funding
Institutional Review Board Statement
Informed Consent Statement
Data Availability Statement
Acknowledgments
Conflicts of Interest
Disclaimer
Abbreviations
| AIAN | American Indian and Alaska Native |
| COC | U.S. Census Occupation Codes |
| HPI | Hawaiian and Pacific Islander |
| JEM | Job Exposure Matrix |
| Judg | Judgment |
| Meas | Measure |
| O*NET | Occupational Information Network |
| PA | Physical Activity |
| SCoVJEM | SARS-CoV-2 or COVID-19 Job Exposure Matrix |
| Se | Sensitivity |
| SOEM | SARS-CoV-2 Occupational Exposure Matrix |
| Sp | Specificity |
References
- Heinzerling, A.; Nguyen, A.; Frederick, M.; Chan, E.; Gibb, K.; Rodriguez, A.; Wong, J.; Epson, E.; Watt, J.; Materna, B.; et al. Workplaces Most Affected by COVID-19 Outbreaks in California, January 2020-August 2021. Am. J. Public Health 2022, 112, 1180–1190. [Google Scholar] [CrossRef] [PubMed]
- Chen, Y.-H.; Riley, A.R.; Duchowny, K.A.; Aschmann, H.E.; Chen, R.; Kiang, M.V.; Mooney, A.; Stokes, A.C.; Glymour, M.M.; Bibbins-Domingo, K. COVID-19 mortality and excess mortality among working-age Californians, by occupational sector: March 2020 through November 2021. medRxiv 2022. [Google Scholar] [CrossRef]
- Cummings, K.J.; Beckman, J.; Frederick, M.; Harrison, R.; Nguyen, A.; Snyder, R.; Chan, E.; Gibb, K.; Rodriguez, A.; Wong, J.; et al. Disparities in COVID-19 fatalities among working Californians. PLoS ONE 2022, 17, e0266058. [Google Scholar] [CrossRef]
- Paul Leigh, J. COVID-19 May Have Been Job Related for One Fourth of Diagnosed Adults. Am. J. Public Health 2023, 113, 634–636. [Google Scholar] [CrossRef]
- Gaffney, A.; Himmelstein, D.U.; McCormick, D.; Woolhandler, S. COVID-19 Risk by Workers’ Occupation and Industry in the United States, 2020–2021. Am. J. Public Health 2023, 113, 647–656. [Google Scholar] [CrossRef]
- Bouyer, J.; Hemon, D. Studying the performance of a job exposure matrix. Int. J. Epidemiol. 1993, 22 (Suppl. S2), S65–S71. [Google Scholar] [CrossRef] [PubMed]
- Oude Hengel, K.M.; Burdorf, A.; Pronk, A.; Schlunssen, V.; Stokholm, Z.A.; Kolstad, H.A.; van Veldhoven, K.; Basinas, I.; van Tongeren, M.; Peters, S. Exposure to a SARS-CoV-2 infection at work: Development of an international job exposure matrix (COVID-19-JEM). Scand. J. Work. Environ. Health 2022, 48, 61–70. [Google Scholar] [CrossRef]
- Fadel, M.; Gilbert, F.; Legeay, C.; Dubee, V.; Esquirol, Y.; Verdun-Esquer, C.; Dinh, A.; Sembajwe, G.; Goldberg, M.; Roquelaure, Y.; et al. Association between COVID-19 infection and work exposure assessed by the Mat-O-Covid job exposure matrix in the CONSTANCES cohort. Occup. Environ. Med. 2022, 79, 782–789. [Google Scholar] [CrossRef]
- CSTE. Characterizing the Risk of Exposure to SARS-CoV-2 Among Non-Health Care Occupations Based on Three Workplace Risk Factors: Public Facing Work, Working Indoors, and Working in Close Physical Proximity to Others (8-18-21); Council of State and Territorial Epidemiologists: Atlanta, GA, USA, 2021. [Google Scholar]
- CSTE. Documentation of the Development of the Category of Public Facing Workers (Other than Healthcare) for Applying the CSTE Surveillance Case Definition of Work-Related COVID-19 (2-9-21); Council of State and Territorial Epidemiologists: Atlanta, GA, USA, 2021. [Google Scholar]
- Miller, S.L.; Nazaroff, W.W.; Jimenez, J.L.; Boerstra, A.; Buonanno, G.; Dancer, S.J.; Kurnitski, J.; Marr, L.C.; Morawska, L.; Noakes, C. Transmission of SARS-CoV-2 by inhalation of respiratory aerosol in the Skagit Valley Chorale superspreading event. Indoor Air 2021, 31, 314–323. [Google Scholar] [CrossRef]
- Asadi, S.; Wexler, A.S.; Cappa, C.D.; Barreda, S.; Bouvier, N.M.; Ristenpart, W.D. Aerosol emission and superemission during human speech increase with voice loudness. Sci. Rep. 2019, 9, 1–10. [Google Scholar] [CrossRef] [PubMed]
- Alsved, M.; Matamis, A.; Bohlin, R.; Richter, M.; Bengtsson, P.-E.; Fraenkel, C.-J.; Medstrand, P.; Löndahl, J. Exhaled respiratory particles during singing and talking. Aerosol Sci. Technol. 2020, 54, 1245–1248. [Google Scholar] [CrossRef]
- Cunningham, L.; Nicholson, P.J.; O’Connor, J.; McFadden, J.P. Cold working environments as an occupational risk factor for COVID-19. Occup. Med. 2021, 71, 245–247. [Google Scholar] [CrossRef] [PubMed]
- Gu, A.Y.; Zhu, Y.; Li, J.; Hoffmann, M.R. Speech-generated aerosol settling times and viral viability can improve COVID-19 transmission prediction. Environ. Sci. Atmos. 2022, 2, 34–45. [Google Scholar] [CrossRef]
- Wang, C.C.; Prather, K.A.; Sznitman, J.; Jimenez, J.L.; Lakdawala, S.S.; Tufekci, Z.; Marr, L.C. Airborne transmission of respiratory viruses. Science 2021, 373, eabd9149. [Google Scholar] [CrossRef]
- U. S. Department of Labor. O*NET Help Online. Available online: https://www.onetonline.org/help/online/scales#score (accessed on 7 October 2020).
- U. S. Department of Labor. O*NET Data Collection Program. Available online: https://www.onetcenter.org/dl_files/omb2018/Supporting_StatementA.pdf (accessed on 3 March 2025).
- CSTE. SARS-CoV-2 Occupational Exposure Matrix-Industry Extension (SOEM-IE): An Approach to Using Occupational Information to Identify Industries at High Risk of Exposure to SARS-CoV-2 (03-04-22); Council of State and Territorial Epidemiologists: Atlanta, GA, USA, 2022. [Google Scholar]
- Roberts, B.; Cheng, W.; Mukherjee, B.; Neitzel, R.L. Imputation of missing values in a large job exposure matrix using hierarchical information. J. Expo. Sci. Environ. Epidemiol. 2018, 28, 615–648. [Google Scholar] [CrossRef]
- Muro, M.; Liu, S.; Whiton, J.; Kulkarni, S.G. Digitalization and the American Workforce; Brookings Institute: Washington, DC, USA, 2017; p. 60. [Google Scholar]
- Vergara, X.P.; Gibb, K. Close physical proximity on the job-An exposure matrix. Am. J. Ind. Med. 2022, 65, 537–547. [Google Scholar] [CrossRef] [PubMed]
- NIOSH. National Institute for Occupational Safety and Health Employed Labor Force Query System; NIOSH: Cincinnati, OH, USA, 2019.
- Jones, N.R.; Qureshi, Z.U.; Temple, R.J.; Larwood, J.P.J.; Greenhalgh, T.; Bourouiba, L. Two metres or one: What is the evidence for physical distancing in covid-19? BMJ 2020, 370, m3223. [Google Scholar] [CrossRef]
- Tak, S.; Davis, R.R.; Calvert, G.M. Exposure to hazardous workplace noise and use of hearing protection devices among US workers--NHANES, 1999-2004. Am. J. Ind. Med. 2009, 52, 358–371. [Google Scholar] [CrossRef]
- Zhang, M. Estimation of differential occupational risk of COVID-19 by comparing risk factors with case data by occupational group. Am. J. Ind. Med. 2021, 64, 39–47. [Google Scholar] [CrossRef]
- Shkembi, A.; Neitzel, R.L. Noise as a risk factor for COVID-19 transmission: Comment on Zhang: “Estimation of differential occupational risk of COVID-19 by comparing risk factors with case data by occupational group”. Am. J. Ind. Med. 2022, 65, 512–513. [Google Scholar] [CrossRef]
- Pretzsch, A.; Seidler, A.; Hegewald, J. Health effects of occupational noise. Curr. Pollut. Rep. 2021, 7, 344–358. [Google Scholar] [CrossRef]
- Peng, Z.; Rojas, A.L.P.; Kropff, E.; Bahnfleth, W.; Buonanno, G.; Dancer, S.J.; Kurnitski, J.; Li, Y.; Loomans, M.; Marr, L.C.; et al. Practical Indicators for Risk of Airborne Transmission in Shared Indoor Environments and Their Application to COVID-19 Outbreaks. Env. Sci. Technol. 2022, 56, 1125–1137. [Google Scholar] [CrossRef] [PubMed]
- Weaver, A.K.; Head, J.R.; Gould, C.F.; Carlton, E.J.; Remais, J.V. Environmental Factors Influencing COVID-19 Incidence and Severity. Annu. Rev. Public Health 2022, 43, 271–291. [Google Scholar] [CrossRef] [PubMed]
- Quandt, A.; Keeney, A.J.; Flores, L.; Flores, D.; Villasenor, M. “We left the crop there lying in the field”: Agricultural worker experiences with the COVID-19 pandemic in a rural US-Mexico border region. J. Rural. Stud. 2022, 95, 533–543. [Google Scholar] [CrossRef]
- Bushman, D.; Sekaran, J.; Jeffery, N.; Rath, C.; Ackelsberg, J.; Weiss, D.; Wu, W.; Van Oss, K.; Johnston, K.; Huang, J.; et al. Coronavirus Disease 2019 (COVID-19) Outbreaks at 2 Construction Sites-New York City, October-November 2020. Clin. Infect. Dis. 2021, 73, S81–S83. [Google Scholar] [CrossRef] [PubMed]
- Pasco, R.F.; Fox, S.J.; Johnston, S.C.; Pignone, M.; Meyers, L.A. Estimated Association of Construction Work With Risks of COVID-19 Infection and Hospitalization in Texas. JAMA Netw. Open 2020, 3, e2026373. [Google Scholar] [CrossRef] [PubMed]
- Benitez-Robaina, S.; Ramos-Macias, A.; Borkoski-Barreiro, S.; Falcon-Gonzalez, J.C.; Salvatierra, P.; Ramos-de Miguel, A. COVID-19 era: Hearing handicaps behind face mask use in hearing aid users. J. Int. Adv. Otol. 2022, 18, 465–470. [Google Scholar] [CrossRef]
- Poon, B.T.; Jenstad, L.M. Communication with face masks during the COVID-19 pandemic for adults with hearing loss. Cogn. Res. Princ. Implic. 2022, 7, 24. [Google Scholar] [CrossRef]
- Groenewold, M.R.; Billock, R.; Free, H.; Burrer, S.L.; Sweeney, M.H.; Wong, J.; Lavender, A.; Argueta, G.; Crawford, H.L.; Erukunuakpor, K.; et al. Excess risk of SARS-CoV-2 infection among in-person nonhealthcare workers in six states, September 2020-June 2021. Am J Ind Med. 2023, 66, 587–600. [Google Scholar] [CrossRef]
- Wong, J.; Cummings, K.J.; Gibb, K.; Rodriguez, A.; Heinzerling, A.; Vergara, X.P. Risk factors for COVID-19 among Californians working outside the home, November 2020–May 2021. Am. J. Ind. Med. 2023, 66, 233–242. [Google Scholar] [CrossRef]
- OSHA. Worker Exposure Risk to COVID-19 (OSHA 3993). 2020. Available online: https://www.osha.gov/sites/default/files/publications/OSHA3993.pdf (accessed on 3 March 2025).
- Thomason, S.; Bernhardt, A. Front-line Essential Jobs in California: A Profile of Job and Worker Characteristics. UC Berkeley Labor Center Blog 2020. 2022. Available online: https://laborcenter.berkeley.edu/front-line-essential-jobs-in-california-a-profile-of-job-and-worker-characteristics/ (accessed on 6 January 2023).
- Reitsma, M.B.; Claypool, A.L.; Vargo, J.; Shete, P.B.; McCorvie, R.; Wheeler, W.H.; Rocha, D.A.; Myers, J.F.; Murray, E.L.; Bregman, B.; et al. Racial/Ethnic Disparities In COVID-19 Exposure Risk, Testing, And Cases At The Subcounty Level in California. Health Aff. 2021, 40, 870–878. [Google Scholar] [CrossRef] [PubMed]
- Handel, M.J. The O* NET content model: Strengths and limitations. J. Labour Mark. Res. 2016, 49, 157–176. [Google Scholar] [CrossRef]
- Vergara, X.P.; Frederick, M.; Gibb, K.; Wong, J.; Harrison, R. Exposure and Illness Among Workers Filing for COVID-19-Related Workers’ Compensation-California, 2020. J. Occup. Environ. Med. 2024, 66, 810–817. [Google Scholar] [CrossRef]
- Albanesi, S.; Kim, J. The Gendered Impact of the COVID-19 Recession on the US Labor Market; Working Paper Series 2021, No. 28505; National Bureau of Economic Research: Cambridge, MA, USA, 2021. [Google Scholar] [CrossRef]
- Lee, S.Y.; Park, M.; Shin, Y. Hit Harder, Recover Slower? Unequal Employment Effects of the Covid-19 Shock; Working Paper Series 2021, No. 28354; National Bureau of Economic Research: Cambridge, MA, USA, 2021. [Google Scholar] [CrossRef]

| Talking Loudly (O*NET + Meas + Judgment) | Physical Activity (O*NET + Judg) | Cold (O*NET + Judg) | Hot (O*NET + Judg) | Index | |||||||||||
|---|---|---|---|---|---|---|---|---|---|---|---|---|---|---|---|
| Occupation Group: COC Range | N | Not Loud | Some Loud | Loud | Very Loud | Low | Medium | High | Not Cold | Cold | Not Hot | Hot | Low | Medium | High |
| Architecture and Engineering: 1300–1560 | 21 | 1 (4.8%) | 4 (19.0%) | 14 (66.7%) | 2 (9.5%) | 18 (85.7%) | 3 (14.3%) | 0 (0%) | 17 (81.0%) | 4 (19.0%) | 17 (81.0%) | 4 (19.0%) | 21 (4.4%) | 0 (0%) | 0 (0%) |
| Arts/Entertainment, Sports, and Media: 2600–2960 | 19 | 1 (5.3%) | 3 (15.8%) | 13 (68.4%) | 2 (10.5%) | 13 (68.4%) | 5 (26.3%) | 1 (5.3%) | 18 (94.7%) | 1 (5.3%) | 18 (94.7%) | 1 (5.3%) | 19 (4.0%) | 0 (0%) | 0 (0%) |
| Building, Grounds Cleaning and Maintenance: 4200–4250 | 6 | 0 (0%) | 0 (0%) | 4 (66.7%) | 2 (33.3%) | 1 (16.7%) | 2 (33.3%) | 3 (50.0%) | 4 (66.7%) | 2 (33.3%) | 4 (66.7%) | 2 (33.3%) | 5 (1.1%) | 1 (1.8%) | 1 (1.8%) |
| Business and Financial Operations: 0500–0950 | 28 | 0 (0%) | 6 (21.4%) | 21 (75.0%) | 1 (3.6%) | 28 (100%) | 0 (0%) | 0 (0%) | 28 (100%) | 0 (0%) | 28 (100%) | 0 (0%) | 28 (5.9%) | 0 (0%) | 0 (0%) |
| Community and Social Service: 2000–2060 | 8 | 0 (0%) | 1 (12.5%) | 4 (50.0%) | 3 (37.5%) | 8 (100%) | 0 (0%) | 0 (0%) | 8 (100%) | 0 (0%) | 8 (100%) | 0 (0%) | 8 (1.7%) | 0 (0%) | 0 (0%) |
| Computer and mathematical: 1000–1240 | 16 | 1 (6.3%) | 4 (25.0%) | 11 (68.8%) | 0 (0%) | 16 (100%) | 0 (0%) | 0 (0%) | 16 (100%) | 0 (0%) | 16 (100%) | 0 (0%) | 16 (3.4%) | 0 (0%) | 0 (0%) |
| Construction: 6200–6940 | 40 | 0 (0%) | 1 (2.5%) | 4 (10.0%) | 35 (87.5%) | 0 (0%) | 11 (27.5%) | 29 (72.5%) | 10 (25.0%) | 30 (75.0%) | 8 (20.0%) | 32 (80.0%) | 14 (2.9%) | 26 (45.6%) | 25 (45.6%) |
| Education, Training, Library: 2200–2550 | 11 | 0 (0%) | 10 (90.9%) | 1 (9.1%) | 0 (0%) | 10 (90.9%) | 1 (9.1%) | 0 (0%) | 11 (100%) | 0 (0%) | 11 (100%) | 0 (0%) | 11 (2.3%) | 0 (0%) | 0 (0%) |
| Farming: 6005–6130 | 9 | 0 (0%) | 2 (22.2%) | 1 (11.1%) | 6 (66.7%) | 2 (22.2%) | 2 (22.2%) | 5 (55.6%) | 1 (11.1%) | 8 (88.9%) | 3 (33.3%) | 6 (66.7%) | 4 (0.8%) | 4 (7.0%) | 4 (7.0%) |
| Food Preparation and Serving Related: 4000–4160 | 13 | 1 (7.7%) | 5 (38.5%) | 5 (38.5%) | 2 (15.4%) | 2 (15.4%) | 11 (84.6%) | 0 (0%) | 9 (69.2%) | 4 (30.8%) | 8 (61.5%) | 5 (38.5%) | 13 (2.7%) | 0 (0%) | 0 (0%) |
| Healthcare Pract. and Techs: 3000–3540 | 33 | 1 (3.0%) | 2 (6.1%) | 24 (72.7%) | 6 (18.2%) | 25 (75.8%) | 7 (21.2%) | 1 (3.0%) | 33 (100%) | 0 (0%) | 33 (100%) | 0 (0%) | 32 (6.7%) | 1 (1.8%) | 1 (1.8%) |
| Healthcare Support: 3600–3655 | 11 | 0 (0%) | 4 (36.4%) | 7 (63.6%) | 0 (0%) | 8 (72.7%) | 3 (27.3%) | 0 (0%) | 11 (100%) | 0 (0%) | 11 (100%) | 0 (0%) | 11 (2.3%) | 0 (0%) | 0 (0%) |
| Installation, Maintenance, and Repair: 7000–7630 | 37 | 0 (0%) | 5 (13.5%) | 8 (21.6%) | 24 (64.9%) | 3 (8.1%) | 21 (56.8%) | 13 (35.1%) | 25 (67.6%) | 12 (32.4%) | 24 (64.9%) | 13 (35.1%) | 26 (5.5%) | 11 (19.3%) | 11 (19.3%) |
| Legal: 2100–2160 | 5 | 5 (100%) | 0 (0%) | 0 (0%) | 0 (0%) | 5 (100%) | 0 (0%) | 0 (0%) | 5 (100%) | 0 (0%) | 5 (100%) | 0 (0%) | 5 (1.1%) | 0 (0%) | 0 (0%) |
| Life, Physical, and Social Science: 1600–1965 | 23 | 1 (4.3%) | 5 (21.7%) | 15 (65.2%) | 2 (8.7%) | 23 (100%) | 0 (0%) | 0 (0%) | 20 (87.0%) | 3 (13.0%) | 20 (87.0%) | 3 (13.0%) | 23 (4.8%) | 0 (0%) | 0 (0%) |
| Management: 0010–0430 | 30 | 4 (13.3%) | 4 (13.3%) | 20 (66.7%) | 2 (6.7%) | 26 (86.7%) | 4 (13.3%) | 0 (0%) | 26 (86.7%) | 4 (13.3%) | 25 (83.3%) | 5 (16.7%) | 30 (6.3%) | 0 (0%) | 0 (0%) |
| Material Moving: 9500–9750 | 14 | 0 (0%) | 0 (0%) | 2 (14.3%) | 12 (85.7%) | 2 (14.3%) | 9 (64.3%) | 3 (21.4%) | 3 (21.4%) | 11 (78.6%) | 2 (14.3%) | 12 (85.7%) | 11 (2.3%) | 3 (5.3%) | 3 (5.3%) |
| Office and Administrative Support: 5000–5940 | 52 | 1 (1.9%) | 45 (86.5%) | 3 (5.8%) | 3 (5.8%) | 45 (86.5%) | 5 (9.6%) | 2 (3.8%) | 49 (94.2%) | 3 (5.8%) | 49 (94.2%) | 3 (5.8%) | 52 (10.9%) | 0 (0%) | 0 (0%) |
| Personal Care and Service: 4300–4650 | 20 | 0 (0%) | 3 (15.0%) | 15 (75.0%) | 2 (10.0%) | 11 (55.0%) | 7 (35.0%) | 2 (10.0%) | 19 (95.0%) | 1 (5.0%) | 19 (95.0%) | 1 (5.0%) | 20 (4.2%) | 0 (0%) | 0 (0%) |
| Production: 7700–8965 | 81 | 1 (1.2%) | 6 (7.4%) | 19 (23.5%) | 55 (67.9%) | 32 (39.5%) | 39 (48.1%) | 10 (12.3%) | 78 (96.3%) | 3 (3.7%) | 55 (67.9%) | 26 (32.1%) | 73 (15.4%) | 7 (12.3%) | 7 (12.3%) |
| Protective Service: 3700–3955 | 18 | 2 (11.1%) | 4 (22.2%) | 8 (44.4%) | 4 (22.2%) | 4 (22.2%) | 12 (66.7%) | 2 (11.1%) | 11 (61.1%) | 7 (38.9%) | 10 (55.6%) | 8 (44.4%) | 17 (3.6%) | 1 (1.8%) | 1 (1.8%) |
| Sales and Related: 4700–4965 | 18 | 0 (0%) | 2 (11.1%) | 16 (88.9%) | 0 (0%) | 17 (94.4%) | 1 (5.6%) | 0 (0%) | 17 (94.4%) | 1 (5.6%) | 17 (94.4%) | 1 (5.6%) | 18 (3.8%) | 0 (0%) | 0 (0%) |
| Transportation: 9000–9420 | 22 | 0 (0%) | 1 (4.5%) | 8 (36.4%) | 13 (59.1%) | 12 (54.5%) | 7 (31.8%) | 3 (13.6%) | 17 (77.3%) | 5 (22.7%) | 17 (77.3%) | 5 (22.7%) | 18 (3.8%) | 3 (5.3%) | 3 (5.3%) |
| Talking Loudly (O*NET + Meas + Judgment) | Physical Activity (O*NET + Judg) | Cold (O*NET +Judg) | Hot (O*NET + Judg) | |||||||||||||
|---|---|---|---|---|---|---|---|---|---|---|---|---|---|---|---|---|
| Not Loud | Loud | Some Loud | Very Loud | Total | Low | Medium | High | Total | Not Cold | Cold | Total | Hot | Not Hot | Total | ||
| Building, Grounds Cleaning and Maintenance: 4200–4250 (N = 665,161) | All | 0 | 67.6 | 0 | 32.4 | 100 | 4.4 | 4.3 | 91.3 | 100 | 67.6 | 32.4 | 100 | 32.4 | 67.6 | 100 |
| AIAN | 0 | 0 | 0 | 0.3 | 0.4 | 0 | 0 | 0.4 | 0.4 | 0 | 0.3 | 0.4 | 0.3 | 0 | 0.4 | |
| Asian | 0 | 3.4 | 0 | 0.4 | 3.7 | 0.1 | 0 | 3.7 | 3.7 | 3.4 | 0.4 | 3.7 | 0.4 | 3.4 | 3.7 | |
| Black | 0 | 2.2 | 0 | 0.4 | 2.5 | 0.3 | 0.2 | 2.1 | 2.5 | 2.2 | 0.4 | 2.5 | 0.4 | 2.2 | 2.5 | |
| HPI | 0 | 0.4 | 0 | 0 | 0.4 | 0 | 0 | 0.4 | 0.4 | 0.4 | 0 | 0.4 | 0 | 0.4 | 0.4 | |
| Latino | 0 | 49.3 | 0 | 25.9 | 75.2 | 2.4 | 2.7 | 70.1 | 75.2 | 49.3 | 25.9 | 75.2 | 25.9 | 49.3 | 75.2 | |
| Multirace | 0 | 0.6 | 0 | 0.1 | 0.7 | 0 | 0 | 0.7 | 0.7 | 0.6 | 0.1 | 0.7 | 0.1 | 0.6 | 0.7 | |
| White | 0 | 11.7 | 0 | 5.3 | 17.1 | 1.7 | 1.5 | 13.9 | 17.1 | 11.7 | 5.3 | 17.1 | 5.3 | 11.7 | 17.1 | |
| Computer and Mathematical: 1000–1240 (N = 803,604) | All | 10.6 | 24.9 | 64.5 | 0 | 100 | 100 | 0 | 0 | 100 | 100 | 0 | 100 | 0 | 100 | 100 |
| AIAN | 0 | 0 | 0.6 | 0 | 0.6 | 0.6 | 0 | 0 | 0.6 | 0.6 | 0 | 0.6 | 0 | 0.6 | 0.6 | |
| Asian | 2.9 | 7.9 | 33.9 | 0 | 44.7 | 44.7 | 0 | 0 | 44.7 | 44.7 | 0 | 44.7 | 0 | 44.7 | 44.7 | |
| Black | 1.2 | 1.4 | 1.5 | 0 | 4.1 | 4.1 | 0 | 0 | 4.1 | 4.1 | 0 | 4.1 | 0 | 4.1 | 4.1 | |
| HPI | 0.2 | 0.3 | 0.1 | 0 | 0.6 | 0.6 | 0 | 0 | 0.6 | 0.6 | 0 | 0.6 | 0 | 0.6 | 0.6 | |
| Latino | 1.8 | 4.2 | 4.4 | 0 | 10.5 | 10.5 | 0 | 0 | 10.5 | 10.5 | 0 | 10.5 | 0 | 10.5 | 10.5 | |
| Multirace | 0.2 | 0.4 | 1.4 | 0 | 2 | 2 | 0 | 0 | 2 | 2 | 0 | 2 | 0 | 2 | 2 | |
| White | 4.4 | 10.7 | 22.5 | 0 | 37.6 | 37.6 | 0 | 0 | 37.6 | 37.6 | 0 | 37.6 | 0 | 37.6 | 37.6 | |
| Construction: 6200–6940 (N = 950,742) | All | 0 | 9.6 | 1.3 | 89 | 100 | 0 | 28 | 72 | 100 | 30.6 | 69.4 | 100 | 84.5 | 15.5 | 100 |
| AIAN | 0 | 0 | 0 | 0.3 | 0.3 | 0 | 0.1 | 0.2 | 0.3 | 0.2 | 0.1 | 0.3 | 0.1 | 0.2 | 0.3 | |
| Asian | 0 | 0.5 | 0.1 | 2.2 | 2.8 | 0 | 1.4 | 1.4 | 2.8 | 1.1 | 1.7 | 2.8 | 2.5 | 0.3 | 2.8 | |
| Black | 0 | 0.5 | 0 | 2.6 | 3.1 | 0 | 1 | 2.1 | 3.1 | 0.7 | 2.4 | 3.1 | 2.8 | 0.3 | 3.1 | |
| HPI | 0 | 0.1 | 0 | 0.4 | 0.5 | 0 | 0.3 | 0.2 | 0.5 | 0.2 | 0.3 | 0.5 | 0.5 | 0 | 0.5 | |
| Latino | 0 | 4.9 | 0.7 | 58.8 | 64.4 | 0 | 14.1 | 50.3 | 64.4 | 18.9 | 45.5 | 64.4 | 53.1 | 11.2 | 64.4 | |
| Multirace | 0 | 0 | 0.2 | 1.1 | 1.3 | 0 | 0.7 | 0.7 | 1.3 | 0.4 | 1 | 1.3 | 1.3 | 0 | 1.3 | |
| White | 0 | 3.7 | 0.4 | 23.6 | 27.6 | 0 | 10.5 | 17.1 | 27.6 | 9.2 | 18.4 | 27.6 | 24.1 | 3.5 | 27.6 | |
| Farming: 6005–6130 (N = 243,348) | All | 0 | 1.1 | 3.5 | 95.4 | 100 | 6.8 | 3.5 | 89.7 | 100 | 5.7 | 94.3 | 100 | 91.1 | 8.9 | 100 |
| AIAN | 0 | 0 | 0 | 0.1 | 0.1 | 0 | 0 | 0.1 | 0.1 | 0 | 0.1 | 0.1 | 0.1 | 0 | 0.1 | |
| Asian | 0 | 0 | 0.1 | 3.2 | 3.3 | 0 | 0.1 | 3.2 | 3.3 | 0 | 3.3 | 3.3 | 3.3 | 0 | 3.3 | |
| Black | 0 | 0 | 0 | 0.3 | 0.3 | 0.3 | 0 | 0 | 0.3 | 0.3 | 0 | 0.3 | 0 | 0.3 | 0.3 | |
| Latino | 0 | 0.5 | 2.7 | 83.8 | 87 | 5.9 | 2.7 | 78.4 | 87 | 5.4 | 81.6 | 87 | 81.1 | 5.9 | 87 | |
| Multirace | 0 | 0 | 0.3 | 0 | 0.3 | 0 | 0.3 | 0 | 0.3 | 0 | 0.3 | 0.3 | 0.3 | 0 | 0.3 | |
| White | 0 | 0.6 | 0.4 | 7.9 | 8.9 | 0.6 | 0.4 | 7.9 | 8.9 | 0 | 8.9 | 8.9 | 6.2 | 2.7 | 8.9 | |
| Healthcare Pract. and Techs: 3000–3540 (N = 946,822) | All | 1.7 | 40.6 | 8.4 | 49.2 | 100 | 49 | 48.2 | 2.8 | 100 | 100 | 0 | 100 | 0 | 100 | 100 |
| Asian | 0.5 | 11.5 | 1.2 | 15.2 | 28.4 | 14.6 | 13.8 | 0.1 | 28.4 | 28.4 | 0 | 28.4 | 0 | 28.4 | 28.4 | |
| Black | 0.2 | 2.7 | 0.6 | 3.7 | 7.3 | 2.9 | 4.1 | 0.3 | 7.3 | 7.3 | 0 | 7.3 | 0 | 7.3 | 7.3 | |
| HPI | 0 | 0.4 | 0 | 0.4 | 0.8 | 0.2 | 0.6 | 0 | 0.8 | 0.8 | 0 | 0.8 | 0 | 0.8 | 0.8 | |
| Latino | 0.3 | 9 | 3.6 | 6 | 18.8 | 9.4 | 8.8 | 0.5 | 18.8 | 18.8 | 0 | 18.8 | 0 | 18.8 | 18.8 | |
| Multirace | 0 | 1.3 | 0.3 | 1.1 | 2.7 | 1.6 | 1.1 | 0 | 2.7 | 2.7 | 0 | 2.7 | 0 | 2.7 | 2.7 | |
| White | 0.7 | 15.7 | 2.8 | 22.8 | 42 | 20.2 | 19.9 | 1.9 | 42 | 42 | 0 | 42 | 0 | 42 | 42 | |
| Healthcare Support: 3600–3655 (N = 314,904) | All | 0 | 57.3 | 42.7 | 0 | 100 | 52.3 | 47.7 | 0 | 100 | 100 | 0 | 100 | 0 | 100 | 100 |
| AIAN | 0 | 0.9 | 0 | 0 | 0.9 | 0.5 | 0.4 | 0 | 0.9 | 0.9 | 0 | 0.9 | 0 | 0.9 | 0.9 | |
| Asian | 0 | 10.3 | 4.7 | 0 | 15 | 7.1 | 7.9 | 0 | 15 | 15 | 0 | 15 | 0 | 15 | 15 | |
| Black | 0 | 7.3 | 1.3 | 0 | 8.6 | 2 | 6.7 | 0 | 8.6 | 8.6 | 0 | 8.6 | 0 | 8.6 | 8.6 | |
| HPI | 0 | 1 | 0.8 | 0 | 1.8 | 0.8 | 1 | 0 | 1.8 | 1.8 | 0 | 1.8 | 0 | 1.8 | 1.8 | |
| Latino | 0 | 22.6 | 25.8 | 0 | 48.4 | 29.6 | 18.8 | 0 | 48.4 | 48.4 | 0 | 48.4 | 0 | 48.4 | 48.4 | |
| Multirace | 0 | 0.6 | 0.5 | 0 | 1.1 | 0.5 | 0.6 | 0 | 1.1 | 1.1 | 0 | 1.1 | 0 | 1.1 | 1.1 | |
| White | 0 | 14.5 | 9.6 | 0 | 24.2 | 11.9 | 12.3 | 0 | 24.2 | 24.2 | 0 | 24.2 | 0 | 24.2 | 24.2 | |
| Installation, Maintenance, and Repair: 7000–7630 (N = 467,393) | All | 0 | 8.25 | 8.51 | 83.2 | 100 | 6.94 | 56.5 | 36.6 | 100 | 79.8 | 20.2 | 100 | 1.43 | 16.4 | 17.9 |
| AIAN | 0 | 0 | 0.09 | 0.24 | 0.33 | 0 | 0.09 | 0.24 | 0.33 | 0.33 | 0 | 0.33 | 69.4 | 30.6 | 100 | |
| Asian | 0 | 0.92 | 1.34 | 8.72 | 11 | 1.55 | 7.1 | 2.32 | 11 | 9.5 | 1.48 | 11 | 0.13 | 1.61 | 1.74 | |
| Black | 0 | 0.09 | 0.72 | 2.86 | 3.67 | 0.22 | 1.75 | 1.7 | 3.67 | 3.24 | 0.43 | 3.67 | 2.87 | 3.36 | 6.23 | |
| HPI | 0 | 0.21 | 0.27 | 0.67 | 1.16 | 0.21 | 0.95 | 0 | 1.16 | 1.04 | 0.12 | 1.16 | 1.24 | 5.73 | 6.97 | |
| Latino | 0 | 2.93 | 4.23 | 42.6 | 49.8 | 2.28 | 28.6 | 18.9 | 49.8 | 40.2 | 9.61 | 49.8 | 0 | 0.99 | 0.99 | |
| Multirace | 0 | 0.28 | 0.09 | 0.98 | 1.35 | 0.28 | 0.61 | 0.45 | 1.35 | 1.26 | 0.09 | 1.35 | 15 | 49.9 | 64.8 | |
| White | 0 | 3.81 | 1.77 | 27.1 | 32.7 | 2.39 | 17.4 | 13 | 32.7 | 24.3 | 8.45 | 32.7 | 0 | 1.39 | 1.39 | |
| Material Moving: 9500–9750 (N = 479,414) | All | 0 | 20.9 | 0 | 79.1 | 100 | 11 | 76 | 13 | 100 | 20.6 | 79.4 | 100 | 79.4 | 20.6 | 100 |
| AIAN | 0 | 0.2 | 0 | 1.6 | 1.7 | 0.3 | 1.2 | 0.3 | 1.7 | 0.1 | 1.6 | 1.7 | 1.6 | 0.1 | 1.7 | |
| Asian | 0 | 2.6 | 0 | 3.6 | 6.2 | 0.4 | 5.4 | 0.5 | 6.2 | 2.9 | 3.4 | 6.2 | 3.4 | 2.9 | 6.2 | |
| Black | 0 | 1.5 | 0 | 5.4 | 7 | 0.8 | 6.1 | 0.1 | 7 | 1.2 | 5.7 | 7 | 5.7 | 1.2 | 7 | |
| HPI | 0 | 0 | 0 | 1 | 1 | 0.3 | 0.7 | 0 | 1 | 0 | 1 | 1 | 1 | 0 | 1 | |
| Latino | 0 | 14.6 | 0 | 50.3 | 64.8 | 7.9 | 47.2 | 9.8 | 64.8 | 15 | 49.9 | 64.8 | 49.9 | 15 | 64.8 | |
| Multirace | 0 | 0 | 0 | 1.4 | 1.4 | 0 | 1.4 | 0 | 1.4 | 0 | 1.4 | 1.4 | 1.4 | 0 | 1.4 | |
| White | 0 | 2 | 0 | 15.8 | 17.9 | 1.5 | 14 | 2.4 | 17.9 | 1.4 | 16.4 | 17.9 | 16.4 | 1.4 | 17.9 | |
| Production: 7700–8965 (N = 745,606) | All | 0.2 | 31.7 | 7.4 | 60.7 | 100 | 46.5 | 26.4 | 27.2 | 100 | 84.4 | 15.6 | 100 | 30.3 | 69.7 | 100 |
| AIAN | 0 | 0.2 | 0 | 0.3 | 0.5 | 0.1 | 0 | 0.4 | 0.5 | 0.3 | 0.2 | 0.5 | 0.2 | 0.3 | 0.5 | |
| Asian | 0 | 3.3 | 1 | 8.5 | 12.8 | 8.1 | 2.7 | 2.1 | 12.8 | 11.4 | 1.4 | 12.8 | 2.8 | 10 | 12.8 | |
| Black | 0 | 0.7 | 0 | 2.1 | 2.9 | 0.7 | 0.6 | 1.5 | 2.9 | 2.2 | 0.6 | 2.9 | 1 | 1.8 | 2.9 | |
| HPI | 0 | 0.4 | 0 | 0.2 | 0.6 | 0.3 | 0 | 0.3 | 0.6 | 0.3 | 0.3 | 0.6 | 0.4 | 0.2 | 0.6 | |
| Latino | 0 | 21.9 | 5.2 | 31.8 | 58.9 | 24.7 | 17.3 | 16.8 | 58.9 | 48.5 | 10.4 | 58.9 | 19.4 | 39.5 | 58.9 | |
| Multirace | 0 | 0 | 0.1 | 0.6 | 0.7 | 0.5 | 0.2 | 0 | 0.7 | 0.7 | 0 | 0.7 | 0 | 0.7 | 0.7 | |
| White | 0.1 | 5.2 | 1.1 | 17.3 | 23.7 | 12.2 | 5.5 | 6 | 23.7 | 21.1 | 2.6 | 23.7 | 6.4 | 17.3 | 23.7 | |
Disclaimer/Publisher’s Note: The statements, opinions and data contained in all publications are solely those of the individual author(s) and contributor(s) and not of MDPI and/or the editor(s). MDPI and/or the editor(s) disclaim responsibility for any injury to people or property resulting from any ideas, methods, instructions or products referred to in the content. |
© 2025 by the authors. Licensee MDPI, Basel, Switzerland. This article is an open access article distributed under the terms and conditions of the Creative Commons Attribution (CC BY) license (https://creativecommons.org/licenses/by/4.0/).
Share and Cite
Vergara, X.P.; Gibb, K.; Bui, D.P.; Gebreegziabher, E.; Ullman, E.; Peerless, K. Extending a COVID-19 Job Exposure Matrix: The SARS-CoV-2 or COVID-19 Job Exposure Matrix Module (SCoVJEM Module) for Population-Based Studies. Int. J. Environ. Res. Public Health 2025, 22, 448. https://doi.org/10.3390/ijerph22030448
Vergara XP, Gibb K, Bui DP, Gebreegziabher E, Ullman E, Peerless K. Extending a COVID-19 Job Exposure Matrix: The SARS-CoV-2 or COVID-19 Job Exposure Matrix Module (SCoVJEM Module) for Population-Based Studies. International Journal of Environmental Research and Public Health. 2025; 22(3):448. https://doi.org/10.3390/ijerph22030448
Chicago/Turabian StyleVergara, Ximena P., Kathryn Gibb, David P. Bui, Elisabeth Gebreegziabher, Elon Ullman, and Kyle Peerless. 2025. "Extending a COVID-19 Job Exposure Matrix: The SARS-CoV-2 or COVID-19 Job Exposure Matrix Module (SCoVJEM Module) for Population-Based Studies" International Journal of Environmental Research and Public Health 22, no. 3: 448. https://doi.org/10.3390/ijerph22030448
APA StyleVergara, X. P., Gibb, K., Bui, D. P., Gebreegziabher, E., Ullman, E., & Peerless, K. (2025). Extending a COVID-19 Job Exposure Matrix: The SARS-CoV-2 or COVID-19 Job Exposure Matrix Module (SCoVJEM Module) for Population-Based Studies. International Journal of Environmental Research and Public Health, 22(3), 448. https://doi.org/10.3390/ijerph22030448