Article

Healthy Aging in Colombia 2018 and Its Variation in Relation to Social Conditions

by
Yesika Natali Fernández-Ortiz
Pontificia Universidad Javeriana, Institute of Public Health, Bogotá 110231, Colombia
Int. J. Environ. Res. Public Health 2024, 21(9), 1244; https://doi.org/10.3390/ijerph21091244
Submission received: 27 July 2024 / Revised: 4 September 2024 / Accepted: 9 September 2024 / Published: 20 September 2024

Abstract

:
The population aging in the region is occurring under scenarios of inequality, raising concerns about how the increase in life expectancy is experienced and what factors affect the quality of life of older adults. This research quantified the differentials of healthy aging in Colombia in 2018 and its association with social indicators through a cross-sectional, descriptive, and correlational observational study. Healthy aging was quantified using the Disability-Free Life Expectancy (DFLE) indicator and later correlated with social indicators and subjected to a Multiple Factor Analysis (MFA). The results showed a healthy life expectancy of 71.5 years for women and 66.9 years for men, with a disability expectancy of 8.3 and 6.4 years, respectively. Negative associations emerged with health problems, disability, lack of medical care, illiteracy, school absenteeism, and poverty, while higher education levels and retirement showed positive associations. The factor analysis by area of residence highlighted urban areas as conducive to healthy aging. In conclusion, the accelerated aging of the Colombian population faces health disparities that policies must address by improving education, economic security, and health services, especially for women and rural areas.

1. Introduction

The demographic transition, as demographer Frank Notestein describes, refers to the shift from high to low levels of fertility and mortality. This process has resulted in a notable increase in the aging population, with a proportional rise in the number of individuals older than 60 years old compared to those under 15 years of age. This trend, driven by medical advancements that have extended Life Expectancy (LE) in both developed and developing countries, is expected to become a global reality by 2050 [1].
However, some experts warn that gains in life expectancy are at risk due to the increasing prevalence of disabling chronic diseases and emerging pandemics [2]. This is particularly concerning for the elderly population, where these conditions lead to higher levels of disability, dependence, and a decline in quality of life, with significant impacts on both individuals and their familial and social environments [1].
In this context, it is essential to monitor not only life expectancy but also the quality of those additional years by using indicators such as Disability-Free Life Expectancy (DFLE) [3] (Gispert et al., 2007). This indicator allows assessment in order to check if the population is experiencing an expansion of morbidity—as suggested by Gruenberg [4], additional years of life show increased illness and disability—or reduced morbidity, as Fries [5] proposes, where additional years are predominantly healthy.
For a time, researchers struggled to calculate DFLE in Latin America due to the scarcity of longitudinal studies on disability with representative statistical samples [6] (However, in 2001, the UN Disability Statistics Group recommended that censuses and surveys include standardized questions on disability, facilitating the analysis of this condition, which enabled the calculation of indicators like DFLE for international comparisons [6]).
This advancement allowed for the exploration of the relationship between DFLE and social variables, demonstrating that factors such as education, income, and geographic location can influence the quality of life in old age. Recent research by Brønnum-Hansen et al. [7] and Van Oyen et al. [8] has revealed the impact of educational levels on DFLE, while studies by Wagg et al. [9], Wu et al. [10], and Brønnum-Hansen et al. [11] have highlighted the influence of higher income. Additionally, other works have delved into geographic variations and their relationship with gender, education, unemployment rates, poverty, and access to healthcare services [12,13,14,15,16,17,18,19,20]. These studies underscore the importance of social factors in healthy life expectancy and justify the need for differentiated approaches based on social and economic contexts.
In Latin America, and particularly in Colombia, population aging presents specific challenges due to the profound social and economic inequalities that characterize the region. According to data from the 2018 National Population and Housing Census, the percentage of the population aged 65 and older in Colombia increased from 6.3% in 2005 to 9.1% in 2018. During this period, the Aging Index rose from 16.7 to 58.7 older adults per 100 individuals under 15 years of age, reflecting the rapid aging of the population [21].
This process has been accompanied by an increase in the prevalence of disability, which rose from 33% in 2005 to 41% in 2018 [22]. Additionally, the Economic Commission for Latin America and the Caribbean (ECLAC) reported that Disability Expectancy (DE) in Colombia increased from 5.2 to 5.9 years between 2000 and 2015, which indicates that the country experienced an expansion of morbidity [23]. Despite this information, no one has updated the latter indicator since 2018, so we do not know whether the years lived with disability or DE have increased in recent years or how their distribution and variation within the country relate to socioeconomic and geographic variables [24]. Therefore, this study hypothesizes that disability among the elderly population reduces healthy life expectancy and that it is possible to identify significant health disparities when comparing these outcomes with socioeconomic characteristics.
To test this hypothesis, the study aimed to quantify the differentials in healthy aging within Colombia through DFLE and explore its possible association with social indicators for 2018. These measurements offered insights into the factors influencing the attainment of healthy life years by sex and area of residence.
The relevance of this research lies in an estimate of the healthy life years that the Colombian population achieved in 2018, confirming the expansion of morbidity through DE and demonstrating the existence of social inequalities that affect development opportunities and healthy aging. These findings are essential for policymakers to strengthen responses to the challenges of aging, reduce disparities, and promote healthy aging in Colombia within the context of growing demographic and social challenges.

2. Materials and Methods

2.1. Design and Data Source

This observational, cross-sectional, and correlational study utilized data from the 2018 National Population and Housing Census (NPHC) and vital statistics, both obtained from the National Administrative Department of Statistics [21] of Colombia.
The NPHC questionnaire collected detailed data on the demographic, social, and economic characteristics of the population [25]; this gave information regarding the population over 60 years old by department, age, sex, area of residence (urban/rural), health outcomes (questions 42–45), education (questions 50 and 51), and socioeconomic conditions (question 52).
The REDATAM (Recovery of Data for Small Areas by Microcomputer) platform of the NPHC 2018 provided data on the Multidimensional Poverty Index (MPI); in the same way, technical publications by sex, area, and department [26,27] gave information about life tables for Colombia 2018. Additionally, DANE [28] contributed vital statistics on death records.
It is important to note that the disaggregation by areas of residence was performed to differentiate urban areas (municipal capitals), which have better access to services and socioeconomic conditions, from rural areas (small towns and dispersed rural areas), which face greater barriers in education, health, and economic development.
Regarding the analysis of departments, it could follow the geographic region patterns established by the Agustín Codazzi Geographic Institute (IGAC), such as the Andean, Caribbean, Insular, Pacific, Orinoquía, and Amazon regions [29]. However, this study examines the results according to the classification of areas of residence. This approach allows for a more accurate understanding of how living conditions and available services impact DFLE in Colombia, differentiating between urban and rural areas.

2.2. Data Processing

The study transformed the variables of interest into indicators according to sex and area (urban and rural). Table 1 below details the operationalization of the variables for their use as indicators.
This research calculated DFLE using the method that Sullivan proposed in the 1970s, which integrates life tables with disability prevalence rates to estimate the years lived with and without disability, considering the latter as healthy life years or DFLE [30,31,32]. This method combines information on mortality and morbidity to provide a comprehensive view of the population’s health.
D F L E x = i = x 90 ( ( 1 t i ) L i ) l x
The calculation of DFLE used life tables published by DANE from the CNPV 2018. It also calculated the prevalence of disability based on affirmative responses to Census question No. 44 (In your daily life, do you have difficulties performing activities such as: hearing, speaking, seeing, moving your body, walking, grasping objects with your hands, understanding, learning or remembering, eating or dressing by yourself, and interacting with others?). The analysis then disaggregated this information by age group, sex, and area and then divided it by the population.
To further explore healthy life expectancy and identify the number of years a population with disabilities or poor health is likely to live, the calculation of DE involved subtracting DFLE from LE (DFLE − LE).
Pearson bivariate correlations and Multiple Factor Analysis (MFA) identified associations between DFLE and social indicators. Pearson correlations assessed the strength and direction of linear relationships between variables, while MFA allowed for the simultaneous examination of multiple variables, identifying patterns and relationships within the data [33].
Before performing the MFA, statistical methods tested the assumptions of linearity and normality of the variables. Visual inspection of scatter plots confirmed linearity, and the Shapiro–Wilk test assessed normality. The results indicated that the variables met the necessary criteria for the application of MFA, ensuring the validity of the analysis.
Table 2 provides a summary of the variables along with the Shapiro–Wilk test’s W statistic and p-value. Of the total variables (68 in total), 96% had a W statistic value close to 1, and 65% had a p-value greater than 0.05, indicating that the variables follow a normal distribution, which allows for the acceptance of the null hypothesis (H0). The study included all variables, as MFA relies on the prior normalization of data through Principal Component Analysis (PCA), enabling the handling and combining of different sets of variables for joint analysis [34].
The statistical analysis and result visualization used R version 4.1.2, along with the FactoMineR and Factoextra packages.
For the MFA, the analysis grouped the indicators into seven categories by area and sex: G1 (Education), G2 (Socioeconomic), G3 (Perceived Morbidity), G4 (Mortality), G5 (Health Care), G6 (DFLE at Birth), and G7 (DFLE at Age 60). The individuals in the analysis were the departments; the study assigned a label to each indicator in order to differentiate them by area and sex. The letter “C” represents urban areas, and “R” represents rural areas (Table 3). To differentiate by sex, the letter ‘H’ represents men and ‘M’ represents women.

3. Results

According to the 2018 Census, 75.67% (4,704,419) of the elderly population resided in urban areas, while 24.33% (1,512,429) lived in rural areas. Women were more concentrated in urban areas (43.16%), highlighting the feminization of aging in cities, whereas men had a slightly higher representation in rural areas (12.86%) [26]. These data emphasize the unequal distribution of the elderly population by area of residence and gender, underscoring the need to analyze results by area of residence to provide insights that guide the development of differentiated policies tailored to the specific needs of each group.

3.1. Disability-Free Life Expectancy and Disability Expectancy at Birth

The 2018 Census also revealed that life expectancy at birth in Colombia was higher for women (79.8 years) compared to men (73.3 years); this distribution remained consistent across all geographic areas. Additionally, LE was higher in urban areas compared to rural areas. For men, DFLE dropped to 66.9 years, while for women, it reached 71.5 years, resulting in a DE of 8.3 years for women and 6.4 years for men. Rural areas showed a lower DFLE compared to urban areas, particularly among women (Table 4).
Departments with the highest and lowest DFLE differed by 16.4 years for men and 17.1 years for women. The geographic analysis revealed that departments with better socioeconomic conditions, which are generally urban and economic centers, have higher LE and DFLE. In contrast, more rural departments and those further from economic centers had lower values; this highlights the importance of addressing regional inequalities in health and other social services.
Pearson bivariate correlations showed significant associations between DFLE and various social indicators. The MFA identified patterns and relationships within the data and showed that higher education levels, better socioeconomic conditions, and improved healthcare services positively influence higher DFLE. Conversely, higher morbidity and mortality negatively affected DFLE. These findings emphasize the importance of targeted policies to improve education, economic security, and health services, especially in rural areas and among women (Table 5).

3.2. Life Expectancy and Disability Expectancy at Age 60

At age 60, men had a life expectancy of 21.1 years, while women had 24.1 years. DFLE decreased to 16.4 years for men and 18.0 years for women. In rural areas, these values declined further due to higher rates of disability and mortality.
Regarding DE, men experienced 4.6 fewer healthy years compared to women, who had 6.1 years, indicating higher levels of disability. This trend affected rural areas more strongly (Table 6).

3.3. Bivariate Correlation of DFLE at Birth with Social Variables

The bivariate correlation analysis revealed interesting patterns. DFLE negatively correlated with perceived morbidity, disability (especially in women), and the lack of health service provision.
In terms of education, DFLE showed a negative relationship with illiteracy, school absenteeism, and the absence of any level of schooling, particularly among women. Conversely, there was a positive association between DFLE and higher educational attainment.
Socioeconomic conditions indicated a negative correlation between DFLE and the MPI, while living off retirement income showed a positive relationship (Table 7).

3.4. Multiple Factor Analysis (MFA)

The MFA helped identify groups of indicators that differently affect healthy aging according to the area of residence.

3.5. Multiple Associations in Urban Areas

In urban areas, the groups of DFLE at birth, DFLE at age 60, and education showed a high correlation, which partly explains why these areas have a better life expectancy. Additionally, the education group strongly correlated with socioeconomic indicators (0.74), while perceived morbidity related to DFLE at birth (0.48) and DFLE at age 60 (0.53), showing a strong representation in the common factor. Mortality and healthcare showed lower correlations and had a smaller representation (Table 8).

3.6. Distribution and Contribution of Indicators in Urban Area

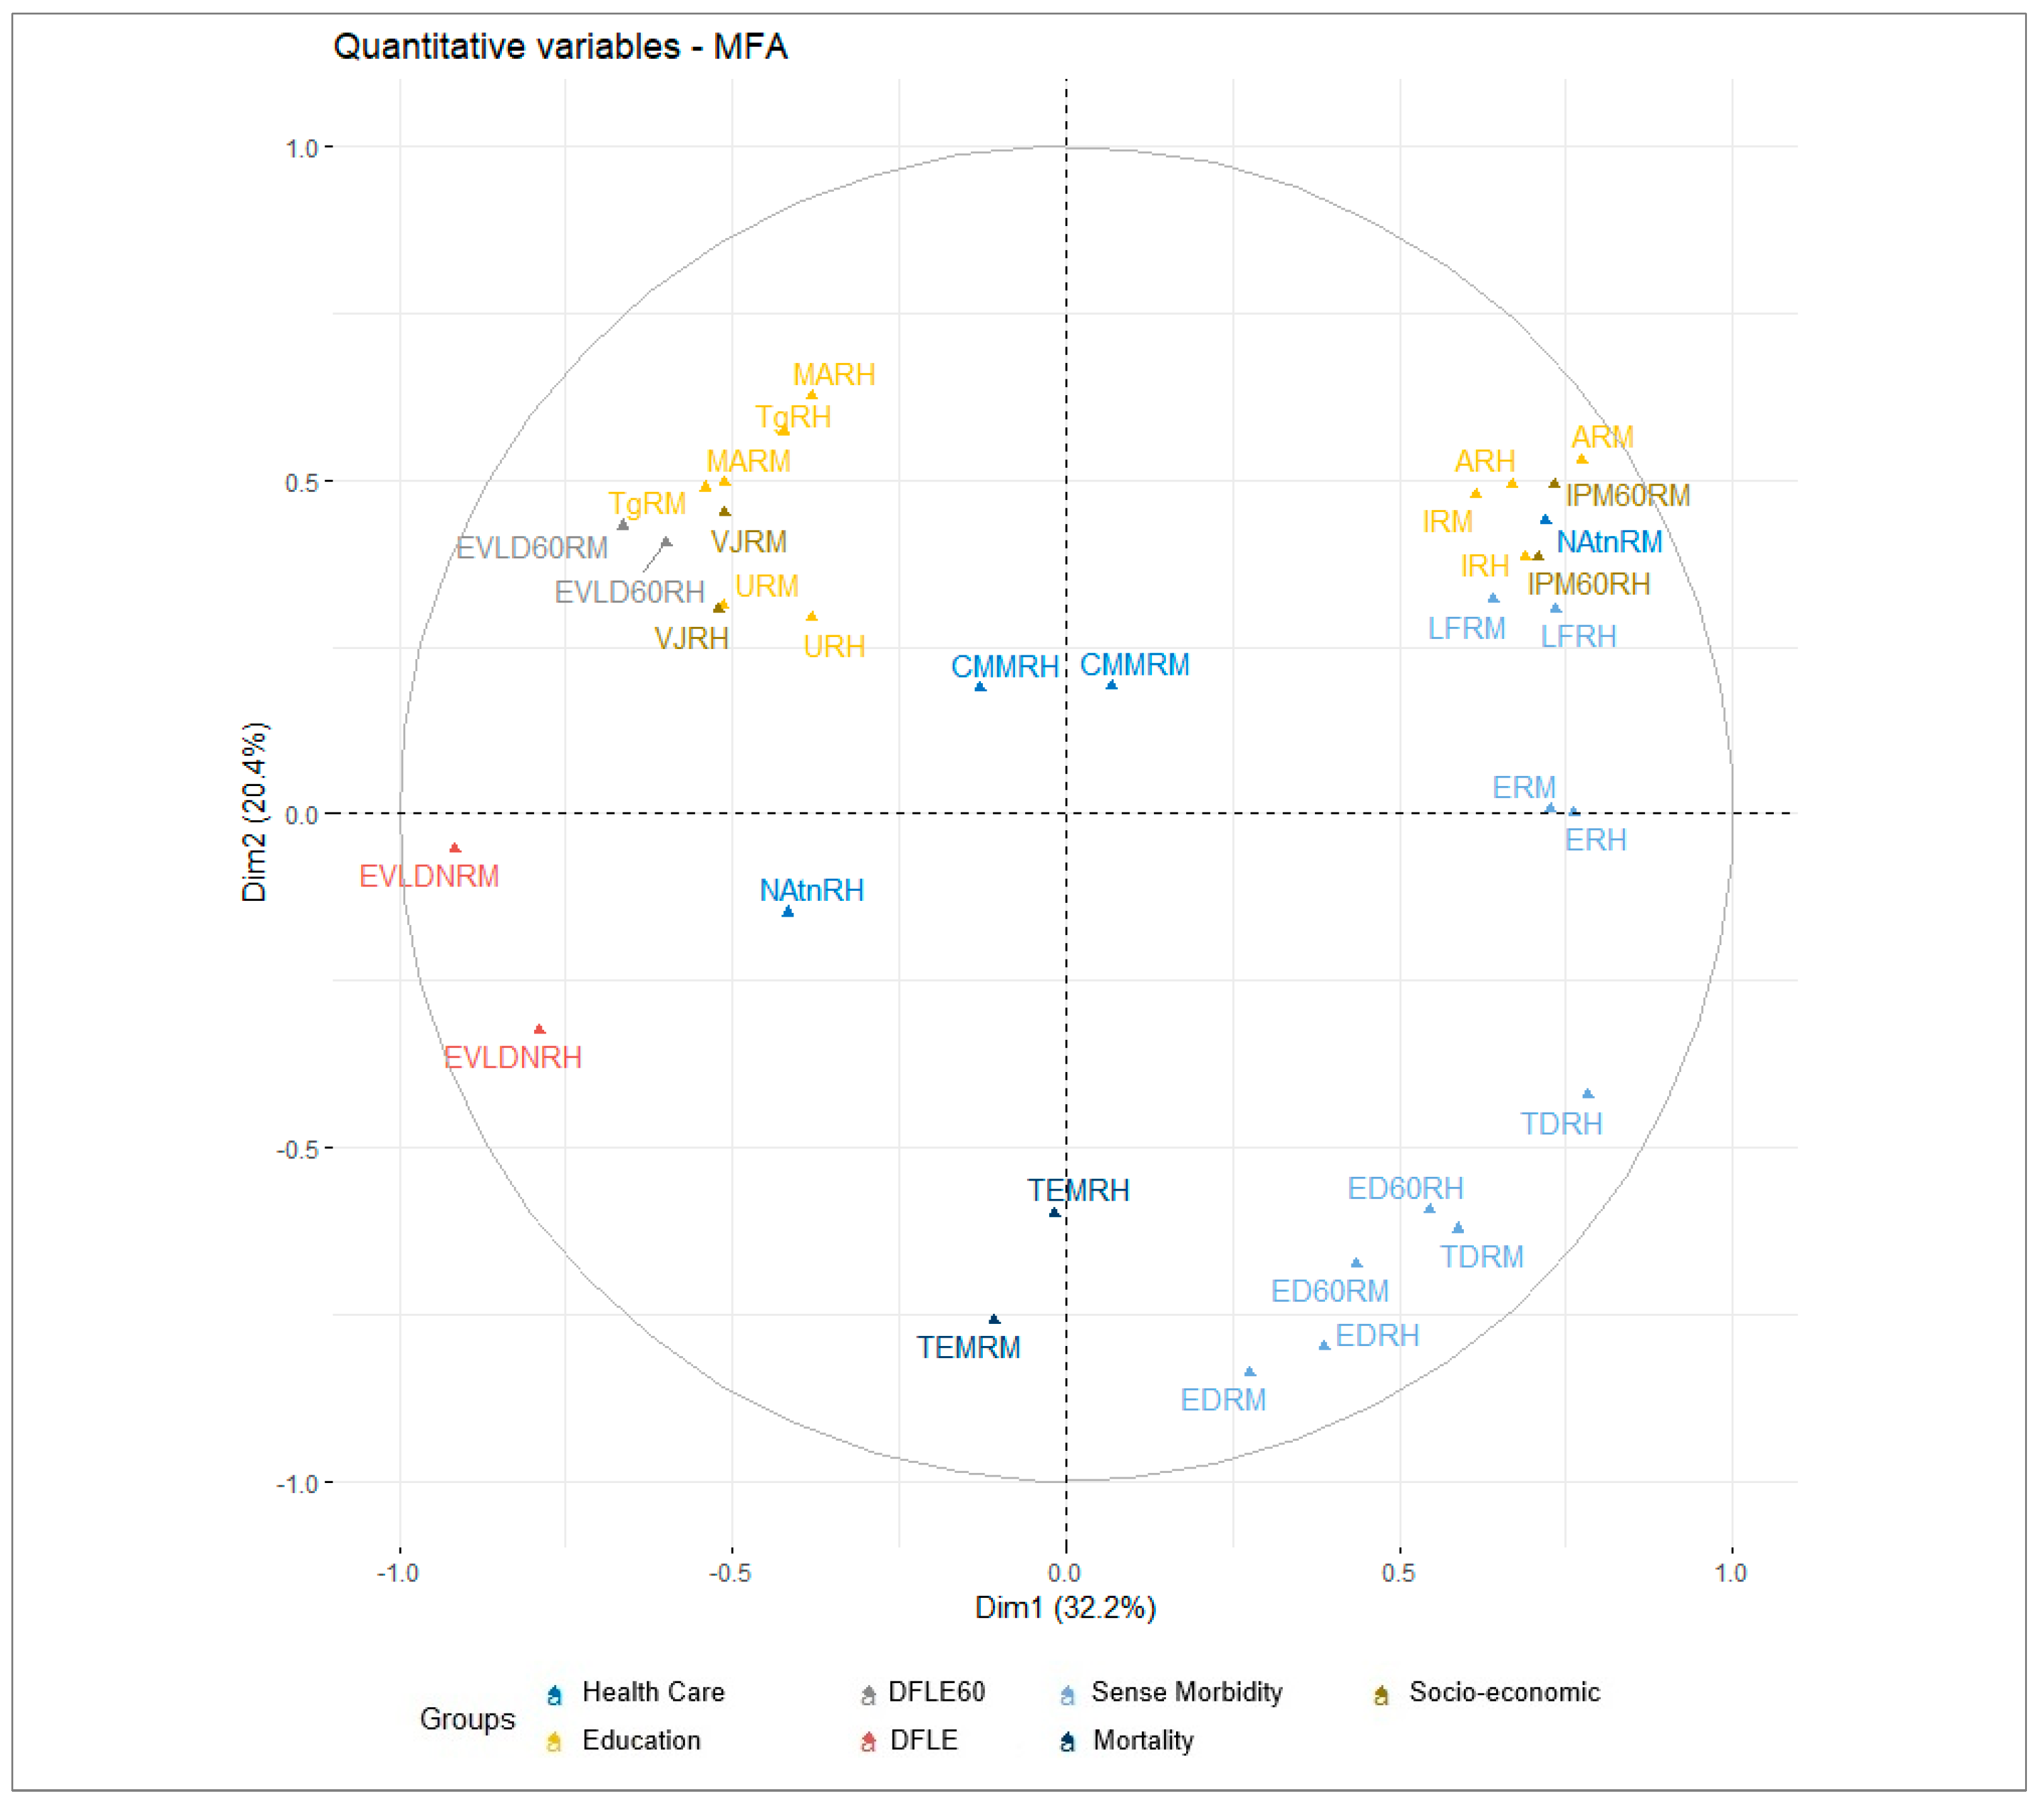
DFLE at birth, DFLE at age 60, living off retirement, and educational indicators maintained a high distribution and contribution by sex, positively correlating with dimensions 1 and 2. This suggests that high and positive values promote healthy aging. In contrast, disability, mortality, MPI, and lack of healthcare, by showing negative correlations with these dimensions, counteract healthy aging in urban areas (Figure 1).
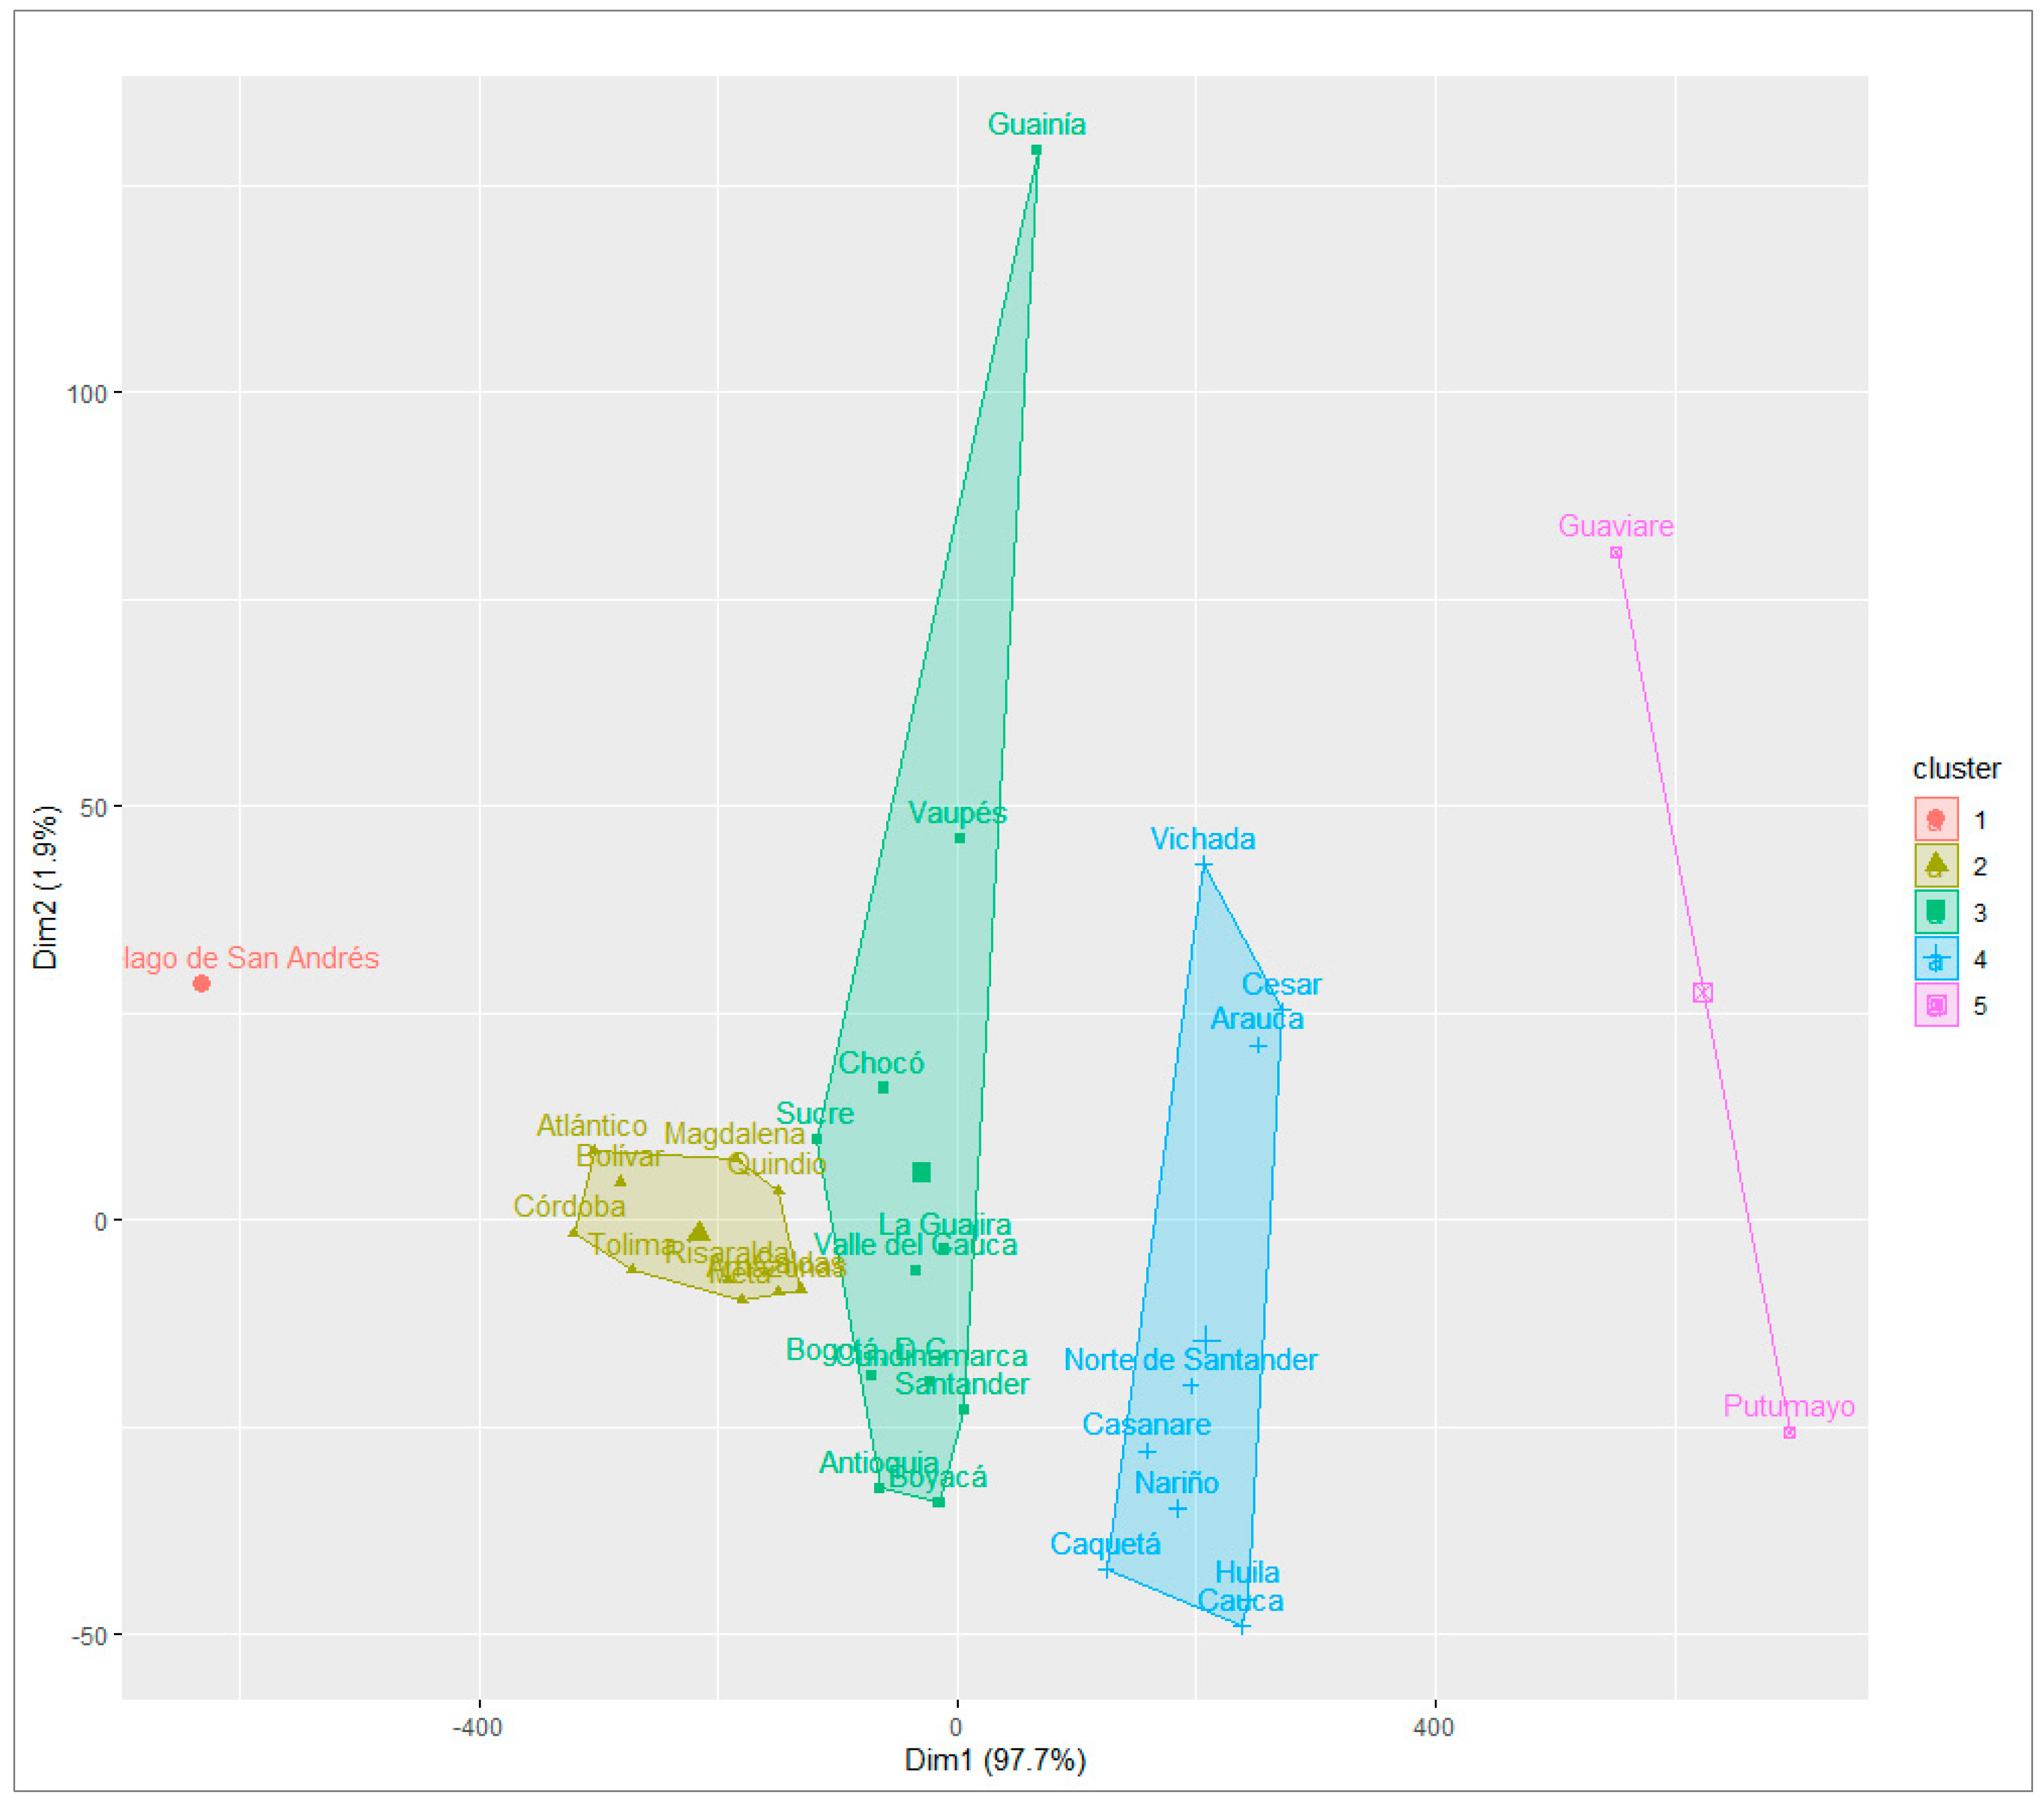
The distribution of departments showed a clear division: clusters 5 and 4 face unfavorable social conditions, high morbidity, disability, and mortality rates, and low levels of retirement, schooling, DFLE at birth, and DFLE at age 60. Cluster 3, with diverse social conditions, faces urban challenges due to migration and the saturation of health services. Clusters 2 and 1, with better health indicators and social conditions, exhibited high values of DFLE at birth and DFLE at age 60 and low levels of disability and mortality. It is noteworthy that cluster 1 includes only the department of the Archipelago of San Andrés and Providencia due to census omissions [35] (Figure 2).

3.7. Multiple Associations in Rural Areas

In rural areas, the education, socioeconomic status, perceived morbidity, and DFLE groups at birth showed higher correlations and good representation of the common factor. Among these groups, education and socioeconomic indicators strongly correlated (0.81), and perceived morbidity with DFLE at age 60 generated a robust correlation (0.52) (Table 9).

3.8. Distribution and Contribution of Indicators in Rural Areas

Unlike the distribution of indicators in urban areas, the indicators that favor healthy aging in rural areas appear on the negative side of dimension 1, while those that do not favor it correlate positively.
High values of the MPI, illiteracy, lack of healthcare, and perceived morbidity reduce DFLE at birth. Similarly, high disability and mortality rates lead to lower DFLE at age 60 and fewer retirement benefits.
For women, DFLE at age 60 is particularly low due to high mortality and disability rates; this hinders the achievement of healthy aging (Figure 3).
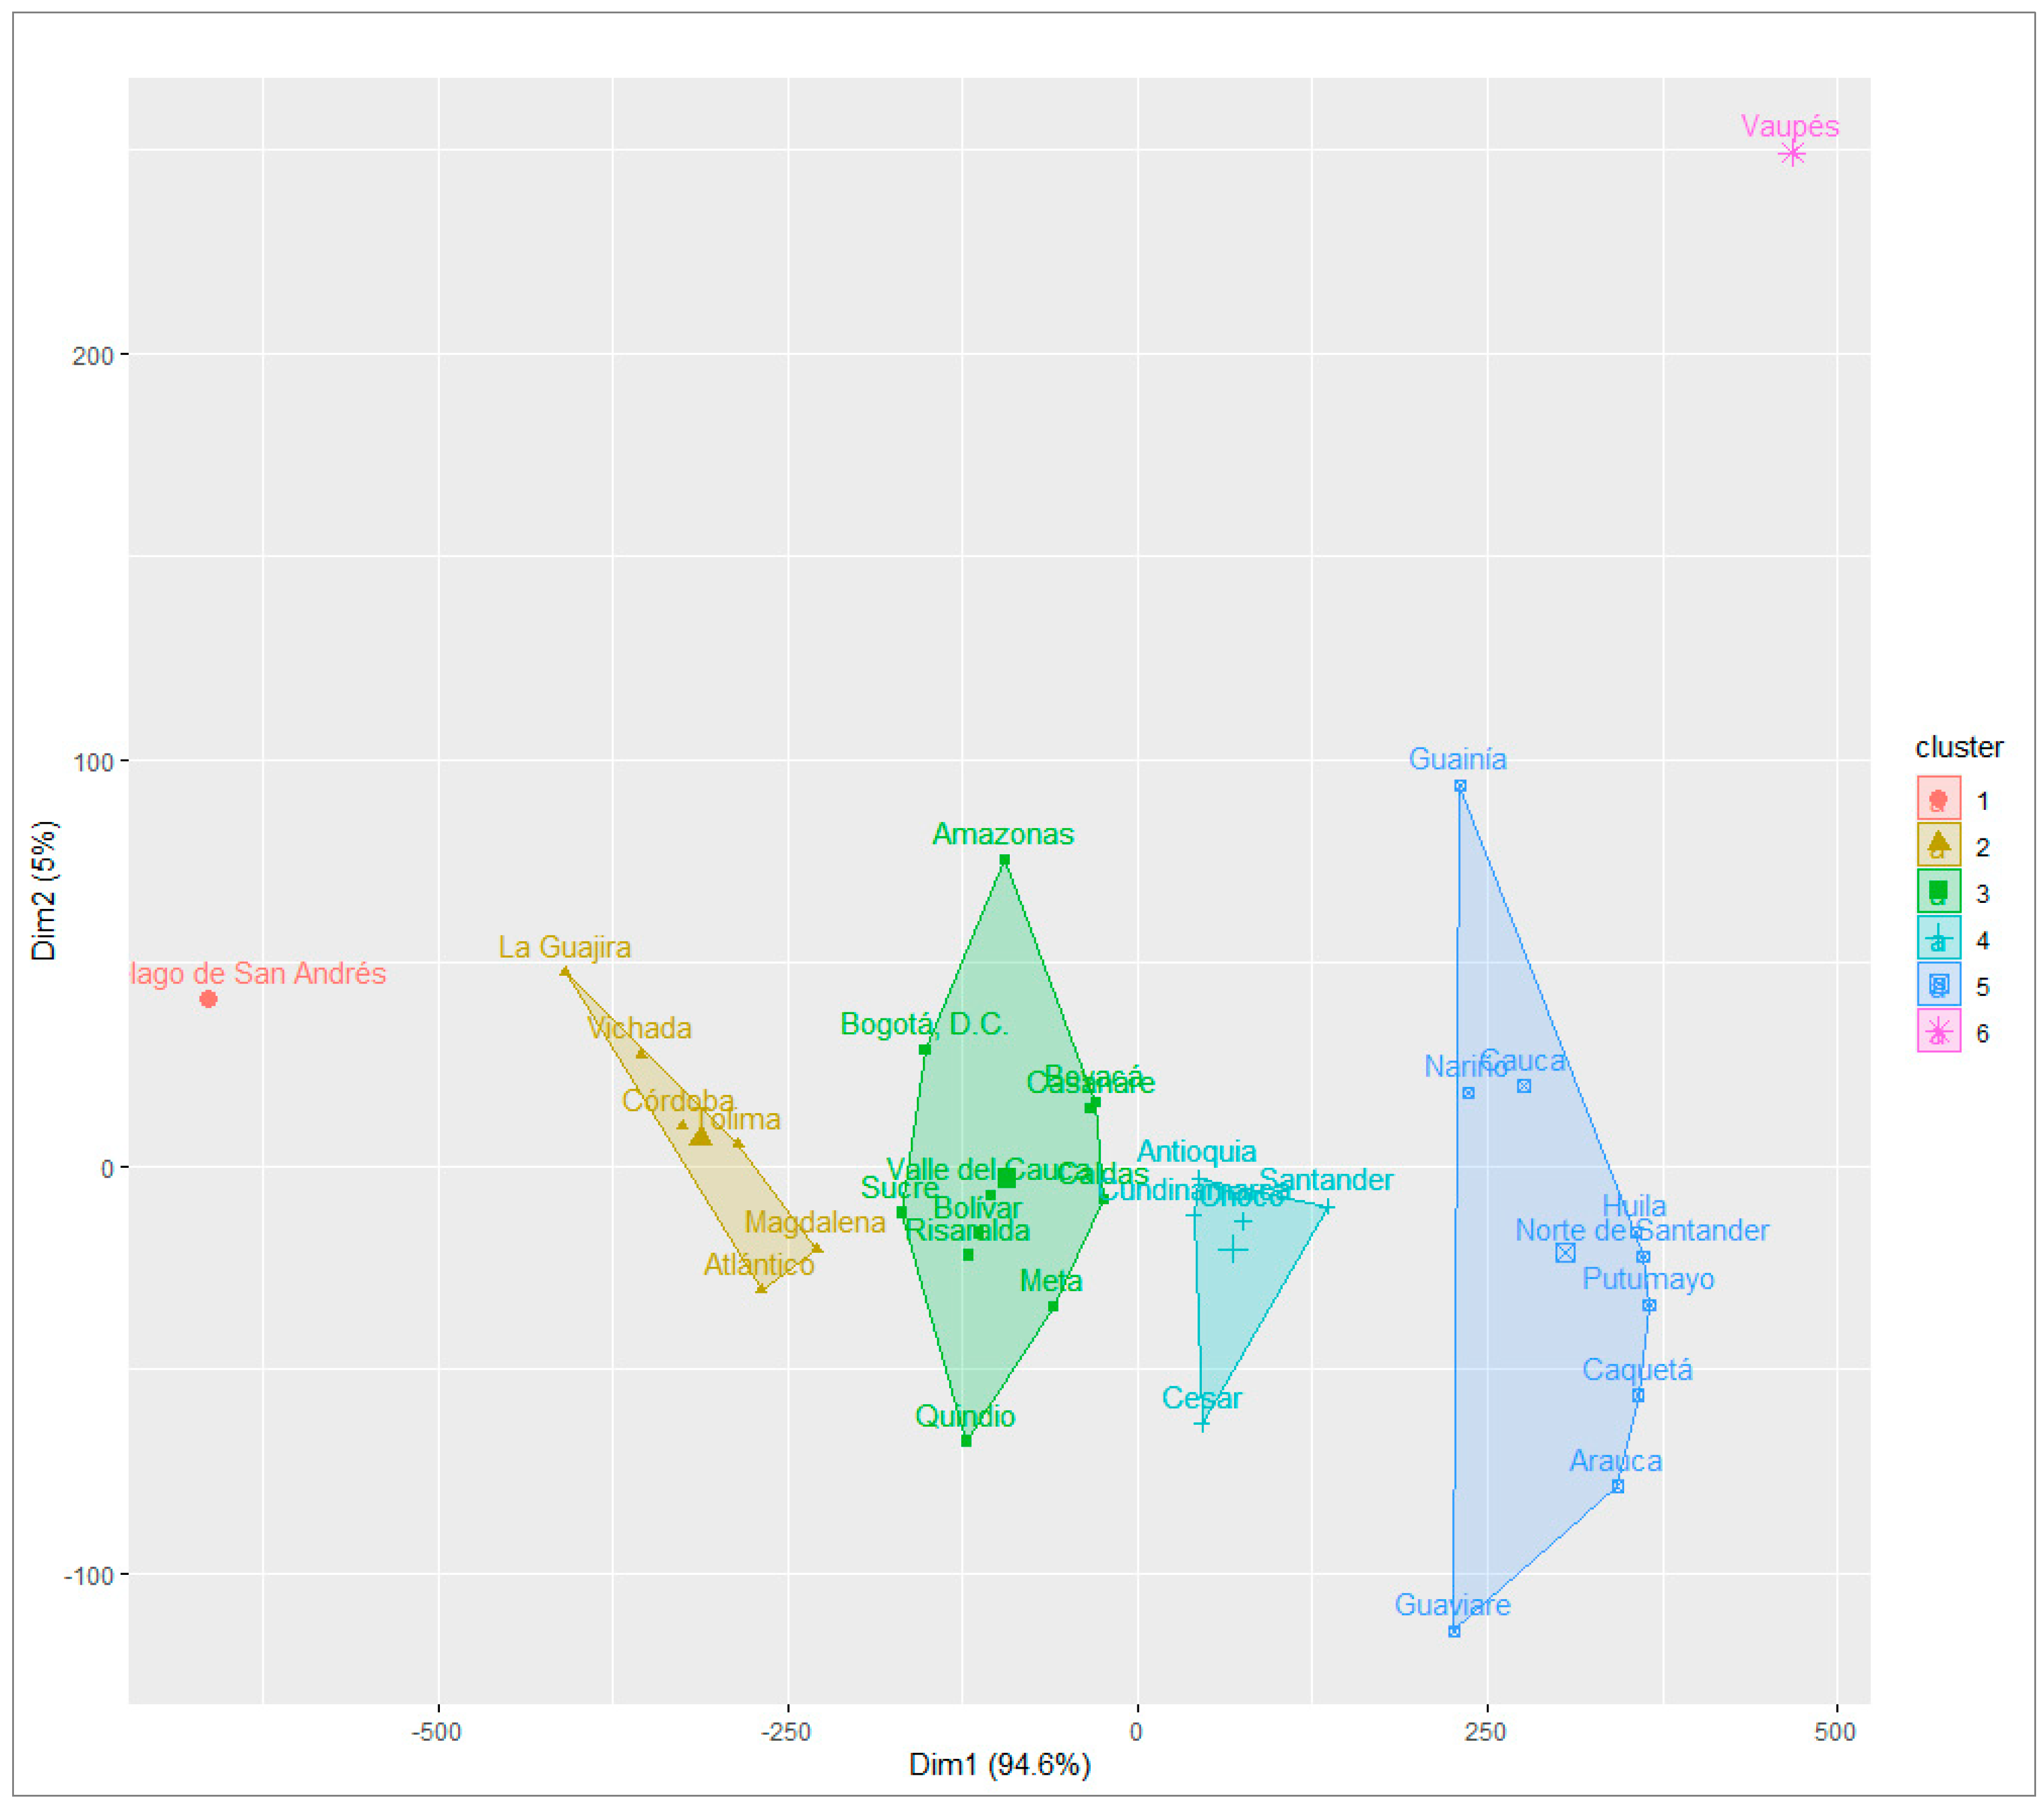
The distribution of departments in this area formed six clusters. Clusters 6 and 5 grouped departments with poor social conditions, high levels of precariousness in healthcare and education, high disability rates, and low DFLE at birth and age 60.
Clusters 4 and 3 included departments with varied social conditions. Those with worse conditions also lacked adequate healthcare, had high MPI, illiteracy, a higher disease burden, low DFLE at age 60, and school absenteeism. Departments with better conditions had higher levels of schooling, retirement benefits, and DFLE at birth.
Clusters 2 and 1 had the best indicators, favoring the health and social conditions of the elderly population. These included low mortality and disability rates and better educational indicators and DFLE for women (Figure 4).
The distribution of departments by clusters revealed a disassociation from traditional geographic regions, highlighting that the area of residence primarily influenced health disparities.
For example, rural areas in the Andean region departments (Cundinamarca, Boyacá, Antioquia, Santander) exhibit worse outcomes compared to urban areas despite being part of the same geographic region. This analysis underscores the need for differentiated public policies that address the specific disparities of each area of residence, focusing on improving access to essential services in rural areas to reduce health inequalities.
Finally, these results support the initial hypothesis that disability among the elderly population reduces healthy life expectancy. Additionally, analyzing socioeconomic characteristics reveals clear health disparities. Specifically, the prevalence of disability is higher among women and in rural areas, underscoring the importance of factors such as access to healthcare services, educational attainment, and financial security in the quality of life of older adults.

4. Discussion

The results of this study revealed significant differences in the distribution of DFLE and DE in Colombia in 2018, highlighting the socioeconomic and geographic inequalities that affect the quality of life of older adults. This research offers a novel contribution by providing updated estimates of DFLE for Colombia, emphasizing the expansion of morbidity and regional health disparities. Previously, CEPAL noted that between 2000 and 2015, the years of life without good health in Colombia increased from 5.2 to 5.9 years [23]. This research calculated a DE of 7.4 years for 2018, confirming an increase of 2.2 and 1.5 years, respectively.
The data also reveal that although women have a higher LE than men, these additional years come with more disability, especially in rural areas [18,36,37]. This finding underscores the urgent need to address gender and territorial inequalities in public health policies, with a special focus on rural women.
We require strategies such as a national program to strengthen primary care in these areas, including the construction of clinics, modernization of equipment, and training in geriatrics. Additionally, it is essential to implement mobile clinics that conduct regular visits and awareness campaigns on preventive care in old age [38]. Equally crucial is the need to increase funding and offer tax incentives and bonuses to attract professionals to rural health centers [39].
The negative associations between DFLE and morbidity and disability variables indicate that the burden of disease negatively impacts the quality of life of older adults, highlighting the need to improve both access to and the quality of healthcare services in rural areas [40]. This represents a significant challenge for public health policymakers, who should focus on specific interventions to manage chronic conditions in aging populations, particularly in rural regions [9].
To address this challenge, implementing a National Comprehensive Disability Care Program could help, including early detection, treatment, and rehabilitation for older adults, along with specialized mental health services, thanks to the frequent coexistence of physical disabilities and mental health issues. As an integral part of this program, to substantially improve the quality of life for these individuals, it is essential to create community rehabilitation centers and the training of multidisciplinary teams in rural areas [41,42].
The negative correlations between DFLE and educational variables, such as illiteracy and school absenteeism, emphasize the importance of strengthening lifelong education [7,8,43,44,45]. Evidence shows that higher educational levels relate to greater DFLE, suggesting that policies should include strategies to improve education at all levels and ages [46].
In this context, establishing literacy and continuing education programs for older adults, particularly in rural areas, are useful for improving health and well-being in old age [47]. Implementing these programs through local schools or via distance education platforms using mobile technology is useful for reaching the most remote areas. Additionally, offering incentives such as scholarships and subsidies could encourage the participation of older adults in educational programs [48]. Alongside these, intergenerational initiatives that promote lifelong learning and community support would also be beneficial [49,50].
A relevant finding is the positive relationship between retirement benefits and DFLE, highlighting the importance of income and economic security in the well-being of older adults [16,19]. Policies that ensure adequate pensions and economic support for the elderly can have a significant impact on their quality of life. The state should ensure the implementation of a Universal Pension Program that guarantees a minimum living income for all older adults, especially those in economically vulnerable situations. A national pension fund could sustain this program and supplement it with subsidies for essential expenses, such as medicine and food [51,52]. Additionally, it is a good idea to implement retirement planning programs that allow for the regularization of overdue or delinquent pension contributions, along with strategies for preparing for post-work life [53,54].
The analysis of differences between urban and rural areas in the MFA highlighted the crucial role that area of residence plays in achieving healthy aging. Urban areas had indicators that favor healthy aging compared to rural areas, which, conversely, showed that addressing indicators early in life can help overcome challenges such as poverty, disability, and lack of healthcare at older ages.
The differences in the distribution of the population by gender and age between urban and rural areas of Colombia are crucial for the design of social and health policies, as each region has distinct needs.
In rural areas, it is essential to implement programs that address poverty, improve healthcare, and reduce disability from early ages. A key strategy would be the creation of a Rural Telemedicine Program to enhance access to specialized care in remote communities through the establishment of centers connected to regional hospitals. Private companies can support this program incentivized with tax benefits. Additionally, the study proposes the formation of community managers to facilitate the elderly population’s access to these services, along with offering subsidies and microloans conditioned on the use of telemedicine. Furthermore, training with a focus on elder care and cultural sensitivity is necessary for healthcare personnel to ensure equitable and high-quality access to healthcare services [39,52,55].
In contrast, in urban areas, it is important to continue improving socioeconomic status and educational levels to increase healthy life expectancy. Enhancing public transportation is essential, including exclusive routes for the elderly and people with disabilities, offering regular schedules and adapted vehicles that ensure comfort and accessibility to facilitate mobility and access to essential services [56,57]. Furthermore, promoting affordable and adapted housing is necessary, along with creating communities specifically designed for older adults to foster an inclusive and accessible environment for aging in place [58,59].
It is also important to note that, although urban areas have supported better DFLE outcomes, recent migration influenced some departments characterized as economic and employment centers, particularly the arrival of 2,894,593 individuals in Colombia, making it the main host country for Venezuelan refugees and migrants [60]. This migratory flow, while presenting a challenge to infrastructure and public resources, also offers an opportunity to stimulate the local economy and contribute positively to the country’s fiscal development [60]. However, the scale of the challenge underscores the need for adaptive policies that consider these migratory dynamics in healthcare planning, such as programs aimed at strengthening or expanding mobile health centers that offer free services, potentially managed and funded by international agencies. Additionally, it is important to adopt a life-course approach to the integration of this population, ensuring that regularization and employment efforts are sustainable and equitable, thereby maximizing their contribution to Colombia’s economy and society.
This research has several strengths. The findings are nationally representative and relevant, and they enhance our understanding of the distribution of healthy life expectancy by department and area of residence, supporting the theory that health inequalities, the expansion of morbidity, and well-being are intrinsically linked to social and economic development [4,61]. Implementing policies based on these findings must be approached carefully to develop specific and effective interventions to improve the quality of life of the elderly population, especially in rural areas and among women.
Despite these strengths, this research has some limitations. First, using cross-sectional and self-reported data may affect the reliability of the findings. Cross-sectional data, being a snapshot of a specific moment, limits the ability to establish causal relationships between the studied variables [62,63]. Additionally, self-reported data can introduce reporting biases, which is especially true in older populations who may struggle to recall and accurately report past events [64,65].
Second, there are limitations regarding the omission error that DANE reported in the 2018 National Population and Housing Census. The total omission rate of 8.5% affects the data’s representativeness. Among the departments where this error was evident is the Archipelago of San Andrés and Providencia, where the total omission was 21.2%, which could significantly bias the results for this region [35].
Third, a possible source of measurement bias relates to reporting information for older adults. When another household member provides data, there may be a discrepancy between the perception of health status, disability, and reality, introducing inaccuracies in the data. This situation is common in studies relying on self-reporting, where the accuracy of reports can vary considerably [64,65].
Lastly, regarding the statistical methods used, although MFA is a powerful tool for identifying underlying patterns and relationships among multiple variables, its complexity can make interpretation difficult for those unfamiliar with advanced statistical techniques [66]. Simplifying the explanation of these methods is essential to ensure that all readers understand the process of reaching conclusions. The analysis employed MFA to identify underlying values reflecting the interdependence of variables and to explain most of the total variability with the fewest possible components. This methodology differentiated variables by area of residence, highlighting disparities between urban and rural areas [67].
Ultimately, this study makes a significant contribution to the field of healthy aging by providing empirical evidence on the social inequalities that affect life expectancy in Colombia. The findings add to the existing literature by highlighting how socioeconomic and geographic factors influence the health of the elderly population, offering a solid foundation for future research and public policies aimed at reducing these disparities. It will, therefore, be essential to address the limitations in future studies to improve the precision and applicability of the results. This includes implementing longitudinal studies that can provide a more detailed and precise view of trends in healthy aging and using data collection methods that minimize reporting bias and improve sample representativeness.

5. Conclusions

The current Colombian population is undergoing a demographic transition, with decreases in both mortality and birth rates, leading to accelerated aging and a reduction in population growth. As demonstrated in this study, various factors influence the achievement of healthy life years, making it crucial to understand the disparities in aging based on geographic location and economic development. This understanding will enable the development of effective social policies that promote education, economic security, and access to quality health services, with a special focus on women and rural populations.
Finally, it will be essential to ensure access to quality healthcare services, with an emphasis on geriatric care and rural areas. This will require strengthening the training of healthcare professionals and social workers so they can adequately and respectfully address the needs of older adults, promoting awareness and continuous education.

Funding

This research received no external funding.

Institutional Review Board Statement

Not applicable.

Informed Consent Statement

Not applicable.

Data Availability Statement

The data supporting the reported results are available through publicly archived datasets from the Departamento Administrativo Nacional de Estadística (DANE). These include the Censo Nacional de Población y Vivienda 2018 (DANE, 2018a), accessible at https://www.dane.gov.co/index.php/estadisticas-por-tema/demografia-y-poblacion/censo-nacional-de-poblacion-y-vivenda-2018/cuantos-somos (accessed on 22 September 2023); the Cuestionario del Censo Nacional de Población y Vivienda 2018 (DANE, 2018b) at https://www.dane.gov.co/files/censo2018/informacion-tecnica/Cuestionario_Hogares.pdf (accessed on 22 September 2023); and the REDATAM Censo Nacional de Población y Vivienda 2018 (DANE, 2018d) at http://systema59.dane.gov.co/bincol/RpWebEngine.exe/Portal?BASE=CNPVBASE4V2&lang=esp (accessed on 22 September 2023).

Acknowledgments

The author expresses gratitude to Pontificia Universidad Javeriana and Universidad Nacional de Córdoba-Argentina for their support, as well as to the project “Cities and Communities Friendly to the Elderly: The Case of Colombian and Spanish Cities”. Additionally, the author thanks the anonymous reviewers for their valuable contributions and insightful comments.

Conflicts of Interest

The author declares no conflicts of interest.

References

  1. Rodríguez, P.; Vejarano, F. Envejecer en Colombia. Universidad Externado de Colombia, Facultad de Ciencias Sociales y Humanas. 2015. Available online: https://publicaciones.uexternado.edu.co/gpd-envejecer-en-colombia-9789587722888.html (accessed on 30 May 2023).
  2. Magnus, G. La Era del Envejecimiento: Cómo la Demografía Está Transformando la Economía Global y Nuestro Mundo; OCEANO: Barcelona, Spain, 2013; Available online: https://search.worldcat.org/es/title/La-era-del-envejecimiento-:-como-la-demografia-esta-transformando-la-economia-global-y-nuestro-mundo/oclc/756801784 (accessed on 18 June 2023).
  3. Gispert, R.; Ruíz-Ramos, M.; Barés, M.A.; Viciana, F.; Clot-Razquin, G. Diferencias en la esperanza de vida libre de discapacidad por sexo y comunidades autónomas en España. Rev. Española De Salud Pública 2007, 81, 155–165. [Google Scholar] [CrossRef] [PubMed]
  4. Gruenberg, E.M. The Failures of Success. The Milbank Memorial Fund Quarterly. Health Soc. 1977, 55, 3–24. Available online: https://www.jstor.org/stable/3349592 (accessed on 13 February 2023).
  5. Fries, J.F. Aging, natural death, and the compression of morbidity. N. Engl. J. Med. 1980, 303, 130–135. [Google Scholar] [CrossRef]
  6. Brenes Camacho, G.; Agudelo Botero, M.; Redondo, N.; Romero, D.; Sandoval, M.H. La medición de la esperanza de vida libre de limitaciones cognitivas y la esperanza de vida con limitaciones cognitivas en América Latina. Notas De Población 2019, 45, 11–36. [Google Scholar] [CrossRef]
  7. Brønnum-Hansen, H.; Eriksen, M.L.; Andersen-Ranberg, K.; Jeune, B. Persistent social inequality in life expectancy and disability-free life expectancy: Outlook for a differential pension age in Denmark? Scand. J. Public Health 2017, 45, 459–462. [Google Scholar] [CrossRef]
  8. Van Oyen, H.; Bossuyt, N.; Deboosere, P.; Gadeyne, S.; Abatih, E.; Demarest, S.S. Differential inequity in health expectancy by region in Belgium. Soz. Und Praventivmedizin 2005, 50, 301–310. [Google Scholar] [CrossRef]
  9. Wagg, E.; Blyth, F.M.; Cumming, R.G.; Khalatbari-Soltani, S. Socioeconomic position and healthy ageing: A systematic review of cross-sectional and longitudinal studies. Ageing Res. Rev. 2021, 69, 101365. [Google Scholar] [CrossRef]
  10. Wu, Y.-T.; Daskalopoulou, C.; Muniz Terrera, G.; Sanchez Niubo, A.; Rodríguez-Artalejo, F.; Ayuso-Mateos, J.L.; Bobak, M.; Caballero, F.F.; de la Fuente, J.; de la Torre-Luque, A.; et al. Education and wealth inequalities in healthy ageing in eight harmonised cohorts in the ATHLOS consortium: A population-based study. Lancet Public Health 2020, 5, e386–e394. [Google Scholar] [CrossRef]
  11. Brønnum-Hansen, H.; Foverskov, E.; Andersen, I. Income inequality in life expectancy and disability-free life expectancy in Denmark. J. Epidemiol. Community Health 2021, 75, 145–150. [Google Scholar] [CrossRef]
  12. Abalos, J.B.; Booth, H. Factors associated with regional variation in disability-free life expectancy based on functional difficulty among older persons in the Philippines. Asian Popul. Stud. 2020, 16, 264–286. [Google Scholar] [CrossRef]
  13. Gutiérrez-Fisac, J.L.; Gispert, R.; Solà, J. Factors explaining the geographical differences in Disability Free Life Expectancy in Spain. J. Epidemiol. Community Health 2000, 54, 451. [Google Scholar] [CrossRef]
  14. Laborde, C.; Crouzet, M.; Carrère, A.; Cambois, E. Contextual factors underpinning geographical inequalities in disability-free life expectancy in 100 French départements. Eur. J. Ageing 2021, 18, 381–392. [Google Scholar] [CrossRef]
  15. Liu, J.; Chen, G.; Chi, I.; Wu, J.; Pei, L.; Song, X.; Zhang, L.; Pang, L.; Han, Y.; Zheng, X. Regional variations in and correlates of disability-free life expectancy among older adults in China. BMC Public Health 2010, 10, 446. [Google Scholar] [CrossRef]
  16. Minagawa, Y.; Saito, Y. An analysis of factors related to disability-free life expectancy at 65 years of age across Japanese prefectures in 2010. Eur. J. Ageing 2018, 15, 15. [Google Scholar] [CrossRef]
  17. Moretti, M.; Strozza, C. Gender and educational inequalities in disability-free life expectancy among older adults living in Italian regions. Demogr. Res. 2022, 47, 919–934. [Google Scholar] [CrossRef]
  18. Wang, S.; Hu, S.; Wang, P.; Wu, Y.; Liu, Z.; Zheng, H. Disability-Free Life Expectancy among People Over 60 Years Old by Sex, Urban and Rural Areas in Jiangxi Province, China. Int. J. Environ. Res. Public Health 2021, 18, 4636. [Google Scholar] [CrossRef]
  19. Wohland, P.; Rees, P.; Gillies, C.; Alvanides, S.; Matthews, F.E.; O’Neill, V.; Jagger, C. Drivers of inequality in disability-free expectancy at birth and age 85 across space and time in Great Britain. J. Epidemiol. Community Health 2014, 68, 826–833. [Google Scholar] [CrossRef]
  20. Yang, S. The effects of socioeconomic status on healthy life expectancy among different age groups of Japanese suburban elderly. Educ. Gerontol. 2017, 43, 595–608. [Google Scholar] [CrossRef]
  21. Departamento Administrativo Nacional de Estadística (DANE). Censo Nacional de Población y Vivienda 2018. 2018a. Available online: https://www.dane.gov.co/index.php/estadisticas-por-tema/demografia-y-poblacion/censo-nacional-de-poblacion-y-vivenda-2018/cuantos-somos (accessed on 22 September 2023).
  22. Departamento Administrativo Nacional de Estadística (DANE); Estudios Poscensales Censo Nacional de Población y Vivienda 2018. 2022; Caracterización y Cambios de la Discapacidad a Partir de Los Censos 2005 y 2018 en Colombia: Una Mirada Desde Los Determinantes Sociales de la Salud. Available online: https://www.dane.gov.co/files/censo2018/estudios-poscensales/12-Caracterizacion-discapacidad-censos-200-2018-Colombia.pdf (accessed on 22 September 2023).
  23. Huenchuan, S. Envejecimiento, Personas Mayores y Agenda 2030 Para el Desarrollo Sostenible: Perspectiva Regional y de Derechos Humanos; Libros de La CEPAL: Santiago, Chile, 2018; pp. 1–259. Available online: https://repositorio.cepal.org/bitstream/handle/11362/44369/1/S1800629_es.pdf (accessed on 30 June 2023).
  24. Organización Mundial de la Salud (OMS). Ciudades Globales Amigables con los Mayores: Una Guía. 2007. Available online: https://apps.who.int/iris/bitstream/handle/10665/43805/9789243547305_spa.pdf (accessed on 5 October 2022).
  25. Departamento Administrativo Nacional de Estadística (DANE). Cuestionario del Censo Nacional de Población y Vivienda 2018. 2018b. Available online: https://www.dane.gov.co/files/censo2018/informacion-tecnica/Cuestionario_Hogares.pdf (accessed on 22 September 2023).
  26. Departamento Administrativo Nacional de Estadística (DANE). REDATAM Censo Nacional de Población y Vivienda 2018. 2018d. Available online: http://systema59.dane.gov.co/bincol/RpWebEngine.exe/Portal?BASE=CNPVBASE4V2&lang=esp (accessed on 22 September 2023).
  27. Departamento Administrativo Nacional de Estadística (DANE). Tablas de Vida Completas y Abreviadas Por Sexo a Nivel Nacional y Departamental 1985–2019. 2023. Available online: https://www.dane.gov.co/index.php/estadisticas-por-tema/demografia-y-poblacion/estimaciones-del-cambio-demografico (accessed on 22 September 2023).
  28. Departamento Administrativo Nacional de Estadística (DANE). Defunciones No Fetales 2018. 2018c. Available online: https://www.dane.gov.co/index.php/estadisticas-por-tema/salud/nacimientos-y-defunciones/defunciones-no-fetales/defunciones-no-fetales-2018 (accessed on 22 September 2023).
  29. Departamento Administrativo Nacional de Estadística (DANE). Regiones Geográficas de Colombia. 2008. Available online: https://geoportal.dane.gov.co/servicios/atlas-estadistico/src/Tomo_I_Demografico/%e2%80%a2regiones-geogr%c3%a1ficas.html (accessed on 8 September 2024).
  30. Imai, K.; Soneji, S. On the estimation of disability-free life expectancy: Sullivan’s method and its extension. J. Am. Stat. Assoc. 2007, 102, 1199–1211. [Google Scholar] [CrossRef]
  31. Jagger, C.; Van Oyen, H.; Robine, J.M. Health Expectancy Calculation by the Sullivan Method: A Practical Guide, 4th ed.; EHEMU Technical Report; EHEMU: Montpellier, France, 2014; Available online: https://reves.site.ined.fr/fichier/s_rubrique/20182/sullivan.guide.pre.final.oct2014.en.pdf (accessed on 8 September 2024).
  32. Saito, Y.; Robine, J.-M.; Crimmins, E.M. The methods and materials of health expectancy. Stat. J. IAOS 2014, 30, 209–223. [Google Scholar] [CrossRef] [PubMed]
  33. Hair, J.F.; Anderson, R.E.; Tatham, R.L.; Black, W.C. Análisis Multivariante, 5th ed.; Pearson Prentice Hall: Madrid, Spain, 2004; Available online: https://documat.unirioja.es/servlet/libro?codigo=320227 (accessed on 6 April 2023).
  34. Abdi, H.; Williams, L.J.; Valentin, D. Multiple factor analysis: Principal component analysis for multitable and multiblock data sets. Wiley Interdiscip. Rev. Comput. Stat. 2013, 5, 149–179. [Google Scholar] [CrossRef]
  35. Departamento Administrativo Nacional de Estadística (DANE). Omisión Censal, Nivel Municipal y Departamental. 2019. Available online: https://www.dane.gov.co/files/censo2018/informacion-tecnica/cnpv-2018-presentacion-omision-censal.pdf (accessed on 6 April 2023).
  36. Belon, A.P.; Lima, M.G.; Barros, M.B.A. Gender differences in healthy life expectancy among Brazilian elderly. Health Qual. Life Outcomes 2014, 12, 1. [Google Scholar] [CrossRef] [PubMed]
  37. Bem, A.; Ucieklak-Jeż, P. Health status of the rural population in Poland. Manag. Theory Stud. Rural. Bus. Infrastruct. Dev. 2014, 36, 235–243. [Google Scholar] [CrossRef]
  38. World Health Organization (WHO). Guide for Integration of Perinatal Mental Health in Maternal and Child Health Services; World Health Organization (WHO): Geneva, Switzerland, 2022; Available online: https://iris.who.int/bitstream/handle/10665/362880/9789240057142-eng.pdf?sequence=1 (accessed on 8 September 2024).
  39. Haines, A.; Kuruvilla, S.; Borchert, M. Bridging the implementation gap between knowledge and action for health. Bull. World Health Organ. 2004, 82, 724. [Google Scholar]
  40. Islam, M.S.; Tareque, M.I.; Mondal, M.N.I.; Fazle Rabbi, A.M.; Khan, H.T.A.; Begum, S. Urban-rural differences in disability-free life expectancy in Bangladesh using the 2010 HIES data. PLoS ONE 2017, 12, e0179987. [Google Scholar] [CrossRef]
  41. Chodzko-Zajko, W.J.; Proctor, D.N.; Fiatarone Singh, M.A.; Minson, C.T.; Nigg, C.R.; Salem, G.J.; Skinner, J.S. Exercise and physical activity for older adults. Med. Sci. Sports Exerc. 2009, 41, 1510–1530. [Google Scholar] [CrossRef]
  42. King, A.C.; Rejeski, W.J.; Buchner, D.M. Physical activity interventions targeting older adults: A critical review and recommendations. Am. J. Prev. Med. 1998, 15, 316–333. [Google Scholar] [CrossRef] [PubMed]
  43. Brønnum-Hansen, H.; Andersen, O.; Kjøller, M.; Rasmussen, N.K. Social gradient in life expectancy and health expectancy in Denmark. Soz. Und Praventivmedizin 2004, 49, 36–41. [Google Scholar] [CrossRef]
  44. Camargos, M.C.S.; Machado, C.J.; Do Nascimento Rodrigues, R. Disability life expectancy for the elderly, city of Sao Paulo, Brazil, 2000: Gender and educational differences. J. Biosoc. Sci. 2007, 39, 455–463. [Google Scholar] [CrossRef]
  45. Storeng, S.H.; Øverland, S.; Skirbekk, V.; Hopstock, L.A.; Sund, E.R.; Krokstad, S.; Strand, B.H. Trends in Disability-Free Life Expectancy (DFLE) from 1995 to 2017 in the older Norwegian population by sex and education: The HUNT Study. Scand. J. Public Health 2022, 50, 542–551. [Google Scholar] [CrossRef]
  46. Parsons, S.; Bynner, J.; National Research and Development Centre for Adult Literacy and Numeracy. Does numeracy matter more? National Research and Development Centre for Adult Literacy and Numeracy. 2005. Available online: https://discovery.ucl.ac.uk/id/eprint/1566244/1/parsons2006does.pdf (accessed on 9 June 2024).
  47. Glanz, K.; Ammerman, A. Introduction to community and group models of health behavior change. In Health Behavior: Theory, Research, and Practice, 5th ed.; Jossey-Bass: San Francisco, CA, USA, 2015; pp. 271–276. Available online: https://www.wiley.com/en-sg/Health+Behavior%3A+Theory%2C+Research%2C+and+Practice%2C+5th+Edition-p-9781118628980 (accessed on 30 June 2024).
  48. Schuller, T.; Desjardins, R.; Centre for Educational Research and Innovation; Organisation for Economic Cooperation and Development; SourceOECD (Online Service). Understanding the Social Outcomes of Learning; OECD: Paris, France, 2007. [Google Scholar]
  49. Kuehne, V.S. Intergenerational Programs Understanding What We Have Created; Haworth Press: Philadelphia, PA, USA, 1999; Available online: https://api.pageplace.de/preview/DT0400.9781135787202_A24422407/preview-9781135787202_A24422407.pdf (accessed on 10 June 2024).
  50. Martins, T.; Midão, L.; Martínez Veiga, S.; Dequech, L.; Busse, G.; Bertram, M.; McDonald, A.; Gilliland, G.; Orte, C.; Vives, M.; et al. Intergenerational Programs Review: Study Design and Characteristics of Intervention, Outcomes, and Effectiveness: Research. J. Intergener. Relatsh. 2019, 17, 93–109. [Google Scholar] [CrossRef]
  51. Hujo, K. Reforming Pensions in Developing and Transition Countries: Conclusions. In Reforming Pensions in Developing and Transition Countries; Palgrave Macmillan UK: London, UK, 2014; pp. 311–335. [Google Scholar] [CrossRef]
  52. Khandker, S.R.; Koolwal, G.B.; Samad, H.A. Handbook on Impact Evaluation; World Bank Publications: Chicago, IL, USA, 2009; Available online: https://documents1.worldbank.org/curated/en/650951468335456749/pdf/520990PUB0EPI1101Official0Use0Only1.pdf (accessed on 10 June 2024).
  53. Adams, G.A.; Rau, B.L. Putting Off Tomorrow to Do What You Want Today: Planning for Retirement. Am. Psychol. 2011, 66, 180–192. [Google Scholar] [CrossRef]
  54. Ilmarinen, J.E. Aging Workers. Occup. Environ. Med. 2001, 58, 546. [Google Scholar] [CrossRef] [PubMed]
  55. Morduch, J. The Microfinance Promise. J. Econ. Lit. 1999, 37, 1569–1614. [Google Scholar] [CrossRef]
  56. Alsnih, R.; Hensher, D.A. The mobility and accessibility expectations of seniors in an aging population. Transp. Res. Part A Policy Pract. 2003, 37, 903–916. [Google Scholar] [CrossRef]
  57. Mollenkopf, H.; Fiorella, A.E.; Isto, M.; Ae, R.; Sze’man, Z.; Ae, S.; Tacken, M.; Wahl, H.-W. Social and behavioural science perspectives on out-of-home mobility in later life: Findings from the European project MOBILATE. Eur. J. Ageing 2004, 1, 45–53. [Google Scholar] [CrossRef]
  58. Oswald, F.; Jopp, D.; Rott, C.; Wahl, H.W. Is Aging in Place a Resource for or Risk to Life Satisfaction? Gerontologist 2011, 51, 238–250. [Google Scholar] [CrossRef]
  59. Smith, S.K.; Rayer, S.; Smith, E.A. Aging and Disability: Implications for the Housing Industry and Housing Policy in the United States. J. Am. Plan. Assoc. 2008, 74, 289–306. [Google Scholar] [CrossRef]
  60. Equilibrium Social Development Consulting (Equilibrium SDC). Estudio de Impacto Fiscal de la Migración Venezolana en Colombia: Realidad vs. Potencial. 2024. Available online: https://robuenosaires.iom.int/sites/g/files/tmzbdl626/files/documents/2024-04/informe-final_vf.pdf (accessed on 24 August 2024).
  61. Benach, J.; Muntaner, C. Otra forma de mirar la Salud. In Aprender a Mirar la Salud: Cómo la Desigualdad Social Daña Nuestra Salud; El Viejo Topo: Vilassar de Dalt, Spain, 2005. [Google Scholar]
  62. Caruana, E.J.; Roman, M.; Hernández-Sánchez, J.; Solli, P. Longitudinal studies. J. Thorac. Dis. 2015, 7, E537–E540. [Google Scholar] [CrossRef]
  63. Twisk, J.W.R. Applied Longitudinal Data Analysis for Epidemiology. In A Practical Guide; Cambridge University Press: Cambridge, UK, 2013; pp. 1–321. [Google Scholar] [CrossRef]
  64. Tourangeau, R.; Rips, L.J.; Rasinski, K. The Psychology of Survey Response; Cambridge University Press: Cambridge, UK, 2000. [Google Scholar] [CrossRef]
  65. Fowler, F.J. Survey Research Methods, 4th ed.; SAGE Publications, Inc.: Thousand Oaks, CA, USA, 2009. [Google Scholar] [CrossRef]
  66. Hair, J.F., Jr.; Black, W.C.; Babin, B.J.; Anderson, R.E. Multivariate Data Analysis, 7th ed.; Prentice Hall: Hoboken, NJ, USA, 2009; Available online: https://www.academia.edu/41115354/Multivariate_Data_Analysis_7th_Edition (accessed on 9 June 2024).
  67. Escofier, B.; Pagès, J. Multiple factor analysis (AFMULT package). Comput. Stat. Data Anal. 1994, 18, 121–140. [Google Scholar] [CrossRef]
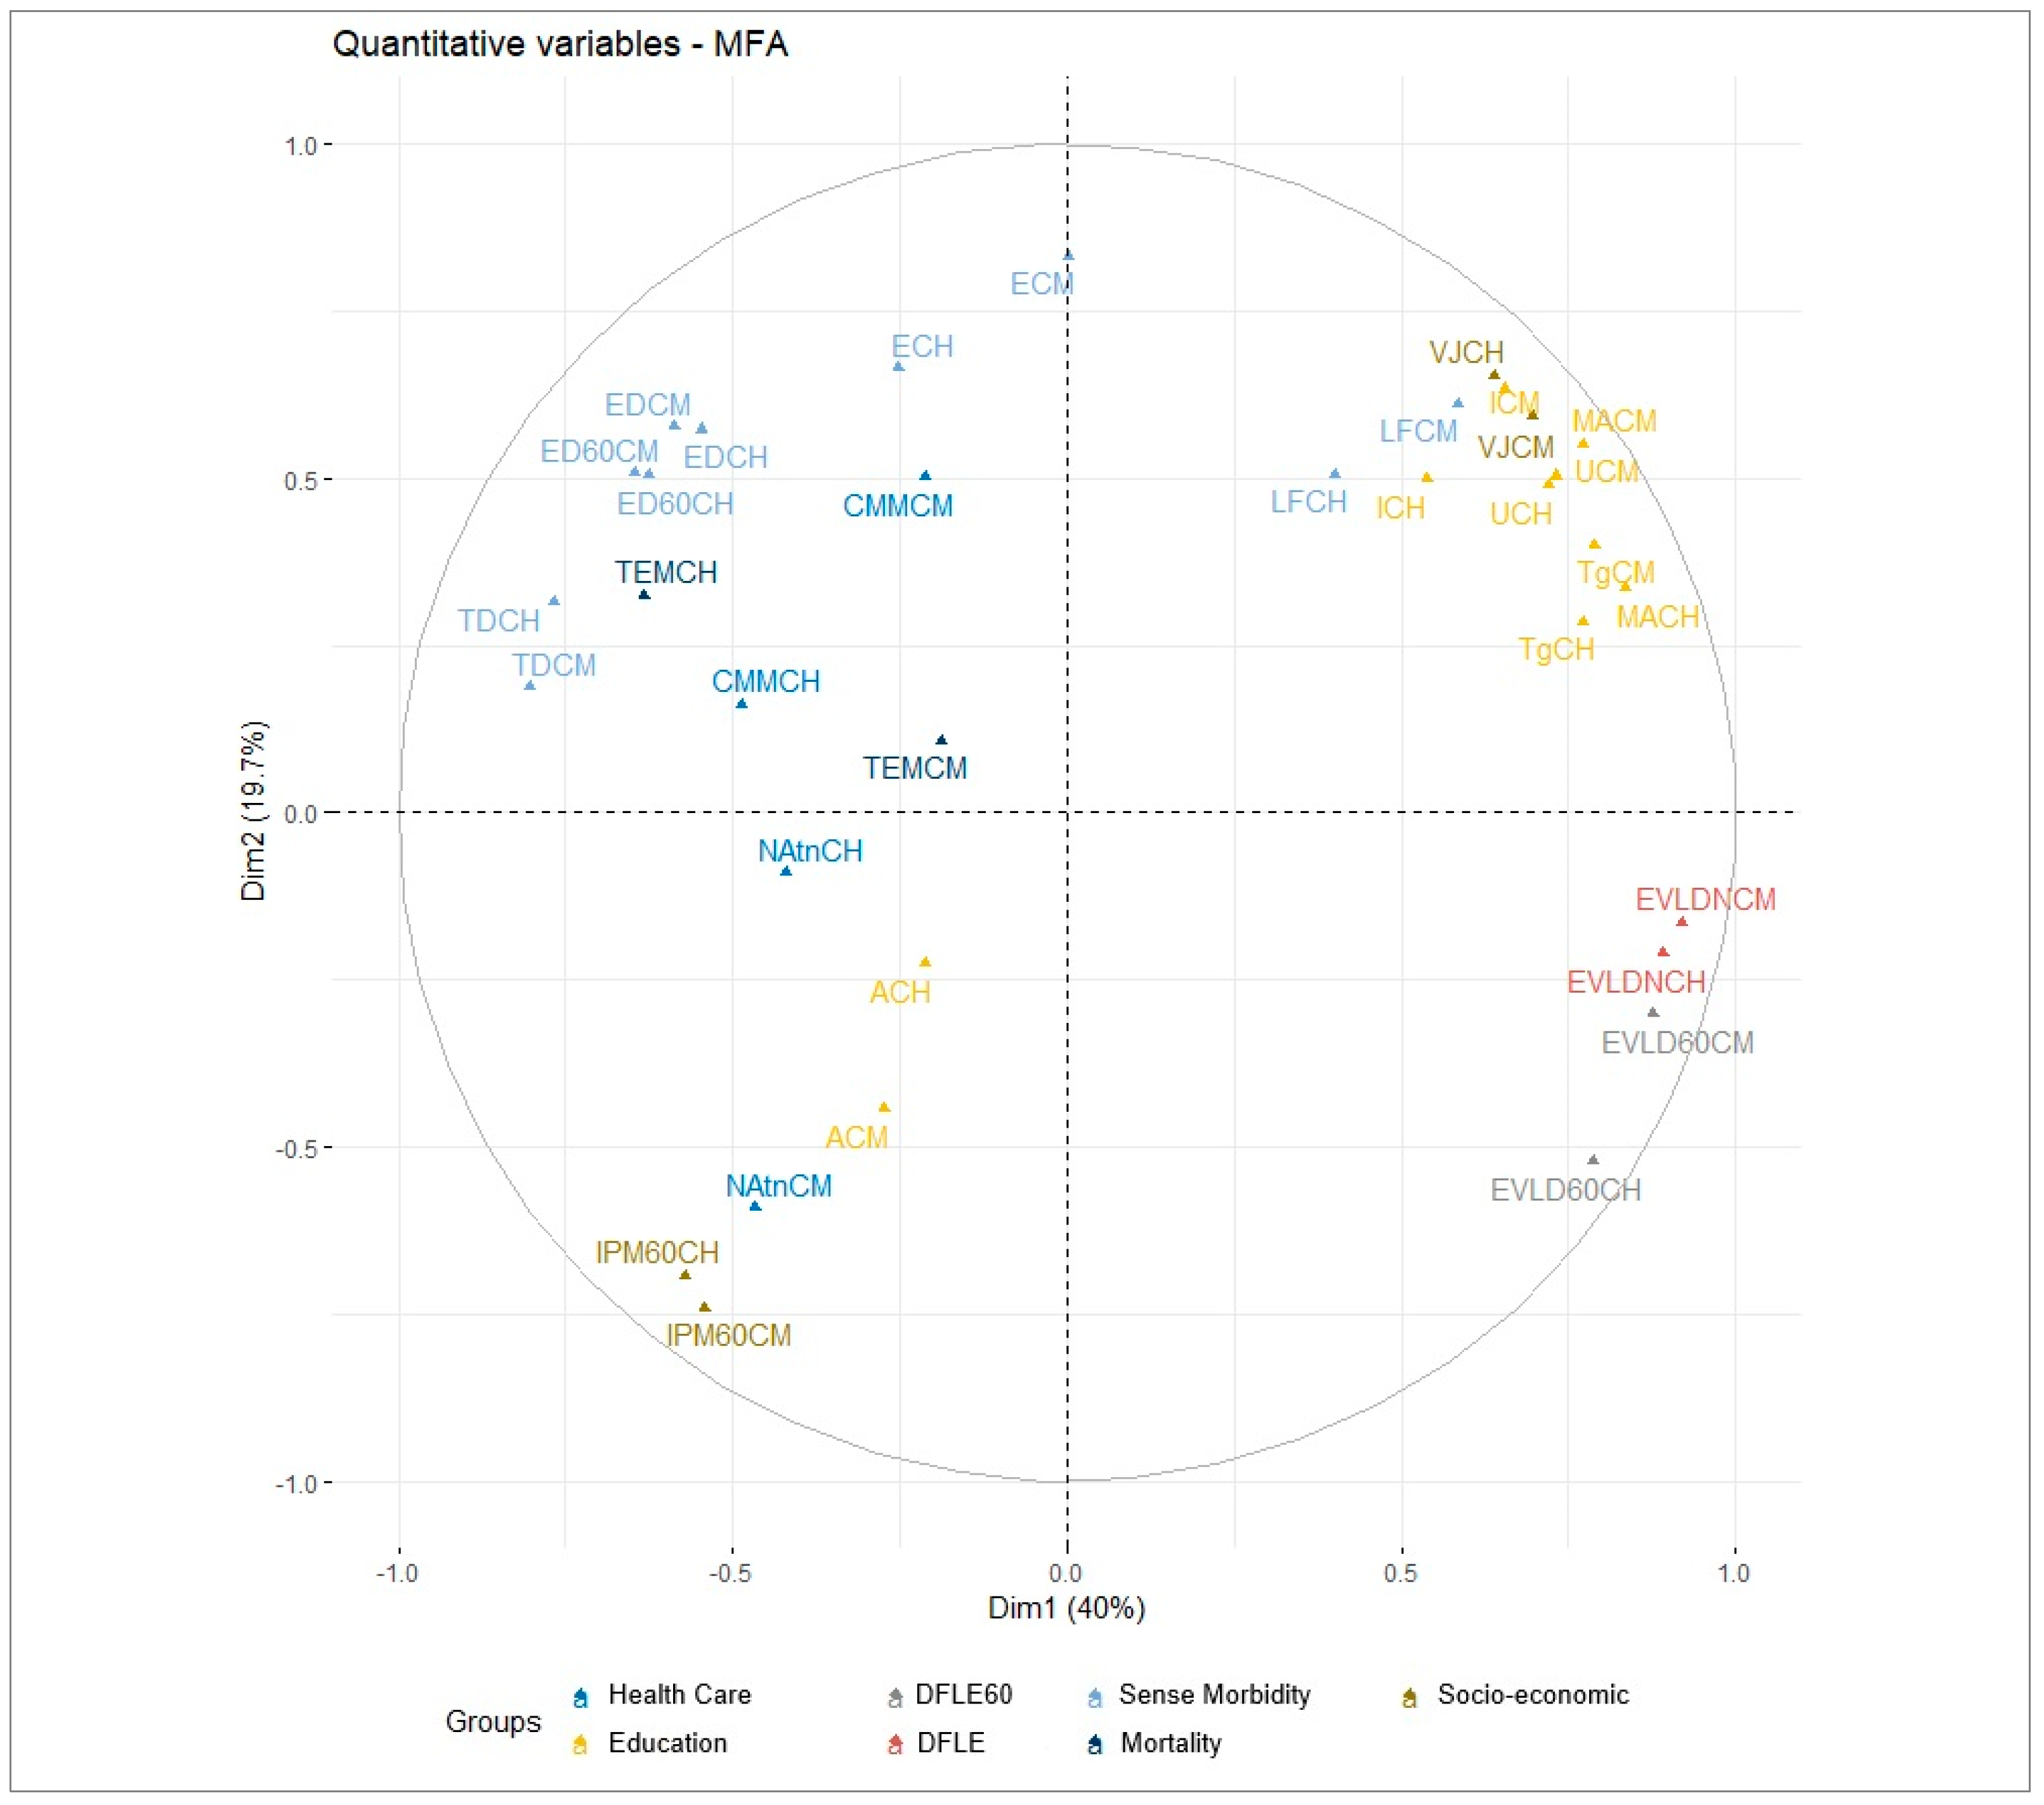
Figure 1. Variable MFA in urban area, Colombia 2018. Note: Own elaboration.
Ijerph 21 01244 g001
Figure 2. Cluster departments according to multiple associations of indicators of urban areas, Colombia 2018. Note: Own elaboration.
Ijerph 21 01244 g002
Figure 3. Variable MFA in populated rural areas, Colombia 2018. Note: Own elaboration.
Ijerph 21 01244 g003
Figure 4. Departmental clusters according to multiple associations of indicators of the rural area, Colombia 2018. Note: Own elaboration.
Ijerph 21 01244 g004
Table 1. Processing of study variables.
Social Conditions Indicator Operational Definition
Sense Morbidity
and Disability
% Presence of health
problems in the last 30 days
P o b . 60 +   t h a t   p r e s e n t e d   o r   d i d   n o t   p r e s e n t   h e a l t h   p r o b l e m s P o b .   t o t a l   60 + × 100
% Physical limitations P o b . 60 +   t h a t   i n d i c a t e d   h a v i n g   o r   n o t   h a v i n g   a   P L P o b .   t o t a l   60 + × 100
Disability rate P o b . 60 +   t h a t   r e p o r t e d   a n   P L P o b .   t o t a l   60 + × 1000
Disability Expectancy (DE) at birth and age 60 ( D F L E L E ) ; ( D F L E 60 L E 60 )
Health Service
Delivery
% Attention to health problems P o b . 60 +   w h o   a t t e n d e d   a   h e a l t h   i n s t i t u t i o n   a n d   w e r e   n o t   a t t e n d e d P o b .   t o t a l   60 + w h o   a t t e n d e d   a   h e a l t h   i n s t i t u t i o n × 100
% Quality of care P o b . 60 +   p e r c e p t i o n   o f   q u a l i t y   o f   c a r e P o b .   t o t a l   60 + t h a t   w a s   t r e a t e d × 100
MortalitySpecific mortality rate
(60 years and over)
D e a t h s   P o b . 60   y + P o b .   t o t a l   60 + × 1000
Healthy Life ExpectancyDFLE at birth and age 60 D F L E x = i = x 90 ( ( 1 t i ) L i ) l x
Educational Status and Capacities% People according to literacy P o b . 60 +   t h a t   k n o w s   o r   d o e s   n o t   r e a d   a n d   w r i t e P o b .   t o t a l   60 + × 100
% Attendance at an educational center P o b . 60 +   t h a t   a t t e n d i n g   o r   n o t   a t t e n d i n g   a n   E C P o b .   t o t a l   60 + × 100
% Highest educational
attainment
P o b . 60 +   b y   e d u c a t i o n a l   l e v e l   r e a c h e d P o b .   t o t a l   60 + × 100
Economic
conditions
% Of activities according to work situation P o b . 60 +   b y   w o r k   a c t i v i t y P o b .   t o t a l   60 + × 100
Multidimensional poverty
index
P o b . 60 +   w i t h   d e p r i v a t i o n P o b .   t o t a l   60 + × 100
Note: Own elaboration.
Table 2. Summary of test statistics and significance.
Statistic (W)NMinimumMaximumMean
680.3500.9960.890
Significance (p-value)680.0001.0000.310
Note: Own elaboration.
Table 3. Indicator groups and identification labels.
Group Indicators Label Urban Area Label Rural Area
G1. Education% Older People in: IlliteracyACAR
% Old People Level of Studies: Academic AverageMACMAR
% Old People Level of Studies: TechnologistTgCTgR
% Old People Level of Studies: UniversityUCUR
% Older People Who Do Not Attend an Educational CenterICIR
G2. Socio-economicMultidimensional Poverty Index of Older PeopleIPM60CIPM60R
% Older People Living on RetirementVJCVJR
G3. Sense Morbidity and Disability% Older People Who Were SickECER
% Older People with Physical LimitationsLFCLFR
Disability RateTDCTDR
Disability Expectation at BirthEDCEDR
Disability Expectation > 60 yearsED60CED60R
G4. MortalitySpecific Mortality Rate of Older PeopleTEMCTEMR
G5. Health Care% Older People Who Did Not Receive Health CareNAtnCNAtnR
% Older People who Reported Very Poor Quality of Health CareCMMCCMMR
G6. DFLENDisability-Free Life Expectancy at BirthEVLDCEVLDR
G7. DFLE60Disability-Free Life Expectancy > 60 yearsEVLD60CEVLD60R
Note: Own elaboration.
Table 4. DFLE and DE by sex and area in Colombia 2018.
National Men Woman
LE at Birth73.379.8
LE Urban74.280.3
LE Rural71.278.2
DFLE66.971.5
DFLE Urban67.772.1
DFLE Rural63.167.7
DE6.48.3
DE Urban6.48.2
DE Rural8.110.4
Note: Own elaboration from NCPH, 2018.
Table 5. Descriptive statistics of LE and DFLE by sex in Colombia 2018.
National Rango Mínimum Máximum Average Deviation
LE at Birth Men16.660.377.071.63.6935
LE at Birth Women15.166.982.078.13.3059
DFLE Men16.454.470.865.63.5711
DFLE Women17.160.577.670.33.1989
Note: Own elaboration from NCPH, 2018.
Table 6. LE60, DFLE60, and DE60 by sex in Colombia 2018.
NationalMenWomen
LE6021.124.1
LE60 Urban21.324.2
LE60 Rural20.623.6
DFLE6016.418.0
DFLE60 Urban16.718.4
DFLE60 Rural14.516.0
DE604.66.1
DE60 Urban4.65.9
DE60 Rural6.07.6
Note: Own elaboration from NCPH, 2018.
Table 7. Summary of strong correlations in both sexes, Colombia 2018.
Social Conditions Variables Pearson Coefficient
DFLE MenDFLE Women
Sense Morbidity and DisabilitySick Yes−0.41−0.41
Physical Limitation Yes−0.48−0.49
Disability Rate−0.34−0.53
MortalityMortality Rate 60 years0.390.35
Provision of servicesHe Was Treated No−0.72−0.60
Very Good Quality0.360.54
Very Bad Quality−0.33−0.12
Educational situationAlphabet No−0.40−0.65
Attendance No−0.450.55
Preschool−0.52−0.48
Academic or Classical Media0.610.74
Professional or Technological Technique0.520.70
University0.590.62
None−0.31−0.58
Socioeconomic situationLived on retirement, pension, or rent0.480.62
MPI 60 years−0.67−0.64
Note: Own elaboration from NCPH, 2018.
Table 8. Association between indicator groups—urban area, Colombia 2018.
Groups Educational Socioeconomic Sense Morbidity Mortality Health Care DFLE DFLE60
Educational10.740.340.090.200.340.19
Socioeconomic0.7410.200.050.260.220.08
Sense Morbidity0.340.2010.060.140.480.53
Mortality0.090.050.0610.120.260.33
Healthcare0.200.260.140.1210.170.13
DFLE0.340.220.480.260.1710.80
DFLE600.190.080.530.330.130.801
MFA0.670.580.640.460.480.750.71
Note: Own elaboration.
Table 9. Association of indicator groups—rural area, Colombia 2018.
Groups Educational Socioeconomic Sense Morbidity Mortality Health Care DFLE DFLE60
Educational10.810.360.080.250.290.07
Socioeconomic0.8110.210.150.220.30.04
Sense Morbidity0.360.2110.220.170.340.52
Mortality0.080.150.2210.040.040.09
Healthcare0.250.220.170.0410.330.09
DFLE0.290.30.340.040.3310.33
DFLE600.070.040.520.090.090.331
MFA0.710.670.670.380.540.630.49
Note: Own elaboration.
Disclaimer/Publisher’s Note: The statements, opinions and data contained in all publications are solely those of the individual author(s) and contributor(s) and not of MDPI and/or the editor(s). MDPI and/or the editor(s) disclaim responsibility for any injury to people or property resulting from any ideas, methods, instructions or products referred to in the content.