
Changes in Physical Performance among Community-Dwelling Older Adults in Six Years

 ,
,  and
and
Abstract
1. Introduction
2. Materials and Methods
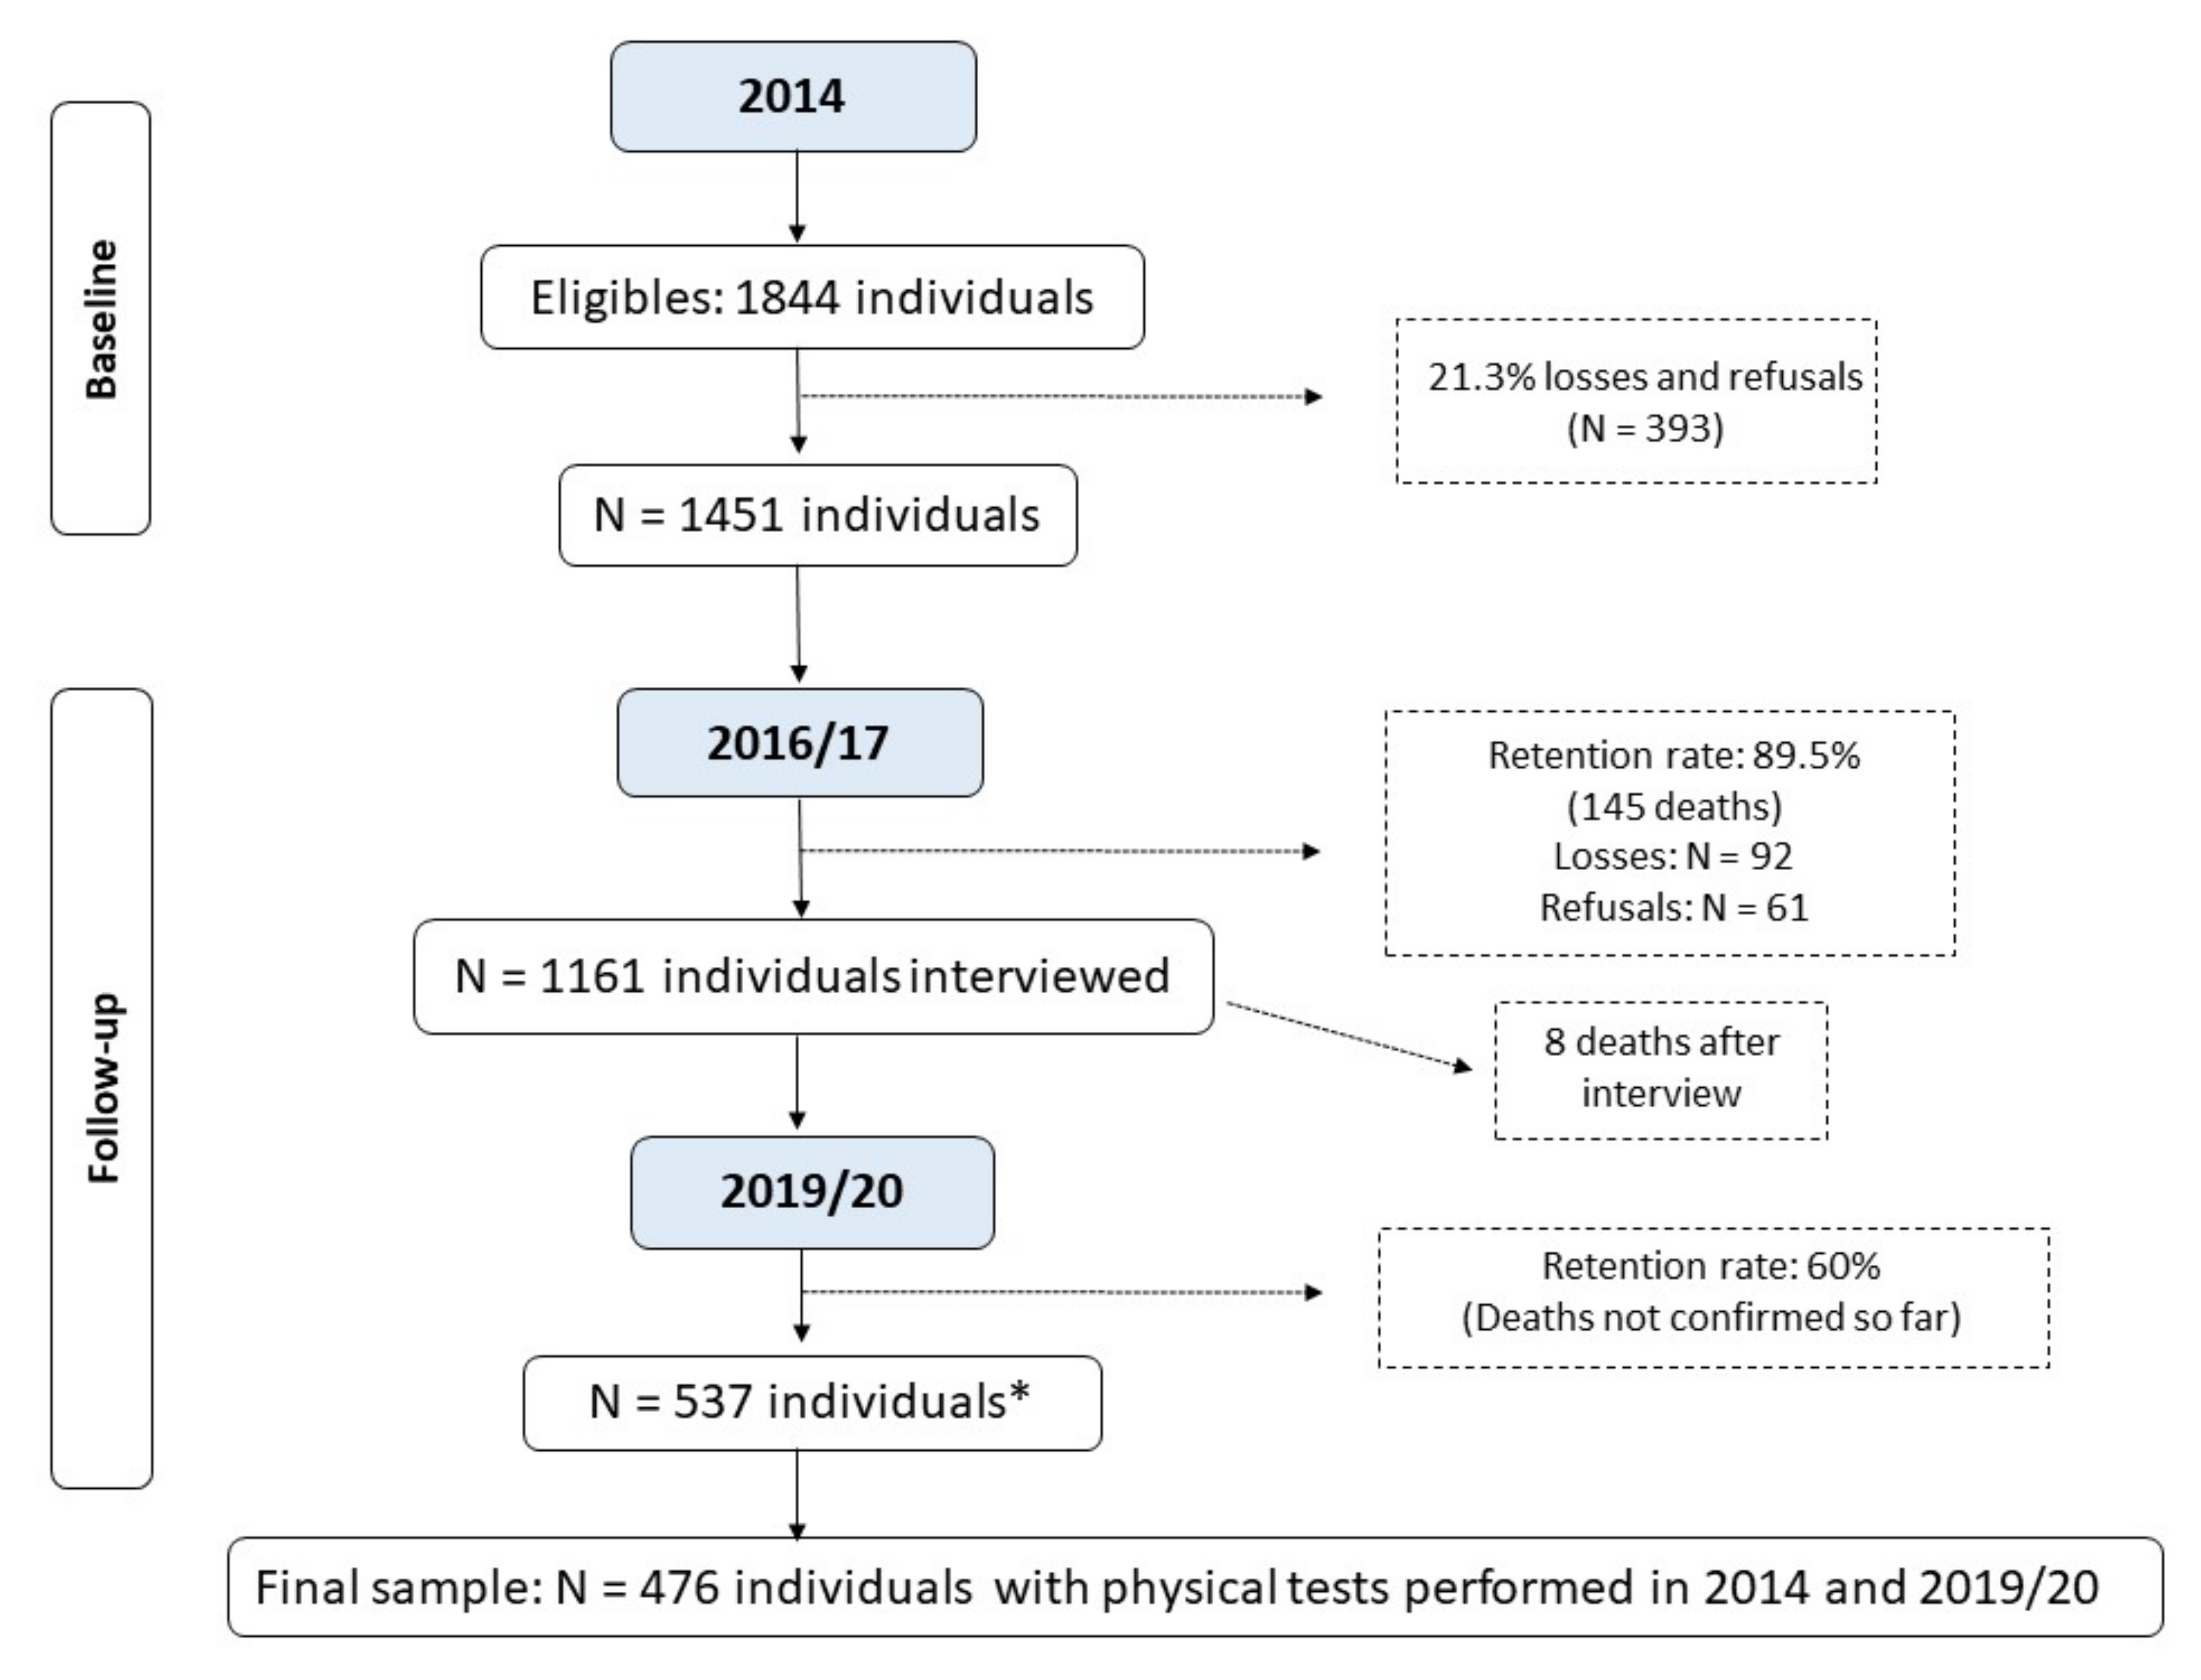
2.1. Study Population and Participant Recruitment
2.2. Assessment and Categorization of Physical Performance
2.3. Covariates at Baseline
2.4. Statistical Analysis
3. Results
4. Discussion
5. Conclusions
Supplementary Materials
Author Contributions
Funding
Institutional Review Board Statement
Informed Consent Statement
Data Availability Statement
Conflicts of Interest
References
- Middleton, A.; Fritz, S.L.; Lusardi, M. Walking Speed: The Functional Vital Sign. J. Aging Phys. Act. 2015, 23, 314–322. [Google Scholar] [CrossRef] [PubMed]
- Abellan Van Kan, G.; Rolland, Y.; Andrieu, S.; Bauer, J.; Beauchet, O.; Bonnefoy, M.; Cesari, M.; Donini, L.M.; Gillette-Guyonnet, S.; Inzitari, M.; et al. Gait speed at usual pace as a predictor of adverse outcomes in community-dwelling older people an International Academy on Nutrition and Aging (IANA) Task Force. J. Nutr. Health Aging 2009, 13, 881–889. [Google Scholar] [CrossRef] [PubMed]
- Bortone, I.; Sardone, R.; Lampignano, L.; Castellana, F.; Zupo, R.; Lozupone, M.; Moretti, B.; Giannelli, G.; Panza, F. How gait influences frailty models and health-related outcomes in clinical-based and population-based studies: A systematic review. J. Cachexia Sarcopenia Muscle 2021, 12, 274–297. [Google Scholar] [CrossRef] [PubMed]
- Bergland, A.; Jørgensen, L.; Emaus, N.; Strand, B.H. Mobility as a predictor of all-cause mortality in older men and women: 11.8 year follow-up in the Tromsø study. BMC Health Serv. Res. 2017, 17, 22. [Google Scholar] [CrossRef]
- Longobucco, Y.; Krumpoch, S.; Lauretani, F.; Angileri, V.; Sieber, C.; Marzetti, E.; Calvani, R.; Cherubini, A.; Landi, F.; Bernabei, R.; et al. Gait characteristics in community-dwelling older persons with low skeletal muscle mass and low physical performance. Aging Clin. Exp. Res. 2022, 34, 1563–1571. [Google Scholar] [CrossRef]
- Ferrucci, L.; Cooper, R.; Shardell, M.; Simonsick, E.M.; Schrack, J.A.; Kuh, D. Age-Related Change in Mobility: Perspectives From Life Course Epidemiology and Geroscience. GERONA 2016, 71, 1184–1194. [Google Scholar] [CrossRef]
- Hoekstra, T.; Rojer, A.G.M.; van Schoor, N.M.; Maier, A.B.; Pijnappels, M. Distinct Trajectories of Individual Physical Performance Measures Across 9 Years in 60- to 70-Year-Old Adults. J. Gerontol. Ser. A 2020, 75, 1951–1959. [Google Scholar] [CrossRef]
- Beaudart, C.; Rolland, Y.; Cruz-Jentoft, A.J.; Bauer, J.M.; Sieber, C.; Cooper, C.; Al-Daghri, N.; Araujo de Carvalho, I.; Bautmans, I.; Bernabei, R.; et al. Assessment of Muscle Function and Physical Performance in Daily Clinical Practice: A position paper endorsed by the European Society for Clinical and Economic Aspects of Osteoporosis, Osteoarthritis and Musculoskeletal Diseases (ESCEO). Calcif. Tissue Int. 2019, 105, 1–14. [Google Scholar] [CrossRef]
- Figgins, E.; Choi, Y.-H.; Speechley, M.; Montero-Odasso, M. Associations Between Potentially Modifiable and Nonmodifiable Risk Factors and Gait Speed in Middle- and Older-Aged Adults: Results From the Canadian Longitudinal Study on Aging. J. Gerontol. Ser. A 2021, 76, e253–e263. [Google Scholar] [CrossRef]
- Chung, C.-M.; Shin, S.; Lee, Y.; Lee, D.-Y. Determination of the Predictors with the Greatest Influence on Walking in the Elderly. Medicina 2022, 58, 1640. [Google Scholar] [CrossRef]
- Auyeung, T.W.; Lee, S.W.J.; Leung, J.; Kwok, T.; Woo, J. Age-associated decline of muscle mass, grip strength and gait speed: A 4-year longitudinal study of 3018 community-dwelling older Chinese: Longitudinal decline of muscle mass and function. Geriatr. Gerontol. Int. 2014, 14, 76–84. [Google Scholar] [CrossRef] [PubMed]
- Henchoz, Y.; Büla, C.; von Gunten, A.; Blanco, J.M.; Seematter-Bagnoud, L.; Démonet, J.-F.; Waeber, G.; Nanchen, D.; Santos-Eggimann, B. Trends in Physical and Cognitive Performance Among Community-Dwelling Older Adults in Switzerland. J. Gerontol. Ser. A 2020, 75, 2347–2353. [Google Scholar] [CrossRef] [PubMed]
- Vetrano, D.L.; Rizzuto, D.; Calderón-Larrañaga, A.; Onder, G.; Welmer, A.-K.; Bernabei, R.; Marengoni, A.; Fratiglioni, L. Trajectories of functional decline in older adults with neuropsychiatric and cardiovascular multimorbidity: A Swedish cohort study. PLoS Med. 2018, 15, e1002503. [Google Scholar] [CrossRef] [PubMed]
- Yang, R.; Xu, D.; Wang, H.; Xu, J. Longitudinal trajectories of physical functioning among Chinese older adults: The role of depressive symptoms, cognitive functioning and subjective memory. Age Ageing 2021, 50, 1682–1691. [Google Scholar] [CrossRef]
- Taniguchi, Y.; Fujiwara, Y.; Murayama, H.; Yokota, I.; Matsuo, E.; Seino, S.; Nofuji, Y.; Nishi, M.; Matsuyama, Y.; Shinkai, S. Prospective Study of Trajectories of Physical Performance and Mortality Among Community-Dwelling Older Japanese. GERONA 2016, 71, 1492–1499. [Google Scholar] [CrossRef]
- Podsiadlo, D.; Richardson, S. The Timed “Up & Go”: A Test of Basic Functional Mobility for Frail Elderly Persons. J. Am. Geriatr. Soc. 1991, 39, 142–148. [Google Scholar] [CrossRef]
- IBGE. Censo 2010 [Internet]. Instituto Brasileiro de Geografia e Estatística. Available online: https://biblioteca.ibge.gov.br/visualizacao/periodicos/93/cd_2010_caracteristicas_populacao_domicilios.pdf (accessed on 6 September 2022).
- Barbosa-Silva, T.G.; Bielemann, R.M.; Gonzalez, M.C.; Menezes, A.M.B. Prevalence of sarcopenia among community-dwelling elderly of a medium-sized South American city: Results of the COMO VAI ? study: Sarcopenia prevalence in a South American city. J. Cachexia Sarcopenia Muscle 2016, 7, 136–143. [Google Scholar] [CrossRef]
- Farías-Antúnez, S.; Fassa, A.G. Prevalência e fatores associados à fragilidade em população idosa do Sul do Brasil, 2014. Epidemiol. Serv. Saúde 2019, 28, e2017405. [Google Scholar] [CrossRef]
- Perera, S.; Mody, S.H.; Woodman, R.C.L.; Studenski, S.A. Meaningful Change and Responsiveness in Common Physical Performance Measures in Older Adults: MEANINGFUL CHANGE AND PERFORMANCE. J. Am. Geriatr. Soc. 2006, 54, 743–749. [Google Scholar] [CrossRef]
- ABEP. Critério de Classificação Econômica Brasil Associação Brasileira de Empresas de Pesquisa. 2014. Available online: https://www.abep.org/criterio-brasil (accessed on 20 September 2022).
- Gomes, A.P.; Soares, A.L.G.; Gonçalves, H. Baixa qualidade da dieta de idosos: Estudo de base populacional no sul do Brasil. Ciênc. Saúde Coletiva 2016, 21, 3417–3428. [Google Scholar] [CrossRef]
- Craig, C.L.; Marshall, A.L.; Sjöström, M.; Bauman, A.E.; Booth, M.L.; Ainsworth, B.E.; Pratt, M.; Ekelund, U.; Yngve, A.; Sallis, J.F.; et al. International Physical Activity Questionnaire: 12-Country Reliability and Validity. Med. Sci. Sport. Exerc. 2003, 35, 1381–1395. [Google Scholar] [CrossRef] [PubMed]
- Montes, M.C.; Bortolotto, C.C.; Tomasi, E.; Gonzalez, M.C.; Barbosa-Silva, T.G.; Domingues, M.R.; Bielemann, R.M. Strength and multimorbidity among community-dwelling elderly from southern Brazil. Nutrition 2020, 71, 110636. [Google Scholar] [CrossRef] [PubMed]
- Yesavage, J.A.; Brink, T.L.; Rose, T.L.; Lum, O.; Huang, V.; Adey, M.; Leirer, V.O. Development and validation of a geriatric depression screening scale: A preliminary report. J. Psychiatr. Res. 1982, 17, 37–49. [Google Scholar] [CrossRef] [PubMed]
- Almeida, O.P.; Almeida, S.A. Short versions of the geriatric depression scale: A study of their validity for the diagnosis of a major depressive episode according to ICD-10 and DSM-IV. Int. J. Geriatr. Psychiatry 1999, 14, 858–865. [Google Scholar] [CrossRef]
- Ramos, L.R.; Tavares, N.U.L.; Bertoldi, A.D.; Farias, M.R.; Oliveira, M.A.; Luiza, V.L.; da Silva Dal Pizzol, T.; Arrais, P.S.D.; Mengue, S.S.; Ramos, L.R.; et al. Polifarmácia e polimorbidade em idosos no Brasil: Um desafio em saúde pública. Rev. De Saúde Pública 2016, 50, s1518–s8787. [Google Scholar]
- Lipschitz, D.A. Screening for nutritional status in the elderly. Prim. Care 1994, 21, 55–67. [Google Scholar] [CrossRef]
- Pinter, D.; Ritchie, S.J.; Gattringer, T.; Bastin, M.E.; del C. Valdés Hernández, M.; Corley, J.; Maniega, S.M.; Pattie, A.; Dickie, D.A.; Gow, A.J.; et al. Predictors of gait speed and its change over three years in community-dwelling older people. Aging 2018, 10, 144–153. [Google Scholar] [CrossRef]
- Figgins, E.; Pieruccini-Faria, F.; Speechley, M.; Montero-Odasso, M. Potentially modifiable risk factors for slow gait in community-dwelling older adults: A systematic review. Ageing Res. Rev. 2021, 66, 101253. [Google Scholar] [CrossRef]
- Dong, X.; Bergren, S.M.; Simon, M.A. The Decline of Directly Observed Physical Function Performance Among U.S. Chinese Older Adults. J. Gerontol. Ser. A 2017, 72, S11–S15. [Google Scholar] [CrossRef]
- Inzitari, M.; Carlo, A.; Baldereschi, M.; Pracucci, G.; Maggi, S.; Gandolfo, C.; Bonaiuto, S.; Farchi, G.; Scafato, E.; Carbonin, P.; et al. Risk and Predictors of Motor-Performance Decline in a Normally Functioning Population-Based Sample of Elderly Subjects: The Italian Longitudinal Study on Aging: Motor-performance decline in older people. J. Am. Geriatr. Soc. 2006, 54, 318–324. [Google Scholar] [CrossRef]
- Cruz-Jentoft, A.J.; Bahat, G.; Bauer, J.; Boirie, Y.; Bruyère, O.; Cederholm, T.; Cooper, C.; Landi, F.; Rolland, Y.; Sayer, A.A.; et al. Sarcopenia: Revised European consensus on definition and diagnosis. Age Ageing 2019, 48, 16–31. [Google Scholar] [CrossRef] [PubMed]
- Bruyère, O.; Beaudart, C.; Reginster, J.-Y.; Buckinx, F.; Schoene, D.; Hirani, V.; Cooper, C.; Kanis, J.A.; Rizzoli, R.; McCloskey, E.; et al. Assessment of muscle mass, muscle strength and physical performance in clinical practice: An international survey. Eur. Geriatr. Med. 2016, 7, 243–246. [Google Scholar] [CrossRef]
- Santoni, G.; Angleman, S.; Welmer, A.-K.; Mangialasche, F.; Marengoni, A.; Fratiglioni, L. Age-Related Variation in Health Status after Age 60. PLoS ONE 2015, 10, e0120077. [Google Scholar] [CrossRef]
- Lee, A.; Bhatt, T.; Smith-Ray, R.L.; Wang, E.; Pai, Y.-C. (Clive) Gait Speed and Dynamic Stability Decline Accelerates Only in Late Life: A Cross-sectional Study in Community-Dwelling Older Adults. J. Geriatr. Phys. Ther. 2019, 42, 73–80. [Google Scholar] [CrossRef] [PubMed]
- Aartolahti, E.; Lönnroos, E.; Hartikainen, S.; Häkkinen, A. Long-term strength and balance training in prevention of decline in muscle strength and mobility in older adults. Aging Clin. Exp. Res. 2020, 32, 59–66. [Google Scholar] [CrossRef]
- Pacheco, T.B.F.; de Medeiros, C.S.P.; de Oliveira, V.H.B.; Vieira, E.R.; de Cavalcanti, F.A.C. Effectiveness of exergames for improving mobility and balance in older adults: A systematic review and meta-analysis. Syst. Rev. 2020, 9, 163. [Google Scholar] [CrossRef]
- Laddu, D.R.; Parimi, N.; Stone, K.L.; Lapidus, J.; Hoffman, A.R.; Stefanick, M.L.; Langsetmo, L. Physical Activity Trajectories and Associated Changes in Physical Performance in Older Men: The MrOS Study. J. Gerontol. Ser. A 2020, 75, 1967–1973. [Google Scholar] [CrossRef] [PubMed]
- de Almeida Busch, T.; Duarte, Y.A.; Pires Nunes, D.; Lebrão, M.L.; Satya Naslavsky, M.; dos Santos Rodrigues, A.; Amaro, E. Factors associated with lower gait speed among the elderly living in a developing country: A cross-sectional population-based study. BMC Geriatr. 2015, 15, 35. [Google Scholar] [CrossRef]
- Calderón-Larrañaga, A.; Hu, X.; Haaksma, M.; Rizzuto, D.; Fratiglioni, L.; Vetrano, D.L. Health trajectories after age 60: The role of individual behaviors and the social context. Aging 2021, 13, 19186–19206. [Google Scholar] [CrossRef]
- Hardy, R.; Cooper, R.; Aihie Sayer, A.; Ben-Shlomo, Y.; Cooper, C.; Deary, I.J.; Demakakos, P.; Gallacher, J.; Martin, R.M.; McNeill, G.; et al. Body Mass Index, Muscle Strength and Physical Performance in Older Adults from Eight Cohort Studies: The HALCyon Programme. PLoS ONE 2013, 8, e56483. [Google Scholar] [CrossRef]
- Kalinkovich, A.; Livshits, G. Sarcopenic obesity or obese sarcopenia: A cross talk between age-associated adipose tissue and skeletal muscle inflammation as a main mechanism of the pathogenesis. Ageing Res. Rev. 2017, 35, 200–221. [Google Scholar] [CrossRef] [PubMed]
- Bull, F.C.; Al-Ansari, S.S.; Biddle, S.; Borodulin, K.; Buman, M.P.; Cardon, G.; Carty, C.; Chaput, J.-P.; Chastin, S.; Chou, R.; et al. World Health Organization 2020 guidelines on physical activity and sedentary behaviour. Br. J. Sport. Med. 2020, 54, 1451–1462. [Google Scholar] [CrossRef] [PubMed]
- Blasco-Lafarga, C.; Cordellat, A.; Forte, A.; Roldán, A.; Monteagudo, P. Short and Long-Term Trainability in Older Adults: Training and Detraining Following Two Years of Multicomponent Cognitive—Physical Exercise Training. Int. J. Environ. Res. Public Health 2020, 17, 5984. [Google Scholar] [CrossRef] [PubMed]
- Fernández-García, Á.I.; Moradell, A.; Navarrete-Villanueva, D.; Subías-Perié, J.; Pérez-Gómez, J.; Ara, I.; González-Gross, M.; Casajús, J.A.; Vicente-Rodríguez, G.; Gómez-Cabello, A. Effects of Multicomponent Training Followed by a Detraining Period on Frailty Level and Functional Capacity of Older Adults with or at Risk of Frailty: Results of 10-Month Quasi-Experimental Study. J. Environ. Res. Public Health 2022, 19, 12417. [Google Scholar] [CrossRef]
- Rogers, M.A.; Evans, W.J. Changes in skeletal muscle with aging: Effects of exercise training. Exerc. Sport Sci. Rev. 1993, 21, 65–102. [Google Scholar] [CrossRef]
- Nguyen, A.T.; Nguyen, H.T.T.; Nguyen, H.T.T.; Nguyen, T.X.; Nguyen, T.N.; Nguyen, T.T.H.; Nguyen, A.L.; Pham, T.; Vu, H.T.T. Walking Speed Assessed by 4-Meter Walk Test in the Community-Dwelling Oldest Old Population in Vietnam. J. Environ. Res. Public Health 2022, 19, 9788. [Google Scholar] [CrossRef]
- Destro, J.R.; Boing, A.F.; d’Orsi, E. Factors associated to medical consultations by elderly adults in southern Brazil: A population based study. Rev. Bras. Epidemiol. 2014, 17, 692–704. [Google Scholar] [CrossRef]
- Coelho-Junior, H.J.; Uchida, M.C.; Gonçalves, I.O.; Calvani, R.; Rodrigues, B.; Picca, A.; Onder, G.; Landi, F.; Bernabei, R.; Marzetti, E. Age- and Gender-Related Changes in Physical Function in Community-Dwelling Brazilian Adults Aged 50 to 102 Years. J. Geriatr. Phys. Ther. 2021, 44, E123–E131. [Google Scholar] [CrossRef]
- Melsæter, K.N.; Tangen, G.G.; Skjellegrind, H.K.; Vereijken, B.; Strand, B.H.; Thingstad, P. Physical performance in older age by sex and educational level: The HUNT Study. BMC Geriatr. 2022, 22, 821. [Google Scholar] [CrossRef]
- Sialino, L.D.; Schaap, L.A.; van Oostrom, S.H.; Picavet, H.S.J.; Twisk, J.W.R.; Verschuren, W.M.M.; Visser, M.; Wijnhoven, H.A.H. The sex difference in gait speed among older adults: How do sociodemographic, lifestyle, social and health determinants contribute? BMC Geriatr. 2021, 21, 340. [Google Scholar] [CrossRef]
- Vargas, P.M.; Schneider, B.C.; Costa, C.S.; César, J.A.; Bertoldi, A.D.; Tomasi, E.; Demarco, F.F.; Gonzalez, M.C.; Bielemann, R.M. Age is the most important factor for change in body mass index and waist circumference in older people in southern Brazil. Nutrition 2023, 109, 111956. [Google Scholar] [CrossRef] [PubMed]


| Complete Sample in 2014 | Study Sample in 2019 | |||
|---|---|---|---|---|
| Variables | n= 1451 | % (95%CI) a | n = 476 | % (95%CI) a |
| Sex Female Male Age (completed years) | 914 537 | 63.0 (60.5; 65.4) 37.0 (34.6; 39.5) | 310 166 | 65.1 (60.7; 69.3) 34.9 (30.7; 39.3) |
| 60–69 70–79 80+ | 756 460 230 | 52.3 (49.7; 54.9) 31.8 (29.5; 34.3) 15.9 (14.1; 17.9) | 289 151 36 | 60.7 (56.2; 65.0) 31.7 (27.7; 36.1) 7.6 (5.5; 10.3) |
| Skin color | ||||
| White | 1211 | 83.7 (81.7; 85.6) | 389 | 81.7 (78.0; 85.0) |
| Other than white | 236 | 16.3 (14.5; 18.3) | 87 | 18.3 (15.0; 22.0) |
| Marital status | ||||
| Married/with a partner | 763 | 52.7 (50.2; 55.3) | 286 | 60.1 (55.6; 64.4) |
| Without a partner/separated | 225 | 15.6 (13.8; 17.6) | 72 | 15.1 (12.2; 18.6) |
| Widow(er) | 459 | 31.7 (29.4; 34.2) | 118 | 24.8 (21.1; 28.9) |
| Economic level b | ||||
| A/B | 483 | 35.2 (32.7; 37.8) | 161 | 35.4 (31.1; 39.9) |
| C | 720 | 52.5 (49.8; 55.1) | 248 | 54.5 (49.9; 59.0) |
| D/E | 169 | 12.3 (10.7; 14.2) | 46 | 10.1 (7.7; 13.2) |
| Education level (completed years) | ||||
| None 1–7 ≥8 | 196 782 459 | 13.6 (12.0; 15.5) 54.4 (51.8; 57.0) 32.0 (29.6; 34.4) | 54 270 151 | 11.4 (8.8; 14.6) 56.8 (52.3; 61.2) 31.8 (27.7; 36.1) |
| Current work situation | ||||
| No (unemployed) | 1084 | 80.4 (78.2; 82.4) | 344 | 77.0 (72.8; 80.6) |
| Yes (employed) | 264 | 19.6 (17.6; 21.8) | 103 | 23.0 (19.4; 27.2) |
| Diet quality c | ||||
| Low | 481 | 33.7 (31.3; 36.2) | 143 | 30.2 (26.3; 34.6) |
| Average | 534 | 37.5 (35.0; 40.0) | 177 | 37.5 (33.2; 41.9) |
| High | 411 | 28.8 (26.5; 31.2) | 153 | 32.3 (28.3; 36.7) |
| Leisure-time physical activity (>150 min/week) d | ||||
| No | 1133 | 81.5 (79.3; 83.4) | 378 | 80.4 (76.6; 83.8) |
| Yes | 258 | 18.5 (16.6; 20.7) | 92 | 19.6 (16.2; 23.4) |
| Smoking | ||||
| Not a smoker | 781 | 54.0 (51.4; 56.6) | 262 | 55.0 (50.5; 59.5) |
| Smoker | 182 | 12.6 (11.0; 14.4) | 58 | 12.2 (9.5; 15.5) |
| Former smoker | 483 | 33.4 (31.0; 35.9) | 156 | 32.8 (28.7; 37.1) |
| Alcohol consumption e | ||||
| No | 1138 | 78.8 (76.6; 80.8) | 355 | 74.6 (70.5; 78.3) |
| Yes | 307 | 21.2 (19.2; 23.4) | 121 | 25.4 (21.7; 29.5) |
| Multimorbidity | ||||
| Up to 4 diseases | 473 | 35.3 (32.8; 37.9) | 175 | 37.6 (33.3; 42.1) |
| 5 or more diseases | 866 | 64.7 (62.1; 67.2) | 291 | 62.4 (57.9; 66.7) |
| Depression f | ||||
| No | 1182 | 84.8 (82.8; 86.6) | 408 | 86.4 (83.0; 89.3) |
| Yes | 212 | 15.2 (13.4; 17.2) | 64 | 13.6 (10.7; 17.0) |
| Polypharmacy g | ||||
| No | 513 | 35.6 (33.1; 38.1) | 150 | 31.5 (27.5; 35.8) |
| Yes | 929 | 64.4 (61.9; 66.9) | 326 | 68.5 (64.2; 72.5) |
| BMI h | ||||
| Low weight | 126 | 9.2 (7.8; 10.9) | 26 | 5.5 (3.8; 8.0) |
| Normal | 471 | 34.5 (32.1; 37.1) | 152 | 32.1 (28.1; 36.4) |
| Overweight | 767 | 56.3 (53.6; 58.8) | 295 | 62.4 (57.9; 66.6) |
| Variables | GS p-Value a 2019–2014 Difference (95% CI) | TUG p-Value a 2019–2014 Difference (95% CI) |
|---|---|---|
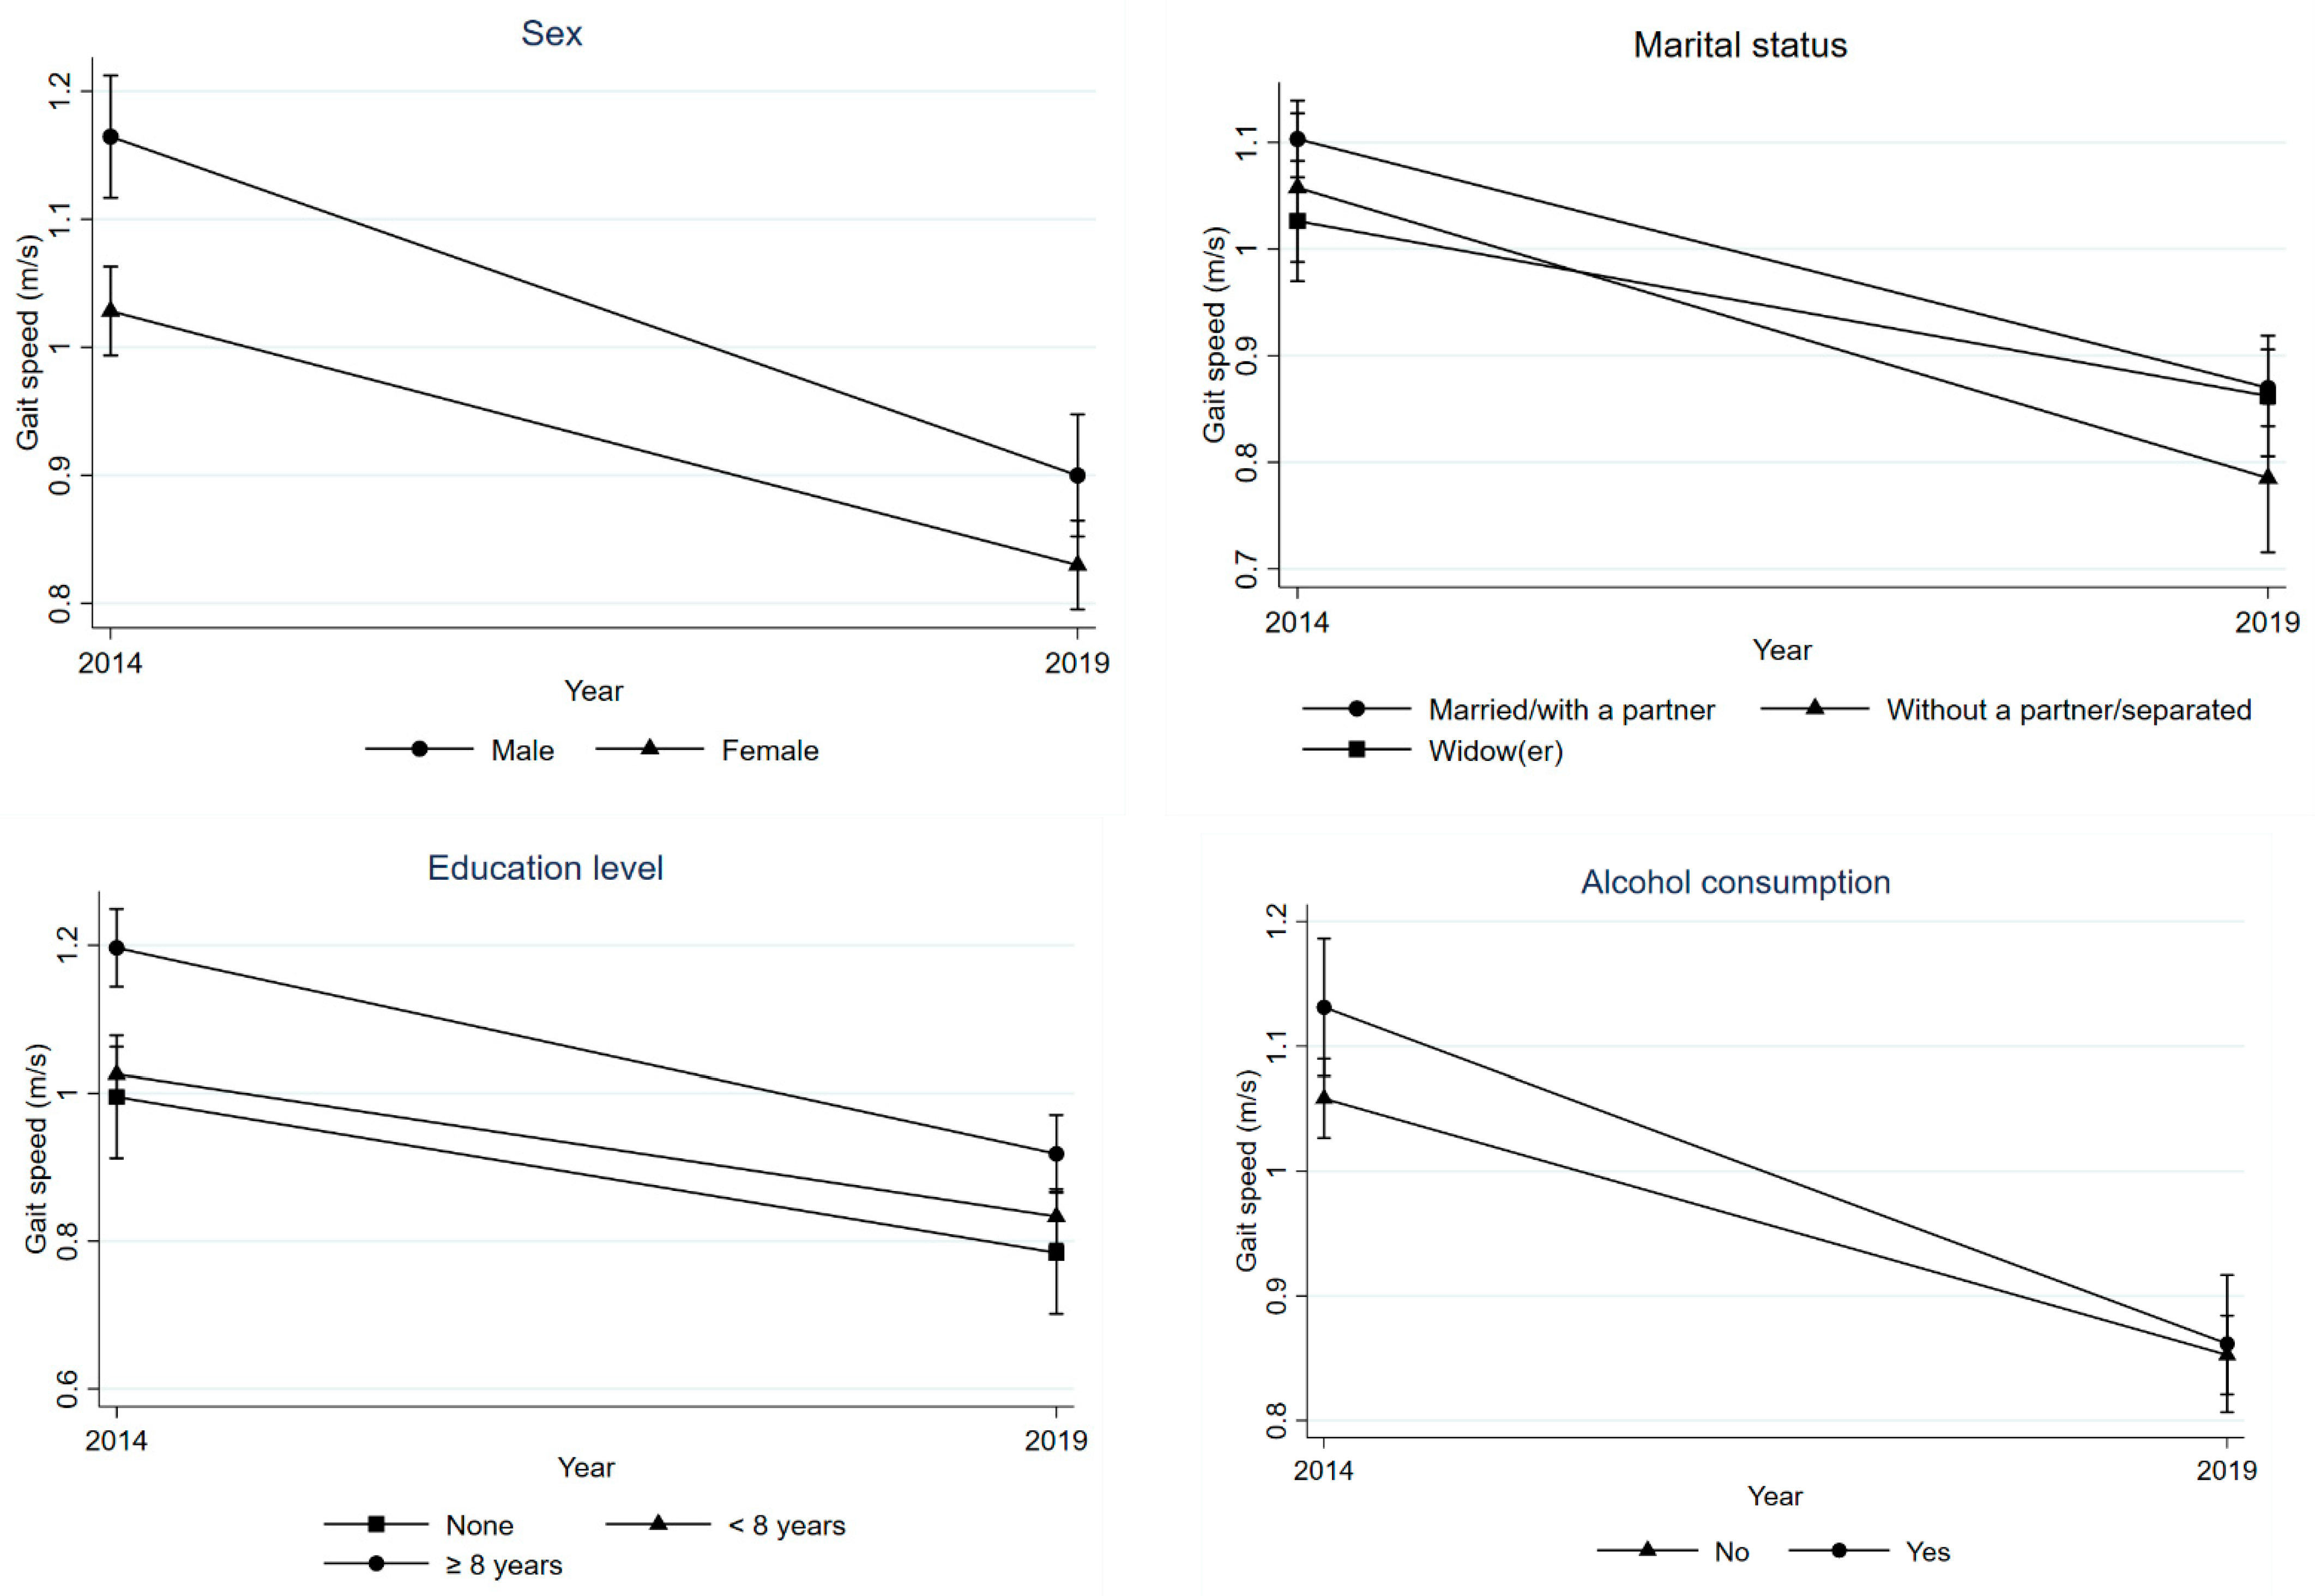
| Sex Male Female Age (completed years) | p = 0.023 −0.26 (−0.31; −0.22) −0.20 (−0.23; −0.16) p = 0.88 | p = 0.32 2.62 (1.19; 4.05) 1.71 (0.66; 2.76) p < 0.001 |
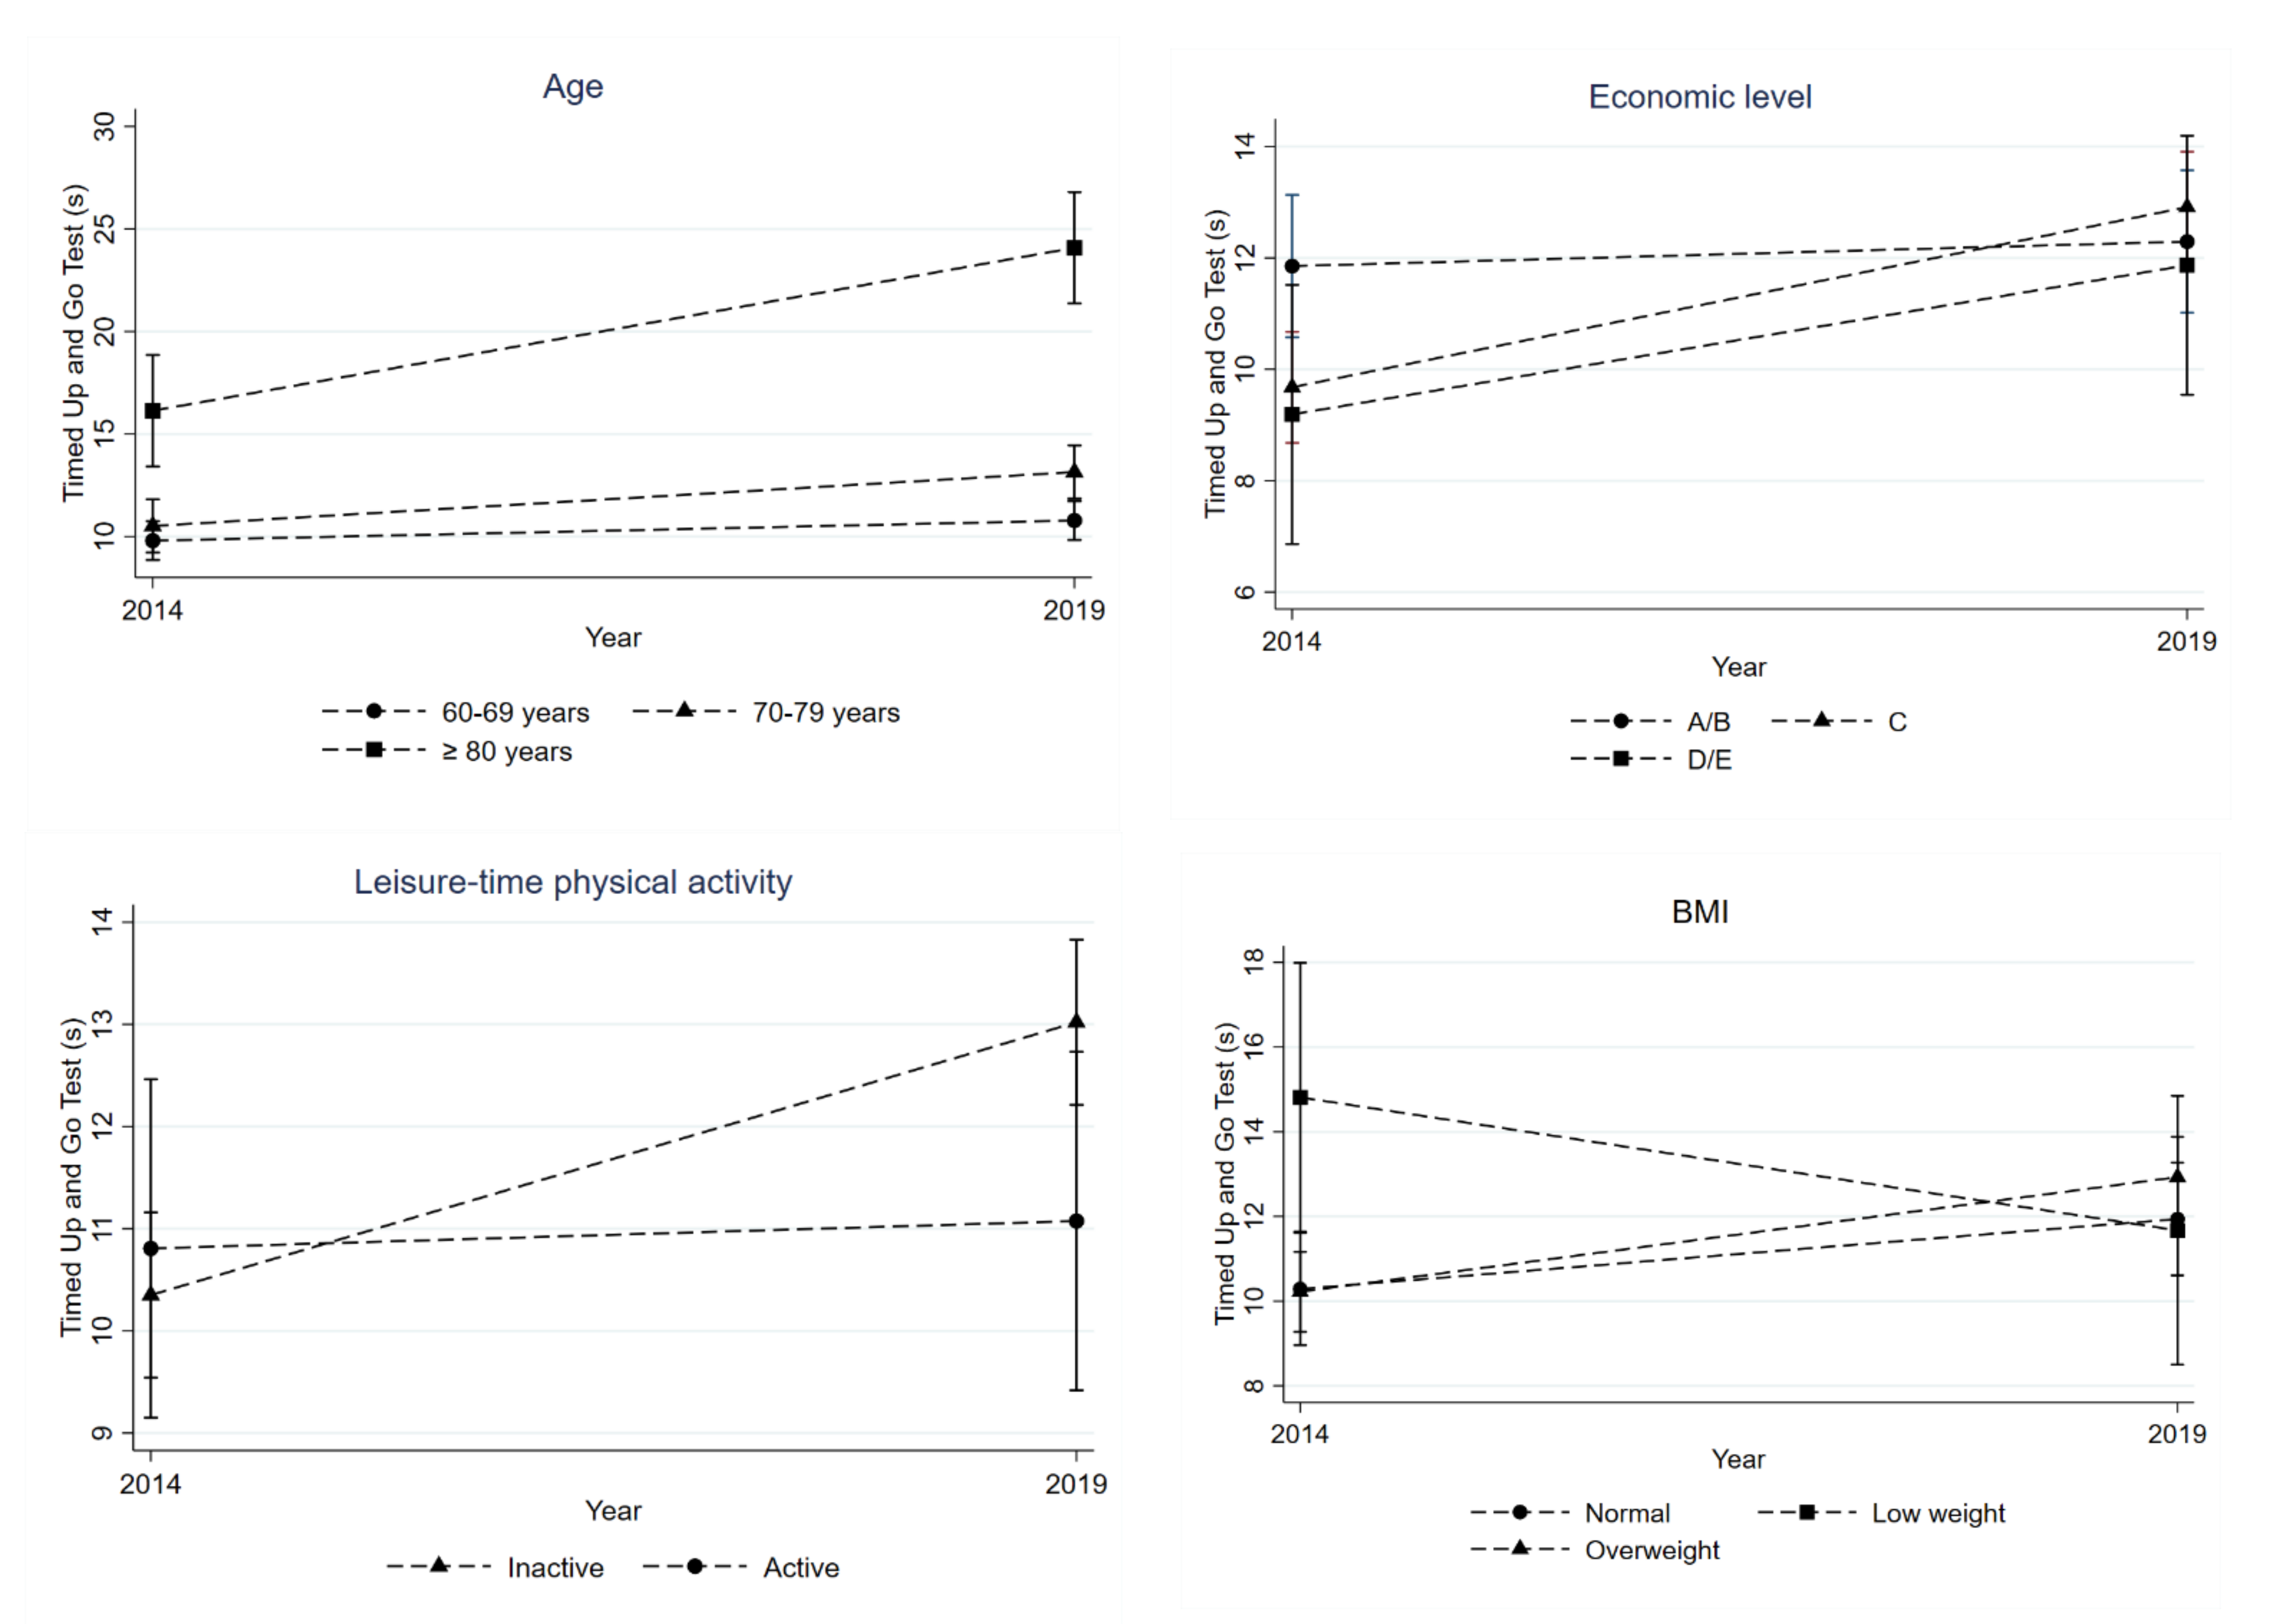
| 60–69 70–79 80+ | −0.22 (−0.25; −0.18) −0.23 (−0.28; −0.18) −0.24 (−0.34; −0.14) | 0.98 (−0.09; 2.05) 2.63 (1.16; 4.10) 7.95 (4.91; 10.98) |
| Skin color | p = 0.70 | p = 0.20 |
| White | −0.22 (−0.25; −0.19) | 1.80 (0.85; 2.75) |
| Other than white | −0.23 (−0.30; −0.17) | 3.26 (1.25; 5.26) |
| Marital status | p = 0.035 | p = 0.35 |
| Married/with a partner | −0.23 (−0.27; −0.20) | 2.30 (1.19; 3.41) |
| Without a partner/separated | −0.27 (−0.34; −0.20) | 2.86 (0.66; 5.06) |
| Widow(er) | −0.16 (−0.22; −0.11) | 1.02 (−0.69; 2.74) |
| Economic level b | p = 0.06 | p = 0.004 |
| A/B | −0.26 (−0.31; −0.22) | 0.44 (−0.84; 1.72) |
| C | −0.21 (−0.24; −0.17) | 3.23 (2.18; 4.29) |
| D/E | −0.16 (−0.25; −0.08) | 2.68 (0.28; 5.08) |
| Education level (completed years) | p = 0.019 | p = 0.14 |
| None 1–7 ≥8 | −0.21 (−0.29; −0.13) −0.19 (−0.23; −0.16) −0.28 (−0.33; −0.23) | 3.87 (1.38; 6.35) 2.22 (1.10; 3.35) 1.01 (−0.50; 2.51) |
| Current work situation | p = 0.91 | p = 0.45 |
| No (unemployed) | −0.22 (−0.28; −0.17) | 2.29 (1.36; 3.22) |
| Yes (employed) | −0.22 (−0.25; −0.19) | 1.55 (−0.14; 3.24) |
| Diet quality c | p = 0.82 | p = 0.80 |
| Low | −0.23 (−0.28; −0.19) | 2.21 (0.78; 3.63) |
| Average | −0.22 (−0.26; −0.18) | 2.44 (1.18; 3.71) |
| High | −0.21 (−0.26; −0.16) | 1.81 (0.44; 3.19) |
| Leisure-time physical activity (>150 min/week) d | p = 0.72 | p = 0.017 |
| No | −0.22 (−0.25; −0.19) | 2.67 (1.80; 3.54) |
| Yes | −0.23 (−0.30; −0.17) | 0.27 (−1.51; 2.04) |
| Smoking | p = 0.72 | p = 0.93 |
| Not a smoker | −0.21 (−0.25; −0.17) | 1.92 (0.77; 3.08) |
| Smoker | −0.24 (−0.32; −0.17) | 2.42 (−0.05; 4.88) |
| Former smoker | −0.23 (−0.28; −0.18) | 2.17 (0.66; 3.68) |
| Alcohol consumption e | p = 0.045 | p = 0.11 |
| No | −0.21 (−0.24; −0.17) | 2.48 (1.48; 3.47) |
| Yes | −0.27 (−0.32; −0.22) | 0.86 (−0.84; 2.56) |
| Multimorbidity | p = 0.69 | p = 0.07 |
| Up to 4 diseases | −0.22 (−0.26; −0.17) | 1.21 (−0.08; 2.50) |
| 5 or more diseases | −0.23 (−0.26; −0.19) | 2.70 (1.71; 3.70) |
| Depression f | p = 0.51 | p = 0.89 |
| No | −0.23 (−0.26; −0.20) | 2.14 (1.30; 2.98) |
| Yes | −0.20 (−0.27; −0.13) | 2.31 (0.23; 4.38) |
| Polypharmacy g | p = 0.22 | p = 0.34 |
| No | −0.20 (−0.25; −0.15) | 1.44 (−0.11; 2.98) |
| Yes | −0.23 (−0.27; −0.20) | 2.34 (1.31; 3.38) |
| Body Mass Index h | p = 0.33 | p = 0.007 |
| Low weight | −0.18 (−0.29; −0.06) | −3.14 (−6.71; 0.42) |
| Normal | −0.25 (−0.30; −0.20) | 1.65 (0.16; 3.15) |
| Overweight | −0.21 (−0.25; −0.18) | 2.71 (1.64; 3.78) |
Disclaimer/Publisher’s Note: The statements, opinions and data contained in all publications are solely those of the individual author(s) and contributor(s) and not of MDPI and/or the editor(s). MDPI and/or the editor(s) disclaim responsibility for any injury to people or property resulting from any ideas, methods, instructions or products referred to in the content. |
© 2023 by the authors. Licensee MDPI, Basel, Switzerland. This article is an open access article distributed under the terms and conditions of the Creative Commons Attribution (CC BY) license (https://creativecommons.org/licenses/by/4.0/).
Share and Cite
Gomes, D.R.d.P.; Santos, L.P.; Gonzalez, M.C.; Vieira, E.R.; Bielemann, R.M. Changes in Physical Performance among Community-Dwelling Older Adults in Six Years. Int. J. Environ. Res. Public Health 2023, 20, 5579. https://doi.org/10.3390/ijerph20085579
Gomes DRdP, Santos LP, Gonzalez MC, Vieira ER, Bielemann RM. Changes in Physical Performance among Community-Dwelling Older Adults in Six Years. International Journal of Environmental Research and Public Health. 2023; 20(8):5579. https://doi.org/10.3390/ijerph20085579
Chicago/Turabian StyleGomes, Darlise Rodrigues dos Passos, Leonardo Pozza Santos, Maria Cristina Gonzalez, Edgar Ramos Vieira, and Renata Moraes Bielemann. 2023. "Changes in Physical Performance among Community-Dwelling Older Adults in Six Years" International Journal of Environmental Research and Public Health 20, no. 8: 5579. https://doi.org/10.3390/ijerph20085579
APA StyleGomes, D. R. d. P., Santos, L. P., Gonzalez, M. C., Vieira, E. R., & Bielemann, R. M. (2023). Changes in Physical Performance among Community-Dwelling Older Adults in Six Years. International Journal of Environmental Research and Public Health, 20(8), 5579. https://doi.org/10.3390/ijerph20085579