Abstract
Background: Like other parts of the body, the retina and its neurovascular system are also affected by age-related changes. The rising age of populations worldwide makes it important to study the pathologies related to age and their potential risk factors, such as diet and eating habits. The aim of this study was to investigate the predictive power of food groups versus retinal features among noninstitutionalized older adults from Southern Italy using a machine learning approach. Methods: We recruited 530 subjects, with a mean age of 74 years, who were drawn from the large population of the Salus in Apulia Study. In the present cross-sectional study, eating habits were assessed with a validated food frequency questionnaire. For the visual assessment, a complete ophthalmic examination and optical coherence tomography-angiography analyses were performed. Results: The analyses identified 13 out of the 28 food groups as predictors of all our retinal variables: grains, legumes, olives-vegetable oil, fruiting vegetables, other vegetables, fruits, sweets, fish, dairy, low-fat dairy, red meat, white meat, and processed meat. Conclusions: Eating habits and food consumption may be important risk factors for age-related retinal changes. A diet that provides the optimal intake of specific nutrients with antioxidant and anti-inflammatory powers, including carotenoids and omega-3 fatty acids, could have beneficial effects.
1. Introduction
In our aging society, age-related diseases are an issue of great public interest. Age is a real risk factor for several chronic inflammatory diseases, altering the structure and/or function of organs and tissues []. Worldwide, the increasing number of subjects over 60 years of age has led to progressively growing interest in age-related clinical disorders and diseases. It is now essential to investigate their principal modifiable risk factors to identify new and possible strategies to prevent or regress retinal damage. The retina and its cellular and microvascular components are among the districts affected by these age-related changes that can impair their function, leading to gradual or sudden visual loss [].
The retinal tissue plays a specific role in processing visual information. It has a complex structure composed of pigment epithelium, photoreceptor cells (rods and cones), and more than 60 distinct types of neuronal cells and their fibers []. The pigment epithelium is rich in melanin cells, highly pigmented, and is called retinal pigment epithelium (RPE). This type of cell plays numerous crucial roles in the health and normal functioning of the retina, including the delivery of nutrients to the photoreceptor cells and the transportation of ions, metabolites, and fluids to the blood-retinal barrier. At the center of the retina is the macula, a highly pigmented area containing the central fovea, affecting the clarity of vision []. The correct functioning of the RPE, the macula, and the central fovea are significant for the health of the retina, and any degeneration can have serious consequences on the visual process. Aging physiologically determines some cellular changes, such as reactive oxygen species (ROS) production, oxidative stress, metabolic dysfunction, and inflammatory responses that can potentially disrupt tissue homeostasis [,,]. This leads to the activation of an adaptation mechanism known as cellular senescence, a cellular response induced by different types of stress that accompanies normal aging []. Disproportionate changes induced by cellular senescence, or a persistent accumulation of senescent cells due to chronic stress, exacerbate the adverse effects of aging and can lead to some clinical illnesses and different chronic disorders, including age-related macular degeneration (AMD) [,,]. AMD is a complex medical condition that damages a part of the retina and the macula and compromises the central vision and the ability to see fine details. It is a socially debilitating condition that reduces the quality of life because it leads to loss of balance, mobility and independence issues, depression, and social isolation [].
AMD is an age-related disease that is currently the first cause of visual impairment and central blindness in the Western population over 65 years of age. Globally, it affects 30–50 million individuals and is expected to increase ten-fold by 2040 []. In Italy, AMD affects one million people, and it is estimated that this number will increase with further population aging []. The National Eye Institute sponsored two clinical trials, The Age-Related Eye Disease Study (AREDS) and AREDS2, to learn more about AMD, its natural history, and risk factors []. The characteristic “drusen” of AMD is caused by hyaline deposits accumulating between the RPE and Bruch’s membrane. The size of the drusen is different in the various disease stages. In the early stages, a small drusen (63 to 124 μm in diameter) is present with hyper/hypopigmentations of the retinal epithelium []. In this stage, mild symptoms may or may not be present, but if they are, they will include blurred vision and impaired dark adaptation []. In the advanced forms, the drusen size increases (by 125 μm in diameter), and moderate to severe visual loss is present [,]. Late AMD can be distinguished as the nonexudative dry AMD (Geographic Atrophy, GA) and the exudative wet form (Neovascular AMD) [].
Moreover, findings in the retina provide a noninvasive way to investigate the systemic health of the human body. Particularly, subjects with an increased risk of liver fibrosis [] or hypertension [] had thinner neuroretinal layers, according to high-resolution retinal scan images taken with optical coherence tomography (OCT) technology. OCT-angiography (OCT-A) allows for the study of retinal health and its microvascular network; this innovative version uses OCT technology to obtain a noninvasive depth-resolved visualization of the retinal microvasculature [,].
The main risk factors related to the development and progression of age-related retinal changes include gender, race, genetics, environmental, lifestyle, and dietary factors. For example, the Caucasian female population over the age of 65 is at greater risk [,]; environmental and lifestyle factors include light exposure and smoking [,]. Chakravarthy and colleagues reported that among older Europeans, the risk of AMD in smokers was 5 and 2.5 times higher for the dry and neurovascular forms, respectively []. Cigarette smoking doubles the risk of developing this condition and causes retinal damage through pro-oxidative and proinflammatory processes [].
In these processes, a clear role could be played by inflammation and oxidative stress []. In fact, another risk factor is a diet with a poor content of vitamins A, C, and E and zinc, lutein, zeaxanthin, and omega-3 fatty acids such as DHA []. Currently, no curative treatment has been identified for AMD. Antivascular-endothelial growth factor (VEGF) drugs are used to treat the wet form, while no therapy is available to slow the progression of dry AMD. In the last decades, several studies have been focused on researching preventive measures and strategies to slow the degeneration related to this condition. AREDS 1 and 2 mainly evaluated the role of some nutrients and nutritional supplementation in preventing and reversing these eye diseases. A diet based on vegetables, fruits, unrefined products, fish, and extra virgin olive oil could be a valuable tool due to its protective properties against various noncommunicable diseases []. Studies demonstrated how adopting proper eating habits also reduces the risk of running into the vascular complications of diabetes, including diabetic retinopathy (DR) []. Oxidative stress and inflammation have also been shown to play a key role in DR pathophysiology [] and antioxidants in its prevention and treatment. The therapeutic role of polyphenols and polyunsaturated fatty acids (PUFA) and the preventive role of vitamin C, vitamin E, lutein, and zeaxanthin have been hypothesized [,,].
More attention should be paid to the dietary and nutritional aspects regarding the prevention and/or treatment of age-related visual degeneration. The present study aimed to investigate the relationship between retinal features and eating habits among noninstitutionalized older adults from Southern Italy using a machine learning approach. This is a new approach that has not been widely used in previous studies on the retina and its components [].
2. Materials and Methods
2.1. Study Design and Population
This cross-sectional population-based study involved 530 subjects aged over 64. This was a subsample drawn from the “Salus in Apulia Study”, a public health initiative promoted by the Italian Ministry of Health and Apulia Regional Government and conducted at IRCCS “S. de Bellis” Research Hospital in Castellana Grotte, Southern Italy. In this study, 4537 individuals were enrolled from 2014 to 2019 in Castellana Grotte. This selection of study participants allowed us to utilize past individual data generated from other investigations. The sample is representative of the entire population of older people (age > 65 years) from Castellana Grotte in 2014, as described elsewhere []. In this study, we analyzed the data from those subjects who had both undergone nutritional and ophthalmological assessments. The IRB of the head institution, the National Institute of Gastroenterology and Research Hospital “S. de Bellis” in Castellana Grotte, Italy, approved the study. The study was conducted according to the Helsinki Declaration of 1975 and adhered to the “Standards for Reporting Diagnostic Accuracy Studies” (STARD) guidelines (http://www.stard-statement.org/ accessed on 22 December 2022). The manuscript was organized according to the “Strengthening the Reporting of Observational Studies in Epidemiology-Nutritional Epidemiology” (STROBE-nut) guidelines (https://www.strobe-nut.org/ accessed on 22 December 2022). For the present study, the participants were subject to nutritional and visual assessments. All of them signed an informed consent form before examination.
2.2. Clinical and Lifestyle Assessment
The anthropometric parameters of height and weight were measured by a Seca 220 stadiometer and a Seca 711 scale. Body mass index (BMI) was calculated as weight measured in kg and height indicated by m2. Smoking habit was evaluated by asking the question: “Are you currently a smoker?”.
2.3. Dietary Assessment
Diet and eating habits were evaluated with a validated food frequency questionnaire (FFQ) used in previous studies []. This selfadministered questionnaire was checked by a registered dietitian during an interview at the study center. It investigated the frequency intake of a predefined portion over the last year but not the differences in portion sizes. Each portion weight was expressed in grams. Originally, the FFQ was structured into 11 sections, representing foods with similar characteristics: grains, meat, fish, milk and dairy products, vegetables, legumes, fruits, miscellaneous foods, water and alcoholic beverages, olive oil and other edible fats, coffee/sugar, and salt. Then it was validated against the dietary records and adapted to our population []. In the final FFQ version, 85 food items were identified as typical local foods that reflect the local diet (Figure S1). These food items, together with some questions about the use of edible fats, have been regrouped into 28 food groups for statistical analyses []. The food group “edible cooking fats” could not be quantified and was not used in the present study.
2.4. Visual Assessment
Each participant underwent a complete ophthalmic examination (described in detail elsewhere) []. Briefly, the examination included best-corrected visual acuity (BCVA) measurement, slit-lamp biomicroscopy, intraocular pressure (IOP) measurement, and funduscopy. Then, we used the Optovue RTVue XR 100 AVANTI, made by Optovue, Inc., to perform OCT and OCT-A. After detecting and segmenting several retinal layers using the AngioVue module of the Optovue RTVue AVANTI program, OCT-A analyses of the retinal vasculature (version 2015.100.0.35, Optovue, Inc., Fremont, CA, USA) were performed. Both the Angio Disc mode (4.54.5 mm2) and the Angio Retina mode (33 mm2) were used. The vessel density (VD, %) was defined as the proportion of vessel area with blood flow over the total area automatically measured by the OCT software. The OCT angiograms centered on the fovea automatically defined the superficial and deep vascular plexus. The VD at each plexus of the RPE (the superficial VD (SVD), and deep VD (DVD)) were determined for the whole 3 mm circle area centered on the fovea (whole retina) (Figure S2). The thickness (µm) of the ganglion cell complex (GCC), consisting of the thickness of the retinal nerve fiber layer (RNFL), ganglion cell layer (GCL), and inner plexiform layer (IPL) (Figure S2) at the macular area, and, separately, of the RNFL, was measured at the same time using the same OCT. The device measures GCC and RNFL thickness within an automatically rendered 7 mm2 area, centered 1 mm temporally to the fovea []. Each retinal feature shown in Figure S2 is explained in Table S1. Ocular exclusion criteria for all study participants included an IOP > 22 mmHg, a history of glaucoma, optic neuropathies, demyelinating disorders, retinal diseases, including macular degeneration, diabetic or hypertensive retinopathy, epiretinal membrane, retinal detachment, an obvious media opacity reducing visual acuity below 1 LogMar and interfering with the OCT and OCT-A analysis, a refractive error of 6 diopters or more, an intraocular surgery performed in the previous 6 months, or ocular trauma.
2.5. Statistical Analysis
Subject characteristics are reported as Median and Interquartile Range (IQR) for continuous variables and as frequencies and percentages (%) for categorical variables.
To test the nonnormal distribution of variables Kolmogorov–Smirnov test for equality was used.
To analyze the difference between two subgroups of age classes, the median value calculated on our cohort was chosen to cut the distribution of age variables perfectly in two parts.
To select the predictors of the OCT variable, random forest (RF) was used. RF was computed by an ensemble of binary decision trees, which could be used to select the most important variables linked with the outcomes. Variable predictiveness could be assessed using variable importance measures for both single and grouped variables []. The random forest (RF) method is a machine-supervised learning algorithm based on a randomized decisional tree for ranking the prediction power of a set of variables regarding the outcome of interest. The “forest” it builds is an ensemble of decision trees, usually trained with the “bagging” method. The general idea of the bagging method is that a combination of learning models increases the overall result. We examined which variables best predict variance in the intervention effects by ranking the covariates in order of importance. The ranking is calculated as the sum of how often a given covariate is split at each depth of the forest. The sum is weighted so that early splits (low forest depth) are more important than late splits. Variables are considered “more important” if the variable is more frequently used for the first splits across all decision trees that are grown in the random forest. The parameter used for ranking was the importance score variable, calculated by adding up the improvement in the objective function given by the splitting criterion over all internal nodes of a tree and across all trees in the forest (separately for each predictor variable). The importance score variable was normalized by dividing all scores over the maximum score (100%).
Variables with high importance were the drivers of the outcome, and their score values have a significant impact on the outcome [].
We used another statistical methodology to evaluate variable importance; in fact, predictor importance was estimated based on the minimal depth of the maximal subtree. The “Depth” was how many nodes down in the tree, starting the numbering at 0 for the root node, while “Minimal depth” was the minimal depth value for the first instance of a given splitting variable. “Mean minimal depth” was the minima depth for a variable averaged across all trees in the forest.
If a predictor was influential in a prediction, then the variable is likely to occur nearer to the root rather than the leaf nodes []. Depth is indicated by a vertical bar with the mean value. The smaller the mean minimal depth, the more important the variable and the higher up the y-axis the variable will be. The color gradient reveals the min and max minimal depth for each variable. The range of the x-axis is from zero to the maximum number of trees for the feature.
We randomly split the data into training and testing subgroups to predict visual outcomes. The training data included 75% of the sample (n = 397), while the remaining data (the test data) accounted for 25% (n = 133) and were used to test the model and minimize the heterogeneity of the obtained subsamples for a continuous outcome.
All statistical computations were made using StataCorp. 2021. Stata Statistical Software: Release 17. College Station, TX, USA: StataCorp LLC. And RStudio software (“Prairie Trillium” Release).
3. Results
The present study was conducted on a sample of 530 subjects, with a median (IQR) age of 72.00 (68.00–78.00) years, drawn from the “Salus in Apulia Study” population. The female sex was slightly predominant, accounting for 55.7%. Only 7.2% of subjects studied were smokers, while excess weight, expressed by median (IQR) BMI of 28.81 (25.98–32.04), was more common. Table 1 shows the sociodemographic and OCT variables of the sample.

Table 1.
Sociodemographic and OCT variables of the sample (n = 530). The Salus in Apulia Study.
Table 2 reports the average consumption of the food groups. There are differences in food consumption by gender and age groups. As regards gender, the difference is statistically significant for dairy (p: 0.005), eggs (p: 0.05), white meat (p: 0.009), red meat (p: <0.0001), processed meat (p: <0.0001), fish (p: 0.04), seafood/shellfish (p: 0.001), root vegetables (p: 0.005), grains (p: 0.02), high-calorie drinks (p: 0.04), ready to eat dish (p: 0.02), wine (p: <0.0001), beer wine (p: <0.0001), and spirits (p: <0.0001). As regards the age classes, the difference is statistically significant for processed meat (p: 0.009), nuts (p: 0.001), olives and vegetable oil (p: 0.006), high-calorie drinks (p: 0.006), ready-to-eat dishes (p: <0.0001), coffee (p^: <0.0001), beer (p: 0.003), and spirits (p: 0.05).
Table 2.
Food groups average daily consumption (expressed in grams) by the sample (n = 530). The Salus in Apulia Study.
3.1. Random Forest Food Group and Retinal Nerve Fiber Layer (RNFL)
These analyses identified 15 of the 28 food groups as predictors of RNFL: grains (minimal depth: 3.96), sweets (minimal depth: 4.32), processed meat (minimal depth: 4.84), legumes (minimal depth: 5.01), fish (minimal depth: 5.27), olives-vegetable oil (minimal depth: 5.34), fruiting vegetables (minimal depth: 5.58), white meat (minimal depth: 5.64), leafy vegetables (minimal depth: 5.78), dairy (minimal depth: 5.83), fruits (minimal depth: 5.93), low-fat dairy (minimal depth: 6.06), red meat (minimal depth: 6.13), other vegetables (minimal depth: 6.30), and high-calorie drinks (minimal depth: 6.61) (Figure 1).
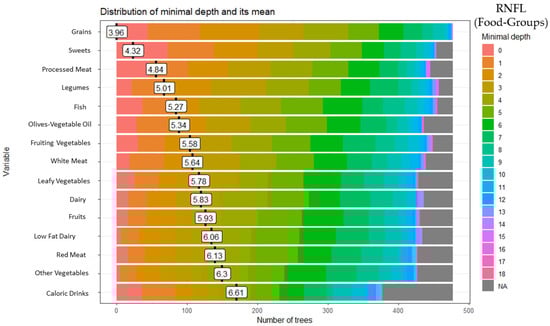
Figure 1.
Random forest food group and retinal nerve fiber layer (RNFL).
3.2. Random Forest Food Group and Ganglion Cell Layer (GCL) Thickness
These analyses identified 15 of the 28 food groups as predictors of GCC thickness: grains (minimal depth: 4.07), legumes (minimal depth: 4.27), red meat (minimal depth: 4.39), low-fat dairy (minimal depth: 4.89), fruiting vegetables (minimal depth: 5.00), white meat (minimal depth: 5.21), processed meat (minimal depth: 5.46), fish (minimal depth: 5.51), fruits (minimal depth: 5.72), other vegetables (minimal depth: 5.88), sweets (minimal depth: 6.00), eggs (minimal depth: 6.11), seafood-shellfish (minimal depth: 6.24), olives-vegetable oil (minimal depth: 6.31), and dairy (minimal depth: 6.32) (Figure 2).
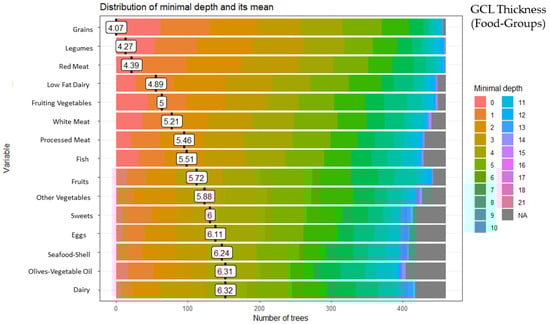
Figure 2.
Random forest food group and ganglion cell layer (GCL) thickness.
3.3. Random Forest Food Group and Whole Retina Superficial Vessel Density (SVD)
These analyses identified 15 of the 28 food groups as predictors of the whole retina SVD: low-fat dairy (minimal depth: 4.16), grains (minimal depth: 4.41), leafy vegetables (minimal depth: 4.82), other vegetables (minimal depth: 4.96), fruits (minimal depth: 4.97), fish (minimal depth: 4.99), white meat (minimal depth: 4.99), dairy (minimal depth: 5.08), sweets (minimal depth: 5.30), olives-vegetable oil (minimal depth: 5.41), fruiting vegetables (minimal depth: 5.53), legumes (minimal depth: 5.63), high-calorie drinks (minimal depth: 5.64), red meat (minimal depth: 5.70)and processed meat (minimal depth: 5.85) (Figure 3).
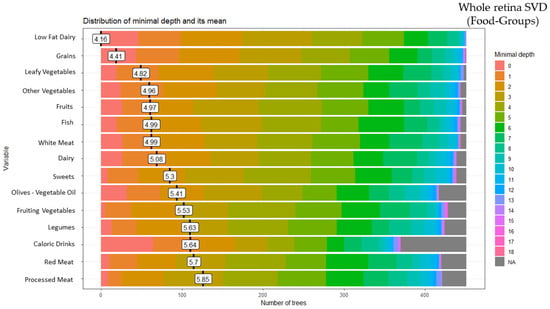
Figure 3.
Random forest food group and whole retina superficial vessel density (SVD).
3.4. Random Forest Food Group and Whole Retina Deep Vessel Density (DVD)
These analyses identified 15 of the 28 food groups as predictors of the whole retina DVD: red meat (minimal depth: 3.87), grains (minimal depth: 4.56), dairy (minimal depth: 4.57), olives-vegetable oil (minimal depth: 4.90), legumes (minimal depth: 4.91), processed meat (minimal depth: 4.95), fruiting vegetables (minimal depth: 5.18), fruits (minimal depth: 5.25), white meat (minimal depth: 5.29), leafy vegetables (minimal depth: 5.34), sweets (minimal depth: 5.41), fish (minimal depth: 5.52), low-fat dairy (minimal depth: 5.62), seafood-shellfish (minimal depth: 5.77), and other vegetables (minimal depth: 5.80) (Figure 4).
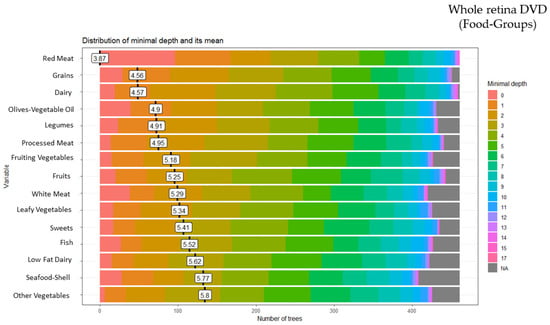
Figure 4.
Random forest food group and whole retina deep vessel density (DVD).
Table 3 summarizes the results from the random forest analyses for each variable investigated in the visual assessment. A total of 13 out of the 15 food groups were found to be common among the representative rankings of the four retinal variables selected for this study.
Table 3.
Summary of dietary pattern predictors of retinal variables.
4. Discussion
The present study, which was conducted on 530 subjects aged over 64 years in Castellana Grotte, sought to identify a dietary pattern that was predictive of the variables studied, emphasizing a link between the consumption of some food groups and specific neurovascular retinal features. The foods with a high prediction power include grains, legumes, fruiting vegetables, other vegetables, fruits, olives-vegetable oil, fish, dairy, low-fat dairy, red meat, processed meat, and sweets.
The present findings are in line with previous studies that refer to specific foods that owe their effects to the composition of micro and macronutrients. In fact, growing attention is being paid to the role of nutrition in the health of the retina and visual impairment. Several studies suggested antioxidant and anti-inflammatory effects of some specific foods [,]. The AREDS1 and AREDS2 pieces of research focused on specific nutritional intake and dietary supplements as strategies for preventing and slowing down AMD development. AREDS1 studied the impact of some antioxidant nutrients, including vitamin C, vitamin E, beta-carotene, and zinc, while for AREDS2, lutein, zeaxanthin, docosahexaenoic acid (DHA), eicosapentaenoic acid (EPA) were added and beta-carotene was removed [,]. The results were encouraging, showing a 25% reduction in the probability of developing advanced forms for subjects at high risk of AMD. There seems to be no benefit in the early stages of the disease. This different food effect on the development of AMD led to a different mechanism behind the two forms being hypothesized. Early AMD may be caused by a parainflammatory response to relatively low levels of tissue stress, while late AMD may be caused by a chronic inflammatory response to local and systemic stress [].
4.1. Fruits and Vegetables
Fruits and vegetables are good sources of micronutrients (folate, potassium, magnesium, vitamins A, C, E, and K) and phytochemicals [], which are responsible for several health benefits [,,]. In fact, nowadays, increasing the consumption of fruits and vegetables is recommended due to the preventive effects of some phytochemicals against several diseases, including cardiovascular disease (CVD) []. In order to benefit from the protective and preventive effect of fruit and vegetables against several chronic diseases, such as CVD and different types of cancer, the World Health Organization (WHO) recommends a minimum consumption of 400 g or five portions of 80 g each of fruits, greens and/or vegetables per day []. In addition, fruits and vegetables, in particular leafy green vegetables, are the primary dietary sources of carotenoids. Previous studies in the scientific literature have suggested that the consumption of carotenoids, specifically lutein and zeaxanthin, tends to enhance the health of the retina, protecting against the development of retinal changes []. Lutein and zeaxanthin are carotenoids belonging to the family of xanthophylls. The most significant sources include kale (48.0–114.7 μg/g), parsley (64–106.5 μg/g), spinach (59.3–79.0 μg/g), lettuce (10.0–47.8 μg/g), and broccoli (7.1–33.0 μg/g) []. The effects of these types of carotenoids on visual performance have been the object of a wide variety of research []. Many of these have demonstrated a positive association between the consumption of lutein and zeaxanthin, retina health, and the prevention of some retinal disorders, such as AMD. In fact, the risk of retinal changes is significantly lower in individuals that consume more dietary lutein and zeaxanthin [,,]. These results were not found for the supplementation of these nutrients due to their different bioavailability. The beneficial role is due to the presence of lutein and zeaxanthin in the center of the retina, which is needed to form the macular pigment []. It is essential because it reduces the penetration of harmful blue light into the retinal tissues and is responsible for the antioxidant abilities of the retina.
4.2. Fish
Like lutein and zeaxanthin, EPA and DHA also seem to be required for adequate retinal function []. They contribute to the prevention of cell apoptosis and oxidative damage, the development and maintenance of photoreceptor membranes and neurotransmitters, rhodopsin activation, and rod and cone development []. DHA is also the major structural component of retinal membranes, so it is essential for the development of the visual system []. EPA and DHA are omega-3 essential PUFAs that the human body cannot synthesize autonomously and so must obtain from a diet []. Changes in their levels of concentration or inadequate dietary intake can promote some retinal diseases, including AMD. Liu and colleagues reported significantly lower DHA levels in individuals with AMD than in those without []. The role of omega-3 fatty acids in prevention and treatment is still not completely clear. However, supplementation of EPA and DHA is known to not produce the same benefits as the dietary omega-3 fatty acids on the retina. Souied and colleagues studied the effects of DHA supplementation in the prevention and delay of the progression of exudative AMD. No significant differences were identified between the DHA and placebo groups []. Fish is an excellent source of EPA and DHA. In particular, there are high concentrations in dark-meat fish such as salmon, mackerel, sardines, herring, anchovies, and fish oils. Chong and colleagues showed a statistically significant association between a high intake of fish and a reduction in the development of late and intermediate AMD []. In the Mediterranean diet (MedDiet), regular fish consumption can ensure an adequate intake of omega-3 fatty acids. The MedDiet is also characterized by a balance between PUFA omega-6 and omega-3. This is one of the elements that makes the MedDiet the best dietary pattern in AMD risk management. Omega-6 has a proinflammatory function, while omega-3 is anti-inflammatory [,,]. It has been demonstrated that an alteration in the balance of dietary omega 3- and omega 6, with a high food intake of omega 6, increases the risk of developing AMD []. The MedDiet has been defined as a longevity determinant thanks to the properties of its components [,]. Considerable scientific evidence supports the protective and preventive role of this food pattern against chronic noncommunicable diseases [].
4.3. Grains
Grains are an important source of complex carbohydrates, which are then broken down into glucose by the digestive processes. Carbohydrate-source foods can be classified on the basis of their glycemic index, according to the effect on blood sugar levels over a period of two hours. Pure glucose is assigned a glycemic index (GI) value of 100. High-GI foods (>70) include white bread, potatoes, white rice, cereals, honey, and refined sugar []. Low-GI foods (<55) include whole fruit and vegetables, whole wheat bread, pasta, oats, bran, legumes, milk, and yogurt. Previous studies compared the effect of a low-GI diet and a high-GI diet on retinal alteration risk [,]. The risk was found to be higher in the high-GI diet group, probably due to inflammatory processes. However, the present study did not distinguish between whole and refined grains. Further studies are, therefore, needed to support this hypothesis.
4.4. Olives and Vegetable Olive Oil
Several studies have demonstrated the beneficial effects of olive oil on health status [,].
In particular, extra virgin olive oil, a key food in the MedDiet, has beneficial effects on blood pressure, glycaemic control in diabetics, endothelial functioning, oxidative stress, and lipid profiles; in addition, it reduces the susceptibility of LDL to oxidation as well as concentrations of inflammatory markers, such as C-reactive protein and interleukin-6 []. Its nutritional and healthy value can be attributed to the bioactive components of olive oil, including monounsaturated fatty acids (MUFAs) and PUFAs, tocopherols, and polyphenols []. Many epidemiological studies, including randomized controlled trials, show that the intake of olive oil improves cardiovascular health []. Therefore, it is possible to assume that these beneficial effects also affect the retinal microvascular system; further studies are needed to confirm this hypothesis.
4.5. Dairy
The predictive power of milk and dairy towards retinal changes needs to be clarified by further studies. Some scientific studies refer to the proinflammatory effect of dairy, with others to an anti-inflammatory effect []. Gopinath and colleagues found an increased odds ratio for developing AMD in the case of a low intake of dairy and calcium []. However, these results need to be further investigated.
4.6. Red and Processed Meat
Many observational studies and meta-analyses demonstrated the association between a high intake of red and/or processed meat and chronic diseases such as obesity, type 2 diabetes, CVD, and a variety of cancers. The high consumption of these foods is also associated with an increased risk of total, cardiovascular, and cancer mortality []. In accordance with these results, red and processed meat are predictive factors for retinal changes. Previous studies identified red and processed meat as potential risk factors for retinal diseases, such as AMD [,]. The mechanism underlying this hypothesis needs further exploration. Some studies focused on the high-fat content of these foods, in particular, processed meat, such as sausage or salami []. Furthermore, the role of other components has been studied, including heme iron, nitrites, nitrous, and advanced glycated end products (AGEs). It seems that heme iron can increase the levels of N-nitrose components, causing damage to the retina []. However, AGEs increase oxidative stress and inflammation and alternate normal cellular function [].
4.7. Strengths and Limitations
The strengths of the present study include its large population-based sample size and the generalizability of the results to southern, older Mediterranean populations. Moreover, this study is the first to evaluate the more specific quantitative parameters of retinal vasculature when compared to previous studies, in which the morphologic parameters were evaluated using only direct fundoscopy, which could be influenced by interexaminer variability. Another strength was the identification of a dietary pattern associated with neurovascular retinal features through a strong machine-learning approach, even though it cannot explain any biological reasons for the associations detected. In fact, the dietary pattern associated with neural and vascular retinal features is to be understood as an association ranking of certain food groups with a certain outcome. However, some limitations must also be taken into account. One of these is the nature of the study, which was cross-sectional and did not allow for the clear directionality of an association to be discerned. A further limitation is the FFQ as a dietary assessment method since its memory-based nature and consequent measurement errors make it particularly difficult to analyze small diet–disease associations.
5. Conclusions
The aging of populations worldwide is leading to an increase in age-related pathological conditions, including retinal changes. These reduce a person’s quality of life, increasing the risk of depression, isolation, and falls. This makes it essential to focus research on new strategies that prevent this condition, slow its evolution, or mitigate its debilitating symptoms. More attention to diet and food intake should be encouraged. Starting from the data in the scientific literature on the protective role of some nutrients against retinal alterations, such as AMD, the present study analyzed the prediction power of a certain dietary pattern on retinal neurovascular features. We found a link between specific retinal variables and some food groups, such as fruiting vegetables, other vegetables, fruits, fish, olives–vegetable oil, which are sources of carotenoids and omega-3 fatty acids that are essential nutrients for the health of the retina. Thanks to its anti-inflammatory and antioxidant characteristics, the MedDiet could be a powerful tool in this sense. More specific studies on the effects of this dietary pattern on the risk of retinal alterations are warranted.
Supplementary Materials
The following supporting information can be downloaded at: https://www.mdpi.com/article/10.3390/ijerph20065108/s1, Figure S1: Food Frequency Questionnaire (FFQ); Figure S2: OCT Angiography Scans and Retinal Features; Table S1: Description of the retinal features shown in Figure S2.
Author Contributions
Conceptualization: R.S., L.L. and A.N.; Methodology, R.S.; Formal Analysis, R.D.; Investigation: Eye Clinic Research Group, L.L., A.N., I.B., F.C., R.Z., S.T. and R.T.; Data Curation, R.D.; Writing—Original Draft Preparation, R.T.; Writing—Review and Editing, L.L. and F.P.; Supervision: F.P., M.L., G.S., F.B. and G.A.; Project Administration, R.S. Funding Acquisition, R.S. All authors have read and agreed to the published version of the manuscript.
Funding
This study was funded by the Italian Ministry of Health with the “Ricerca Corrente 2022” Grant and by the Apulia Government with the “Regione Puglia Grant 2019”. The Salus in Apulia Study was funded by Apulia Government and the Italian Ministry of Health, under the Studies on Aging Network at Italian Research Hospitals (IRCCS). The work reported in this publication was granted by the Italian Ministry of Health under the Aging Network of Italian Research Hospitals (IRCCS).
Institutional Review Board Statement
This study was approved by the Institutional Review Board of the National Institute of Gastroenterology “S. De Bellis”, Castellana Grotte, Bari, Italy”. The informed written consent forms were obtained from all participants. Approval Code: 68/CE De Bellis. Approval Date: 9 April 2019.
Informed Consent Statement
Informed consent was obtained from all subjects involved in the study.
Data Availability Statement
The datasets used and/or analyzed during the current study are available from the corresponding author on reasonable request.
Acknowledgments
We thank the “Salus in Apulia” Research Team. This manuscript is the result of the research work on frailty undertaken by the “Research Network on Aging” team, supported by the resources of the Italian Ministry of Health—Research Networks of National Health Institutes. We thank M. V. Pragnell, B.A., for her precious help as a native English language supervisor. We thank the General Practitioners of Castellana Grotte for their fundamental role in supporting the recruitment of participants in these studies: Campanella Cecilia Olga Maria, Daddabbo Annamaria, Dell’aera Giosue’, Giustiniano Rosalia Francesca, Guzzoni Iudice Massimo, Lomuscio Savino, Lucarelli Rocco, Mazzarisi Antonio, Palumbo Mariana, Persio Maria Teresa, Pesce Rosa Vincenza, Puzzovivo Gabriella, Romano Pasqua Maria, Sgobba Cinzia, Simeone Francesco, Tartaglia Paola, and Tauro Nicola. CONSORTIUM MEMBERS: Rosa Buonamassa, Giacomo Scotti, Luca Landini, Roberto Semeraro, Flavio Cassano, Antonella Guglielmi, Arcangelo Clemente, Roberta Galati, Pierfrancesco Digregorio, Francesca Palumbo, Marida Gaudiomonte, Giulia Maria Pia Bisceglia, Michele Santoro, Giovanni Petruzzella, Pasquale Pasculli.
Conflicts of Interest
The authors declare no conflict of interest.
References
- Dillin, A.; Gottschling, D.E.; Nyström, T. The Good and the Bad of Being Connected: The Integrons of Aging. Curr. Opin. Cell Biol. 2014, 26, 107–112. [Google Scholar] [CrossRef]
- Masland, R.H. The Neuronal Organization of the Retina. Neuron 2012, 76, 266–280. [Google Scholar] [CrossRef] [PubMed]
- Walchuk, C.; Suh, M. Nutrition and the Aging Retina: A Comprehensive Review of the Relationship between Nutrients and Their Role in Age-Related Macular Degeneration and Retina Disease Prevention. Adv. Food Nutr. Res. 2020, 93, 293–332. [Google Scholar] [CrossRef] [PubMed]
- Kaarniranta, K.; Sinha, D.; Blasiak, J.; Kauppinen, A.; Veréb, Z.; Salminen, A.; Boulton, M.E.; Petrovski, G. Autophagy and Heterophagy Dysregulation Leads to Retinal Pigment Epithelium Dysfunction and Development of Age-Related Macular Degeneration. Autophagy 2013, 9, 973–984. [Google Scholar] [CrossRef] [PubMed]
- Blasiak, J.; Piechota, M.; Pawlowska, E.; Szatkowska, M.; Sikora, E.; Kaarniranta, K. Cellular Senescence in Age-Related Macular Degeneration: Can Autophagy and DNA Damage Response Play a Role? Oxidative Med. Cell. Longev. 2017, 2017, 5293258. [Google Scholar] [CrossRef] [PubMed]
- Zhang, M.; Jiang, N.; Chu, Y.; Postnikova, O.; Varghese, R.; Horvath, A.; Cheema, A.K.; Golestaneh, N. Dysregulated Metabolic Pathways in Age-Related Macular Degeneration. Sci. Rep. 2020, 10, 2464. [Google Scholar] [CrossRef] [PubMed]
- Weng, X.; Zhang, H.; Kan, M.; Ye, J.; Liu, F.; Wang, T.; Deng, J.; Tan, Y.; He, L.; Liu, Y. Leukocyte Telomere Length Is Associated with Advanced Age-Related Macular Degeneration in the Han Chinese Population. Exp. Gerontol. 2015, 69, 36–40. [Google Scholar] [CrossRef]
- Hyttinen, J.M.T.; Kannan, R.; Felszeghy, S.; Niittykoski, M.; Salminen, A.; Kaarniranta, K. The Regulation of NFE2L2 (NRF2) Signalling and Epithelial-to-Mesenchymal Transition in Age-Related Macular Degeneration Pathology. Int. J. Mol. Sci. 2019, 20, 5800. [Google Scholar] [CrossRef]
- Oubaha, M.; Miloudi, K.; Dejda, A.; Guber, V.; Mawambo, G.; Germain, M.-A.; Bourdel, G.; Popovic, N.; Rezende, F.A.; Kaufman, R.J.; et al. Senescence-Associated Secretory Phenotype Contributes to Pathological Angiogenesis in Retinopathy. Sci. Transl. Med. 2016, 8, 362ra144. [Google Scholar] [CrossRef]
- Senra, H.; Macedo, A.F.; Nunes, N.; Balaskas, K.; Aslam, T.; Costa, E. Psychological and Psychosocial Interventions for Depression and Anxiety in Patients with Age-Related Macular Degeneration: A Systematic Review. Am. J. Geriatr. Psychiatry 2019, 27, 755–773. [Google Scholar] [CrossRef]
- Wong, W.L.; Su, X.; Li, X.; Cheung, C.M.G.; Klein, R.; Cheng, C.-Y.; Wong, T.Y. Global Prevalence of Age-Related Macular Degeneration and Disease Burden Projection for 2020 and 2040: A Systematic Review and Meta-Analysis. Lancet Glob. Health 2014, 2, e106–e116. [Google Scholar] [CrossRef] [PubMed]
- Ministero Della Salute 2020. Available online: https://www.salute.gov.it/imgs/C_17_opuscoliPoster_217_allegato.pdf (accessed on 10 December 2022).
- Age-Related Eye Disease Study Research Group. A Randomized, Placebo-Controlled, Clinical Trial of High-Dose Supplementation with Vitamins C and E, Beta Carotene, and Zinc for Age-Related Macular Degeneration and Vision Loss: AREDS Report No. 8. Arch. Ophthal. 2001, 119, 1417–1436. [Google Scholar] [CrossRef]
- Weikel, K.A.; Chiu, C.-J.; Taylor, A. Nutritional Modulation of Age-Related Macular Degeneration. Mol. Asp. Med. 2012, 33, 318–375. [Google Scholar] [CrossRef]
- Cheung, L.K.; Eaton, A. Age-related Macular Degeneration. Pharmacother. J. Hum. 2013, 33, 838–855. [Google Scholar] [CrossRef]
- Age-Related Eye Disease Study Research Group. The Age-Related Eye Disease Study System for Classifying Age-Related Macular Degeneration from Stereoscopic Color Fundus Photographs: The Age-Related Eye Disease Study Report Number 6. Am. J. Ophthalmol. 2001, 132, 668–681. [Google Scholar] [CrossRef] [PubMed]
- Lampignano, L.; Niro, A.; Castellana, F.; Bortone, I.; Zupo, R.; Tirelli, S.; Tatoli, R.; Griseta, C.; De Nucci, S.; Sila, A.; et al. Liver Fibrosis and Retinal Features in an Older Mediterranean Population: Results from the Salus in Apulia Study. Front. Neurosci. 2022, 16, 1048375. [Google Scholar] [CrossRef]
- Niro, A.; Sborgia, G.; Lampignano, L.; Giuliani, G.; Castellana, F.; Zupo, R.; Bortone, I.; Puzo, P.; Pascale, A.; Pastore, V.; et al. Association of Neuroretinal Thinning and Microvascular Changes with Hypertension in an Older Population in Southern Italy. J. Clin. Med. Res. 2022, 11, 1098. [Google Scholar] [CrossRef] [PubMed]
- Spaide, R.F.; Klancnik, J.M., Jr.; Cooney, M.J. Retinal Vascular Layers Imaged by Fluorescein Angiography and Optical Coherence Tomography Angiography. JAMA Ophthalmol. 2015, 133, 45–50. [Google Scholar] [CrossRef]
- Kashani, A.H.; Chen, C.-L.; Gahm, J.K.; Zheng, F.; Richter, G.M.; Rosenfeld, P.J.; Shi, Y.; Wang, R.K. Optical Coherence Tomography Angiography: A Comprehensive Review of Current Methods and Clinical Applications. Prog. Retin. Eye Res. 2017, 60, 66–100. [Google Scholar] [CrossRef]
- Coleman, H.R.; Chan, C.-C.; Ferris, F.L.; Chew, E.Y. Age-Related Macular Degeneration. Lancet 2008, 372, 1835–1845. [Google Scholar] [CrossRef]
- Department of Health & Human Services NIH. National Eye Institute Age-Related Macular Degeneration: What You Should Know. PsycEXTRA Dataset.
- Margrain, T. Do Blue Light Filters Confer Protection against Age-Related Macular Degeneration? Prog. Retin. Eye Res. 2004, 23, 523–531. [Google Scholar] [CrossRef]
- Vander, J.F. Cigarette Smoking, Fish Consumption, Omega-3 Fatty Acid Intake, and Associations with Age-Related Macular Degeneration: The US Twin Study of Age-Related Macular Degeneration. Yearb. Ophthalmol. 2007, 2007, 128–129. [Google Scholar] [CrossRef]
- Chakravarthy, U.; Augood, C.; Bentham, G.C.; de Jong, P.T.V.M.; Rahu, M.; Seland, J.; Soubrane, G.; Tomazzoli, L.; Topouzis, F.; Vingerling, J.R.; et al. Cigarette Smoking and Age-Related Macular Degeneration in the EUREYE Study. Ophthalmology 2007, 114, 1157–1163. [Google Scholar] [CrossRef] [PubMed]
- Rinninella, E.; Mele, M.C.; Merendino, N.; Cintoni, M.; Anselmi, G.; Caporossi, A.; Gasbarrini, A.; Minnella, A.M. The Role of Diet, Micronutrients and the Gut Microbiota in Age-Related Macular Degeneration: New Perspectives from the Gut−Retina Axis. Nutrients 2018, 10, 1677. [Google Scholar] [CrossRef]
- Coulston, A.M.; Boushey, C.J.; Ferruzzi, M.; Delahanty, L. Nutrition in the Prevention and Treatment of Disease; Academic Press: Cambridge, MA, USA, 2017; ISBN 9780128029473. [Google Scholar]
- Bosy-Westphal, A.; Müller, M.J. Diet and Nutrition in the Prevention of Non-Communicable Diseases (NCD). Dtsch. Med. Wochenschr. 2021, 146, 389–397. [Google Scholar] [CrossRef]
- Cicero, A.F.G.; Fogacci, F.; Tocci, G.; Ventura, F.; Presta, V.; Grandi, E.; Rizzoli, E.; D’Addato, S.; Borghi, C.; Cicero, A.F.G.; et al. Awareness of Major Cardiovascular Risk Factors and Its Relationship with Markers of Vascular Aging: Data from the Brisighella Heart Study. Nutr. Metab. Cardiovasc. Dis. 2020, 30, 907–914. [Google Scholar] [CrossRef]
- Bryl, A.; Mrugacz, M.; Falkowski, M.; Zorena, K. The Effect of Diet and Lifestyle on the Course of Diabetic Retinopathy—A Review of the Literature. Nutrients 2022, 14, 1252. [Google Scholar] [CrossRef]
- Garcia-Medina, J.J.; Rubio-Velazquez, E.; Foulquie-Moreno, E.; Casaroli-Marano, R.P.; Pinazo-Duran, M.D.; Zanon-Moreno, V.; Del-Rio-Vellosillo, M. Update on the Effects of Antioxidants on Diabetic Retinopathy: In Vitro Experiments, Animal Studies and Clinical Trials. Antioxidants 2020, 9, 561. [Google Scholar] [CrossRef] [PubMed]
- Brazionis, L.; Rowley, K.; Itsiopoulos, C.; O’Dea, K. Plasma Carotenoids and Diabetic Retinopathy. Br. J. Nutr. 2009, 101, 270–277. [Google Scholar] [CrossRef]
- Tikhonenko, M.; Lydic, T.A.; Opreanu, M.; Calzi, S.L.; Bozack, S.; McSorley, K.M.; Sochacki, A.L.; Faber, M.S.; Hazra, S.; Duclos, S.; et al. N-3 Polyunsaturated Fatty Acids Prevent Diabetic Retinopathy by Inhibition of Retinal Vascular Damage and Enhanced Endothelial Progenitor Cell Reparative Function. PLoS ONE 2013, 8, e55177. [Google Scholar] [CrossRef] [PubMed]
- Grzybowski, A. Artificial Intelligence in Ophthalmology; Springer Nature: Berlin/Heidelberg, Germany, 2021; ISBN 9783030786014. [Google Scholar]
- Castellana, F.; Zupo, R.; Bortone, I.; Giannelli, G.; Donghia, R.; Lampignano, L.; Griseta, C.; De Pergola, G.; Boeing, H.; Cisternino, A.M.; et al. Traditional Old Dietary Pattern of Castellana Grotte (Apulia) Is Associated with Healthy Outcomes. Nutrients 2020, 12, 3097. [Google Scholar] [CrossRef] [PubMed]
- Tatoli, R.; Lampignano, L.; Donghia, R.; Castellana, F.; Zupo, R.; Bortone, I.; De Nucci, S.; Campanile, G.; Lofù, D.; Vimercati, L.; et al. Dietary Customs and Social Deprivation in an Aging Population From Southern Italy: A Machine Learning Approach. Front. Nutr. 2022, 9, 811076. [Google Scholar] [CrossRef]
- Leoci, C.; Centonze, S.; Guerra, V.; Cisternino, A.M.; Misciagna, G. Reliability and Validity of a Semiquantitative Food Frequency Questionnaire. G. Ital. Nutr. Clin. Prev. 1933, 2, 58–59. [Google Scholar]
- Donghia, R.; Guerra, V.; Pesole, L.P.; Liso, M. Contribution of Macro-and Micronutrients Intake to Gastrointestinal Cancer Mortality in the ONCONUT Cohort. Classical versus Modern Approaches. Front. Nutr. 2023, 10, 56. [Google Scholar] [CrossRef]
- Ishwaran, H.; Kogalur, U.B.; Gorodeski, E.Z.; Minn, A.J.; Lauer, M.S. High-Dimensional Variable Selection for Survival Data. J. Am. Stat. Assoc. 2010, 105, 205–217. [Google Scholar] [CrossRef]
- Hess, J.M.; Stephensen, C.B.; Kratz, M.; Bolling, B.W. Exploring the Links between Diet and Inflammation: Dairy Foods as Case Studies. Adv. Nutr. 2021, 12, 1S–13S. [Google Scholar] [CrossRef]
- dos Santos, J.L.; dos Santos, J.L.; de Quadros, A.S.; Weschenfelder, C.; Garofallo, S.B.; Marcadenti, A. Oxidative Stress Biomarkers, Nut-Related Antioxidants, and Cardiovascular Disease. Nutrients 2020, 12, 682. [Google Scholar] [CrossRef] [PubMed]
- Age-Related Eye Disease Study 2 Research Group. Lutein + Zeaxanthin and Omega-3 Fatty Acids for Age-Related Macular Degeneration: The Age-Related Eye Disease Study 2 (AREDS2) Randomized Clinical Trial. JAMA 2013, 309, 2005–2015. [Google Scholar] [CrossRef] [PubMed]
- Chen, M.; Xu, H. Parainflammation, Chronic Inflammation, and Age-Related Macular Degeneration. J. Leukoc. Biol. 2015, 98, 713–725. [Google Scholar] [CrossRef] [PubMed]
- Tosh, S.M.; Bordenave, N. Emerging Science on Benefits of Whole Grain Oat and Barley and Their Soluble Dietary Fibers for Heart Health, Glycemic Response, and Gut Microbiota. Nutr. Rev. 2020, 78, 13–20. [Google Scholar] [CrossRef]
- Champagne, C.M. Dietary Interventions on Blood Pressure: The Dietary Approaches to Stop Hypertension (DASH) Trials. Nutr. Rev. 2006, 64, S53–S56. [Google Scholar] [CrossRef]
- Eichholzer, M.; Lüthy, J.; Gutzwiller, F.; Stähelin, H.B. The Role of Folate, Antioxidant Vitamins and Other Constituents in Fruit and Vegetables in the Prevention of Cardiovascular Disease: The Epidemiological Evidence. Int. J. Vitam. Nutr. Res. 2001, 71, 5–17. [Google Scholar] [CrossRef]
- Hamer, M.; Chida, Y. Intake of Fruit, Vegetables, and Antioxidants and Risk of Type 2 Diabetes: Systematic Review and Meta-Analysis. J. Hypertens. 2007, 25, 2361–2369. [Google Scholar] [CrossRef]
- Bacchetti, T.; Turco, I.; Urbano, A.; Morresi, C.; Ferretti, G. Relationship of Fruit and Vegetable Intake to Dietary Antioxidant Capacity and Markers of Oxidative Stress: A Sex-Related Study. Nutrition 2019, 61, 164–172. [Google Scholar] [CrossRef]
- Hawkesworth, S.; Dangour, A.D.; Johnston, D.; Lock, K.; Poole, N.; Rushton, J.; Uauy, R.; Waage, J. Feeding the World Healthily: The Challenge of Measuring the Effects of Agriculture on Health. Philos. Trans. R. Soc. Lond. B Biol. Sci. 2010, 365, 3083–3097. [Google Scholar] [CrossRef]
- Abdel-Aal, E.-S.M.; Akhtar, H.; Zaheer, K.; Ali, R. Dietary Sources of Lutein and Zeaxanthin Carotenoids and Their Role in Eye Health. Nutrients 2013, 5, 1169–1185. [Google Scholar] [CrossRef]
- Delcourt, C.; Carrière, I.; Delage, M.; Barberger-Gateau, P.; Schalch, W.; POLA Study Group. Plasma Lutein and Zeaxanthin and Other Carotenoids as Modifiable Risk Factors for Age-Related Maculopathy and Cataract: The POLA Study. Investig. Ophthalmol. Vis. Sci. 2006, 47, 2329–2335. [Google Scholar] [CrossRef] [PubMed]
- Huang, L.L.; Coleman, H.R.; Kim, J.; de Monasterio, F.; Wong, W.T.; Schleicher, R.L.; Ferris, F.L., 3rd; Chew, E.Y. Oral Supplementation of Lutein/zeaxanthin and Omega-3 Long Chain Polyunsaturated Fatty Acids in Persons Aged 60 Years or Older, with or without AMD. Investig. Ophthalmol. Vis. Sci. 2008, 49, 3864–3869. [Google Scholar] [CrossRef] [PubMed]
- Tan, J.S.L.; Wang, J.J.; Flood, V.; Mitchell, P. Dietary Fatty Acids and the 10-Year Incidence of Age-Related Macular Degeneration: The Blue Mountains Eye Study. Arch. Ophthalmol. 2009, 127, 656–665. [Google Scholar] [CrossRef]
- Carpentier, S.; Knaus, M.; Suh, M. Associations between Lutein, Zeaxanthin, and Age-Related Macular Degeneration: An Overview. Crit. Rev. Food Sci. Nutr. 2009, 49, 313–326. [Google Scholar] [CrossRef] [PubMed]
- Bazan, N.G.; Molina, M.F.; Gordon, W.C. Docosahexaenoic Acid Signalolipidomics in Nutrition: Significance in Aging, Neuroinflammation, Macular Degeneration, Alzheimer’s, and Other Neurodegenerative Diseases. Annu. Rev. Nutr. 2011, 31, 321–351. [Google Scholar] [CrossRef] [PubMed]
- Liu, A.; Chang, J.; Lin, Y.; Shen, Z.; Bernstein, P.S. Long-Chain and Very Long-Chain Polyunsaturated Fatty Acids in Ocular Aging and Age-Related Macular Degeneration. J. Lipid Res. 2010, 51, 3217–3229. [Google Scholar] [CrossRef]
- Querques, G.; Forte, R.; Souied, E.H. Retina and Omega-3. J. Nutr. Metab. 2011, 748361, 12. [Google Scholar] [CrossRef] [PubMed]
- De Meester, F.; Watson, R.R.; Zibadi, S. Omega-6/3 Fatty Acids: Functions, Sustainability Strategies and Perspectives; Springer Science & Business Media: Berlin/Heidelberg, Germany, 2012; ISBN 9781627032155. [Google Scholar]
- Souied, E.H.; Delcourt, C.; Querques, G.; Bassols, A.; Merle, B.; Zourdani, A.; Smith, T.; Benlian, P.; Nutritional AMD Treatment 2 Study Group. Oral Docosahexaenoic Acid in the Prevention of Exudative Age-Related Macular Degeneration: The Nutritional AMD Treatment 2 Study. Ophthalmology 2013, 120, 1619–1631. [Google Scholar] [CrossRef]
- Chong, E.W.-T.; Kreis, A.J.; Wong, T.Y.; Simpson, J.A.; Guymer, R.H. Dietary ω-3 Fatty Acid and Fish Intake in the Primary Prevention of Age-Related Macular Degeneration: A Systematic Review and Meta-Analysis. Arch. Ophthalmol. 2008, 126, 826–833. [Google Scholar] [CrossRef]
- Mir, S.M.; Kanjilal, S.; Ahmed, S.U. Omega-3 Fatty Acids in Inflammatory Diseases. Omega-3 Fat. Acids 2016, 141–155. [Google Scholar] [CrossRef]
- Calder, P.C. N-3 Polyunsaturated Fatty Acids, Inflammation, and Inflammatory Diseases. Am. J. Clin. Nutr. 2006, 83, 1505S–1519S. [Google Scholar] [CrossRef]
- Christen, W.G.; Schaumberg, D.A.; Glynn, R.J.; Buring, J.E. Dietary ω-3 Fatty Acid and Fish Intake and Incident Age-Related Macular Degeneration in Women. Arch. Ophthalmol. 2011, 129, 921–929. [Google Scholar] [CrossRef]
- D’Alessandro, A.; Lampignano, L.; De Pergola, G. Mediterranean Diet Pyramid: A Proposal for Italian People. A Systematic Review of Prospective Studies to Derive Serving Sizes. Nutrients 2019, 11, 1296. [Google Scholar] [CrossRef]
- Wrolstad, R.E. Food Carbohydrate Chemistry; John Wiley & Sons: Hoboken, NJ, USA, 2012; ISBN 9780813826653. [Google Scholar]
- Kaushik, S.; Wang, J.J.; Flood, V.; Tan, J.S.L.; Barclay, A.W.; Wong, T.Y.; Brand-Miller, J.; Mitchell, P. Dietary Glycemic Index and the Risk of Age-Related Macular Degeneration. Am. J. Clin. Nutr. 2008, 88, 1104–1110. [Google Scholar] [CrossRef]
- Chiu, C.-J.; Milton, R.C.; Klein, R.; Gensler, G.; Taylor, A. Dietary Carbohydrate and the Progression of Age-Related Macular Degeneration: A Prospective Study from the Age-Related Eye Disease Study. Am. J. Clin. Nutr. 2007, 86, 1210–1218. [Google Scholar] [CrossRef]
- Wongwarawipat, T.; Papageorgiou, N.; Bertsias, D.; Siasos, G.; Tousoulis, D. Olive Oil-Related Anti-Inflammatory Effects on Atherosclerosis: Potential Clinical Implications. Endocr. Metab. Immune Disord. Drug Targets 2018, 18, 51–62. [Google Scholar] [CrossRef]
- Schwingshackl, L.; Christoph, M.; Hoffmann, G. Effects of Olive Oil on Markers of Inflammation and Endothelial Function—A Systematic Review and Meta-Analysis. Nutrients 2015, 7, 7651–7675. [Google Scholar] [CrossRef] [PubMed]
- Buckland, G.; Travier, N.; Barricarte, A.; Ardanaz, E.; Moreno-Iribas, C.; Sánchez, M.-J.; Molina-Montes, E.; Chirlaque, M.D.; Huerta, J.M.; Navarro, C.; et al. Olive Oil Intake and CHD in the European Prospective Investigation into Cancer and Nutrition Spanish Cohort. Br. J. Nutr. 2012, 108, 2075–2082. [Google Scholar] [CrossRef] [PubMed]
- Nocella, C.; Cammisotto, V.; Fianchini, L.; D’Amico, A.; Novo, M.; Castellani, V.; Stefanini, L.; Violi, F.; Carnevale, R. Extra Virgin Olive Oil and Cardiovascular Diseases: Benefits for Human Health. Endocr. Metab. Immune Disord. Drug Targets 2018, 18, 4–13. [Google Scholar] [CrossRef]
- Casas, R.; Estruch, R.; Sacanella, E. The Protective Effects of Extra Virgin Olive Oil on Immune-Mediated Inflammatory Responses. Endocr. Metab. Immune Disord. Drug Targets 2018, 18, 23–35. [Google Scholar] [CrossRef]
- Bordoni, A.; Danesi, F.; Dardevet, D.; Dupont, D.; Fernandez, A.S.; Gille, D.; Nunes Dos Santos, C.; Pinto, P.; Re, R.; Rémond, D.; et al. Dairy Products and Inflammation: A Review of the Clinical Evidence. Crit. Rev. Food Sci. Nutr. 2017, 57, 2497–2525. [Google Scholar] [CrossRef]
- Gopinath, B.; Flood, V.M.; Louie, J.C.Y.; Wang, J.J.; Burlutsky, G.; Rochtchina, E.; Mitchell, P. Consumption of Dairy Products and the 15-Year Incidence of Age-Related Macular Degeneration. Br. J. Nutr. 2014, 111, 1673–1679. [Google Scholar] [CrossRef] [PubMed]
- Klurfeld, D.M. Research Gaps in Evaluating the Relationship of Meat and Health. Meat Sci. 2015, 109, 86–95. [Google Scholar] [CrossRef]
- Chong, E.W.-T.; Simpson, J.A.; Robman, L.D.; Hodge, A.M.; Aung, K.Z.; English, D.R.; Giles, G.G.; Guymer, R.H. Red Meat and Chicken Consumption and Its Association with Age-Related Macular Degeneration. Am. J. Epidemiol. 2009, 169, 867–876. [Google Scholar] [CrossRef]
- Ersoy, L.; Ristau, T.; Lechanteur, Y.T.; Hahn, M.; Hoyng, C.B.; Kirchhof, B.; den Hollander, A.I.; Fauser, S. Nutritional Risk Factors for Age-Related Macular Degeneration. BioMed Res. Int. 2014, 2014, 413150. [Google Scholar] [CrossRef] [PubMed]
- Seddon, J.M.; Rosner, B.; Sperduto, R.D.; Yannuzzi, L.; Haller, J.A.; Blair, N.P.; Willett, W. Dietary Fat and Risk for Advanced Age-Related Macular Degeneration. Arch. Ophthalmol. 2001, 119, 1191–1199. [Google Scholar] [CrossRef] [PubMed]
- Cross, A.J.; Pollock, J.R.A.; Bingham, S.A. Haem, Not Protein or Inorganic Iron, Is Responsible for Endogenous Intestinal N-Nitrosation Arising from Red Meat. Cancer Res. 2003, 63, 2358–2360. [Google Scholar] [PubMed]
- Lu, M.; Kuroki, M.; Amano, S.; Tolentino, M.; Keough, K.; Kim, I.; Bucala, R.; Adamis, A.P. Advanced Glycation End Products Increase Retinal Vascular Endothelial Growth Factor Expression. J. Clin. Investig. 1998, 101, 1219–1224. [Google Scholar] [CrossRef]
Disclaimer/Publisher’s Note: The statements, opinions and data contained in all publications are solely those of the individual author(s) and contributor(s) and not of MDPI and/or the editor(s). MDPI and/or the editor(s) disclaim responsibility for any injury to people or property resulting from any ideas, methods, instructions or products referred to in the content. |
© 2023 by the authors. Licensee MDPI, Basel, Switzerland. This article is an open access article distributed under the terms and conditions of the Creative Commons Attribution (CC BY) license (https://creativecommons.org/licenses/by/4.0/).