


Texting While Driving: A Literature Review on Driving Simulator Studies

 ,
,  ,
,  and
and 
Abstract
1. Introduction
2. Method
2.1. Protocol
2.2. Eligibility Criteria and Study Selection
2.3. Information Sources
2.4. Search
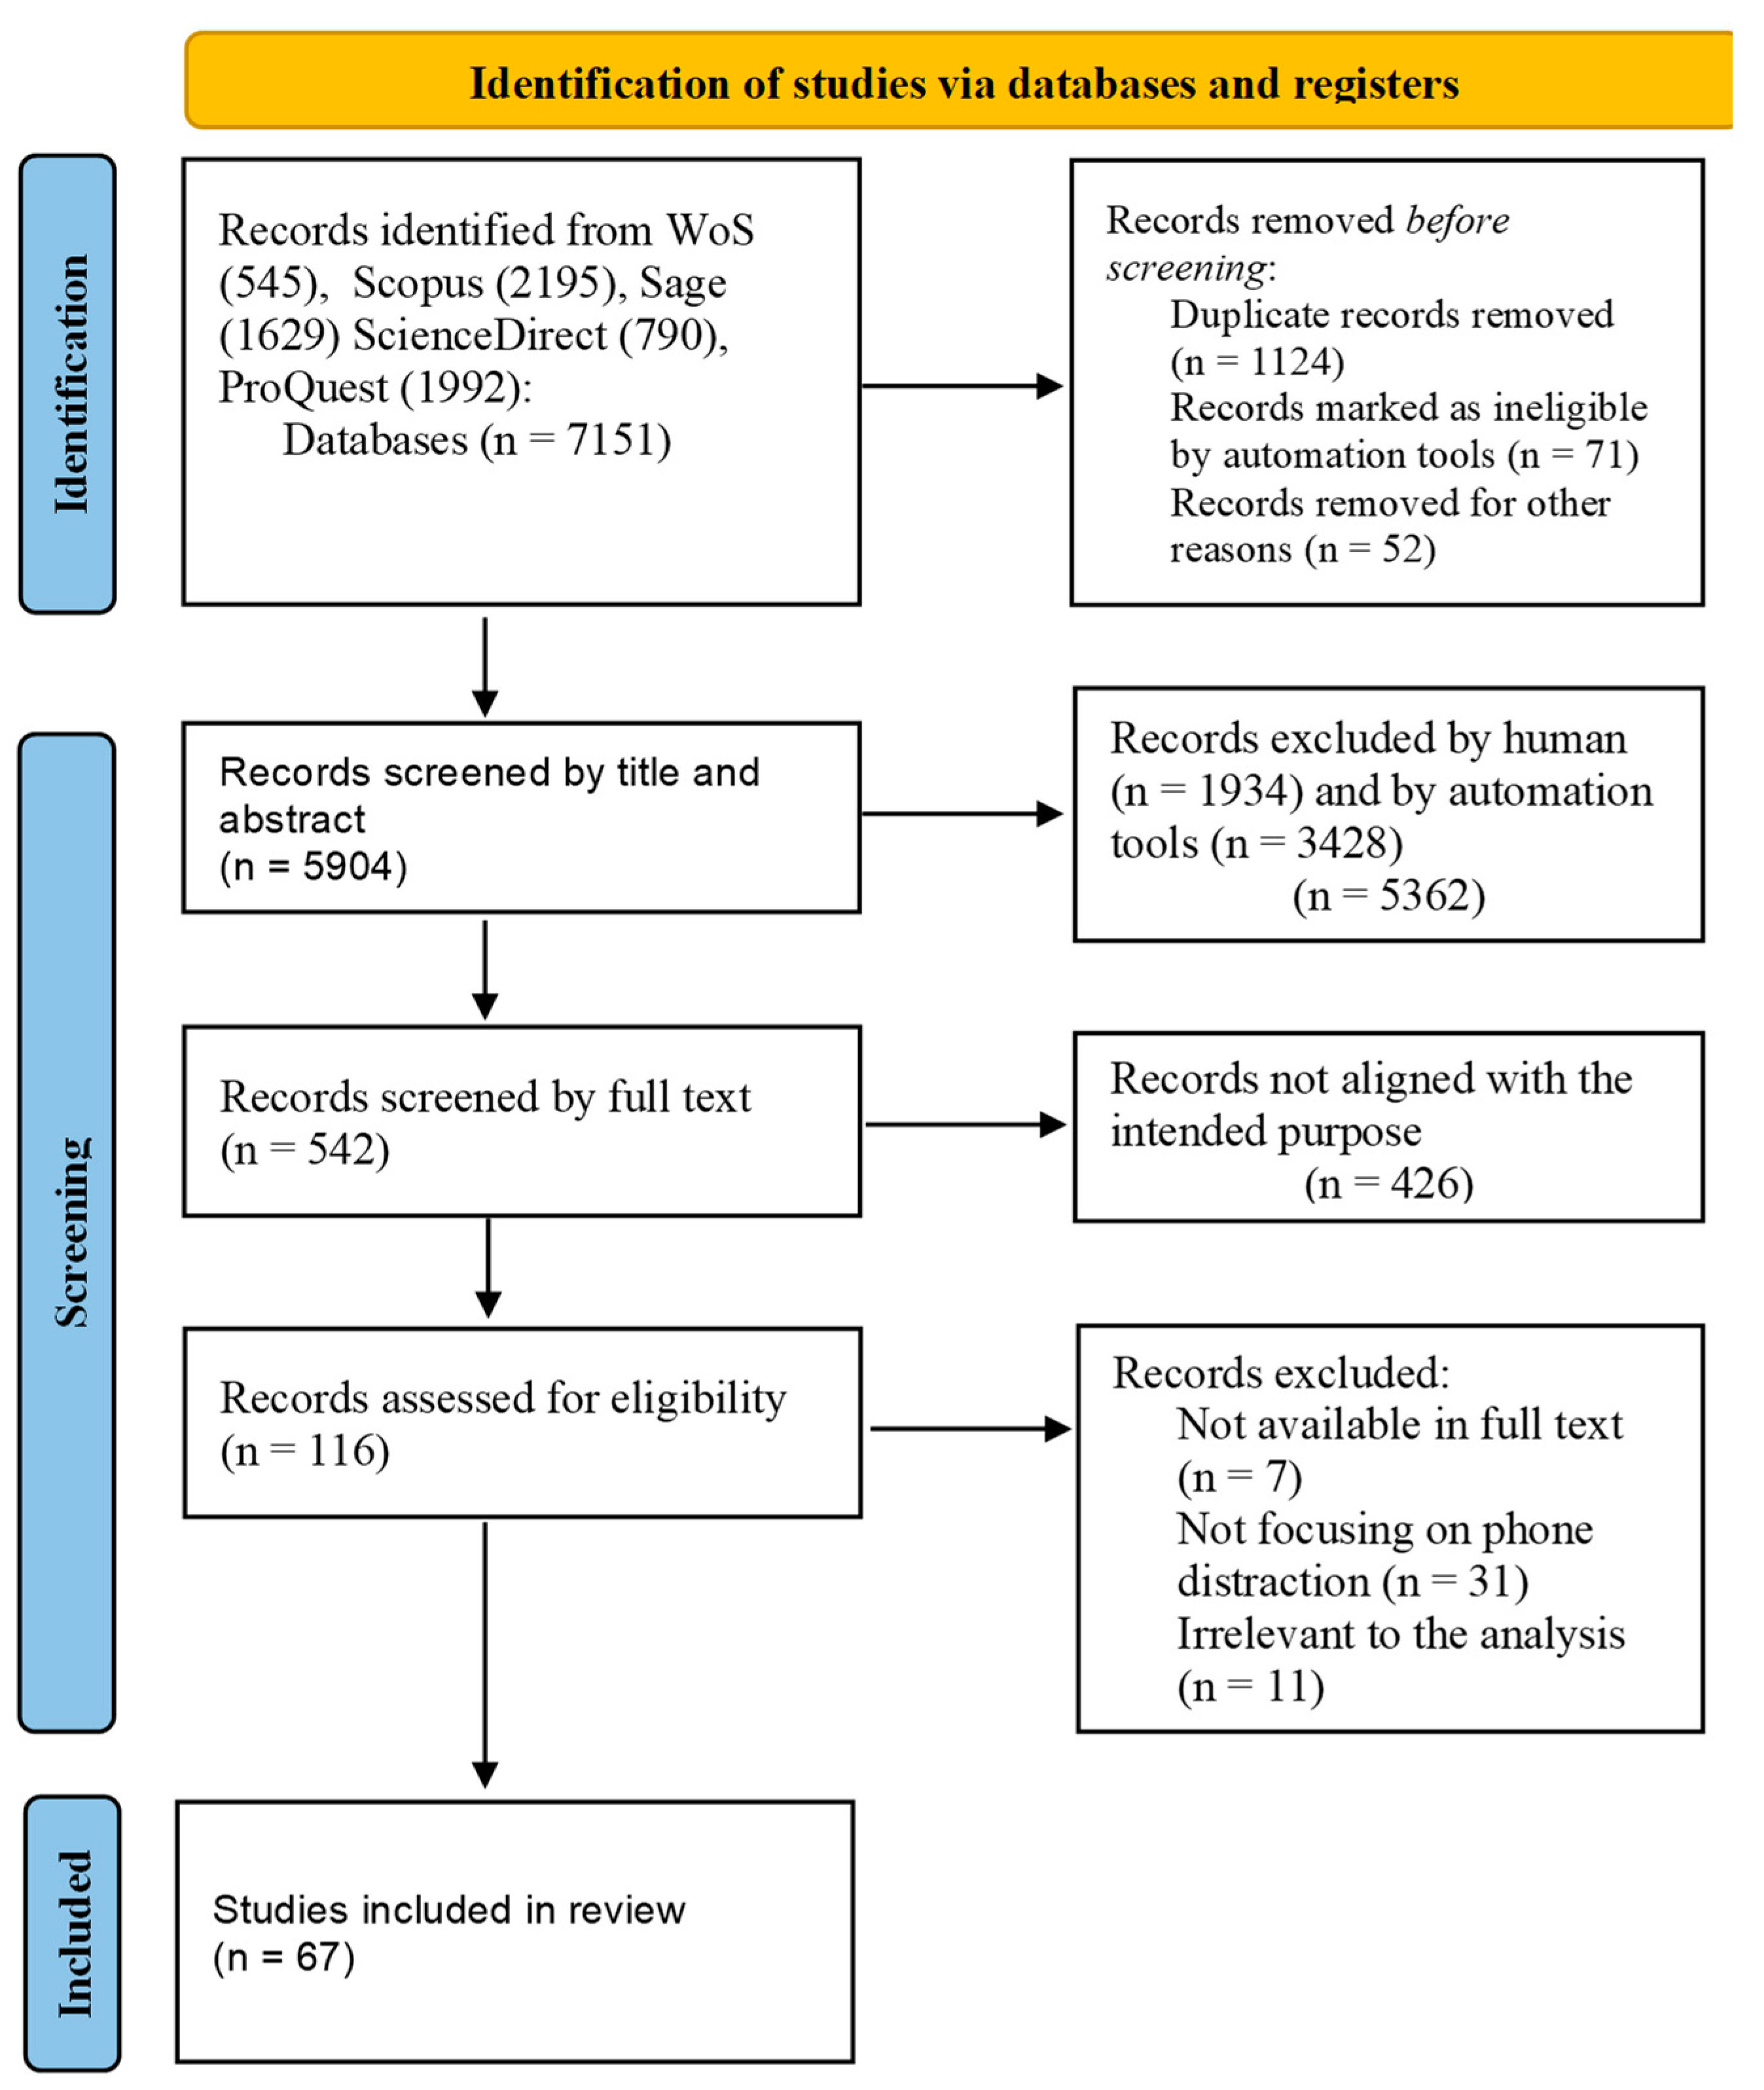
2.5. Study Selection
2.6. Data Extraction
2.7. Synthesis of the Results
3. Results
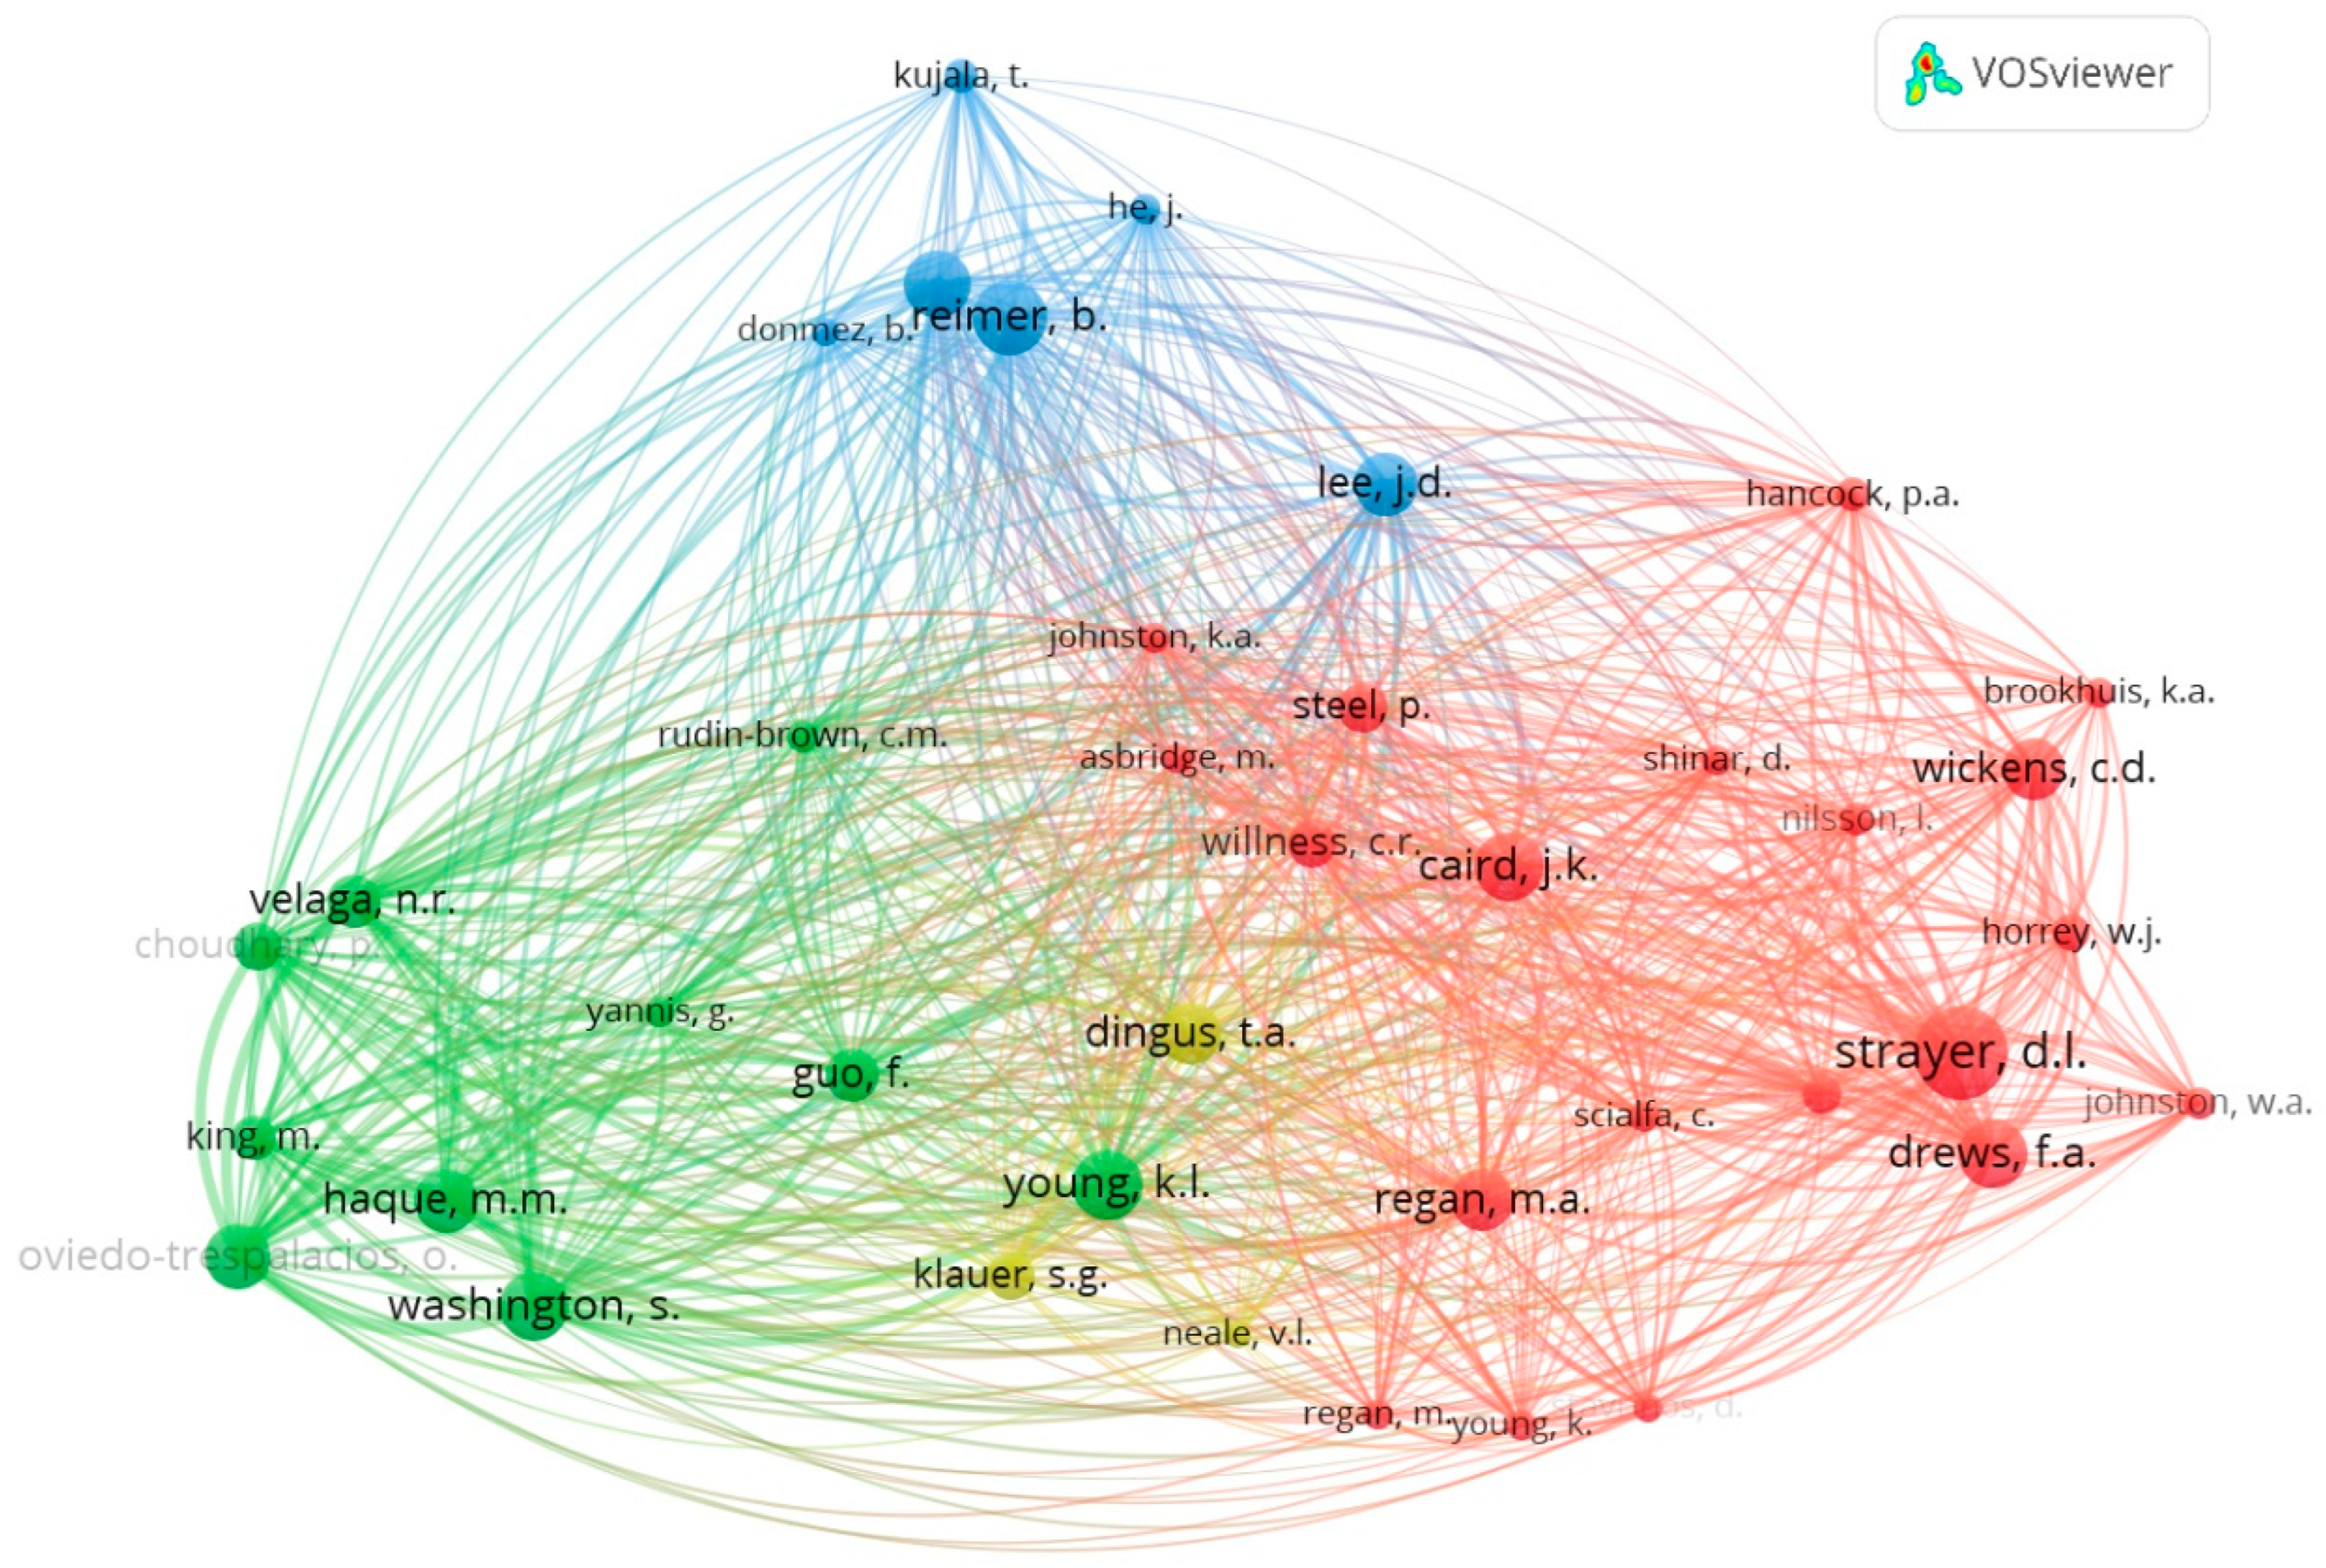
3.1. Characteristics of Studies
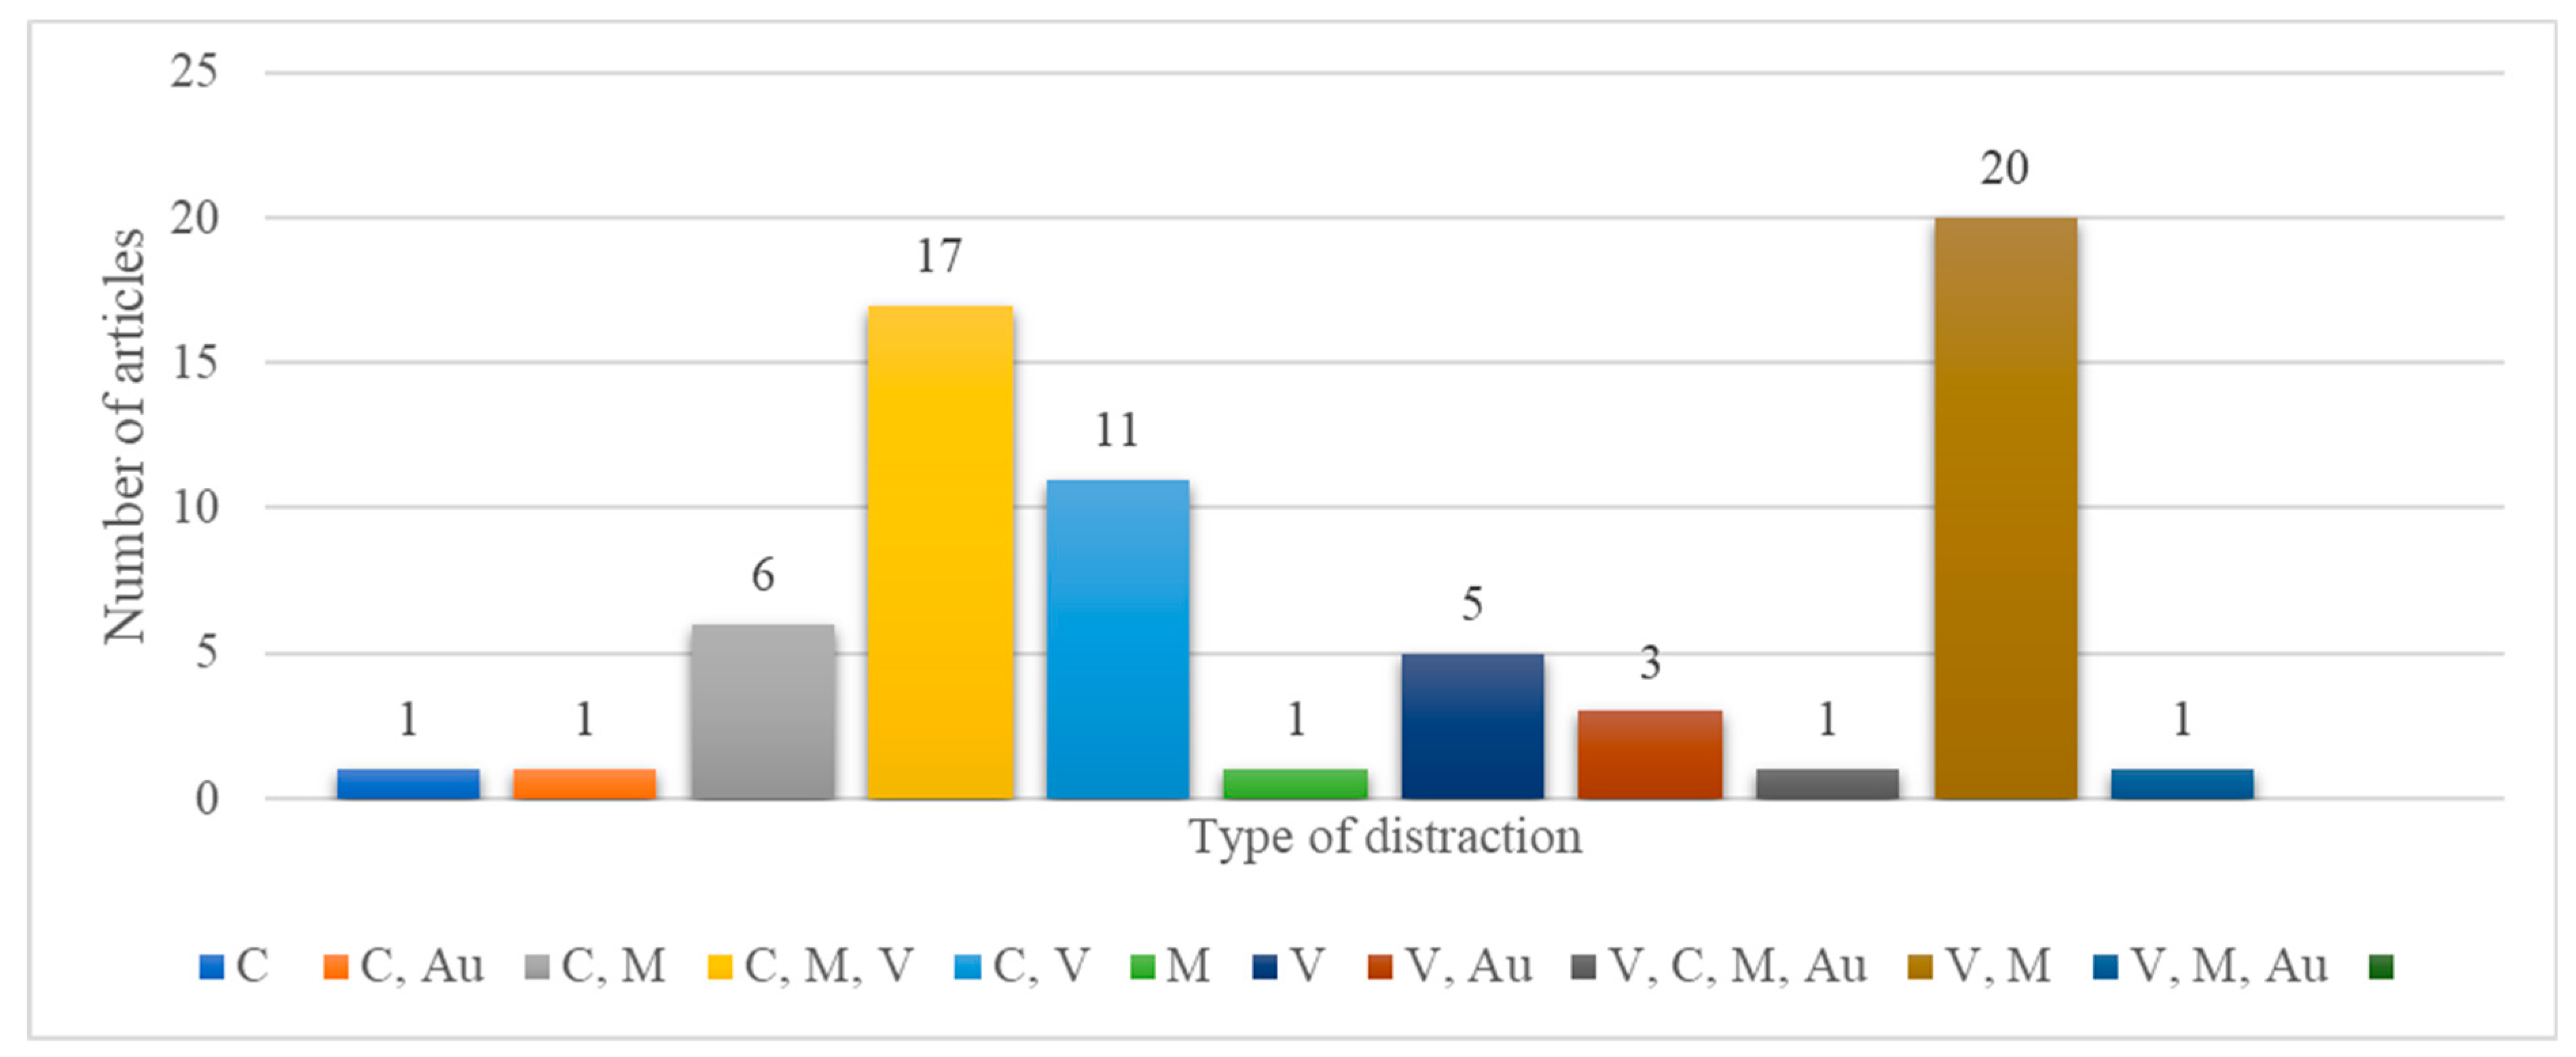
3.2. RQ1: What Types of Distractions Are Introduced When Using the Phone for TWD
3.3. RQ2: What Types of Hardware Devices Were Used during Experiments to Analyze the Driver’s Performance?
3.3.1. Driving Simulator Equipment
3.3.2. Driver-Tracking Equipment
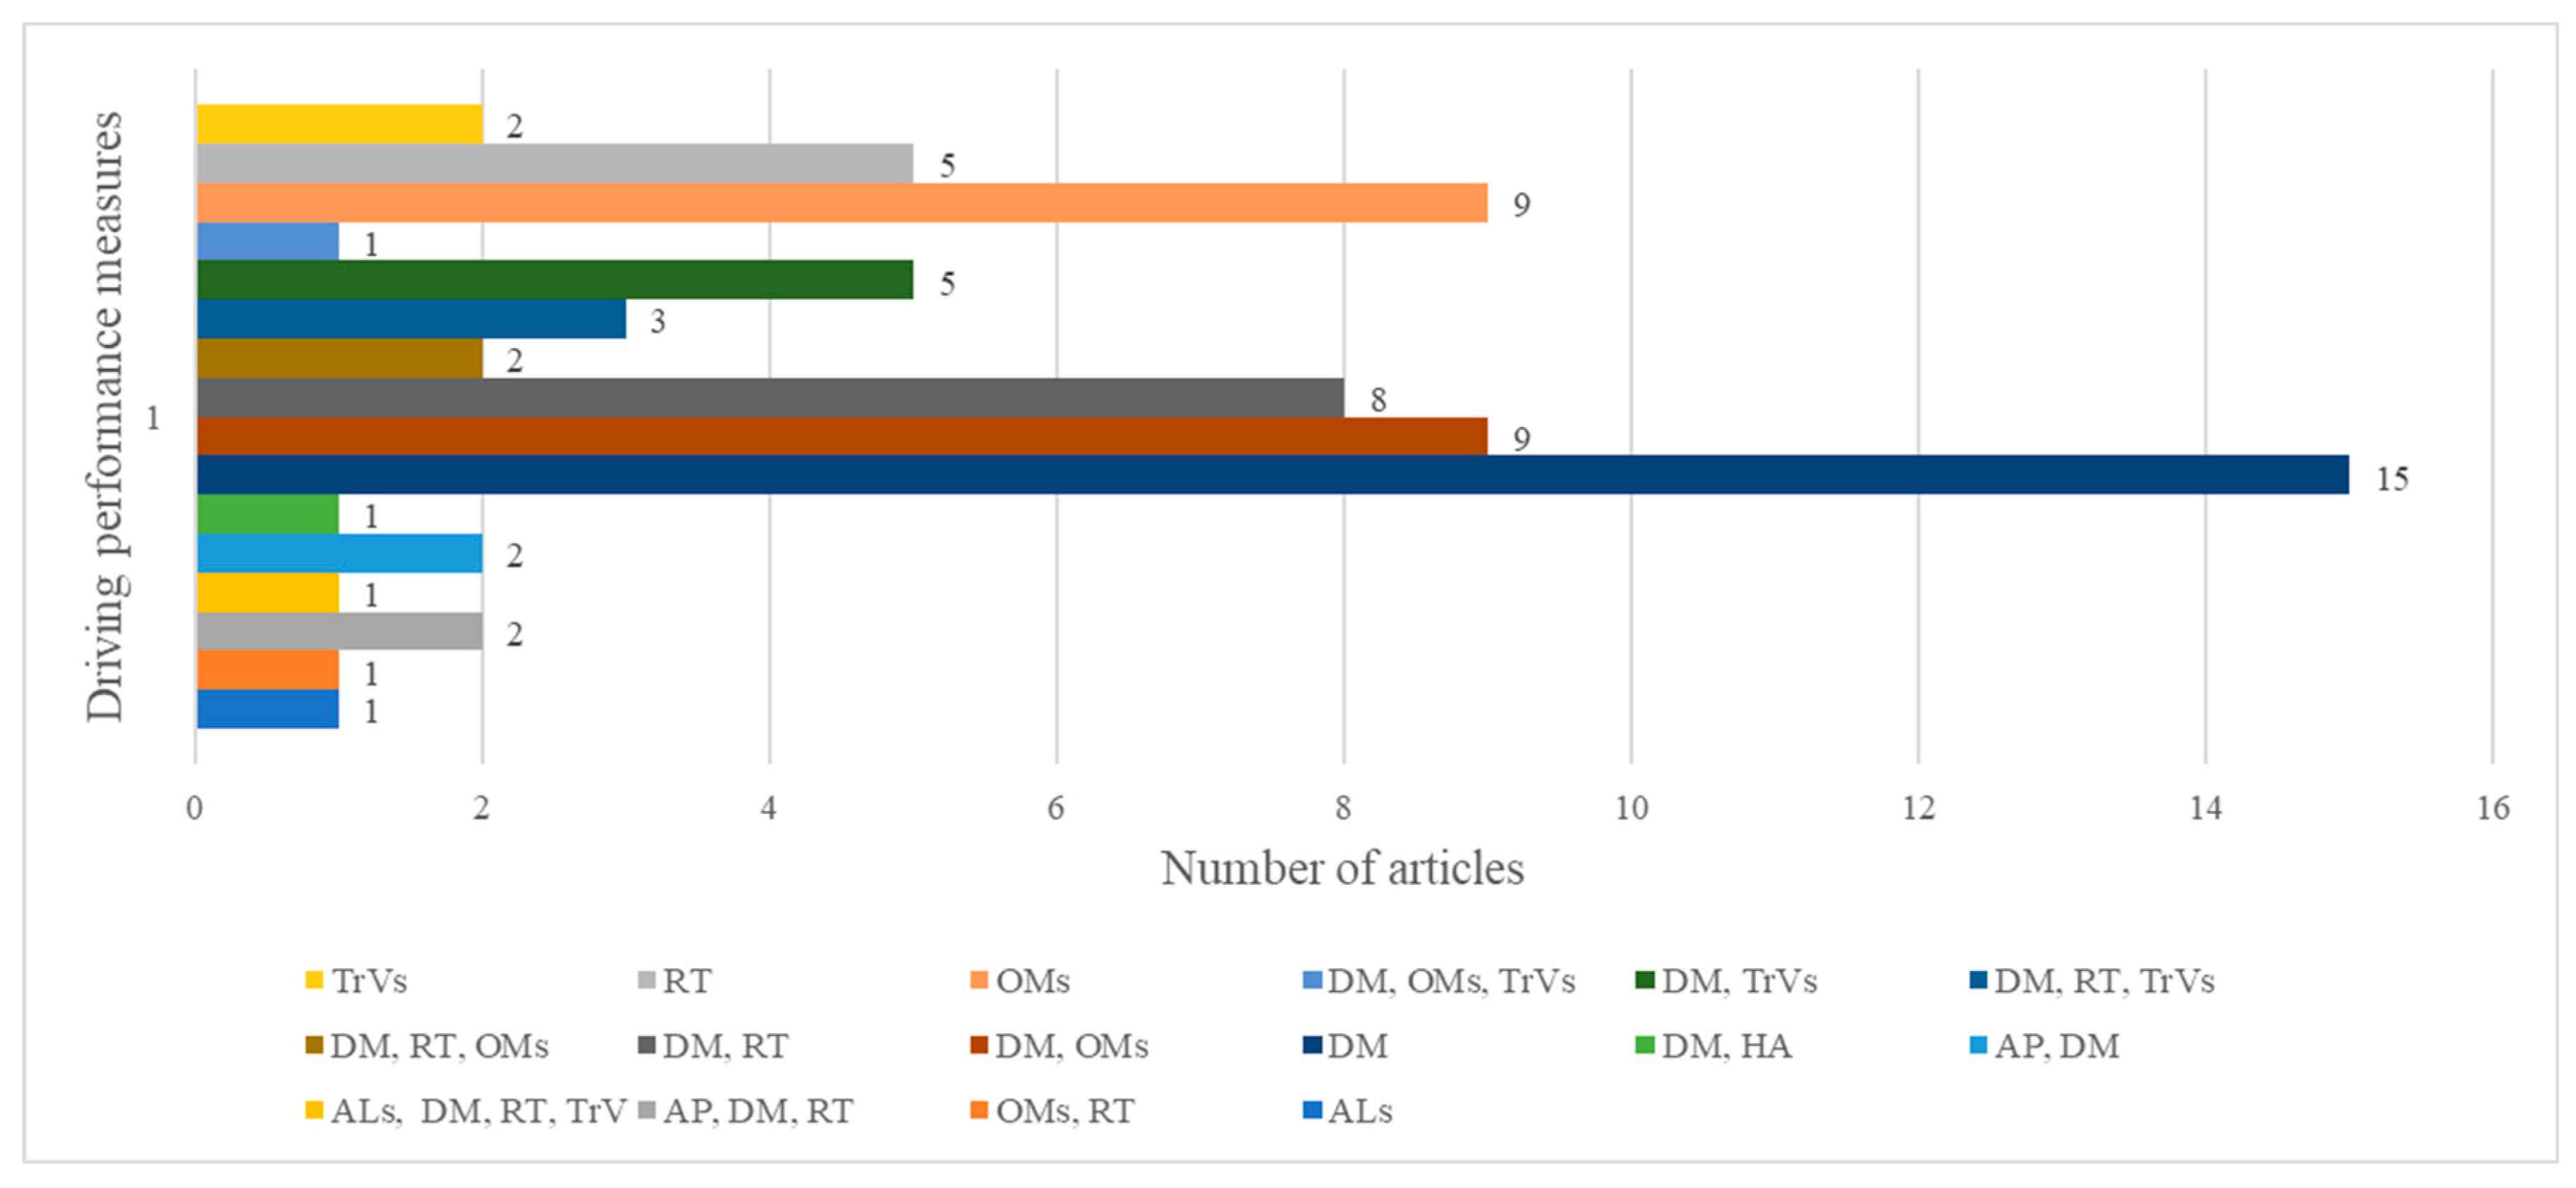
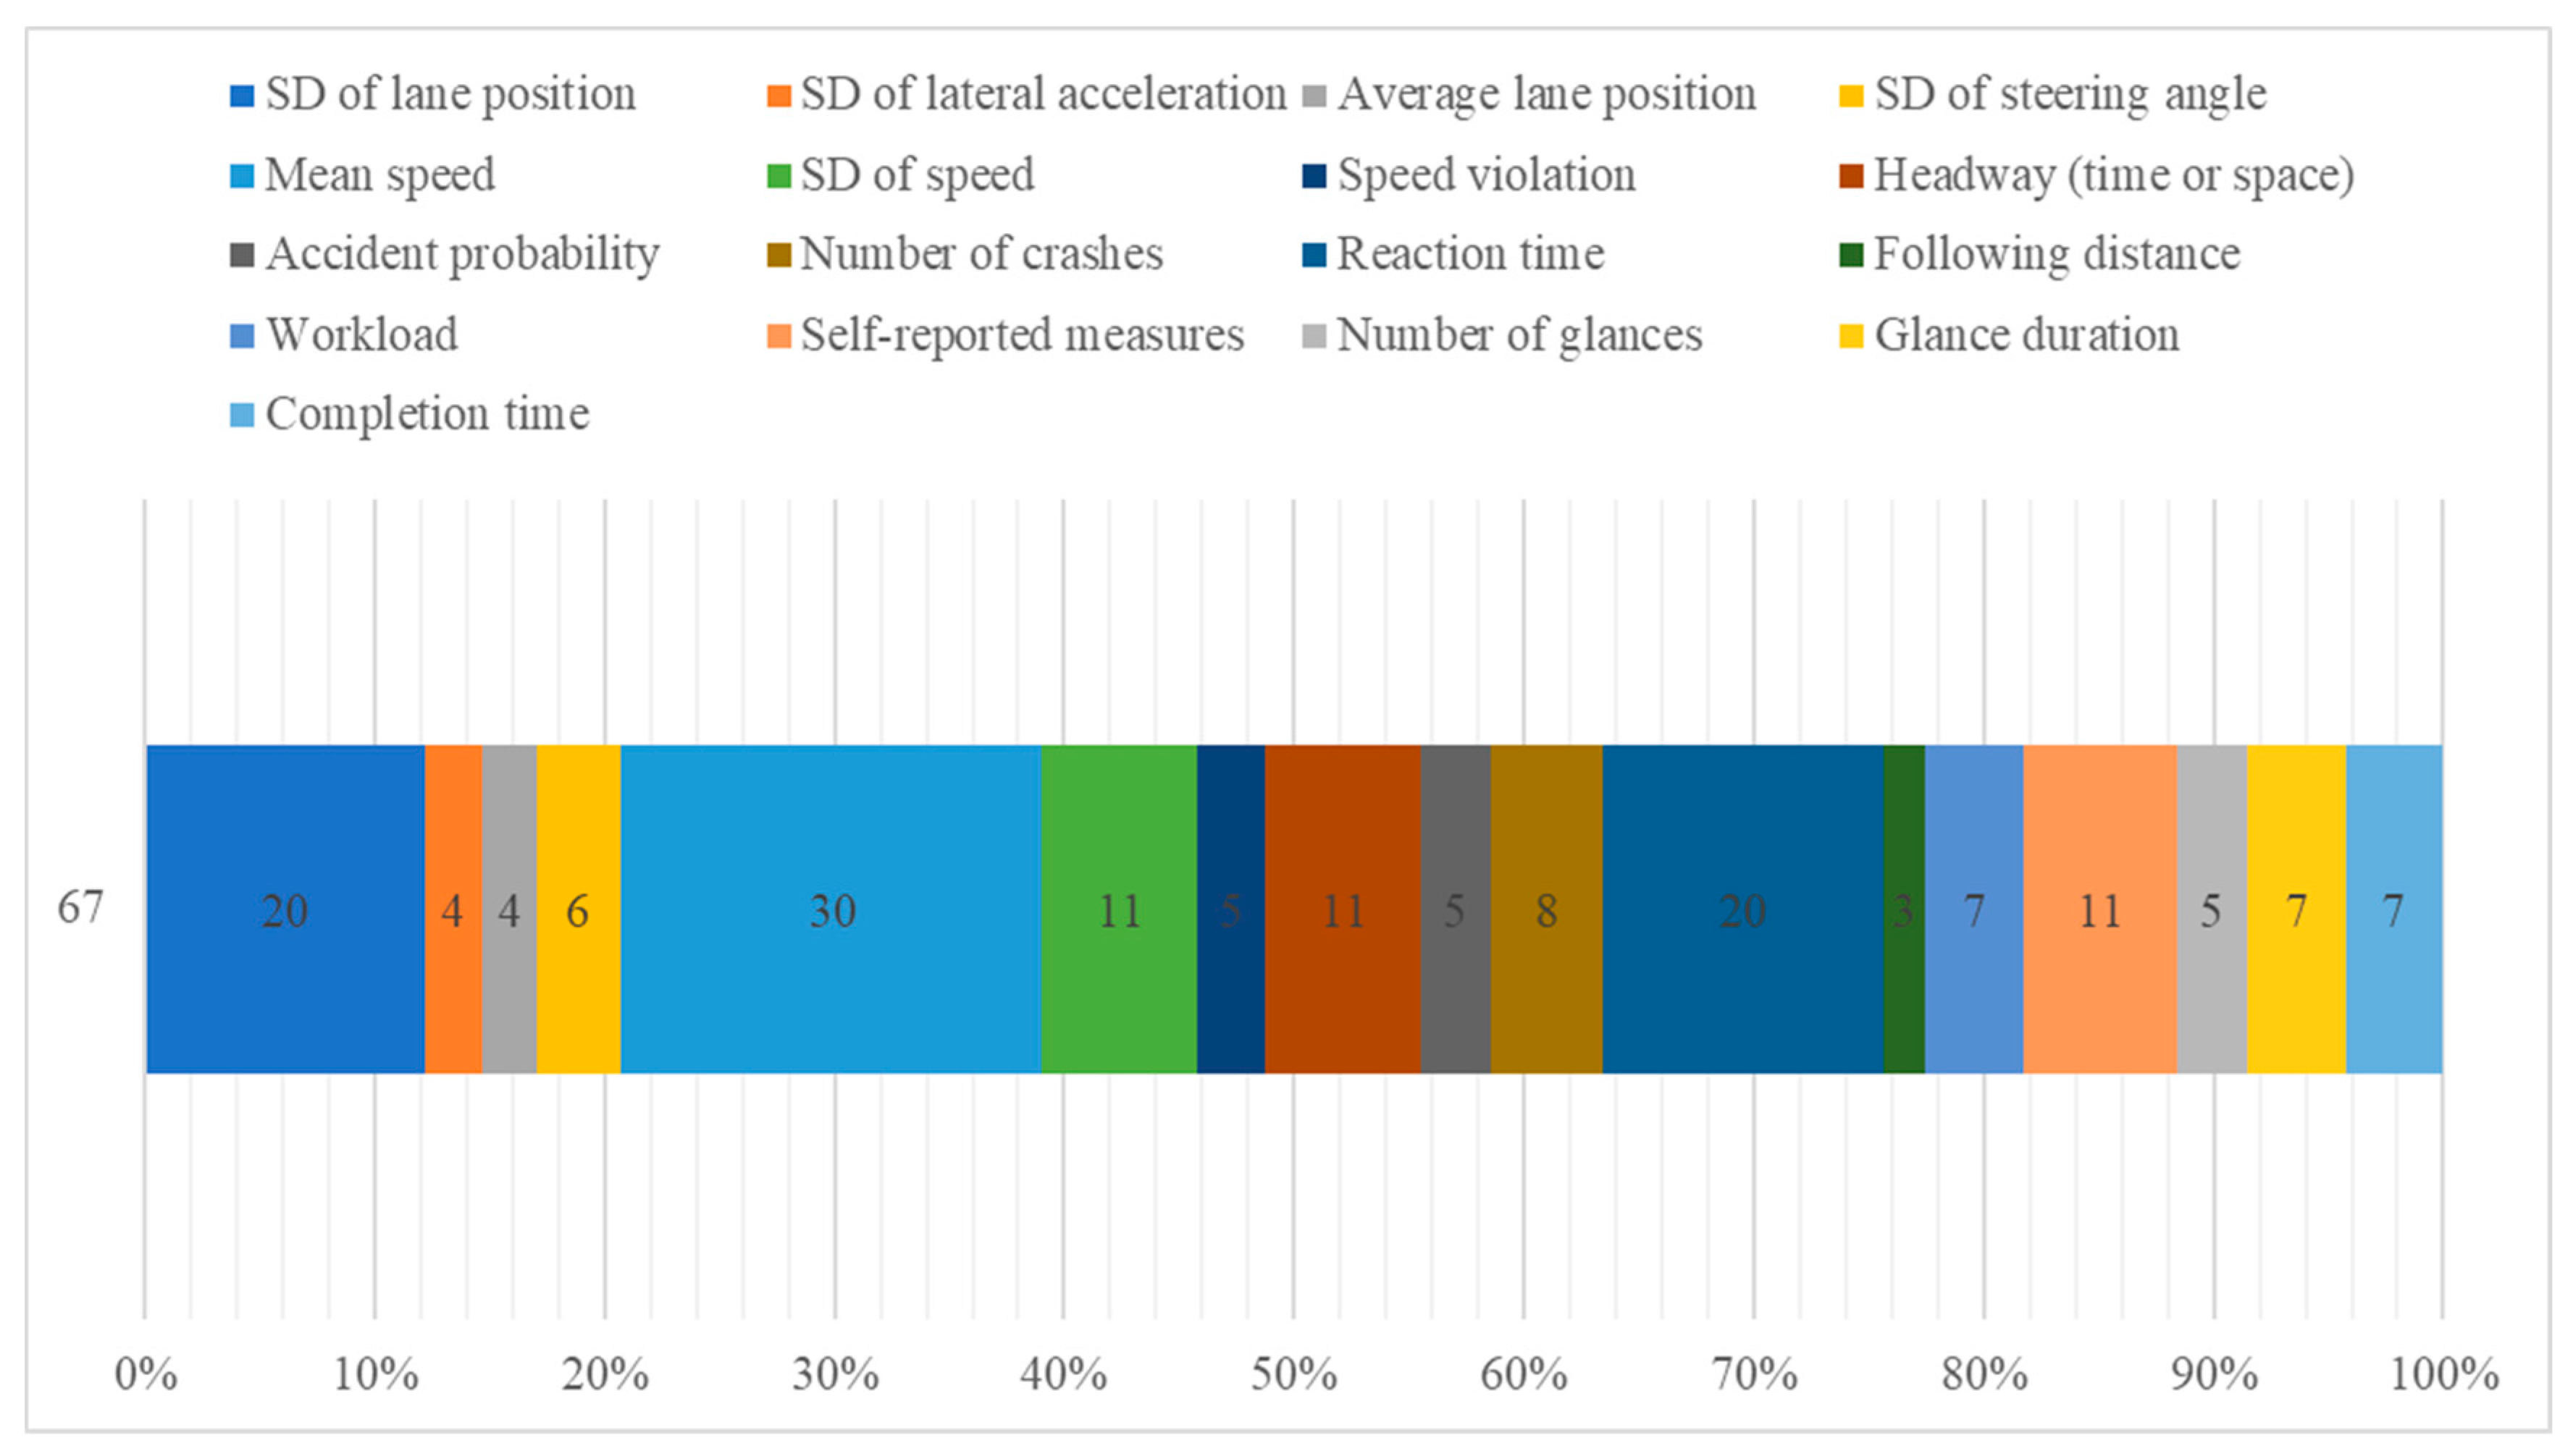
3.4. RQ3: What Measures Were Used to Analyze and Predict Distraction?
3.5. RQ4: What Is the Impact of Using Mobile Devices to Read and Write Messages While Driving?
4. Discussion
4.1. Recommendations and Directions for Future Research
- Hardware characteristics: The simulator should have a dashboard resembling that of a real car, providing at least three DOFs in terms of motion and having a display system that offers a minimum horizontal field of view of 135° [128]. It should have the basic vehicle controls, a sound system, and at least a system capable of monitoring the driver’s behavior, which includes functions that can detect distracted driving. Distraction-detection systems are important in the case of autonomous driving because automated-vehicle drivers will still need to be in the loop in order to take over the controls when necessary [129].
- Scenario—Driving scenarios should provide a similar experience to naturalistic driving [130] and highlight the different types of driving behavior [131]. Therefore, we consider that it is not enough to consider a single basic scenario and suggest that experiments should include at least two driving situations, having multiple driving conditions (for example, driving in urban, rural areas, less or more traffic, simpler or more complex road geometry, etc.).
4.2. Limitations
5. Conclusions
Author Contributions
Funding
Institutional Review Board Statement
Informed Consent Statement
Data Availability Statement
Conflicts of Interest
Appendix A

| ID | Ref. | NP | Sample Characteristics a | Driving Simulator Class b | LSR (km) | TD | MT | Type of Device—Distraction Task | Findings |
|---|---|---|---|---|---|---|---|---|---|
| 1 | [70] | 35 | NR; 22.5; NR; 21–14 | B | 2,65 | V, C, M | TrVs, DM | HH—texting | Based on vehicle dynamics, it is possible to identify specific distraction tasks with a level of accuracy that is adequate. |
| 2 | [54] | 25 | 22–33; 25; 2.6; NR | A | NR | V, M, C | OMs | HF—destination entry | In comparison to the primary visual-manual interaction with the Samsung Touch interface, voice entry (from Google Glass and Samsung) resulted in lower subjective workload ratings, lower standard deviation of lateral lane position, shorter task durations, faster remote Detection Response Task (DRT) reaction times, lower DRT miss rates, and less time looking off-road. |
| 3 | [50] | 134 | 20–30, 65–75; 23.2, 70.0; 2.8, 3.0; 23–40, 39–22 | A | 25.7 | V, Au + A | DM | HF—typing a number into a keypad, conversation with a car passenger, memorizing | Braking responses are affected by distractions, and this effect can last for up to 11.5 s. |
| 4 | [78] | 31 | 18–47; 25.61; 6.24; 16–15 | A | NR | V, C, M | TrVs | HH—received and answered text messages | Any mobile gadget, like a smartwatch, smartphone, or voice assistant, could affect how well you drive, especially if you have to pay attention to it when your eyes are off the road. |
| 5 | [93] | 24 | NR; 33, 26.3; NR; 8–4, 8–4 | B | NR | V, C, Au | DM | HF—receives traffic information | The two other systems required the participants to glance away from the road (too) long, endangering their safety, and reading an SMS took longer than scanning a PDA. The auditory information provision system, however, provided for the best driving performance. |
| 6 | [83] | 39 | 19–32; 21.5; 2.6; 27–12 | A | NR | V, C, M | TrVs | HF—respond to a call, replay several WhatsApp messages, use Instagram | Young drivers who use mobile phones while operating a vehicle experience impairments that limit their ability to control the vehicle. |
| 7 | [108] | 53 | 22–34; 25.25; 3.08; 37–16 | B | 3 | V, C, M | RT | HH—speech-based texting and handheld texting (two difficulty levels in each task) | Drivers undertake risk-compensation behavior by extending time headway in order to offset the higher accident risk associated with using a mobile phone while driving. Drivers perceive a rise in accident risk during distracted driving. |
| 8 | [102] | 41 | <25, 26–40, >41; NR; NR; 30–11 | B | 20 | V, M + A | DM, OMs | HF—enter the application interface of 3, 4, or 6 icons | In the HMI design of in-vehicle information, there is a statistically significant difference in driver perception reaction time for varying numbers of icons (IVI). |
| 9 | [17] | 100 | <30, 30–50, >50; 24.14, 36.05; 54.67; 2.79, 5.43, 5.04; 87–13 | B | 3.5 | V, C | DM | HH—simple conversation, complex conversation, and simple-texting and complex-texting tasks | Both talking on the phone and texting while driving impair a driver’s ability to pay enough attention to the road ahead, to react appropriately to unexpected traffic situations, and to control the car within a lane and in relation to other vehicles. |
| 10 | [18] | 100 | <30, 30–50, >51; 24.14, 36.05, 54.68; 2.79, 5.43, 5.05; 87–13 | B | 3.5 | V, C + RC, T | RT | HH—simple conversation, complex conversation, and simple-texting and complex-texting tasks | Simple conversations, complicated conversations, basic texts, and complex texts all increased reaction times for pedestrian crossing events by 40%, 95%, 137%, and 204%, respectively. For parked car crossing events, the tasks increased reaction times by 48%, 65%, 121%, and 171%, respectively. |
| 11 | [19] | 100 | <30, 30–50, >52; 24.14, 36.05, 54.69; 2.79, 5.43, 5.06; 87–13 | B | 3.5 | V, C + A, G | DM, AP | HH—simple conversation, complex conversation, simple texting and complex texting tasks | When engaged in conversation or texting duties, the drivers significantly decreased their mean speed by 2.62 m/s and 5.29 m/s, respectively, to offset the increased strain. |
| 12 | [32] | 49 | 22.12, 37.62; 22.12, 37.62; 2.45, 7.22; 22–3, 25–0 | B | 3.5 | V, C + A, E | DM | HH—simple conversation, complex conversation, simple texting and complex texting tasks | Younger drivers are less able to compensate for distractions while driving and have poorer longitudinal control. |
| 13 | [71] | 90 | <30, 30–55; 25.31, 37.00; 2.74, 6.29; 83–7 | B | NR | V, M + A | DM, RT | HH—conversation, texting, eating, music player | Most of the drivers (72.06%) reported texting as an extremely risky task |
| 14 | [49] | 14 | 18–22; NR; NR; | B | NR | C, M | DM | HH—cell phone conversation, back seat conversation, text message, Ipod manipulation | The iPod task and all wireless communication tasks caused a noticeable increase in speed variability throughout the driving scenario. |
| 15 | [86] | 49 | 19–65; 35.63; 14.26; 32–17 | B | 50 | V, C + A, G | OMs | HH—reading and comprehension task (three types of display) | Warnings took longer to read and comprehend (4 s on average), compared to recommendations. |
| 16 | [66] | 40 | 19–23; 21; NR; 20–20 | B | 51.5 | V, M | DM, RT | HH—text messaging | Simulated driving performance suffers when texting while operating a vehicle. This detrimental effect seems to be more severe than the consequences of using a cell phone for conversations while driving. |
| 17 | [80] | 17 | NR; 25.88; 5.82; 14,3 | B | NR | V, M | TrVs, DM | HH—accessing social network on the smartphone | Even when the driver is distracted, using an in-vehicle smartphone ADAS application has enhanced driving performance in a simulator.. |
| 18 | [56] | 101 | 18–57; 27.8; 8.3; 68,33 | A | NR | C, V, M | DM | HH—using a handheld cell phone; texting; eating | Regardless of their prior experience, multitasking while driving and distracting activities have a negative influence on driving performance for both genders and all age groups. The main factor that negatively affected driving performance was texting. |
| 19 | [109] | 56 | 21–30; 25.13; 2.57; 41–15 | B | 3 | V, C, M | RT | HF, HH—speech-based and handheld texting | Compared to the baseline, handheld texting tasks caused a delayed reaction to the unexpected braking occurrences. |
| 20 | [36] | 26 | 22–31, 22–29; 25.5, 23.9; 3.33, 2.27; 3–3, 20–0 | B | NR | V, M + A | RT, DM | HH—receive notification | The use of smartwatches could affect traffic safety. There may be a discrepancy between drivers’ actual performance and their views regarding using a wristwatch while driving, given that participants generally believed that smartwatch use resulted in similar or fewer traffic fines than smartphone use. |
| 21 | [55] | 48 | 20–79, 19–66; 34.8, 35.3; 16.0, 13.9; 17–7, 16–8 | C | NR | V | OMs | HH—email reading, view-switching, song searching, email replying | Compared to using standard smartphone apps, an automotive-specific application reduced the visual demand and visual distraction potential of in-car duties. |
| 22 | [72] | 63 | 25–66, 8–18; NR; NR; 32–31 | D | NR | V, M + A | DM | HH, HF—answer incoming calls, dialing, retrieve a voicemail message from a specific person using either the handheld or hands-free phone | Teenagers were shown to adopt risky following distances, to drive poorly, and to be more easily distracted by handheld phone tasks than adults. |
| 23 | [20] | 36 | NR; 20.95; 2.36; 16,10 | C | 6.8 | V, C, M | RT, DM | HH—social media browsing | Performance is impacted by both texting and using social media, but texting while driving is more harmful. |
| 24 | [90] | 20 | 18–21; NR; NR; 12,8 | C | 8 | V, M | DM, HA | HH—retrieve and send text messages | Text messaging has negative consequences on driving ability, which could explain the higher crash risks. |
| 25 | [99] | 24 | 18–64; 32.1; 12.5; 10,14 | A | 3.55 | V, M | DM | HH—manual dialing, voice-dialing | When participants utilized voice-activated dialing as opposed to manual dialing, there were 22% fewer lane-keeping mistakes and 56% fewer looks away from the road scene. |
| 26 | [69] | 40 | 20–52; 32.5; NR; 11,29 | B | NR | V, C | OMs | HH—touching the touch-screen telephone menu to a certain song, talking with laboratory assistant, answering a telephone via Bluetooth headset, and finding the navigation system from Ipad4 compute | The attention of the driver is substantially diverted from the road when engaging in secondary tasks while driving, and the evaluation model used in this study could accurately predict driving safety under various driving circumstances. |
| 27 | [61] | 24 | 20–45; 33.43; 6.32; 22–2 | A | NR | V | DM, RT | HF—ordering, route check, destination search | Usability and driving safety were higher when the phone was placed on the left side of the steering wheel as opposed to the right. |
| 28 | [33] | 29 | NR; 56.6, 55.9; 4.1, 3.0; 16, 13 | A | NR | V, M, N | RT, OMs | HH—sending a text message, searching navigation | When driving while sending a text message or using navigation, the jerk-cost function, medial-lateral coefficient of variation, and braking time were all higher than when driving alone. |
| 29 | [58] | 20 | 27–59; 37.65; 9.75; 14,6 | B | 10 + 9 | V, M, C | DM, OMs | HH—conversation, texting, destination entry, following route guidance | Only when individuals engaged in visual-manual tasks, such as texting and entering a location, when they frequently glanced away from the forward road, did lateral performance decline. |
| 30 | [64] | 30 | 18–30; 22.7; 3.51; 15,15 | A | 13 | C, M | DM, TrVs | HH—“temptation to text” | The “Temptation to Text” condition revealed noticeably more workload. Similarly, it was discovered that texting while driving drastically reduced vehicle performance. |
| 31 | [85] | 20 | 23–30; 26.20; 2.58; 10,10 | A | NR | C, M | TrVs, DM, ALs, RT | HF—conversation, HF cognitive demanding conversation, texting | Comparatively to legal BAC limits, very basic mobile phone conversations may not pose a substantial risk to driving, but cognitively taxing hands-free talks and, most notably, texting, do pose significant dangers. |
| 32 | [88] | 41 | 18-61; 31; 9.7; 23,18 | B | 5 | C + G | ALs | HF, HH—conversation | Drivers’ decisions regarding accepting gaps were unaffected by the distraction task, although the crossing’s completion time increased by over 10% in comparison to the baseline. Also, when using a phone at an intersection, drivers exhibited conservative behavior, slowing down more quickly, waiting longer, and keeping a greater distance from the vehicle in front of them. |
| 33 | [101] | 29 | 22–49; 30; 6; 15,14 | A | 1 | V, M | DM | HH—help, browse, filter task | The filtering task’s slider widget was overly demanding and hindered performance, whereas kinetic scrolling produced an equal amount of visual distraction although requiring less precise finger pointing. |
| 34 | [59] | 15 | NR; 28; 4.08; 12,3 | A | NR | C, V, M | OMs | HH—button, slider, Insert data, dropdown, radio buttons | When evaluating the mental workload related to wide differences in task complexity in terms of the amount of information to be processed, a commercial BCI device may be helpful. |
| 35 | [75] | 60 | 16–17; 16.8; 0.4; 20, 40 | B | NR | V, M + G | OMs | HH—looking at the phone, picking up the phone, taking a picture, sending the picture, hand manipulation of phone (mimicking writing a text), answering a call, and looking at a picture on the phone | Self-reported distracted driving habits grew with time, with a significant effect of visit on self-report outcomes. |
| 36 | [67] | 28 | 18–28; 21.0, 2.4; _; 16,12 | B | 1.1–1.5 | V, M | DM | HH—type and send a text message vs,. tunning car radio | Even in the simplest of driving situations, multitasking while operating a motor vehicle can have a negative impact on performance and increase risk. Comparing text messaging to other in-car activities like changing the radio, text messaging may present a “perfect storm” of risks. |
| 37 | [82] | 18 | 18–22; 20.4; NR; NR | C | NR | V, M | RT | HH—text messaging, reading Facebook posts (text/self-paced), exchanging photos via Snapchat, and viewing updates on Instagram | When compared to the image-based scenario (mean = 0.92 s) and the baseline, the brake reaction times (BRTs) in the text-based scenarios were substantially longer (mean = 1.16 s) (0.88 s). Both the task-pacing impact and the difference between BRTs in the image-based and baseline conditions were not statistically significant. |
| 38 | [63] | 64 | 22–60; 33; 10; 34, 30 | D | NR | V, C | RT | HH—reading, texting, video, social media, gaming, phoning, music | Reaction times did decrease when performing non-driving related tasks (NDRTs), suggesting that the NDRT assisted the drivers in keeping their focus during the partially automated drive. Drowsiness and the NDRT’s motivational appeal thus raised situation criticality, whereas the NDRT’s cognitive load decreased it. |
| 39 | [89] | 35 | 18–29; 22.9; 4.0; 22, 13 | D | 10 | V, M, C + RC | DM | HF, HH—calling, texting vs. road environment | Compared to distraction from a cell phone or other road elements like pedestrians and approaching vehicles, road geometry has a greater impact on driver behavior. |
| 40 | [76] | 35 | 18–29; 22.9; 4.0; 22, 13 | D | NR | V, M, C | OMs | HH—ring a doctor and cancel an appointment, text a friend and tell him/her that the participant will be arriving 10 min late, share the doctor’s phone number with a friend, and take a ‘selfie | The three types of self-regulation that distracted drivers use most frequently are tactical, operational, and strategic. |
| 41 | [30] | 50 | 27–55; 36.8; 5.8; 50,0 | D | NR | V, M, C | DM | HH—driving while having a conversation on the mobile phone, driving while reading out loud text messages and driving while texting | The “reading of text messages” and “texting” had a big impact on the “change of the steering position per second. For all three cell phone assignments, a substantial main effect was seen in terms of “following distance per second” and “change of the lateral lane position per second”. |
| 42 | [29] | 90 | NR; NR; NR; 73,17 | A | 3.6 | C, V | DM, RT, TrVs | HH—using the mobile phone, drinking and text messaging | The disruptive variables have a negative impact on road safety due to cognitive distraction and mobility limitation (e.g., longer response times and more errors), on the one hand, and have a bad impact on the environment and the economy (e.g., increased fuel consumption), on the other. |
| 43 | [105] | 36 | 21–54; 33.3; 8.6; 21–15 | B | 4.8 | V, Au | DM, RT | HF—features presented via a mobile phone mounted near the line of sight | The findings indicated that new features with the greatest levels of urgency and criticality, such as Emergency Vehicle Warning (EVW) and Emergency Electronic Brake Lights (EEBL), would improve safety and make it easier for emergency vehicles to reach their intervention site. |
| 44 | [68] | 36 | NR; NR; NR; 18,18 | A | NR | V, C, M, Au | RT, DM, OMs | HH—smartwatch vs. smartphone calling | By using a phone instead of just driving, participants shown increased off-road visual attention. |
| 45 | [73] | 32 | 17–21; 19.0, 19.3; NR; 7,9 | B | NR | V, M | DM, TrVs, RT | HH—manipulating controls of a radio/tape deck and dialing a handheld cellular phone | The time spent on tasks was marginally longer for participants who anticipated dangers compared to those who did not, but the difference was stable across tasks. |
| 46 | [87] | 45 | NR; 62.8, 24.3; 7.2, 4.8; 30–0, 11–4 | B | NR | V, P | DM, OMs | HH—texting on a smartphone and while sitting on a stable or unstable surface | When drivers were texting, the perceived workload increased, but balancing training decreased it. While seated on the unsteady surface, perceived workload was higher; however, it decreased after balance training. |
| 47 | [35] | 40 | NR; 20.47; 4.76; 24, 16 | B | 8.04 | V, M | DM, RT | HH—use Google Glass or a smartphone-based messaging interface | Glass-delivered messages served to reduce distracting cognitive demands, but they did not completely remove them. Comparatively speaking to driving when not multitasking, messaging while using either gadget impairs driving. |
| 48 | [81] | 37 | 18–33; 24.7; 3.6; 20–17 | B | NR | V | DM, RT, AP | HF—navigating on the Facebook newsfeed, reading and sending text messages in Facebook Messenger, searching for a location in Google Maps | Web browsing and texting-related distraction raise the likelihood of an accident, the headway, and the lateral distance deviation by 32%, 27%, and 6%, respectively. |
| 49 | [84] | 123 | 18–64; 34.46; 13.04; 62,61 | B | 26.4 | V, Au | DM, OMs | HH—audio warning, flashing display | There was no difference in the number of vehicles overtaken between the groups, and the existence of the speed warnings had no effect on overtaking. |
| 50 | [51] | 34 | 16–18; 17.25, 17.09; 0.99, 0.89; 12–4, 14–4 | B | 8.04 | C, M | DM, RT, TrVs | HH—conversing on a cell phone, text messaging | Compared to the no task and the cell-phone task, the lane position varied significantly more while texting. Teens with ADHD spent noticeably less time to finish the scenario while texting in particular. There were no discernible group-wide major effects detected. |
| 51 | [77] | 50 | 24–54; 39.8; 8.4; 49, 1 | B | 36.2 | C, M, V | TrVs, DM, OMs | HH—cell phone conversation, text message interaction, emailing interaction | Poorer driving performance was associated with more visually demanding jobs. Yet, using a cell phone caused fewer off-road eye looks. Drivers who described themselves as “extremely skilled” drove less well than those who described themselves as “talented.” |
| 52 | [94] | 75 | 16–18, 19–25; 17.67, 23.39; 1.18, 1.81; 11–19, 23–22 | B | 38,6 | C, M + T | TrVs, DM | HH—cell phone, texting | Texting generally resulted in more lane deviations and collisions. Text messaging was the most common form of distraction, which had a major negative influence on traffic flow. As a result, participants’ speeds fluctuated more, changed lanes less frequently, and took longer to finish the scenario. |
| 53 | [60] | 32 | 18–25; 20.6; 2.1; 32–0 | D | 13 | V | DM, TrVs | HH—gamified boredom intervention | The gamified boredom intervention promoted anticipatory driving while reducing risky coping strategies like speeding. |
| 54 | [132] | 36 | NR; 28.44; 9.26; 30,6 | A | NR | C, V, M | DM | HH—conversation, texting | Driver performance in the longitudinal and lateral control of the vehicle for the texting event significantly declined during the texting task. |
| 55 | [113] | 37 | NR; 21; 3.63; 11,26 | B | NR | C, Au | DM, OMs | HH—text-message distractions | For at least 10 s but no more than 30 s following the text message alert, situation awareness is negatively impacted. Participants’ mean speed increased during periods of distraction in the 10 s after receiving a mobile phone notification, which also resulted in a decrease in context awareness. |
| 56 | [100] | 27 | 24–59; 42.4; 9.1; 11, 16 | B | 4.4 | V, M + A, E | DM, OMs | HH vs. dashboard—texting with the smartphone in one hand (handheld drive) and texting while the phone is placed in a dashboard mount | Texting while driving when using a dashboard-mounted device impairs driving safety at least as much as texting while using a handheld device. |
| 57 | [98] | 40 | NR; 28; 12.6; 10,30 | A | NR | V, M + E | DM | HH—texting | Mobile phone texting dramatically reduced the ability to drive. Driving experience had no bearing on the results, however highly skilled phone users’ texting use had a noticeably reduced negative impact. |
| 58 | [95] | 40 | NR; 18.6; 1.8; 11–29 | B | NR | V, M, C | DM, OMs | HF, HH—conversation, texting, selecting a song | Although the amount of interference varied depending on the task, hands-free smartphone call created substantially less interference than texting and listening to music on an MP3 player. |
| 59 | [65] | 60 | NR; 19.74; 2.4; 30,3 | A | 8.04 | C, M | OMs | HF—conversation, texting | Driving while texting was similar to driving while not doing anything. The results of this study highlight the need for further investigation into the long-term effects of secondary task use while driving on cardiovascular reactivity as well as the dangers of secondary task use while driving on the risk of cardiovascular disease or stroke. |
| 60 | [110] | 36 | 18–56; 26.95; 5.076; 23,13 | A | 2.5 | M | DM, RT | HH—cell-phone texting | Driver groups with phone-texting distractions exhibited larger speed variability, longer average following HWDs, considerably slower reaction times, and longer distances needed for quick recovery in response to front-car braking events than driver groups without such distractions. |
| 61 | [91] | 34 | 18–28; NR; NR; 19,15 | A | NR | V, M + RC, W | DM, RT, AP | HH—texting | In both urban and rural road contexts, texting results in a statistically significant decrease in mean speed and an increase in mean reaction time. Due to driver distraction and delayed response at the time of the incident, it also increases the likelihood of an accident. |
| 62 | [92] | 34 | 18–24; NR; NR; 19,15 | B | 3 | V, M + W | DM, AP | HH—navigation, tuning the radio, replying to a text message, replying to a voice message, and making a phone call | On highways, texting appears to cause drivers to exhibit compensatory behavior, which statistically significantly reduces the mean speed and increases headway in both normal and particular traffic and weather conditions. |
| 63 | [74] | 34 | NR; 47.6, 23.05; NR; 23, 11 | A | NR | V, M + A | OMs | HF—normal conversation (non-emotional cellular conversation), and seven-level mathematical calculations | Making a call, returning a voicemail, and responding to texts are high-visual-load secondary chores that drivers shouldn’t engage in while operating a vehicle. |
| 64 | [62] | 43 | NR; 24.09; 3.27; 25–18 | B | 4.1 | V, C | DM, OMs | HF—texting, talking | For basic road portions, texting considerably raised the SDLP, although conversational tasks showed less lateral variance than when there was no distraction. |
| 65 | [31] | 28 | 18–55; 29.4; 11.3; 16, 12 | B | 9 | V, M, Au | RT, DM, OMs | HH—text messaging | Although Glass enables drivers to better maintain their visual attention on the front scene, they are still unable to efficiently divide their cognitive attention between the Glass display and the road environment, which impairs their ability to drive. |
| 66 | [79] | 20 | 22–47; 32.2; 6.3; 16, 4 | A | 3 | V, C | DM, OMs | HH—reading text on Glass and on a smartphone | When approaching active urban rail level crossings (RLXs), texting had a negative effect on how well the driver performed. |
| 67 | [57] | 101 | 18–57; 27.8; 8.3; 68, 33 | A | 6 | V, C, M | DM | HH—texting, talking on the phone, or eating | According to the simulation results, texting and, to a lesser extent, talking on the phone cause traffic to move more slowly on average and with higher coefficients of variation. |
References
- Caird, J.K.; Johnston, K.A.; Willness, C.R.; Asbridge, M.; Steel, P. A meta-analysis of the effects of texting on driving. Accid. Anal. Prev. 2014, 71, 311–318. [Google Scholar] [CrossRef]
- Caird, J.K.; Johnston, K.A.; Willness, C.R.; Asbridge, M. The use of meta-analysis or research synthesis to combine driving simulation or naturalistic study results on driver distraction. J. Saf. Res. 2014, 49, 91.e91–91.e96. [Google Scholar] [CrossRef] [PubMed]
- Boboc, R.G.; Voinea, G.D.; Buzdugan, I.D.; Antonya, C. Talking on the Phone While Driving: A Literature Review on Driving Simulator Studies. Int. J. Environ. Res. Public Health 2022, 19, 10554. [Google Scholar] [CrossRef] [PubMed]
- Li, L.; Pope, C.N.; Andridge, R.R.; Bower, J.K.; Hu, G.; Zhu, M. Cellphone laws and teens’ calling while driving: Analysis of repeated cross-sectional surveys in 2013, 2015, 2017, and 2019. Inj. Epidemiol. 2020, 7, 65. [Google Scholar] [CrossRef] [PubMed]
- Young, K.L.; Rudin-Brown, C.M.; Patten, C.; Ceci, R.; Lenné, M.G. Effects of phone type on driving and eye glance behaviour while text-messaging. Saf. Sci. 2014, 68, 47–54. [Google Scholar] [CrossRef]
- UN-General Assembly. Improving Global Road Safety: Resolution/Adopted by the General Assemblyon 31 August 2020. Available online: https://digitallibrary.un.org/record/3879711 (accessed on 13 December 2022).
- Guo, F.; Lu, D. How many crashes does cellphone use contribute to? Population attributable risk of cellphone use while driving. J. Saf. Res. 2022, 82, 385–391. [Google Scholar] [CrossRef]
- Kumar Yadav, A.; Velaga, N.R. A comprehensive systematic review of the laboratory-based research investigating the influence of alcohol on driving behaviour. Transp. Res. Part F Traffic Psychol. Behav. 2021, 81, 557–585. [Google Scholar] [CrossRef]
- Liang, O.S.; Yang, C.C. How are different sources of distraction associated with at-fault crashes among drivers of different age gender groups? Accid. Anal. Prev. 2022, 165, 106505. [Google Scholar] [CrossRef]
- NHTSA, Traffic Safety Facts—Research Note; National Highway Traffic Safety Administration: Washington, DC, USA, 2020.
- EC. Road Safety: 4000 Fewer People Lost Their Lives on EU Roads in 2020 as Death Rate Falls to All Time Low. Available online: https://ec.europa.eu/transport/modes/road/news/2021-04-20-road-safety_en (accessed on 17 January 2023).
- EC. Road Safety: European Commission Rewards Effective Initiatives and Publishes 2020 Figures on Road Fatalities; Directorate-General for Mobility and Transport: Brussels, Belgium, 2021. [Google Scholar]
- EC. 2020 Road Safety Statistics: What Is behind the Figures? Available online: https://transport.ec.europa.eu/background/2021-road-safety-statistics-what-behind-figures_en (accessed on 23 January 2023).
- Scarano, A.; Aria, M.; Mauriello, F.; Riccardi, M.R.; Montella, A. Systematic literature review of 10 years of cyclist safety research. Accid. Anal. Prev. 2023, 184, 106996. [Google Scholar] [CrossRef]
- Sriranga, A.K.; Lu, Q.; Birrell, S. A Systematic Review of In-Vehicle Physiological Indices and Sensor Technology for Driver Mental Workload Monitoring. Sensors 2023, 23, 2214. [Google Scholar] [CrossRef]
- NHTSA. Distracted Driving—Research Note. In Administration; National Highway Traffic Safety Administration: Washington, DC, USA, 2020. [Google Scholar]
- Choudhary, P.; Velaga, N.R. Analysis of vehicle-based lateral performance measures during distracted driving due to phone use. Transp. Res. Part F Traffic Psychol. Behav. 2017, 44, 120–133. [Google Scholar] [CrossRef]
- Choudhary, P.; Velaga, N.R. Modelling driver distraction effects due to mobile phone use on reaction time. Transp. Res. Part C Emerg. Technol. 2017, 77, 351–365. [Google Scholar] [CrossRef]
- Choudhary, P.; Velaga, N.R. Mobile phone use during driving: Effects on speed and effectiveness of driver compensatory behaviour. Accid. Anal. Prev. 2017, 106, 370–378. [Google Scholar] [CrossRef] [PubMed]
- Hashash, M.; Abou Zeid, M.; Moacdieh, N.M. Social media browsing while driving: Effects on driver performance and attention allocation. Transp. Res. Part F Traffic Psychol. Behav. 2019, 63, 67–82. [Google Scholar] [CrossRef]
- Caird, J.K.; Simmons, S.M.; Wiley, K.; Johnston, K.A.; Horrey, W.J. Does Talking on a Cell Phone, With a Passenger, or Dialing Affect Driving Performance? An Updated Systematic Review and Meta-Analysis of Experimental Studies. Hum. Factors 2018, 60, 101–133. [Google Scholar] [CrossRef] [PubMed]
- GHSA. Distracted Driving Laws by State; Governors Highway Safety Assocoation: Washington, DC, USA, 2022. [Google Scholar]
- Benedetti, M.H.; Lu, B.; Kinnear, N.; Li, L.; Delgado, M.K.; Zhu, M. The impact of Illinois’ comprehensive handheld phone ban on talking on handheld and handsfree cellphones while driving. J. Saf. Res. 2022; in press. [Google Scholar] [CrossRef]
- Östlund, J.; Peters, B.T.B.; Engström, J.; Markkula, G.; Keinath, A.; Horst, D.; Juch, S.; Mattes, S.U.F. Driving Performance Assessment—Methods and Metrics; 2005. [Google Scholar]
- Yang, Y.; Chen, M.; Wu, C.; Easa, S.M.; Zheng, X. Structural Equation Modeling of Drivers’ Situation Awareness Considering Road and Driver Factors. Front. Psychol. 2020, 11, 01601. [Google Scholar] [CrossRef]
- Galante, F.; Mauriello, F.; Pernetti, M.; Rella Riccardi, M.; Montella, A. Effects of Traffic Control Devices on Rural Curve Lateral Position. Transp. Res. Rec. 2022, 2676, 162–180. [Google Scholar] [CrossRef]
- Brijs, T.; Mauriello, F.; Montella, A.; Galante, F.; Brijs, K.; Ross, V. Studying the effects of an advanced driver-assistance system to improve safety of cyclists overtaking. Accid. Anal. Prev. 2022, 174, 106763. [Google Scholar] [CrossRef]
- Papantoniou, P.; Papadimitriou, E.; Yannis, G. Review of driving performance parameters critical for distracted driving research. Transp. Res. Procedia 2017, 25, 1796–1805. [Google Scholar] [CrossRef]
- Pauer, G.; Sipos, T.; Török, Á. Statistical analysis of the effects of disruptive factors of driving in simulated environment. Transport 2019, 34, 1–8. [Google Scholar] [CrossRef]
- Papadakaki, M.; Tzamalouka, G.; Gnardellis, C.; Lajunen, T.J.; Chliaoutakis, J. Driving performance while using a mobile phone: A simulation study of Greek professional drivers. Transp. Res. Part F Traffic Psychol. Behav. 2016, 38, 164–170. [Google Scholar] [CrossRef]
- Young, K.L.; Lenné, M.G.; Salmon, P.M.; Stanton, N.A. The impact of texting on driver behaviour at rail level crossings. Accid. Anal. Prev. 2018, 118, 269–276. [Google Scholar] [CrossRef] [PubMed]
- Choudhary, P.; Velaga, N.R. Effects of phone use on driving performance: A comparative analysis of young and professional drivers. Saf. Sci. 2019, 111, 179–187. [Google Scholar] [CrossRef]
- Kim, H.-S.; Choi, M.-H.; Choi, J.-S.; Kim, H.-J.; Hong, S.-P.; Jun, J.-H.; Tack, G.-R.; Kim, B.; Min, B.-C.; Lim, D.-W.; et al. Driving Performance Changes of Middle-Aged Experienced Taxi Drivers Due to Distraction Tasks during Unexpected Situations. Percept. Mot. Ski. 2013, 117, 411–426. [Google Scholar] [CrossRef] [PubMed]
- Knapper, A.; Christoph, M.; Hagenzieker, M.; Brookhuis, K. Comparing a driving simulator to the real road regarding distracted driving speed. Eur. J. Transp. Infrastruct. Res. 2015, 15, 205–225. [Google Scholar] [CrossRef]
- Sawyer, B.D.; Finomore, V.S.; Calvo, A.A.; Hancock, P.A. Google Glass: A Driver Distraction Cause or Cure? Hum. Factors 2014, 56, 1307–1321. [Google Scholar] [CrossRef] [PubMed]
- Giang, W.C.W.; Winnie Chen, H.Y.; Donmez, B. Smartwatches vs. Smartphones: Notification engagement while driving. Int. J. Mob. Hum. Comput. Interact. 2017, 9, 39–57. [Google Scholar] [CrossRef]
- Blana, E. Driving Simulator Validation Studies: A Literature Review; Institute for Transport Studies, University of Leeds: Leeds, UK, 1996. [Google Scholar]
- Blana, E. A Survey of Driving Research Simulators Around the World; Institute of Transport Studies, University of Leeds: Leeds, UK, 1996. [Google Scholar]
- Alicandri, E. HYSIM: The next best thing to being on the road. Public Roads 1994, 57, 19–23. [Google Scholar]
- Eryilmaz, U.; Sancar Tokmak, H.; Cagiltay, K.; Isler, V.; Eryilmaz, N.O. A novel classification method for driving simulators based on existing flight simulator classification standards. Transp. Res. Part C Emerg. Technol. 2014, 42, 132–146. [Google Scholar] [CrossRef]
- Allen, T.; Tarr, R. Driving simulators for commercial truck drivers-humans in the loop. In Proceedings of the Driving Assesment Conference, Rockport, ME, USA, 27–30 June 2005. [Google Scholar]
- Lang, B.; Parkes, A.; Cotter, S.; Robbins, R.; Diels, C.; Vanhulle, P.; Turi, G.; Bekiaris, E.; Panou, M.; Kapplusch, J. Benchmarking and Classification of CBT Tools for Driver Training; TRAIN-ALL Deliverable 1.1; TRAIN-ALL Consortium, 2007. [Google Scholar]
- Govil, V.; Lovell, S.; Suresh, P.; Wu, Q.; Yang, G.; Mourant, R.R. A high-resolution wide-screen display for simulators and virtual reality. In Proceedings of the Human Factors and Ergonomics Society Annual Meeting, New Orleans, LA, USA, 20–24 September 2004; pp. 2131–2133. [Google Scholar]
- Zhao, X.; Sarasua, W.A. How to Use Driving Simulators Properly: Impacts of Human Sensory and Perceptual Capabilities on Visual Fidelity. Transp. Res. Part C Emerg. Technol. 2018, 93, 381–395. [Google Scholar] [CrossRef]
- Tu, H.; Li, Z.; Li, H.; Zhang, K.; Sun, L. Driving simulator fidelity and emergency driving behavior. Transp. Res. Rec. 2015, 2518, 113–121. [Google Scholar] [CrossRef]
- Munn, Z.; Peters, M.D.J.; Stern, C.; Tufanaru, C.; McArthur, A.; Aromataris, E. Systematic review or scoping review? Guidance for authors when choosing between a systematic or scoping review approach. BMC Med. Res. Methodol. 2018, 18, 143. [Google Scholar] [CrossRef] [PubMed]
- Daudt, H.M.L.; van Mossel, C.; Scott, S.J. Enhancing the scoping study methodology: A large, inter-professional team’s experience with Arksey and O’Malley’s framework. BMC Med. Res. Methodol. 2013, 13, 48. [Google Scholar] [CrossRef]
- Tricco, A.C.; Lillie, E.; Zarin, W.; O’Brien, K.K.; Colquhoun, H.; Levac, D.; Moher, D.; Peters, M.D.J.; Horsley, T.; Weeks, L.; et al. PRISMA Extension for Scoping Reviews (PRISMA-ScR): Checklist and Explanation. Ann. Intern. Med. 2018, 169, 467–473. [Google Scholar] [CrossRef]
- Crisler, M.C.; Brooks, J.O.; Ogle, J.H.; Guirl, C.D.; Alluri, P.; Dixon, K.K. Effect of Wireless Communication and Entertainment Devices on Simulated Driving Performance. Transp. Res. Rec. 2008, 2069, 48–54. [Google Scholar] [CrossRef]
- Bock, O.; Stojan, R.; Wechsler, K.; Mack, M.; Voelcker-Rehage, C. Distracting tasks have persisting effects on young and older drivers’ braking performance. Accid. Anal. Prev. 2021, 161, 106363. [Google Scholar] [CrossRef]
- Stavrinos, D.; Garner, A.A.; Franklin, C.A.; Johnson, H.D.; Welburn, S.C.; Griffin, R.; Underhill, A.T.; Fine, P.R. Distracted Driving in Teens With and Without Attention-Deficit/Hyperactivity Disorder. J. Pediatr. Nurs. 2015, 30, e183–e191. [Google Scholar] [CrossRef]
- Nunes, L.; Recarte, M.A. Cognitive demands of hands-free-phone conversation while driving. Transp. Res. Part F Traffic Psychol. Behav. 2002, 5, 133–144. [Google Scholar] [CrossRef]
- Young, K.; Regan, M.; Hammer, M. Driver Distraction: A Review of the Literature; Monash University, Accident Research Centre: Clayton, Australia, 2003. [Google Scholar]
- Beckers, N.; Schreiner, S.; Bertrand, P.; Mehler, B.; Reimer, B. Comparing the demands of destination entry using Google Glass and the Samsung Galaxy S4 during simulated driving. Appl. Ergon. 2017, 58, 25–34. [Google Scholar] [CrossRef]
- Grahn, H.; Kujala, T. Impacts of Touch Screen Size, User Interface Design, and Subtask Boundaries on In-Car Task’s Visual Demand and Driver Distraction. Int. J. Hum.-Comput. Stud. 2020, 142, 102467. [Google Scholar] [CrossRef]
- Farah, H.; Zatmeh, S.; Toledo, T.; Wagner, P. Impact of distracting activities and drivers’ cognitive failures on driving performance. Adv. Transp. Stud. 2016, 1, 71–82. [Google Scholar]
- Zatmeh-Kanj, S.; Toledo, T. Car Following and Microscopic Traffic Simulation Under Distracted Driving. Transp. Res. Rec. 2021, 2675, 03611981211000357. [Google Scholar] [CrossRef]
- Knapper, A.S.; Hagenzieker, M.P.; Brookhuis, K.A. Do in-car devices affect experienced users’ driving performance? IATSS Res. 2015, 39, 72–78. [Google Scholar] [CrossRef]
- Louveton, N.; Sengupta, K.; McCall, R.; Frank, R.; Engel, T. Testing a Commercial BCI Device for In-Vehicle Interfaces Evaluation: A Simulator and Real-World Driving Study. Int. J. Mob. Comput. Multimed. Commun. 2017, 8, 1–13. [Google Scholar] [CrossRef]
- Steinberger, F.; Schroeter, R.; Watling, C.N. From road distraction to safe driving: Evaluating the effects of boredom and gamification on driving behaviour, physiological arousal, and subjective experience. Comput. Hum. Behav. 2017, 75, 714–726. [Google Scholar] [CrossRef]
- Jing, C.; Bryan-Kinns, N.; Yang, S.; Zhi, J.; Zhang, J. The influence of mobile phone location and screen orientation on driving safety and the usability of car-sharing software in-car use. Int. J. Ind. Ergon. 2021, 84, 103168. [Google Scholar] [CrossRef]
- Yan, Y.; Zhong, S.; Tian, J.; Song, L. Driving distraction at night: The impact of cell phone use on driving behaviors among young drivers. Transp. Res. Part F Traffic Psychol. Behav. 2022, 91, 401–413. [Google Scholar] [CrossRef]
- Naujoks, F.; Höfling, S.; Purucker, C.; Zeeb, K. From partial and high automation to manual driving: Relationship between non-driving related tasks, drowsiness and take-over performance. Accid. Anal. Prev. 2018, 121, 28–42. [Google Scholar] [CrossRef]
- Lansdown, T.C. The temptation to text when driving—Many young drivers just can’t resist. Transp. Res. Part F Traffic Psychol. Behav. 2019, 65, 79–88. [Google Scholar] [CrossRef]
- Welburn, S.C.; Amin, A.; Stavrinos, D. Effect of electronic device use while driving on cardiovascular reactivity. Transp. Res. Part F-Traffic Psychol. Behav. 2018, 54, 188–195. [Google Scholar] [CrossRef]
- Drews, F.A.; Yazdani, H.; Godfrey, C.N.; Cooper, J.M.; Strayer, D.L. Text Messaging During Simulated Driving. Hum. Factors 2009, 51, 762–770. [Google Scholar] [CrossRef] [PubMed]
- McKeever, J.D.; Schultheis, M.T.; Padmanaban, V.; Blasco, A. Driver Performance While Texting: Even a Little is Too Much. Traffic Inj. Prev. 2013, 14, 132–137. [Google Scholar] [CrossRef] [PubMed]
- Perlman, D.; Samost, A.; Domel, A.G.; Mehler, B.; Dobres, J.; Reimer, B. The relative impact of smartwatch and smartphone use while driving on workload, attention, and driving performance. Appl. Ergon. 2019, 75, 8–16. [Google Scholar] [CrossRef]
- Jin, L.; Xian, H.; Niu, Q.; Bie, J. Research on safety evaluation model for in-vehicle secondary task driving. Accid. Anal. Prev. 2015, 81, 243–250. [Google Scholar] [CrossRef]
- Atiquzzaman, M.; Qi, Y.; Fries, R. Real-time detection of drivers’ texting and eating behavior based on vehicle dynamics. Transp. Res. Part F Traffic Psychol. Behav. 2018, 58, 594–604. [Google Scholar] [CrossRef]
- Choudhary, P.; Gupta, A.; Velaga, N.R. Perceived risk vs actual driving performance during distracted driving: A comparative analysis of phone use and other secondary distractions. Transp. Res. Part F Traffic Psychol. Behav. 2022, 86, 296–315. [Google Scholar] [CrossRef]
- Greenberg, J.; Tijerina, L.; Curry, R.; Artz, B.; Cathey, L.; Kochhar, D.; Kozak, K.; Blommer, M.; Grant, P. Driver Distraction: Evaluation with Event Detection Paradigm. Transp. Res. Rec. 2003, 1843, 1–9. [Google Scholar] [CrossRef]
- Reed-Jones, J.; Trick, L.M.; Matthews, M. Testing assumptions implicit in the use of the 15-second rule as an early predictor of whether an in-vehicle device produces unacceptable levels of distraction. Accid. Anal. Prev. 2008, 40, 628–634. [Google Scholar] [CrossRef]
- Yao, Y.; Zhao, X.; Feng, X.; Rong, J. Assessment of secondary tasks based on drivers’ eye-movement features. IEEE Access 2020, 8, 136108–136118. [Google Scholar] [CrossRef]
- McDonald, C.C.; Fargo, J.D.; Swope, J.; Metzger, K.B.; Sommers, M.S. Initial Testing of a Web-Based Intervention to Reduce Adolescent Driver Inattention: A Randomized Controlled Trial. J. Emerg. Nurs. 2021, 47, 88–100.e103. [Google Scholar] [CrossRef] [PubMed]
- Oviedo-Trespalacios, O.; Haque, M.M.; King, M.; Washington, S. “Mate! I’m running 10 min late”: An investigation into the self-regulation of mobile phone tasks while driving. Accid. Anal. Prev. 2019, 122, 134–142. [Google Scholar] [CrossRef] [PubMed]
- Stavrinos, D.; Heaton, K.; Welburn, S.C.; McManus, B.; Griffin, R.; Fine, P.R. Commercial Truck Driver Health and Safety: Exploring Distracted Driving Performance and Self-Reported Driving Skill. Workplace Health Saf. 2016, 64, 369–376. [Google Scholar] [CrossRef] [PubMed]
- Brodeur, M.; Ruer, P.; Léger, P.-M.; Sénécal, S. Smartwatches are more distracting than mobile phones while driving: Results from an experimental study. Accid. Anal. Prev. 2021, 149, 105846. [Google Scholar] [CrossRef] [PubMed]
- Young, K.L.; Stephens, A.N.; Stephan, K.L.; Stuart, G.W. In the eye of the beholder: A simulator study of the impact of Google Glass on driving performance. Accid. Anal. Prev. 2016, 86, 68–75. [Google Scholar] [CrossRef] [PubMed]
- Dumitru, A.I.; Girbacia, T.; Boboc, R.G.; Postelnicu, C.-C.; Mogan, G.-L. Effects of smartphone based advanced driver assistance system on distracted driving behavior: A simulator study. Comput. Hum. Behav. 2018, 83, 1–7. [Google Scholar] [CrossRef]
- Sekadakis, M.; Katrakazas, C.; Orfanou, F.; Pavlou, D.; Oikonomou, M.; Yannis, G. Impact of texting and web surfing on driving behavior and safety in rural roads. Int. J. Transp. Sci. Technol. 2022; in press. [Google Scholar] [CrossRef]
- McNabb, J.; Gray, R. Staying connected on the road: A comparison of different types of smart phone use in a driving simulator. PLoS ONE 2016, 11, e0148555. [Google Scholar] [CrossRef]
- Catalina Ortega, C.A.; Mariscal, M.A.; Boulagouas, W.; Herrera, S.; Espinosa, J.M.; García-Herrero, S. Effects of mobile phone use on driving performance: An experimental study of workload and traffic violations. Int. J. Environ. Res. Public Health 2021, 18, 7101. [Google Scholar] [CrossRef]
- Starkey, N.J.; Charlton, S.G.; Malhotra, N.; Lehtonen, E. Drivers’ response to speed warnings provided by a smart phone app. Transp. Res. Part C Emerg. Technol. 2020, 110, 209–221. [Google Scholar] [CrossRef]
- Leung, S.; Croft, R.J.; Jackson, M.L.; Howard, M.E.; McKenzie, R.J. A Comparison of the Effect of Mobile Phone Use and Alcohol Consumption on Driving Simulation Performance. Traffic Inj. Prev. 2012, 13, 566–574. [Google Scholar] [CrossRef] [PubMed]
- Cristea, M.; Delhomme, P. Factors influencing drivers’ reading and comprehension of on-board traffic messages. Eur. Rev. Appl. Psychol. 2015, 65, 211–219. [Google Scholar] [CrossRef]
- Sanjani, F.M.; Bahram, A.; Bahmani, M.; Arvin, M.; Van Der Kamp, J. The effects of texting, sitting surface stability, and balance training on simulated driving performance and perceived workload in Young and Older Drivers. Mot. Control 2021, 25, 1–18. [Google Scholar] [CrossRef]
- Li, X.; Oviedo-Trespalacios, O.; Rakotonirainy, A. Drivers’ gap acceptance behaviours at intersections: A driving simulator study to understand the impact of mobile phone visual-manual interactions. Accid. Anal. Prev. 2020, 138, 105486. [Google Scholar] [CrossRef] [PubMed]
- Onate-Vega, D.; Oviedo-Trespalacios, O.; King, M.J. How drivers adapt their behaviour to changes in task complexity: The role of secondary task demands and road environment factors. Transp. Res. Part F Traffic Psychol. Behav. 2020, 71, 145–156. [Google Scholar] [CrossRef]
- Hosking, S.G.; Young, K.L.; Regan, M.A. The Effects of Text Messaging on Young Drivers. Hum. Factors 2009, 51, 582–592. [Google Scholar] [CrossRef] [PubMed]
- Yannis, G.; Laiou, A.; Papantoniou, P.; Christoforou, C. Impact of texting on young drivers’ behavior and safety on urban and rural roads through a simulation experiment. J. Saf. Res. 2014, 49, 25.e21–25.e31. [Google Scholar] [CrossRef]
- Yannis, G.; Laiou, A.; Papantoniou, P.; Gkartzonikas, C. Simulation of texting impact on young drivers’ behavior and safety on motorways. Transp. Res. Part F Traffic Psychol. Behav. 2016, 41, 10–18. [Google Scholar] [CrossRef]
- Brookhuis, K.A.; Dicke, M. The effects of travel information presentation through nomadic systems on driver behaviour. Eur. Transp. Res. Rev. 2009, 1, 67–74. [Google Scholar] [CrossRef]
- Stavrinos, D.; Jones, J.L.; Garner, A.A.; Griffin, R.; Franklin, C.A.; Ball, D.; Welburn, S.C.; Ball, K.K.; Sisiopiku, V.P.; Fine, P.R. Impact of distracted driving on safety and traffic flow. Accid. Anal. Prev. 2013, 61, 63–70. [Google Scholar] [CrossRef]
- Walker, H.E.K.; Eng, R.A.; Trick, L.M. Dual-task decrements in driving performance: The impact of task type, working memory, and the frequency of task performance. Transp. Res. Part F Traffic Psychol. Behav. 2021, 79, 185–204. [Google Scholar] [CrossRef]
- Li, X.; Yan, X.; Wu, J.; Radwan, E.; Zhang, Y. A rear-end collision risk assessment model based on drivers’ collision avoidance process under influences of cell phone use and gender—A driving simulator based study. Accid. Anal. Prev. 2016, 97, 1–18. [Google Scholar] [CrossRef] [PubMed]
- Saifuzzaman, M.; Haque, M.M.; Zheng, Z.; Washington, S. Impact of mobile phone use on car-following behaviour of young drivers. Accid. Anal. Prev. 2015, 82, 10–19. [Google Scholar] [CrossRef] [PubMed]
- Vollrath, M.; Clifford, C.; Huemer, A.K. Even experienced phone users drive worse while texting—A driving simulator study. Transp. Res. Part F Traffic Psychol. Behav. 2021, 78, 218–225. [Google Scholar] [CrossRef]
- Jenness, J.W.; Lattanzio, R.J.; O’Toole, M.; Taylor, N.; Pax, C. Effects of Manual versus Voice-Activated Dialing during Simulated Driving. Percept. Mot. Ski. 2002, 94, 363–379. [Google Scholar] [CrossRef] [PubMed]
- Vlakveld, W.; Doumen, M.; van der Kint, S. Driving and gaze behavior while texting when the smartphone is placed in a mount: A simulator study. Transp. Res. Part F Traffic Psychol. Behav. 2021, 76, 26–37. [Google Scholar] [CrossRef]
- Louveton, N.; McCall, R.; Koenig, V.; Avanesov, T.; Engel, T. Driving while using a smartphone-based mobility application: Evaluating the impact of three multi-choice user interfaces on visual-manual distraction. Appl. Ergon. 2016, 54, 196–204. [Google Scholar] [CrossRef]
- Chen, J.; Wang, X.; Cheng, Z.; Gao, Y.; Tremont, P.J. Evaluation of the optimal quantity of in-vehicle information icons using a fuzzy synthetic evaluation model in a driving simulator. Accid. Anal. Prev. 2022, 176, 106813. [Google Scholar] [CrossRef]
- Beede, K.E.; Kass, S.J. Engrossed in conversation: The impact of cell phones on simulated driving performance. Accid. Anal. Prev. 2006, 38, 415–421. [Google Scholar] [CrossRef]
- Kass, S.J.; Beede, K.E.; Vodanovich, S.J. Self-report measures of distractibility as correlates of simulated driving performance. Accid. Anal. Prev. 2010, 42, 874–880. [Google Scholar] [CrossRef]
- Payre, W.; Diels, C. I want to brake free: The effect of connected vehicle features on driver behaviour, usability and acceptance. Appl. Ergon. 2020, 82, 102932. [Google Scholar] [CrossRef]
- Atchley, P.; Chan, M. Potential Benefits and Costs of Concurrent Task Engagement to Maintain Vigilance: A Driving Simulator Investigation. Hum. Factors 2010, 53, 3–12. [Google Scholar] [CrossRef]
- Garrison, T.M.; Williams, C.C. Impact of Relevance and Distraction on Driving Performance and Visual Attention in a Simulated Driving Environment. Appl. Cogn. Psychol. 2013, 27, 396–405. [Google Scholar] [CrossRef]
- Chen, Y.; Fu, R.; Xu, Q.; Yuan, W. Mobile phone use in a car-following situation: Impact on time headway and effectiveness of driver’s rear-end risk compensation behavior via a driving simulator study. Int. J. Environ. Res. Public Health 2020, 17, 1328. [Google Scholar] [CrossRef] [PubMed]
- Fu, R.; Chen, Y.; Xu, Q.; Guo, Y.; Yuan, W. A comparative study of accident risk related to speech-based and handheld texting during a sudden braking event in urban road environments. Int. J. Environ. Res. Public Health 2020, 17, 5675. [Google Scholar] [CrossRef]
- Xu, J.; Lin, Y. Impact of Distracted Drivers on Individual and Group Behavior of Following Vehicles: A Networked Multi-Driver Simulator Study. Transp. Res. Rec. 2018, 2672, 45–54. [Google Scholar] [CrossRef]
- NHTSA. Distracted Driving. Available online: https://www.nhtsa.gov/risky-driving/distracted-driving#34621 (accessed on 1 December 2022).
- Oviedo-Trespalacios, O.; Haque, M.M.; King, M.; Demmel, S. Driving behaviour while self-regulating mobile phone interactions: A human-machine system approach. Accid. Anal. Prev. 2018, 118, 253–262. [Google Scholar] [CrossRef] [PubMed]
- Van Dam, J.; Kass, S.J.; VanWormer, L. The effects of passive mobile phone interaction on situation awareness and driving performance. J. Transp. Saf. Secur. 2020, 12, 1007–1024. [Google Scholar] [CrossRef]
- Oviedo-Trespalacios, O.; King, M.; Haque, M.; Washington, S. Risk factors of mobile phone use while driving in Queensland: Prevalence, attitudes, crash risk perception, and task-management strategies. PLoS ONE 2017, 12, e0183361. [Google Scholar] [CrossRef]
- Alosco, M.L.; Spitznagel, M.B.; Fischer, K.H.; Miller, L.A.; Pillai, V.; Hughes, J.; Gunstad, J. Both Texting and Eating Are Associated With Impaired Simulated Driving Performance. Traffic Inj. Prev. 2012, 13, 468–475. [Google Scholar] [CrossRef]
- He, J.; McCarley, J.S.; Kramer, A.F. Lane keeping under cognitive load: Performance changes and mechanisms. Hum. Factors 2014, 56, 414–426. [Google Scholar] [CrossRef] [PubMed]
- Papadimitriou, E.; Argyropoulou, A.; Tselentis, D.I.; Yannis, G. Analysis of driver behaviour through smartphone data: The case of mobile phone use while driving. Saf. Sci. 2019, 119, 91–97. [Google Scholar] [CrossRef]
- van Nes, N.; Bärgman, J.; Christoph, M.; van Schagen, I. The potential of naturalistic driving for in-depth understanding of driver behavior: UDRIVE results and beyond. Saf. Sci. 2019, 119, 11–20. [Google Scholar] [CrossRef]
- Lyon, C.; Brown, S.; Vanlaar, W.; Robertson, R. Prevalence and trends of distracted driving in Canada. J. Saf. Res. 2021, 76, 118–126. [Google Scholar] [CrossRef] [PubMed]
- Petzoldt, T. Drivers’ behavioural (non)adaptation after a texting-related crash. Saf. Sci. 2020, 127, 104715. [Google Scholar] [CrossRef]
- Suffoletto, B.; Pacella-LaBarbara, M.L.; Huber, J.; Delgado, M.K.; McDonald, C. Effectiveness of a Text Message Intervention to Reduce Texting While Driving Among Targeted Young Adults: A Randomized Controlled Trial. J. Adolesc. Health 2022, 71, 423–431. [Google Scholar] [CrossRef]
- Fleming, J.M.; Allison, C.K.; Yan, X.; Lot, R.; Stanton, N.A. Adaptive driver modelling in ADAS to improve user acceptance: A study using naturalistic data. Saf. Sci. 2019, 119, 76–83. [Google Scholar] [CrossRef]
- Viktorová, L.; Sucha, M. Drivers’ Acceptance of Advanced Driver Assistance Systems—What to Consider? Int. J. Traffic Transp. Eng. (IJTTE) 2018, 8, 6. [Google Scholar] [CrossRef]
- Caffò, A.O.; Tinella, L.; Lopez, A.; Spano, G.; Massaro, Y.; Lisi, A.; Stasolla, F.; Catanesi, R.; Nardulli, F.; Grattagliano, I.; et al. The Drives for Driving Simulation: A Scientometric Analysis and a Selective Review of Reviews on Simulated Driving Research. Front. Psychol. 2020, 11, 917. [Google Scholar] [CrossRef]
- Wynne, R.A.; Beanland, V.; Salmon, P.M. Systematic review of driving simulator validation studies. Saf. Sci. 2019, 117, 138–151. [Google Scholar] [CrossRef]
- Lobjois, R.; Faure, V.; Désiré, L.; Benguigui, N. Behavioral and workload measures in real and simulated driving: Do they tell us the same thing about the validity of driving simulation? Saf. Sci. 2021, 134, 105046. [Google Scholar] [CrossRef]
- BMW_Group. BMW Group Sets New Standards for Driving Simulation. Available online: https://www.press.bmwgroup.com/canada/article/detail/T0320579EN/bmw-group-sets-new-standards-for-driving-simulation-nextgen-2020-offers-exclusive-insights-before-the-new-driving-simulation-centre-starts-work?language=en (accessed on 17 April 2022).
- Hussain, Q.; Almallah, M.; Alhajyaseen, W.K.M.; Dias, C. Impact of the geometric field of view on drivers’ speed perception and lateral position in driving simulators. Procedia Comput. Sci. 2020, 170, 18–25. [Google Scholar] [CrossRef]
- Kashevnik, A.; Shchedrin, R.; Kaiser, C.; Stocker, A. Driver Distraction Detection Methods: A Literature Review and Framework. IEEE Access 2021, 9, 60063–60076. [Google Scholar] [CrossRef]
- Dols, J.F.; Molina, J.; Camacho, F.J.; Marín-Morales, J.; Pérez-Zuriaga, A.M.; Garcia, A. Design and Development of Driving Simulator Scenarios for Road Validation Studies. Transp. Res. Procedia 2016, 18, 289–296. [Google Scholar] [CrossRef]
- Maxwell, H.; Weaver, B.; Gagnon, S.; Marshall, S.; Bédard, M. The Validity of Three New Driving Simulator Scenarios: Detecting Differences in Driving Performance by Difficulty and Driver Gender and Age. Hum. Factors 2020, 63, 1449–1464. [Google Scholar] [CrossRef]
- Carsten, O.; Jamson, A. Driving Simulators as Research Tools in Traffic Psychology; Chapter 7; Handbook of Traffic Psychology; Academic Press: Cambridge, MA, USA, 2011; pp. 87–96. [Google Scholar]
- Thapa, R.; Codjoe, J.; Ishak, S.; McCarter, K.S. Post and During Event Effect of Cell Phone Talking and Texting on Driving Performance-A Driving Simulator Study. Traffic Inj. Prev. 2015, 16, 461–467. [Google Scholar] [CrossRef]
- Bakhit, P.R.; Osman, O.A.; Guo, B.; Ishak, S. A distraction index for quantification of driver eye glance behavior: A study using SHRP2 NEST database. Saf. Sci. 2019, 119, 106–111. [Google Scholar] [CrossRef]
- Gauld, C.S.; Lewis, I.; White, K.M. Concealed texting while driving: What are young people’s beliefs about this risky behaviour? Saf. Sci. 2014, 65, 63–69. [Google Scholar] [CrossRef]
- Zahabi, M.; Pankok, C.; Park, J. Human factors in police mobile computer terminals: A systematic review and survey of recent literature, guideline formulation, and future research directions. Appl. Ergon. 2020, 84, 103041. [Google Scholar] [CrossRef]
- Ebadi, Y.; Fisher, D.L.; Roberts, S.C. Impact of Cognitive Distractions on Drivers’ Hazard Anticipation Behavior in Complex Scenarios. Transp. Res. Rec. 2019, 2673, 440–451. [Google Scholar] [CrossRef]


| Immersion: | |||
|---|---|---|---|
| Motion Platform | Display | Other Features | |
| Hardware features | 3 DOFs | At least 135° horizontal FOV and 40° vertical FOV |
|
| Driver tracking: | |||
| Movement | Distraction detection | Physiological metrics | |
| Head tracking | Eye and/or hand tracking | Electrocardiogram (ECG) 103 A/m | |
| Number | Type (difficulty) | Driving conditions | |
| Scenarios | Minimum 2 scenarios, including a baseline |
|
|
Disclaimer/Publisher’s Note: The statements, opinions and data contained in all publications are solely those of the individual author(s) and contributor(s) and not of MDPI and/or the editor(s). MDPI and/or the editor(s) disclaim responsibility for any injury to people or property resulting from any ideas, methods, instructions or products referred to in the content. |
© 2023 by the authors. Licensee MDPI, Basel, Switzerland. This article is an open access article distributed under the terms and conditions of the Creative Commons Attribution (CC BY) license (https://creativecommons.org/licenses/by/4.0/).
Share and Cite
Voinea, G.-D.; Boboc, R.G.; Buzdugan, I.-D.; Antonya, C.; Yannis, G. Texting While Driving: A Literature Review on Driving Simulator Studies. Int. J. Environ. Res. Public Health 2023, 20, 4354. https://doi.org/10.3390/ijerph20054354
Voinea G-D, Boboc RG, Buzdugan I-D, Antonya C, Yannis G. Texting While Driving: A Literature Review on Driving Simulator Studies. International Journal of Environmental Research and Public Health. 2023; 20(5):4354. https://doi.org/10.3390/ijerph20054354
Chicago/Turabian StyleVoinea, Gheorghe-Daniel, Răzvan Gabriel Boboc, Ioana-Diana Buzdugan, Csaba Antonya, and George Yannis. 2023. "Texting While Driving: A Literature Review on Driving Simulator Studies" International Journal of Environmental Research and Public Health 20, no. 5: 4354. https://doi.org/10.3390/ijerph20054354
APA StyleVoinea, G.-D., Boboc, R. G., Buzdugan, I.-D., Antonya, C., & Yannis, G. (2023). Texting While Driving: A Literature Review on Driving Simulator Studies. International Journal of Environmental Research and Public Health, 20(5), 4354. https://doi.org/10.3390/ijerph20054354