Exploring Spatial Correlations of Tourism Ecological Security in China: A Perspective from Social Network Analysis
Abstract
1. Introduction
2. Methodology and Data Source
2.1. Methodology
2.1.1. Entropy Weight TOPSIS Method
2.1.2. DPSIR Model
2.1.3. Modified Gravity Model
2.1.4. Social Network Analysis (SNA)
2.1.5. Quadratic Assignment Procedure (QAP)
2.2. Data Sources
3. Results
3.1. Structural Characteristics of the Spatial Network
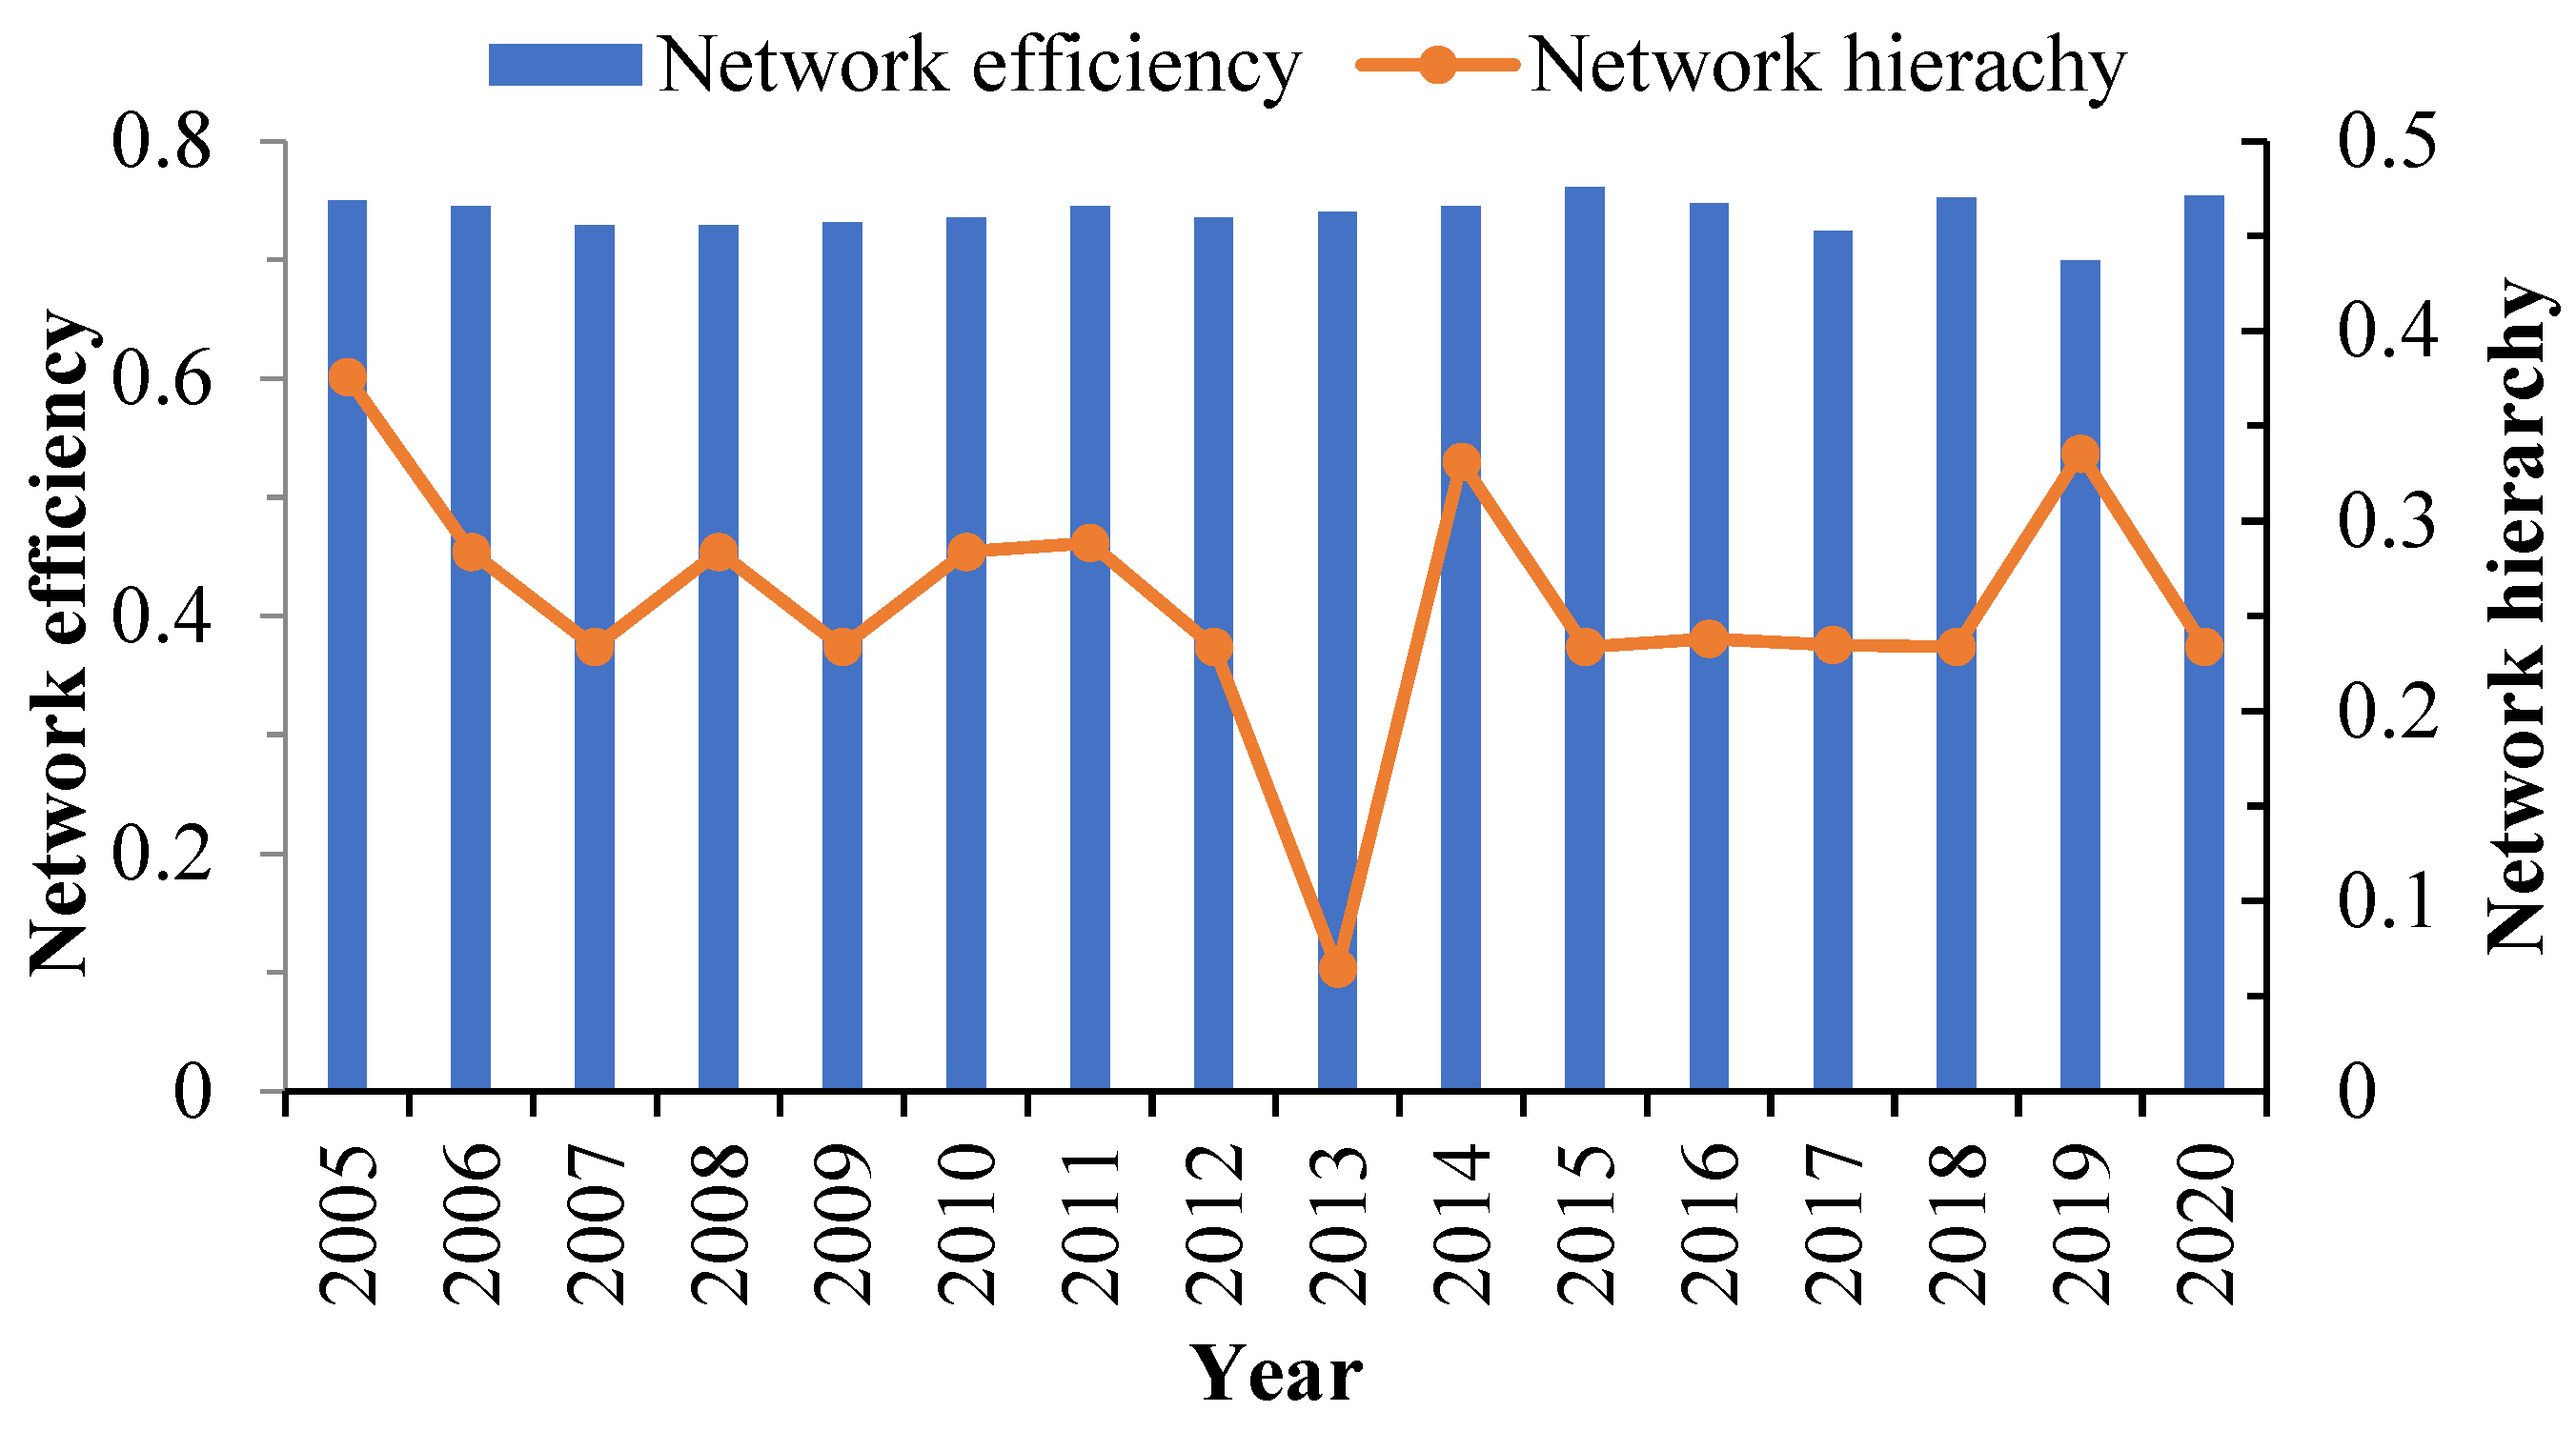
3.1.1. Overall Network Characteristics
3.1.2. Individual Network Characteristics
3.2. Cohesive Group of the Spatial Network Structure
3.3. Analysis of Influencing Factors
4. Discussion
5. Conclusions
Author Contributions
Funding
Institutional Review Board Statement
Informed Consent Statement
Data Availability Statement
Conflicts of Interest
References
- Ruan, W.; Li, Y.; Zhang, S.; Liu, C.-H. Evaluation and drive mechanism of tourism ecological security based on the DPSIR-DEA model. Tour. Manag. 2019, 75, 609–625. [Google Scholar] [CrossRef]
- Liu, D.; Yin, Z. Spatial-temporal pattern evolution and mechanism model of tourism ecological security in China. Ecol. Indic. 2022, 139, 108933. [Google Scholar] [CrossRef]
- Ma, X.; Sun, B.; Hou, G.; Xing, Z.; Li, L. Evaluation and spatial effects of tourism ecological security in the Yangtze River Delta. Ecol. Indic. 2021, 131, 108190. [Google Scholar]
- Li, X.; Wu, Q.; Zhou, Y. Spatio-Temporal pattern and spatial effect of Chinese provincial tourism eco-security. Econ. Geogr. 2017, 37, 210–217. [Google Scholar]
- Pan, N.; Du, Q.; Guan, Q.; Tan, Z.; Sun, Y.; Wang, Q. Ecological security assessment and pattern construction in arid and semi-arid areas: A case study of the Hexi Region, NW China. Ecol. Indic. 2022, 138, 108797. [Google Scholar] [CrossRef]
- Wang, Y.; Wu, C.; Wang, F.; Sun, Q.; Wang, X.; Guo, S. Comprehensive evaluation and prediction of tourism ecological security in droughty area national parks—A case study of Qilian Mountain of Zhangye section, China. Environ. Sci. Pollut. Res. 2021, 28, 16816–16829. [Google Scholar] [CrossRef]
- Liu, D.; Chang, Q. Ecological security research progress in China. Acta Ecol. Sin. 2015, 35, 11. [Google Scholar] [CrossRef]
- Malekmohammadi, B.; Jahanishakib, F. Vulnerability assessment of wetland landscape ecosystem services using driver-pressure-state-impact-response (DPSIR) model. Ecol. Indic. 2017, 82, 293–303. [Google Scholar] [CrossRef]
- Mustika, P.L.K.; Welters, R.; Ryan, G.E.; D’Lima, C. A rapid assessment of wildlife tourism risk posed to cetaceans in Asia. J. Sustain. Tour. 2017, 25, 1138–1158. [Google Scholar] [CrossRef]
- Corbau, C.; Benedetto, G.; Congiatu, P.P.; Simeoni, U.; Carboni, D. Tourism analysis at Asinara Island (Italy): Carrying capacity and web evaluations in two pocket beaches. Ocean Coast. Manag. 2018, 169, 27–36. [Google Scholar] [CrossRef]
- Li, J.-X.; Chen, Y.-N.; Xu, C.-C.; Li, Z. Evaluation and analysis of ecological security in arid areas of Central Asia based on the emergy ecological footprint (EEF) model. J. Clean. Prod. 2019, 235, 664–677. [Google Scholar] [CrossRef]
- He, G.; Yu, B.; Li, S.; Zhu, Y. Comprehensive evaluation of ecological security in mining area based on PSR–ANP–GRAY. Environ. Technol. 2017, 39, 3013–3019. [Google Scholar] [CrossRef]
- Yang, T.; Zhang, Q.; Wan, X.; Li, X.; Wang, Y.; Wang, W. Comprehensive ecological risk assessment for semi-arid basin based on conceptual model of risk response and improved TOPSIS model-a case study of Wei River Basin, China. Sci. Total Environ. 2020, 719, 137502. [Google Scholar] [CrossRef] [PubMed]
- Goessling, S.; Peeters, P.; Ceron, J.P.; Dubois, G.; Patterson, T.; Richardson, R.B. The eco-efficiency of tourism. Ecol. Econ. 2005, 54, 417–434. [Google Scholar] [CrossRef]
- Aryal, S.; Cockfield, G.; Maraseni, T.N. Globalisation and traditional social-ecological systems: Understanding impacts of tourism and labour migration to the transhumance systems in the Himalayas. Environ. Dev. 2018, 25, 73–84. [Google Scholar] [CrossRef]
- Navarro Jurado, E.; Tejada Tejada, M.; Almeida García, F.; Cabello González, J.; Cortés Macías, R.; Delgado Peña, J.; Fernández Gutiérrez, F.; Gutiérrez Fernández, G.; Luque Gallego, M.; Málvarez García, G.; et al. Carrying capacity assessment for tourist destinations. Methodology for the creation of synthetic indicators applied in a coastal area. Tour. Manag. 2012, 33, 1337–1346. [Google Scholar] [CrossRef]
- Tokarchuk, O.; Gabriele, R.; Maurer, O. Estimating tourism social carrying capacity. Ann. Tour. Res. 2020, 86, 102971. [Google Scholar] [CrossRef]
- Liu, X.; Yang, Z.; Di, F.; Chen, X. Evaluation on tourism ecological security in nature heritage sites —Case of Kanas nature reserve of Xinjiang, China. Chin. Geogr. Sci. 2009, 19, 265–273. [Google Scholar] [CrossRef]
- Chen, H.-S. Evaluation and Analysis of Eco-Security in Environmentally Sensitive Areas Using an Emergy Ecological Footprint. Int. J. Environ. Res. Public Health 2017, 14, 136. [Google Scholar] [CrossRef]
- Chen, M.; Zheng, L.; Zhang, D.; Li, J. Spatio-Temporal Evolution and Obstacle Factors Analysis of Tourism Ecological Security in Huanggang Dabieshan UNESCO Global Geopark. Int. J. Environ. Res. Public Health 2022, 19, 8670. [Google Scholar] [CrossRef]
- Mu, X.; Guo, X.; Ming, Q.; Hu, C. Dynamic evolution characteristics and driving factors of tourism ecological security in the Yellow River Basin. Acta Geogr. Sin. 2022, 77, 714–735. [Google Scholar]
- Wasserman, S.; Faust, K. Social Network Analysis: Methods and Applications; Cambridge University Press: Cambridge, UK, 1994. [Google Scholar]
- Wu, X.; Liu, S.L.; Sun, Y.X.; An, Y.; Dong, S.K.; Liu, G.H. Ecological security evaluation based on entropy matter-element model: A case study of Kunming city, southwest China. Ecol. Indic. 2019, 102, 469–478. [Google Scholar] [CrossRef]
- Yang, L.; Cao, K. Tourism Ecological Security Early Warning of Ili River Valley Based on DPSIR Model. Ecol. Econ. 2020, 36, 111–117. [Google Scholar]
- Han, B.; Liu, H.; Wang, R. Urban ecological security assessment for cities in the Beijing–Tianjin–Hebei metropolitan region based on fuzzy and entropy methods. Ecol. Model. 2015, 318, 217–225. [Google Scholar] [CrossRef]
- Tang, C.; Wu, X.; Zheng, Q.; Lyu, N. Ecological security evaluations of the tourism industry in Ecological Conservation Development Areas: A case study of Beijing’s ECDA. J. Clean. Prod. 2018, 197, 999–1010. [Google Scholar] [CrossRef]
- Lu, C.Y.; Wen, F.; Yang, Q.Y. An evaluation of urban land use performance based on the Improved TOPSIS method and diagnosis of its obstacle indicators: A case study of Chongqing. Resour. Sci. 2011, 33, 535–541. [Google Scholar]
- Xu, M.; Zhu, X.; Zhou, J. Analysis of land ecological security pattern of Hunan province based on catastrophe theory. J. Nat. Disasters 2012, 21, 199–207. [Google Scholar]
- Xu, M.; La Liu, C.; Li, D.; Zhong, X.L. Tourism ecological security early warning of Zhangjiajie, China based on the improved TOPSIS method and the grey GM (1,1)model. Ying Yong Sheng Tai Xue Bao J. Appl. Ecol. 2017, 28, 3731–3739. [Google Scholar]
- Wang, Z.; Chen, Q. Spatio-temporal pattern evolution and trend prediction of tourism ecological security in the Yangtze River Economic Belt since 1998. Acta Ecol. Sin. 2021, 41, 320–332. [Google Scholar]
- Zhou, B.; Zhong, L.S.; Chen, T.; Zhang, A.P. Spatio-temporal pattern and obstacle factors of ecological security of tourism destination: A case of Zhejiang province. Sci. Geogr. Sin. 2015, 35, 599–607. [Google Scholar]
- Li, Y.; Gong, G.; Zhang, F.; Gao, L.; Xiao, Y.; Yang, X.; Yu, P. Network Structure Features and Influencing Factors of Tourism Flow in Rural Areas: Evidence from China. Sustainability 2022, 14, 9623. [Google Scholar] [CrossRef]
- Gan, C.; Voda, M.; Wang, K.; Chen, L.; Ye, J. Spatial network structure of the tourism economy in urban agglomeration: A social network analysis. J. Hosp. Tour. Manag. 2021, 47, 124–133. [Google Scholar] [CrossRef]
- Wang, Z.; Liu, Q.; Xu, J.; Fujiki, Y. Evolution characteristics of the spatial network structure of tourism efficiency in China: A province-level analysis. J. Destin. Mark. Manag. 2020, 18, 100509. [Google Scholar] [CrossRef]
- Liu, Q.; Song, J.; Dai, T.; Xu, J.; Li, J.; Wang, E. Spatial Network Structure of China’s Provincial-Scale Tourism Eco-Efficiency: A Social Network Analysis. Energies 2022, 15, 1324. [Google Scholar] [CrossRef]
- Benítez-Andrades, J.A.; García-Rodríguez, I.; Benavides, C.; Alaiz-Moretón, H.; Gayo, J.E.L. An ontology-based multi-domain model in social network analysis: Experimental validation and case study. Inform. Sci. 2020, 540, 390–413. [Google Scholar] [CrossRef]
- Liu, B.; Huang, S.; Fu, H. An application of network analysis on tourist attractions: The case of Xinjiang, China. Tour. Manag. 2017, 58, 132–141. [Google Scholar] [CrossRef]
- Lv, K.; Feng, X.; Kelly, S.; Zhu, L.; Deng, M. A study on embodied carbon transfer at the provincial level of China from a social network perspective. J. Clean. Prod. 2019, 225, 1089–1104. [Google Scholar] [CrossRef]
- Cai, X.-T.; Lyu, J.-H.; Wang, C.-Q. The network characteristics and driving mechanism of the spatial correlation of forest ecological security in China. J. Nat. Resour. 2022, 37, 2137–2152. [Google Scholar] [CrossRef]
- Ahas, R.; Aasa, A.; Mark, Ü.; Pae, T.; Kull, A. Seasonal tourism spaces in Estonia: Case study with mobile positioning data. Tour. Manag. 2006, 28, 898–910. [Google Scholar] [CrossRef]
- Wang, Y.; Xi, M.; Chen, H.; Lu, C. Evolution and Driving Mechanism of Tourism Flow Networks in the Yangtze River Delta Urban Agglomeration Based on Social Network Analysis and Geographic Information System: A Double-Network Perspective. Sustainability 2022, 14, 7656. [Google Scholar] [CrossRef]
- Duan, Y.; Jiang, X. Visualizing the change of embodied CO2 emissions along global production chains. J. Clean. Prod. 2018, 194, 499–514. [Google Scholar] [CrossRef]
- Wang, Z.; Xie, W.; Zhang, C. Towards COP26 targets: Characteristics and influencing factors of spatial correlation network structure on U.S. carbon emission. Resour. Policy 2023, 81, 103285. [Google Scholar] [CrossRef]
- Liu, J.; Song, Q.Y. Space network structure and formation mechanism of green innovation efficiency of tourism industry in China. Chin. J. Popul. Resour. 2018, 28, 127–137. [Google Scholar]
- Cheng, H.; Xu, Q.; Zhao, M. Research on spatial correlation network structure of China’s tourism eco-efficiency and its influencing factors. Ecol. Sci. 2020, 39, 169–178. [Google Scholar]
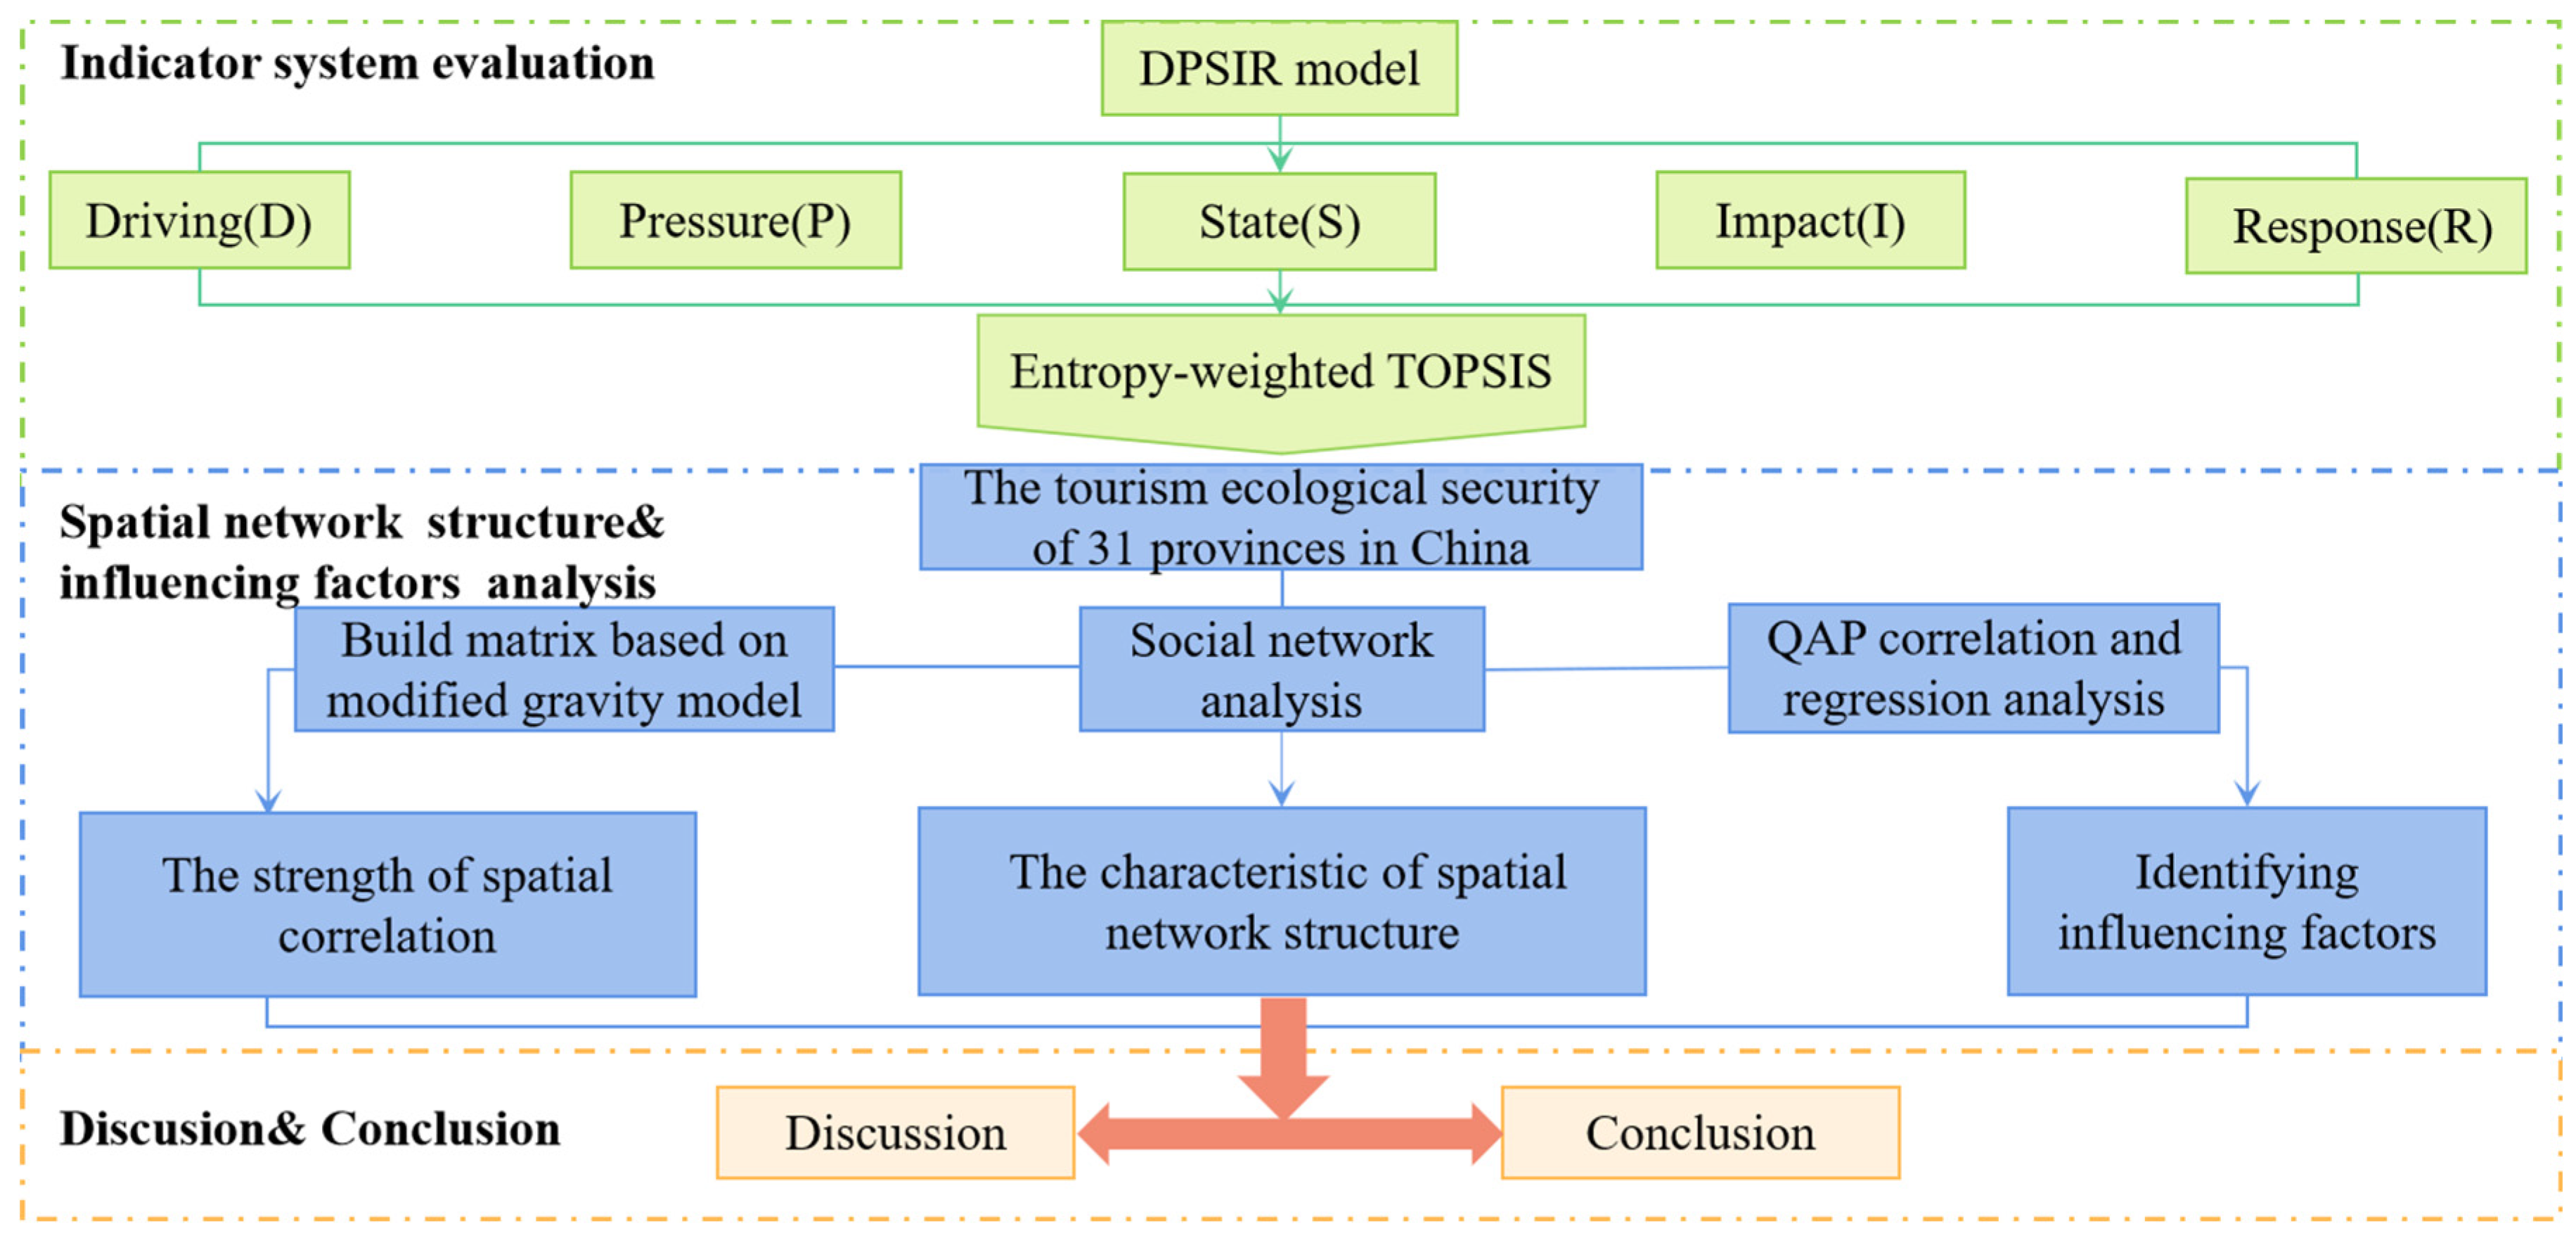
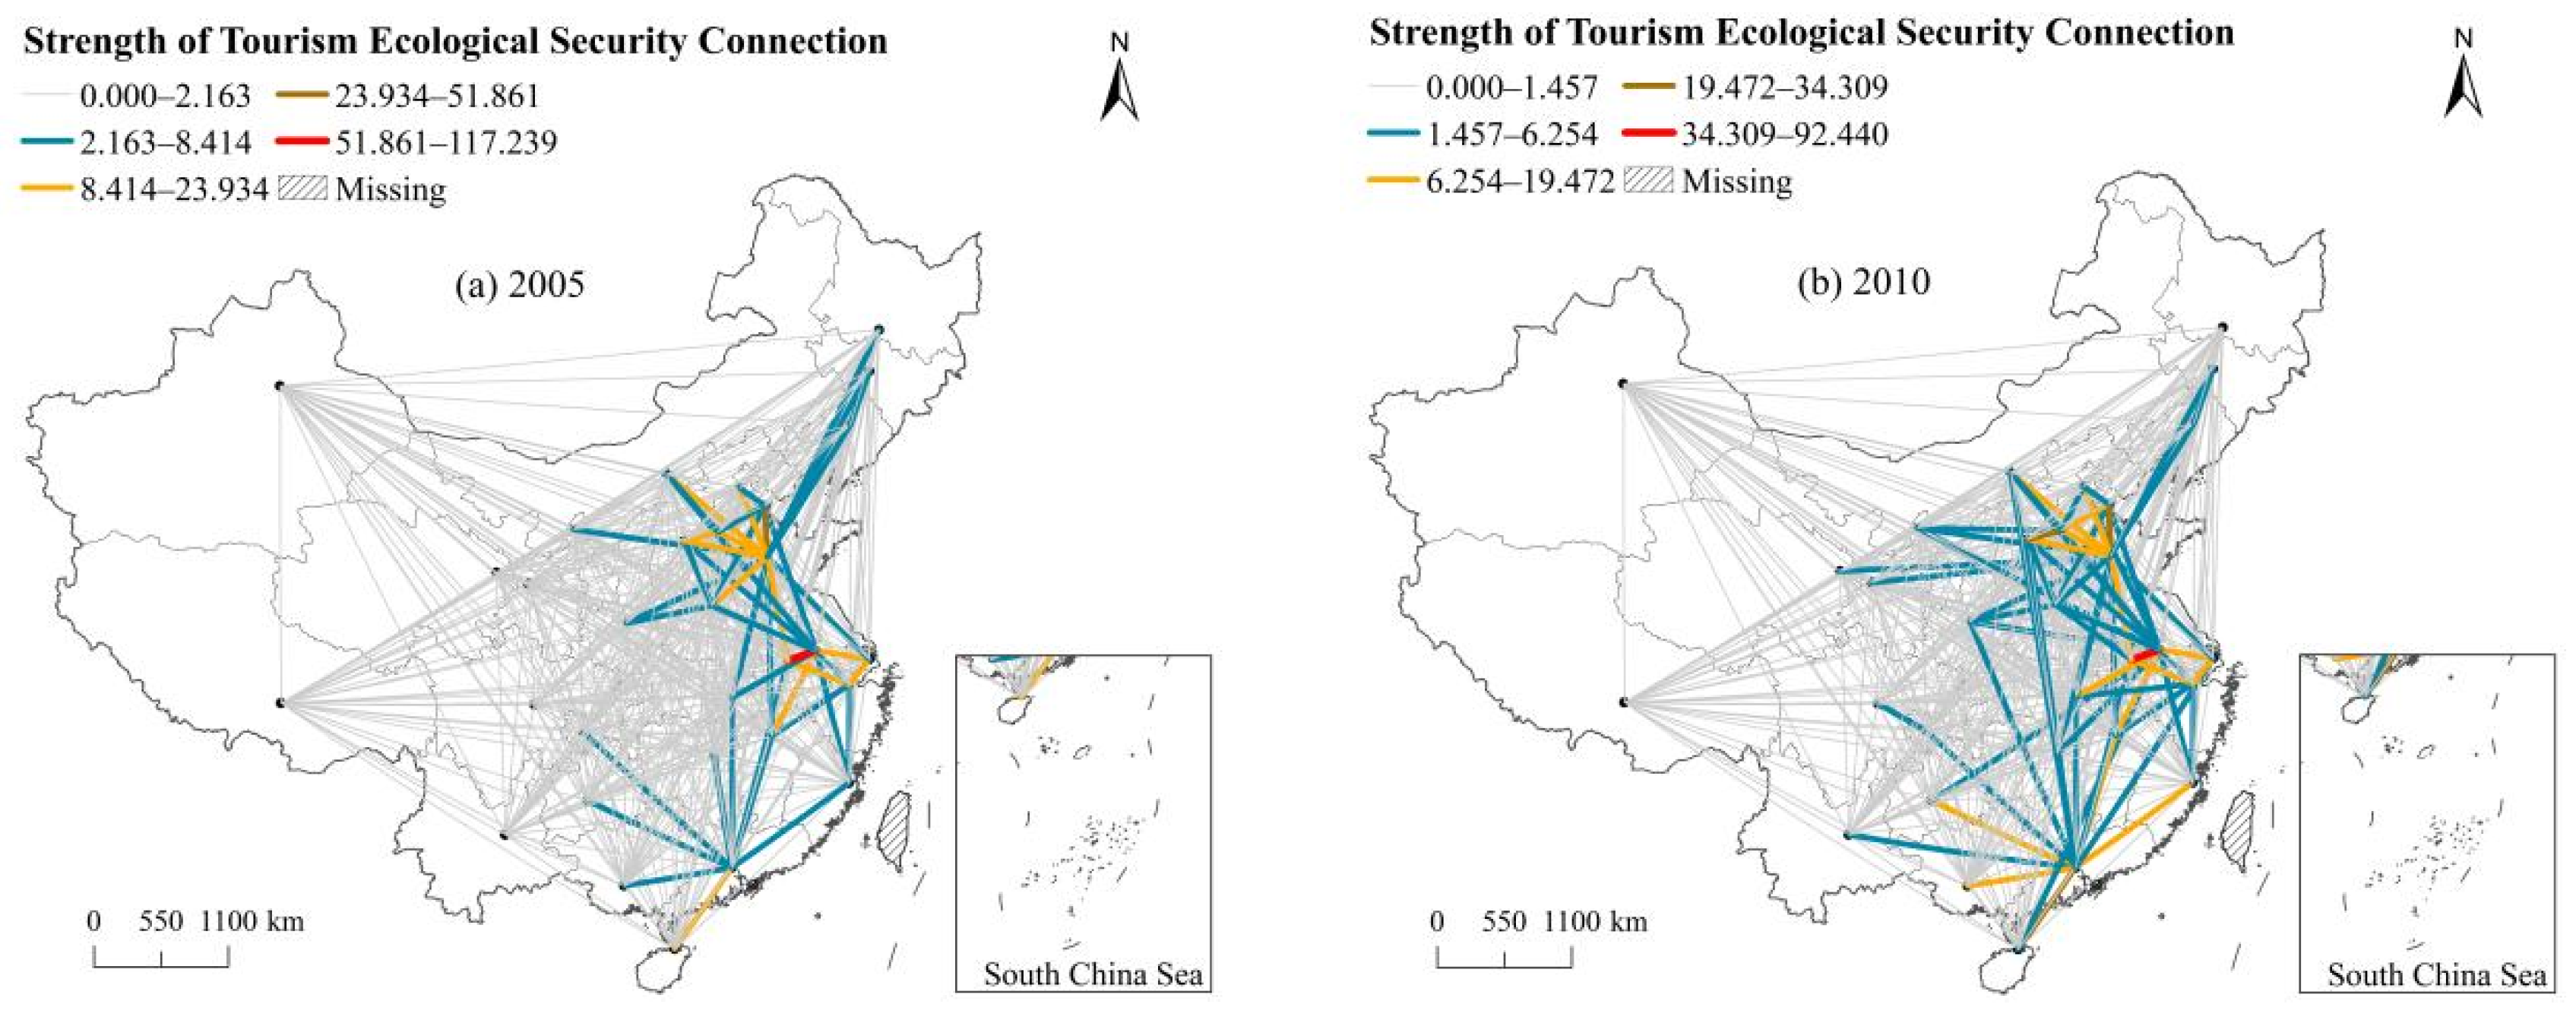
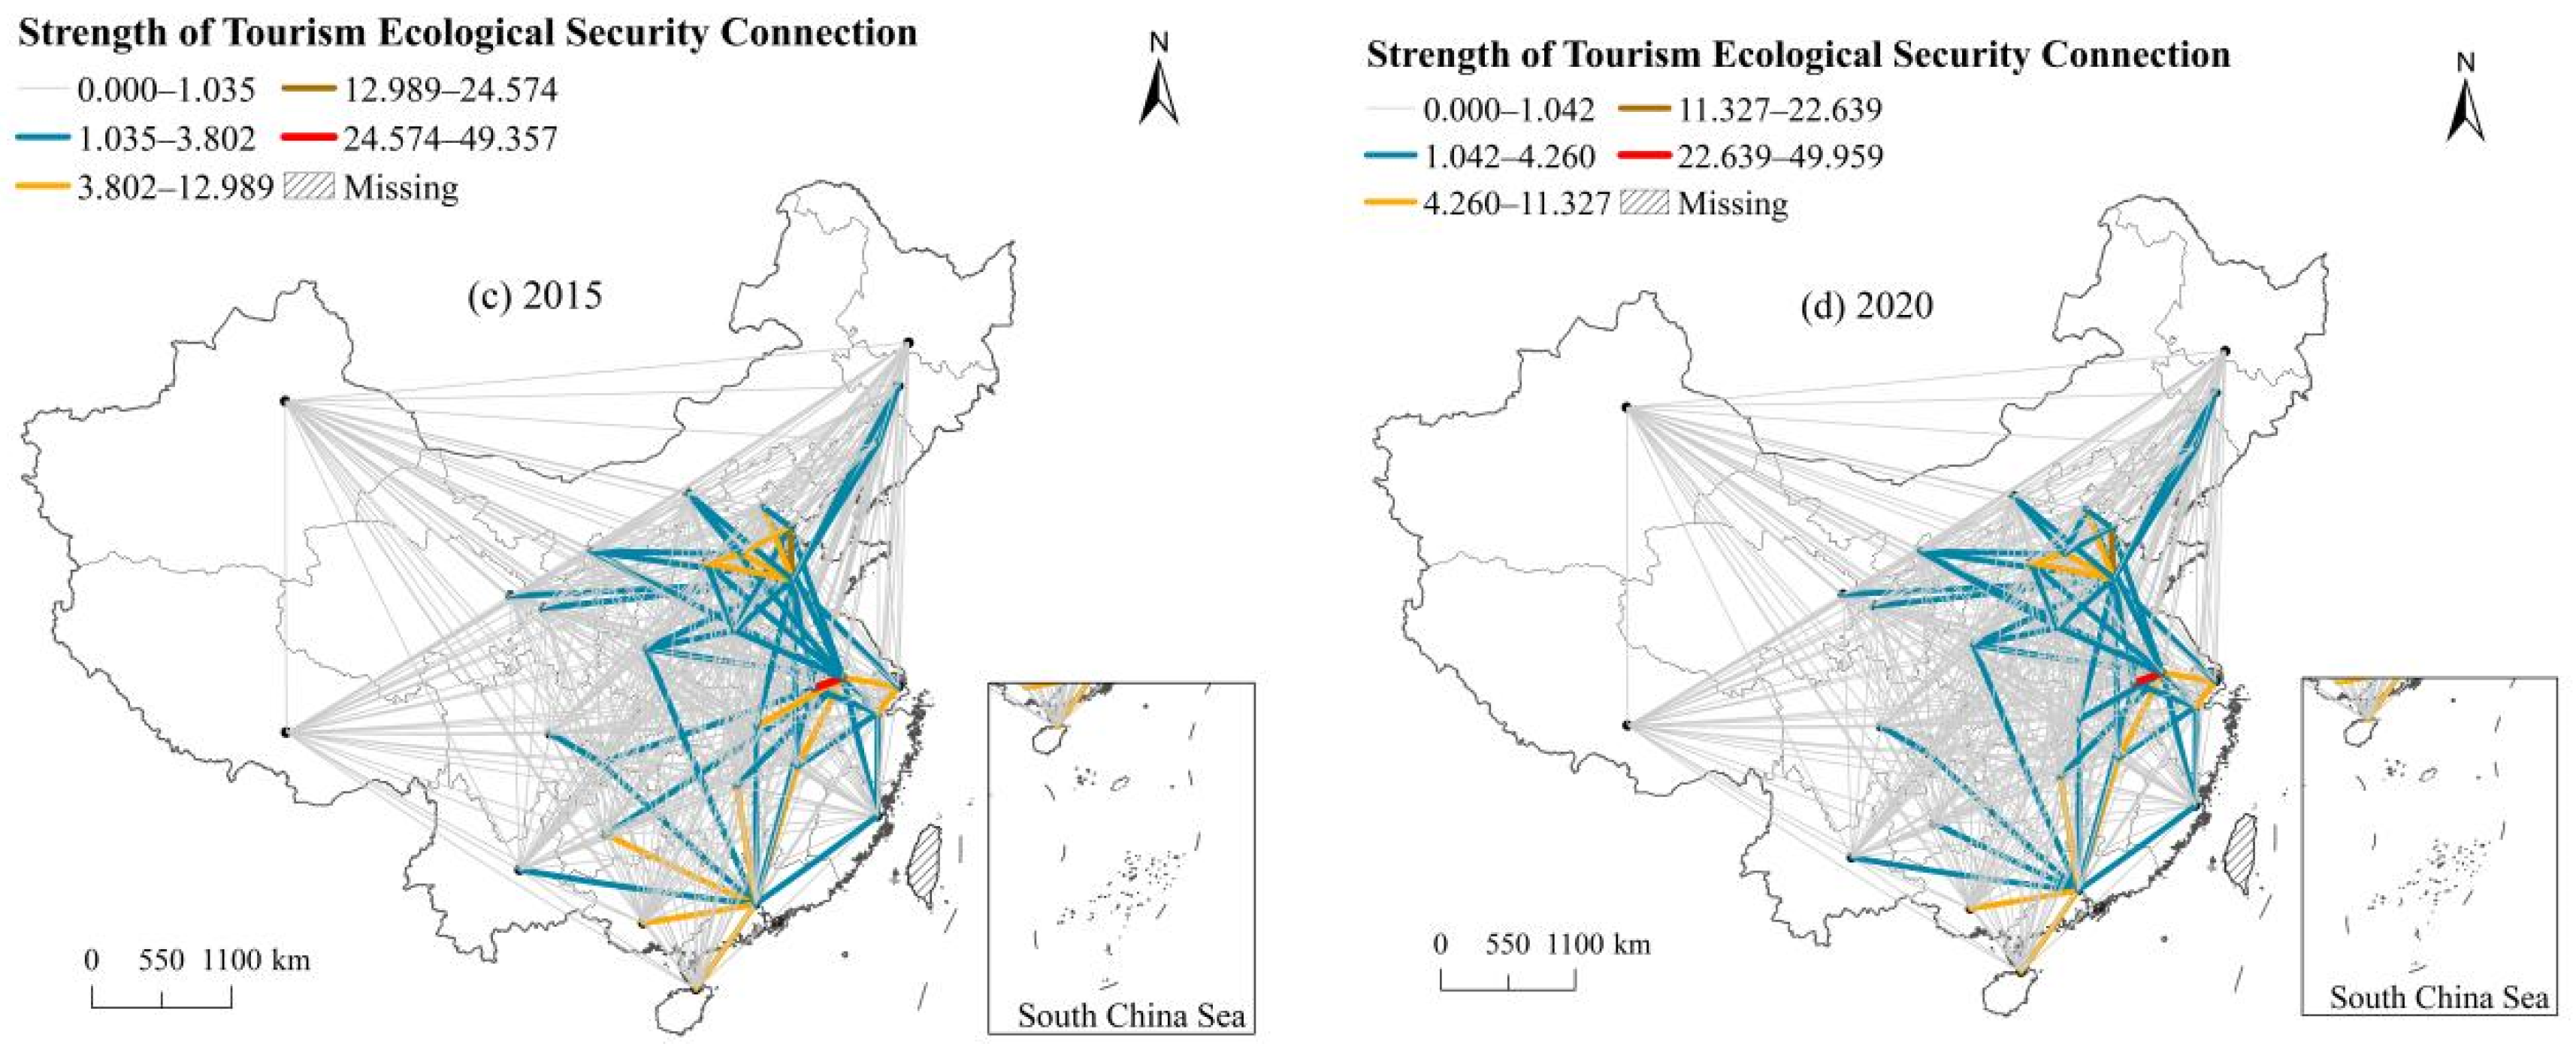
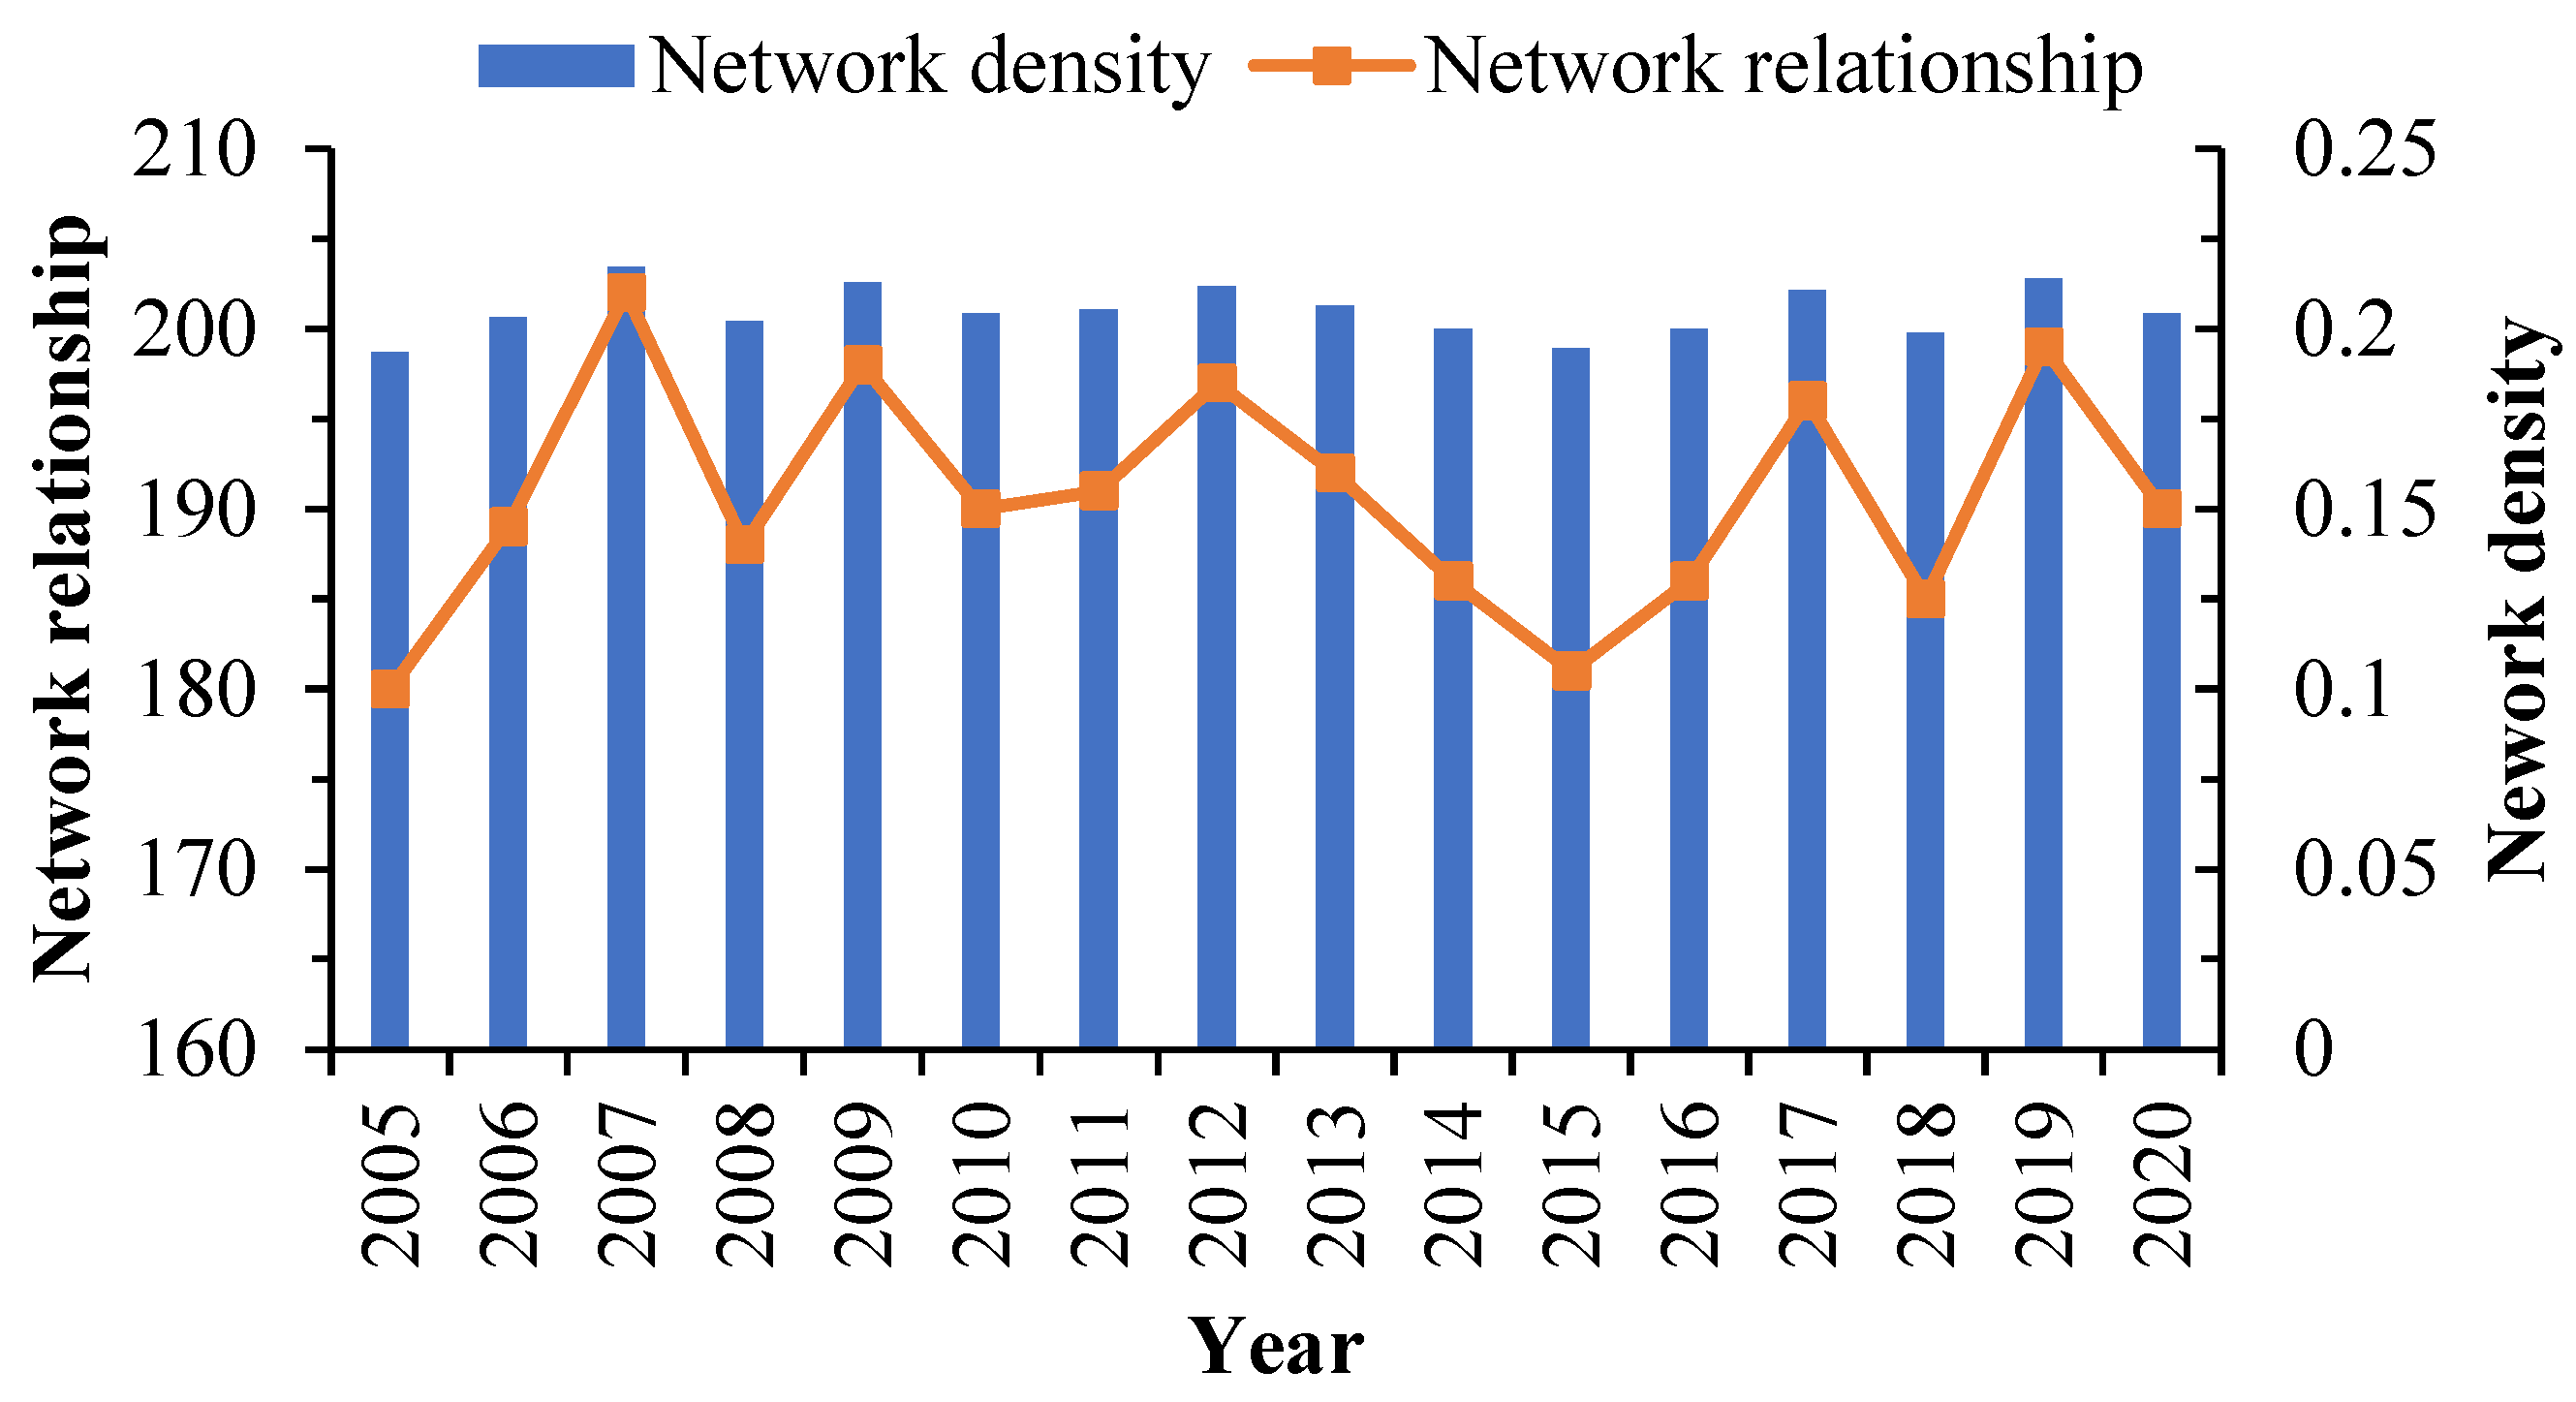

| System Layer | Index Layer | Index Meaning | Unit | Weight | Reference |
|---|---|---|---|---|---|
| Drive (D) | GDP per capita | Socioeconomic development | CNY 10,000 | 0.0086 | [1,20] |
| Tertiary sector growth rate | % | 0.0122 | |||
| Urbanization rate | % | 0.0127 | |||
| Visitor growth rate | % | 0.0227 | |||
| Natural population growth rate | Tourism economy development | % | 0.0115 | ||
| Tourism revenue growth rate | % | 0.0150 | |||
| Pressure (P) | Tourism economic density | Intensity of the combined pressure of tourism on the ecosystem | CNY 100,000,000/100,000 km2 | 0.0042 | [1,21,30] |
| Population density | per/hm2 | 0.0133 | |||
| Visitor density | per/km2 | 0.0042 | |||
| Total industrial wastewater | Negative impact of tourism economic development on ecosystem | 10,000 tons | 0.0080 | ||
| Industrial SO2 emissions | 10,000 tons | 0.0097 | |||
| Industrial solid waste | 10,000 tons | 0.0088 | |||
| Amount of domestic waste removed | 10,000 tons | 0.0054 | |||
| State (S) | Domestic tourism revenue | Profitability of the tourism market | CNY 100,000,000 | 0.0287 | [1,20,21] |
| International tourism revenue | USD 100,000 | 0.0676 | |||
| Ratio of visitor arrivals to the resident population | Provision of services for tourists | / | 0.0089 | ||
| Number of star-rated hotels | Individual | 0.0108 | |||
| Number of travel agencies | Individual | 0.0136 | |||
| Landscaped area | Quality of the living environment in the tourism destination | hm | 0.0406 | ||
| Public green space per capita | m2 | 0.0132 | |||
| Forest coverage rate | % | 0.0246 | |||
| Impact(I) | Share of tertiary sector output | Macro environment of tourism development | % | 0.2053 | [3,4,21] |
| Tourism revenue index | Economic contribution rate of tourism | % | 0.0260 | ||
| Tourism income per capita | CNY | 0.0225 | |||
| Number of employees in the accommodation and catering industry | Reception capacity of the tourism destination | CNY 10,000 | 0.0526 | ||
| Integrated utilization rate of industrial solid waste | Transformation and recycling of solid wastes in tourism destinations | % | 0.0140 | ||
| Response (R) | Fiscal expenditure as a percentage of GDP | Driving force of tourism ecological environment investment | % | 0.0438 | [30,31] |
| Environmental pollution control as a percentage of GDP | % | 0.2622 | |||
| Number of university students per 100,000 people | Tourism long-term development of talent supply | per | 0.0142 | ||
| Domestic sewage treatment rate | Local capacity for pollution control and resource recycling | per | 0.0112 | ||
| Domestic waste harmless disposal rate | % | 0.0038 |
| Rank | Province | Point Centrality | Betweenness Centrality | Closeness Centrality | ||
|---|---|---|---|---|---|---|
| In-Degree | Out-Degree | Point | ||||
| 1 | Jiangsu | 28 | 5 | 93.333 | 28.388 | 93.750 |
| 2 | Guangdong | 23 | 7 | 76.667 | 16.590 | 78.947 |
| 3 | Shandong | 20 | 6 | 66.667 | 8.854 | 68.182 |
| 4 | Zhejiang | 18 | 4 | 63.333 | 9.003 | 73.171 |
| 5 | Henan | 15 | 10 | 56.667 | 4.599 | 69.767 |
| 6 | Sichuan | 9 | 10 | 36.667 | 1.292 | 61.224 |
| 7 | Ningxia | 7 | 9 | 33.333 | 1.117 | 60.000 |
| 8 | Shaanxi | 5 | 9 | 30.000 | 0.300 | 58.824 |
| 9 | Qinghai | 4 | 8 | 26.667 | 0.234 | 57.692 |
| 10 | Gansu | 4 | 8 | 26.667 | 0.234 | 57.692 |
| 11 | Hebei | 6 | 8 | 26.667 | 0.574 | 57.692 |
| 12 | Beijing | 7 | 6 | 26.667 | 0.675 | 57.692 |
| 13 | Guizhou | 3 | 7 | 23.333 | 0.623 | 56.604 |
| 14 | Jiangxi | 6 | 6 | 23.333 | 0.750 | 56.604 |
| 15 | Inner Mongolia | 4 | 7 | 23.333 | 0.395 | 56.604 |
| 16 | Liaoning | 2 | 7 | 23.333 | 0.193 | 56.604 |
| 17 | Jilin | 1 | 7 | 23.333 | 0.338 | 56.604 |
| 18 | Heilongjiang | 1 | 7 | 23.333 | 0.338 | 56.604 |
| 19 | Xinjiang | 0 | 6 | 20.000 | 0.234 | 55.556 |
| 20 | Tibet | 1 | 6 | 20.000 | 0.234 | 55.556 |
| 21 | Chongqing | 2 | 6 | 20.000 | 0.234 | 55.556 |
| 22 | Hubei | 2 | 6 | 20.000 | 0.172 | 55.556 |
| 23 | Shanxi | 4 | 6 | 20.000 | 0.210 | 55.556 |
| 24 | Yunnan | 1 | 5 | 16.667 | 0.174 | 54.545 |
| 25 | Hainan | 4 | 2 | 16.667 | 0.226 | 53.571 |
| 26 | Hunan | 3 | 5 | 16.667 | 0.207 | 54.545 |
| 27 | Fujian | 1 | 5 | 16.667 | 0.213 | 54.545 |
| 28 | Tianjin | 4 | 5 | 16.667 | 0.101 | 54.545 |
| 29 | Guangxi | 1 | 3 | 10.000 | 0.016 | 51.724 |
| 30 | Shanghai | 2 | 3 | 10.000 | 0.035 | 51.724 |
| 31 | Anhui | 2 | 1 | 6.667 | 0.000 | 50.000 |
| Mean | - | 6.129 | 6.129 | 29.462 | 2.469 | 59.266 |
| Plate | Reception | Spillover | Expected Ratio/% | Actual Ratio/% | Role of the Plate | ||
|---|---|---|---|---|---|---|---|
| Internal | External | Internal | External | ||||
| Plate I | 20 | 29 | 20 | 91 | 50 | 18.018 | Net spillover |
| Plate II | 8 | 13 | 8 | 23 | 23.333 | 25.806 | Agent |
| Plate III | 3 | 48 | 3 | 29 | 10 | 9.375 | Bidirectional spillover |
| Plate IV | 2 | 67 | 2 | 14 | 6.667 | 12.500 | Net benefit |
| Plate | Density Matrix | Image Matrix | ||||||
|---|---|---|---|---|---|---|---|---|
| Plate I | Plate II | Plate III | Plate IV | Plate I | Plate II | Plate III | Plate IV | |
| Plate I | 0.083 | 0.008 | 0.719 | 0.917 | 0 | 0 | 1 | 1 |
| Plate II | 0.016 | 0.143 | 0.063 | 0.792 | 0 | 0 | 0 | 1 |
| Plate III | 0.391 | 0 | 0.250 | 0.333 | 1 | 0 | 1 | 1 |
| Plate IV | 0.042 | 0.5 | 0 | 0.333 | 0 | 1 | 0 | 1 |
| Independent Variable | QAP Correlation Analysis | QAP Regression Analysis | ||
|---|---|---|---|---|
| Correlation Coefficient | p Value | Regression Coefficient | p Value | |
| W | 0.291 | 0.000 *** | 0.193 | 0.000 *** |
| E | −0.16 | 0.005 *** | −0.096 | 0.022 ** |
| L | −0.123 | 0.023 ** | −0.057 | 0.046 ** |
| F | −0.085 | 0.095 * | −0.044 | 0.041 ** |
| J | −0.064 | 0.061 * | −0.080 | 0.034 ** |
| H | −0.053 | 0.012 ** | −0.008 | 0.014 ** |
| T | −0.192 | 0.000 *** | −0.161 | 0.000 *** |
| R2 | 0.195 | 0.000 *** | ||
| Adj-R2 | 0.188 | 0.000 *** | ||
Disclaimer/Publisher’s Note: The statements, opinions and data contained in all publications are solely those of the individual author(s) and contributor(s) and not of MDPI and/or the editor(s). MDPI and/or the editor(s) disclaim responsibility for any injury to people or property resulting from any ideas, methods, instructions or products referred to in the content. |
© 2023 by the authors. Licensee MDPI, Basel, Switzerland. This article is an open access article distributed under the terms and conditions of the Creative Commons Attribution (CC BY) license (https://creativecommons.org/licenses/by/4.0/).
Share and Cite
Wang, Z.; Huang, D.; Wang, J. Exploring Spatial Correlations of Tourism Ecological Security in China: A Perspective from Social Network Analysis. Int. J. Environ. Res. Public Health 2023, 20, 3912. https://doi.org/10.3390/ijerph20053912
Wang Z, Huang D, Wang J. Exploring Spatial Correlations of Tourism Ecological Security in China: A Perspective from Social Network Analysis. International Journal of Environmental Research and Public Health. 2023; 20(5):3912. https://doi.org/10.3390/ijerph20053912
Chicago/Turabian StyleWang, Zhaofeng, Dongchun Huang, and Jing Wang. 2023. "Exploring Spatial Correlations of Tourism Ecological Security in China: A Perspective from Social Network Analysis" International Journal of Environmental Research and Public Health 20, no. 5: 3912. https://doi.org/10.3390/ijerph20053912
APA StyleWang, Z., Huang, D., & Wang, J. (2023). Exploring Spatial Correlations of Tourism Ecological Security in China: A Perspective from Social Network Analysis. International Journal of Environmental Research and Public Health, 20(5), 3912. https://doi.org/10.3390/ijerph20053912


