
Machine Learning Models to Predict the Risk of Rapidly Progressive Kidney Disease and the Need for Nephrology Referral in Adult Patients with Type 2 Diabetes


Abstract
1. Introduction
2. Materials and Methods
2.1. Study Subjects
2.2. Data Extraction
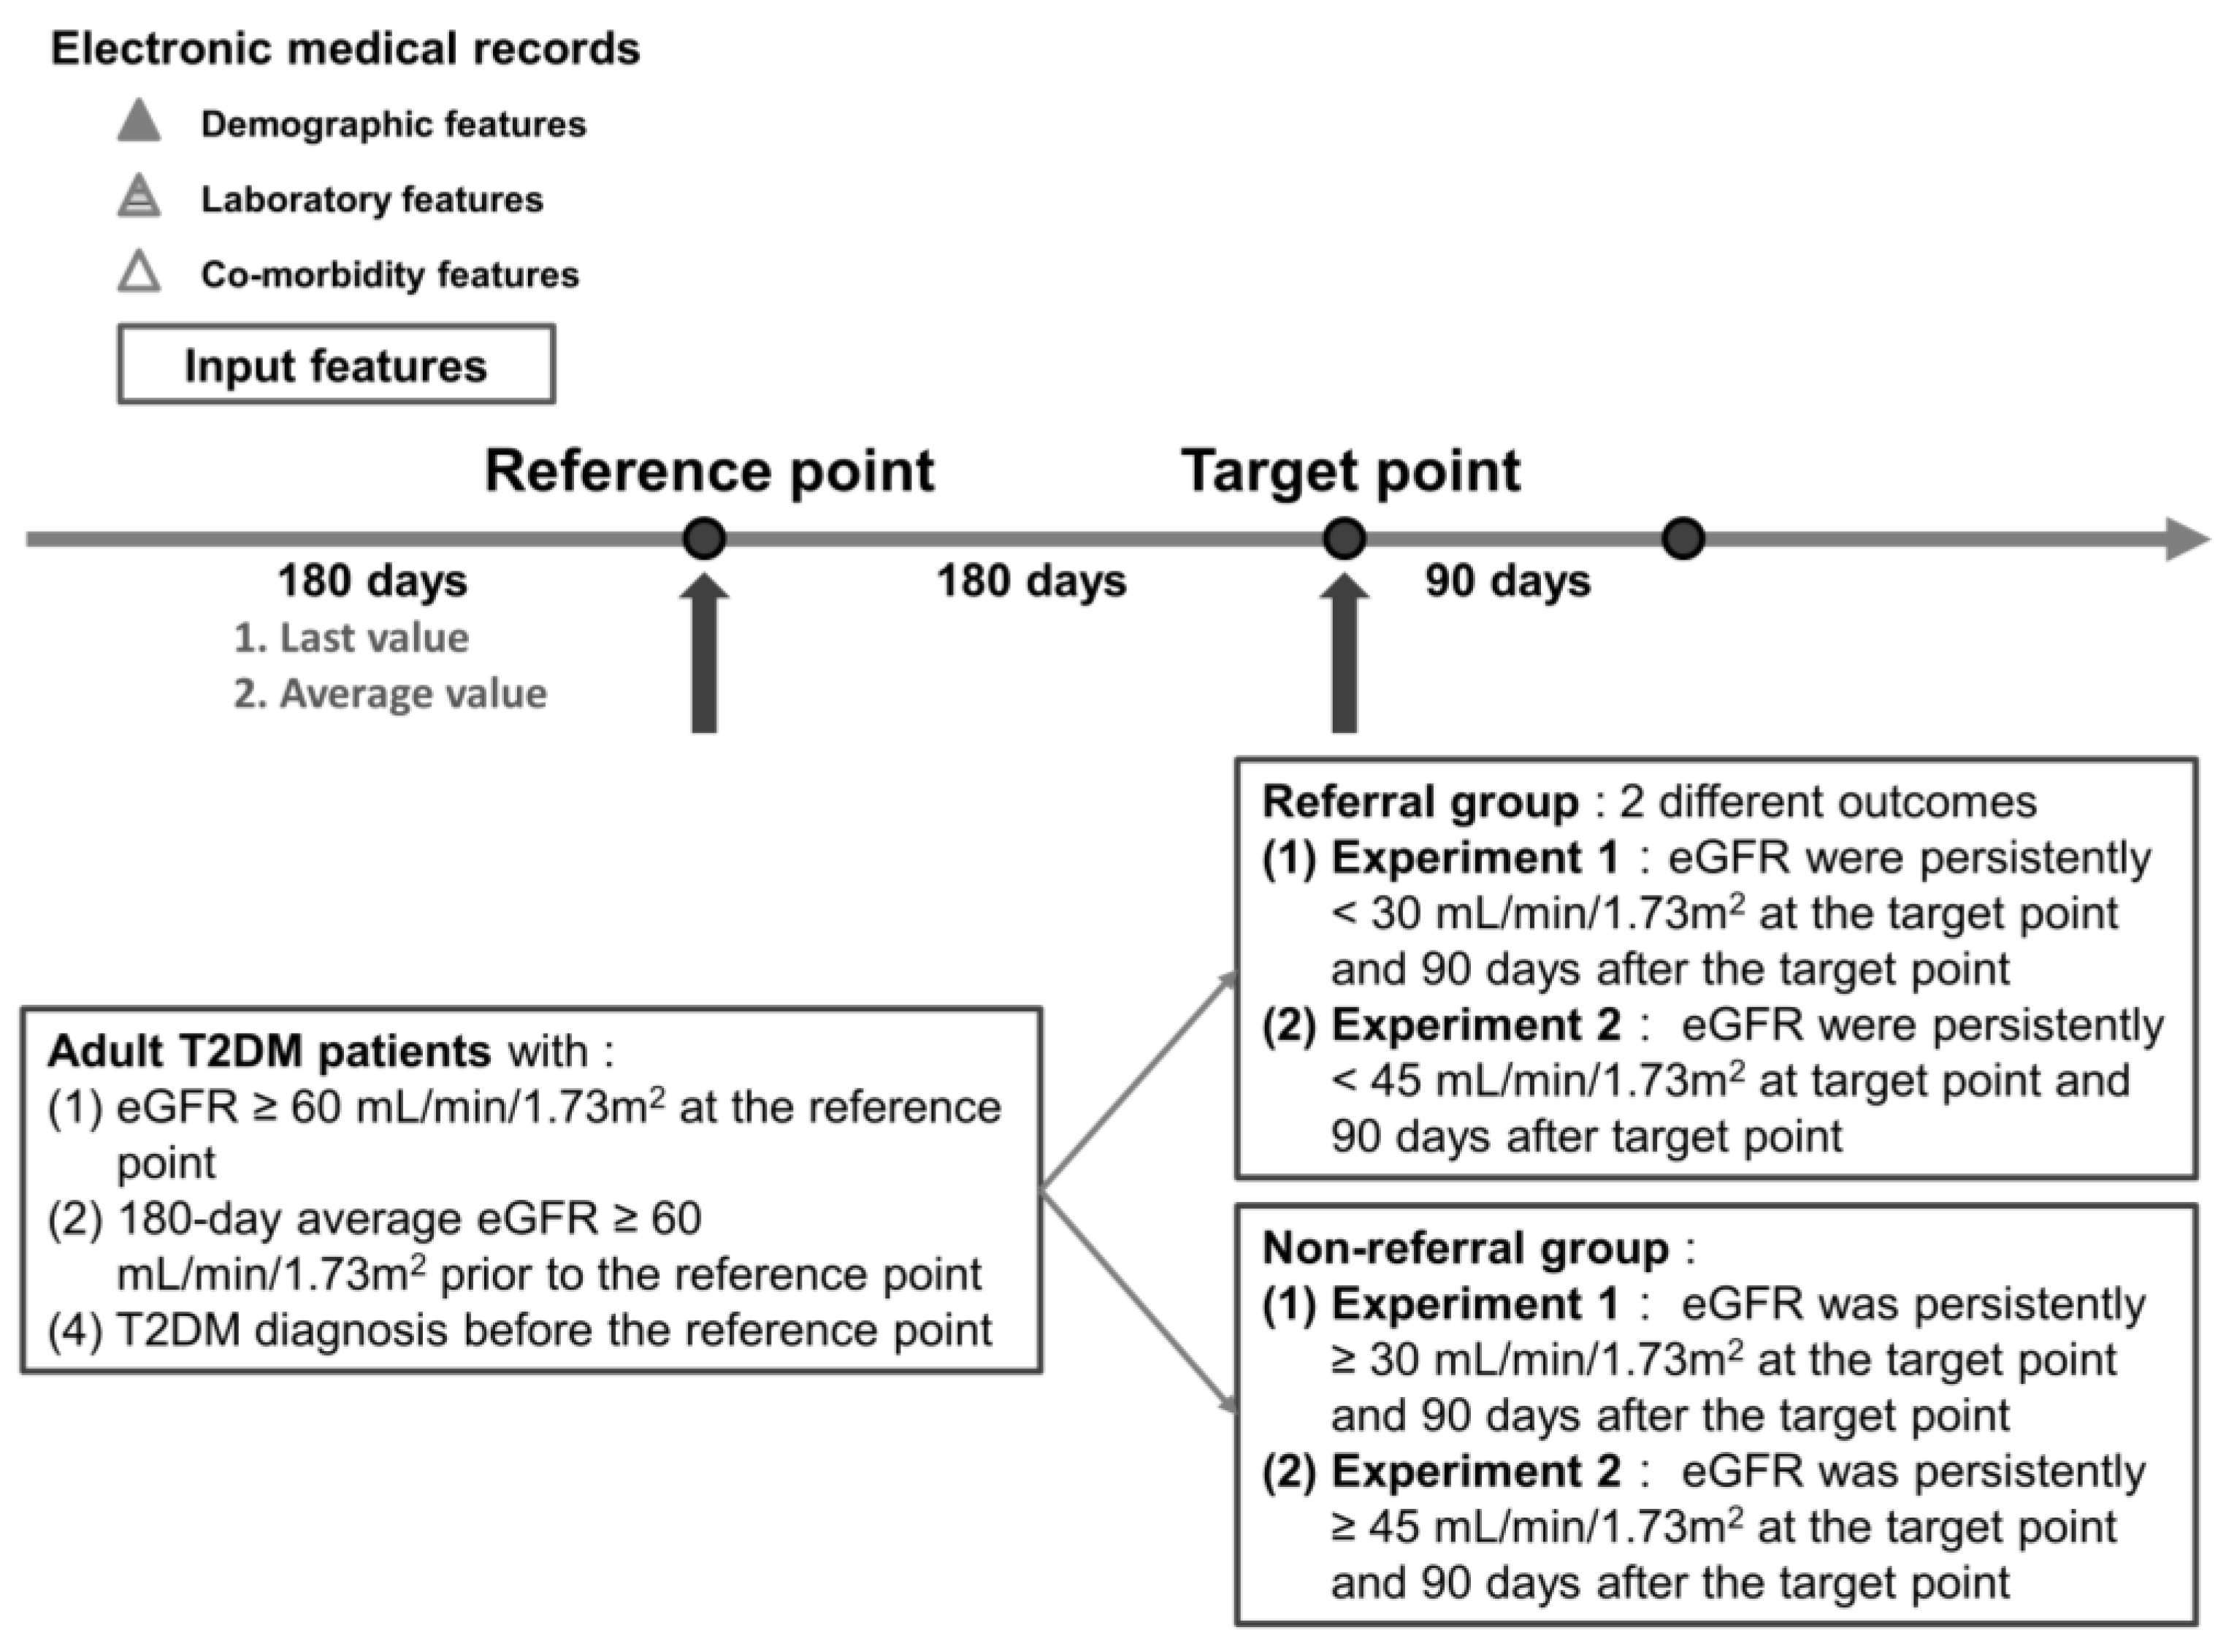
2.3. Study Design and Label Definition
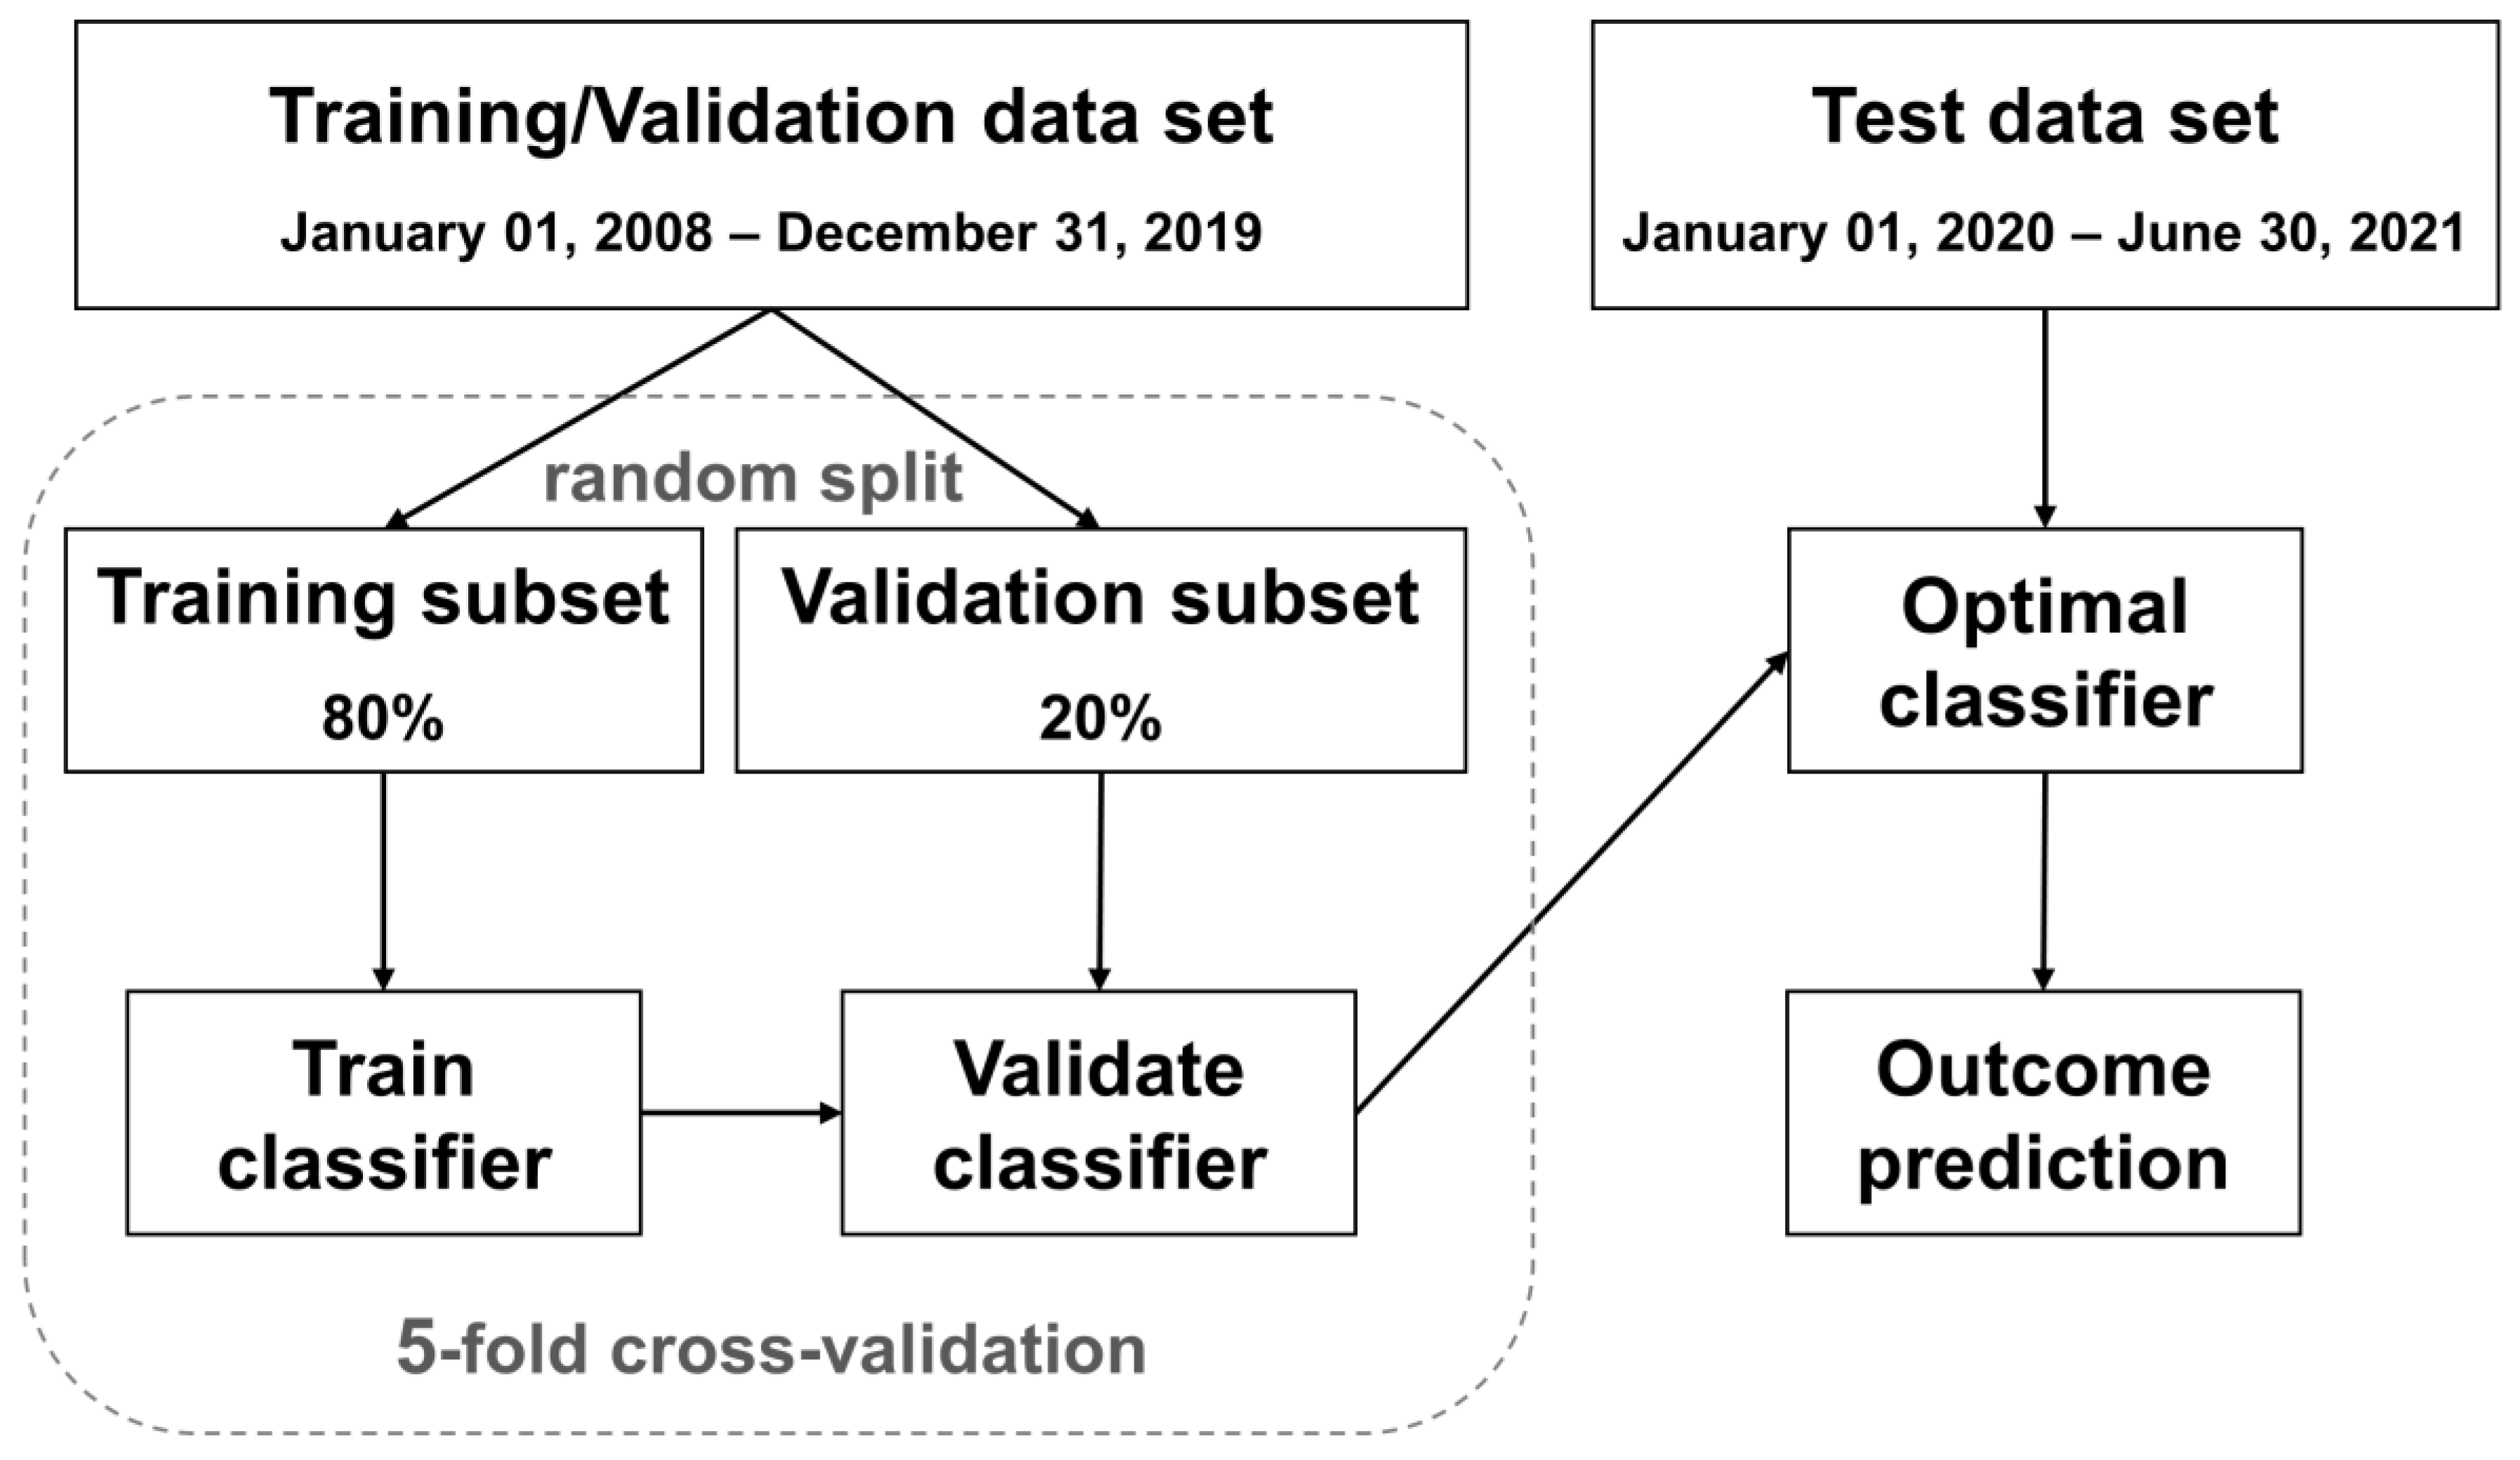
2.4. Data Preprocessing and Machine Learning Models
3. Results
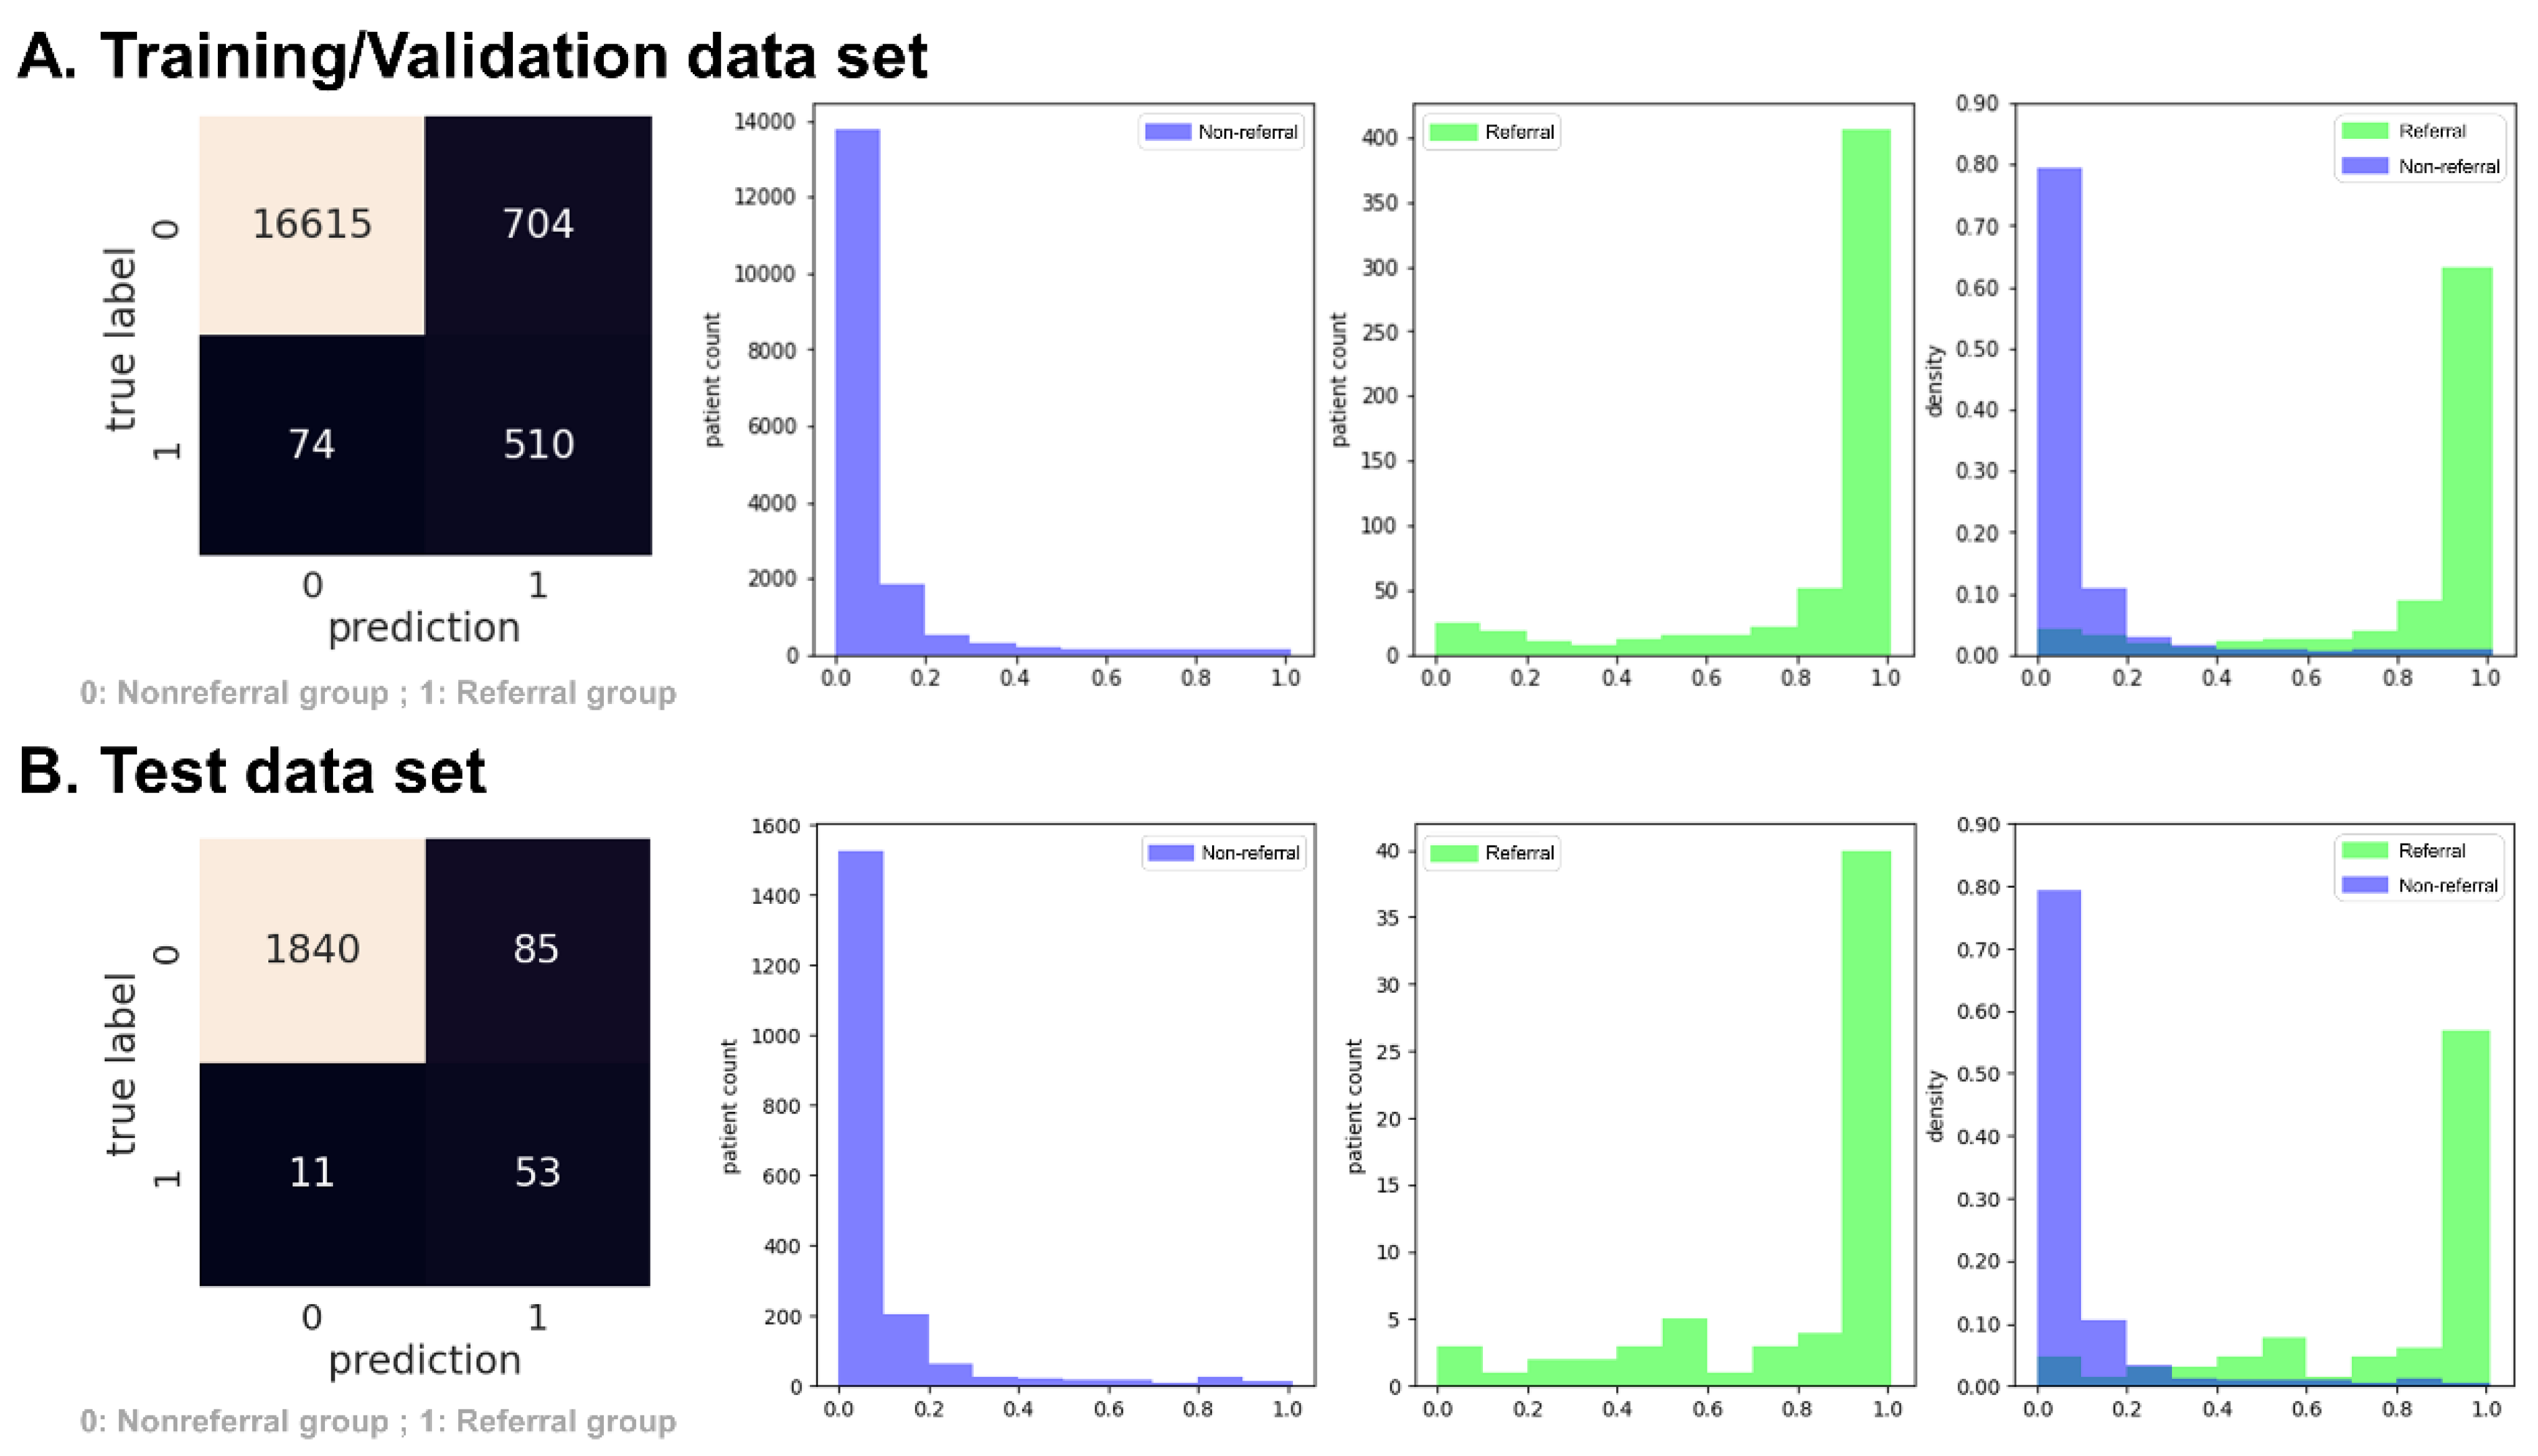
3.1. Experiment 1: Predict Rapidly Progressive Kidney Disease and Nephrology Referral When the eGFR Was Persistently Lower than 30 mL/min/1.73 m2
3.2. Experiment 2: Predict Rapidly Progressive Kidney Disease and Nephrology Referral When the eGFR Was Persistently Lower than 45 mL/min/1.73 m2
3.3. Additional Experiment with Loose Inclusion and Labeling Criteria for Both Experiments 1 and 2
4. Discussion
5. Conclusions
Author Contributions
Funding
Institutional Review Board Statement
Informed Consent Statement
Data Availability Statement
Acknowledgments
Conflicts of Interest
Appendix A

| Models | Data Sets | Accuracy | Referral Group (n = 1314) | Non-Referral Group (n = 10,328) | AUROC | ||
|---|---|---|---|---|---|---|---|
| Recall | Precision | Recall | Precision | ||||
| Original | Validation | 0.88 ± 0.01 | 0.80 ± 0.01 | 0.48 ± 0.02 | 0.89 ± 0.01 | 0.97 ± 0.00 | 0.92 ± 0.01 |
| Test | 0.88 ± 0.01 | 0.84 ± 0.01 | 0.53 ± 0.01 | 0.89 ± 0.00 | 0.97 ± 0.00 | 0.92 ± 0.00 | |
| Downsample | Validation | 0.86 ± 0.01 | 0.81 ± 0.02 | 0.43 ± 0.01 | 0.86 ± 0.01 | 0.97 ± 0.00 | 0.91 ± 0.01 |
| Test | 0.87 ± 0.01 | 0.82 ± 0.01 | 0.46 ± 0.01 | 0.88 ± 0.01 | 0.98 ± 0.00 | 0.90 ± 0.01 | |
| SMOTE | Validation | 0.92 ± 0.00 | 0.68 ± 0.01 | 0.62 ± 0.01 | 0.95 ± 0.00 | 0.96 ± 0.00 | 0.92 ± 0.01 |
| Test | 0.88 ± 0.01 | 0.74 ± 0.01 | 0.49 ± 0.02 | 0.90 ± 0.01 | 0.96 ± 0.00 | 0.87 ± 0.00 | |
| Tomek Links | Validation | 0.88 ± 0.00 | 0.81 ± 0.02 | 0.47 ± 0.01 | 0.88 ± 0.00 | 0.97 ± 0.00 | 0.92 ± 0.01 |
| Test | 0.86 ± 0.01 | 0.81 ± 0.01 | 0.43 ± 0.02 | 0.86 ± 0.01 | 0.97 ± 0.00 | 0.90 ± 0.00 | |
Appendix B
| Overall (n = 19,892) | Referral Group (n = 648) | Non-Referral Group (n = 19,244) | p-Value | ||||
|---|---|---|---|---|---|---|---|
| Number | Percentage | Number | Percentage | Number | Percentage | ||
| Age | 0 | 0% | 0 | 0% | 0 | 0% | - |
| Sex | 0 | 0% | 0 | 0% | 0 | 0% | - |
| Weight | 2310 | 11.61% | 37 | 5.71% | 2273 | 11.81% | <0.001 |
| Height | 3381 | 17.00% | 63 | 9.72% | 3318 | 17.24% | <0.001 |
| Hypertension | 0 | 0% | 0 | 0% | 0 | 0% | - |
| CAD | 0 | 0% | 0 | 0% | 0 | 0% | - |
| Stroke | 0 | 0% | 0 | 0% | 0 | 0% | - |
| PAD | 0 | 0% | 0 | 0% | 0 | 0% | - |
| CHF | 0 | 0% | 0 | 0% | 0 | 0% | - |
| AKI | 0 | 0% | 0 | 0% | 0 | 0% | - |
| Liver cirrhosis | 0 | 0% | 0 | 0% | 0 | 0% | - |
| Cancer | 0 | 0% | 0 | 0% | 0 | 0% | - |
| Bacteremia | 0 | 0% | 0 | 0% | 0 | 0% | - |
| Shock | 0 | 0% | 0 | 0% | 0 | 0% | - |
| Peritonitis | 0 | 0% | 0 | 0% | 0 | 0% | - |
| Ascites | 0 | 0% | 0 | 0% | 0 | 0% | - |
| EV bleeding | 0 | 0% | 0 | 0% | 0 | 0% | - |
| Creatinine | 0 | 0% | 0 | 0% | 0 | 0% | - |
| BUN | 3612 | 18.16% | 23 | 3.55% | 3589 | 18.65% | <0.001 |
| Fasting glucose | 6520 | 32.78% | 128 | 19.75% | 6392 | 33.22% | <0.001 |
| Random glucose | 5240 | 26.34% | 74 | 11.42% | 5166 | 26.84% | <0.001 |
| HbA1c | 4845 | 24.36% | 83 | 12.81% | 4762 | 24.75% | <0.001 |
| HGB | 9557 | 48.04% | 348 | 53.70% | 9209 | 47.85% | 0.003 |
| HCT | 8704 | 43.76% | 205 | 31.64% | 8499 | 44.16% | <0.001 |
| Albumin | 11,362 | 57.12% | 204 | 31.48% | 11,158 | 57.98% | <0.001 |
| AST | 4667 | 23.46% | 118 | 18.21% | 4549 | 23.64% | 0.001 |
| ALT | 1866 | 9.38% | 96 | 14.81% | 1770 | 9.20% | <0.001 |
| CPK | 12,846 | 64.58% | 261 | 40.28% | 12,585 | 65.40% | <0.001 |
| hsCRP | 10,935 | 54.97% | 251 | 38.73% | 10,684 | 55.52% | <0.001 |
| K | 2886 | 14.51% | 7 | 1.08% | 2879 | 14.96% | <0.001 |
| RBC | 7353 | 36.96% | 168 | 25.93% | 7185 | 37.34% | <0.001 |
| WBC | 1764 | 8.87% | 35 | 5.40% | 1729 | 8.98% | 0.002 |
| Bil-T | 8844 | 44.46% | 286 | 44.14% | 8558 | 44.47% | 0.866 |
| Uric acid | 12,835 | 64.52% | 289 | 44.60% | 12,546 | 65.19% | <0.001 |
| CHO | 7093 | 35.66% | 165 | 25.46% | 6928 | 36.00% | <0.001 |
| LDL | 7233 | 36.36% | 129 | 19.91% | 7104 | 36.92% | <0.001 |
| TG | 6863 | 34.50% | 159 | 24.54% | 6704 | 34.84% | <0.001 |
| UPCR | 16,736 | 84.13% | 295 | 45.52% | 16,441 | 85.43% | <0.001 |
| UACR | 11,665 | 58.64% | 258 | 39.81% | 11,407 | 59.28% | <0.001 |
| Overall (n = 16,145) | Referral Group (n = 986) | Non-Referral Group (n = 15,159) | p-Value | ||||
|---|---|---|---|---|---|---|---|
| Number | Percentage | Number | Percentage | Number | Percentage | ||
| Age | 0 | 0% | 0 | 0% | 0 | 0% | - |
| Sex | 0 | 0% | 0 | 0% | 0 | 0% | - |
| Weight | 1898 | 11.76% | 73 | 7.40% | 1825 | 12.04% | <0.001 |
| Height | 2694 | 16.69% | 123 | 12.47% | 2571 | 16.96% | <0.001 |
| Hypertension | 0 | 0% | 0 | 0% | 0 | 0% | - |
| CAD | 0 | 0% | 0 | 0% | 0 | 0% | - |
| Stroke | 0 | 0% | 0 | 0% | 0 | 0% | - |
| PAD | 0 | 0% | 0 | 0% | 0 | 0% | - |
| CHF | 0 | 0% | 0 | 0% | 0 | 0% | - |
| AKI | 0 | 0% | 0 | 0% | 0 | 0% | - |
| Liver cirrhosis | 0 | 0% | 0 | 0% | 0 | 0% | - |
| Cancer | 0 | 0% | 0 | 0% | 0 | 0% | - |
| Bacteremia | 0 | 0% | 0 | 0% | 0 | 0% | - |
| Shock | 0 | 0% | 0 | 0% | 0 | 0% | - |
| Peritonitis | 0 | 0% | 0 | 0% | 0 | 0% | - |
| Ascites | 0 | 0% | 0 | 0% | 0 | 0% | - |
| EV bleeding | 0 | 0% | 0 | 0% | 0 | 0% | - |
| Creatinine | 0 | 0% | 0 | 0% | 0 | 0% | - |
| BUN | 3312 | 20.51% | 92 | 9.33% | 3220 | 21.24% | <0.001 |
| Fasting glucose | 5103 | 31.61% | 225 | 22.82% | 4878 | 32.18% | <0.001 |
| Random glucose | 4408 | 27.30% | 129 | 13.08% | 4279 | 28.23% | <0.001 |
| HbA1c | 3781 | 23.42% | 135 | 13.69% | 3646 | 24.05% | <0.001 |
| HGB | 7723 | 47.84% | 554 | 56.19% | 7169 | 47.29% | <0.001 |
| HCT | 7207 | 44.64% | 369 | 37.42% | 6838 | 45.11% | <0.001 |
| Albumin | 9668 | 59.88% | 421 | 42.70% | 9247 | 61.00% | <0.001 |
| AST | 3879 | 24.03% | 199 | 20.18% | 3680 | 24.28% | 0.004 |
| ALT | 1330 | 8.24% | 127 | 12.88% | 1203 | 7.94% | <0.001 |
| CPK | 10,836 | 67.12% | 466 | 47.26% | 10,370 | 68.41% | <0.001 |
| hsCRP | 9211 | 57.05% | 424 | 43.00% | 8787 | 57.97% | <0.001 |
| K | 2663 | 16.49% | 48 | 4.87% | 2615 | 17.25% | <0.001 |
| RBC | 6195 | 38.37% | 297 | 30.12% | 5898 | 38.91% | <0.001 |
| WBC | 1545 | 9.57% | 65 | 6.59% | 1480 | 9.76% | 0.001 |
| Bil-T | 7282 | 45.10% | 404 | 40.97% | 6878 | 45.37% | 0.007 |
| Uric acid | 10,478 | 64.90% | 533 | 54.06% | 9945 | 65.60% | <0.001 |
| CHO | 5465 | 33.85% | 248 | 25.15% | 5217 | 34.42% | <0.001 |
| LDL | 5734 | 35.52% | 188 | 19.07% | 5546 | 36.59% | <0.001 |
| TG | 5309 | 32.88% | 250 | 25.35% | 5059 | 33.37% | <0.001 |
| UPCR | 14,034 | 86.92% | 509 | 51.62% | 13,525 | 89.22% | <0.001 |
| UACR | 9340 | 57.85% | 419 | 42.49% | 8921 | 58.85% | <0.001 |
References
- Kianmehr, H.; Zhang, P.; Luo, J.; Guo, J.; Pavkov, M.E.; Bullard, K.M.; Gregg, E.W.; Ospina, N.S.; Fonseca, V.; Shi, L.; et al. Potential Gains in Life Expectancy Associated With Achieving Treatment Goals in US Adults With Type 2 Diabetes. JAMA Netw. Open 2022, 5, e227705. [Google Scholar] [CrossRef]
- Loukine, L.; Waters, C.; Choi, B.C.; Ellison, J. Impact of diabetes mellitus on life expectancy and health-adjusted life expectancy in Canada. Popul. Health Metr. 2012, 10, 7. [Google Scholar] [CrossRef] [PubMed]
- Rao Kondapally Seshasai, S.; Kaptoge, S.; Thompson, A.; Di Angelantonio, E.; Gao, P.; Sarwar, N.; Whincup, P.H.; Mukamal, K.J.; Gillum, R.F.; Holme, I.; et al. Diabetes mellitus, fasting glucose, and risk of cause-specific death. N. Engl. J. Med. 2011, 364, 829–841. [Google Scholar] [PubMed]
- Afkarian, M.; Sachs, M.C.; Kestenbaum, B.; Hirsch, I.B.; Tuttle, K.R.; Himmelfarb, J.; De Boer, I.H. Kidney disease and increased mortality risk in type 2 diabetes. J. Am. Soc. Nephrol. 2013, 24, 302–308. [Google Scholar] [CrossRef] [PubMed]
- Gregg, E.W.; Li, Y.; Wang, J.; Rios Burrows, N.; Ali, M.K.; Rolka, D.; Williams, D.E.; Geiss, L. Changes in diabetes-related complications in the United States, 1990–2010. N. Engl. J. Med. 2014, 370, 1514–1523. [Google Scholar] [CrossRef]
- Martínez-Castelao, A.; Soler, M.J.; Górriz Teruel, J.L.; Navarro-González, J.F.; Fernandez-Fernandez, B.; de Alvaro Moreno, F.; Ortiz, A. Optimizing the timing of nephrology referral for patients with diabetic kidney disease. Clin. Kidney J. 2021, 14, 5–8. [Google Scholar] [CrossRef]
- United States Renal Data System. 2022 USRDS Annual Data Report: Epidemiology of Kidney Disease in the United States; National Institutes of Health, National Institute of Diabetes and Digestive and Kidney Diseases: Bethesda, MD, USA, 2022. [Google Scholar]
- Lai, T.-S.; Hsu, C.-C.; Lin, M.-H.; Wu, V.-C.; Chen, Y.-M. Trends in the incidence and prevalence of end-stage kidney disease requiring dialysis in Taiwan: 2010–2018. J. Formos. Med. Assoc. 2022, 121, S5–S11. [Google Scholar] [CrossRef]
- Smart, N.A.; Dieberg, G.; Ladhani, M.; Titus, T. Early referral to specialist nephrology services for preventing the progression to end-stage kidney disease. Cochrane Database Syst. Rev. 2014, 6, CD007333. [Google Scholar] [CrossRef]
- Porrini, E.; Ruggenenti, P.; Mogensen, C.E.; Barlovic, D.P.; Praga, M.; Cruzado, J.M.; Hojs, R.; Abbate, M.; de Vries, A.P.; on behalf of the ERA-EDTA diabesity working group. Non-proteinuric pathways in loss of renal function in patients with type 2 diabetes. Lancet Diabetes Endocrinol. 2015, 3, 382–391. [Google Scholar] [CrossRef]
- Kritmetapak, K.; Anutrakulchai, S.; Pongchaiyakul, C.; Puapairoj, A. Clinical and pathological characteristics of non-diabetic renal disease in type 2 diabetes patients. Clin. Kidney J. 2018, 11, 342–347. [Google Scholar] [CrossRef]
- Jiang, F.; Jiang, Y.; Zhi, H.; Dong, Y.; Li, H.; Ma, S.; Wang, Y.; Dong, Q.; Shen, H.; Wang, Y. Artificial intelligence in healthcare: Past, present and future. Stroke Vasc. Neurol. 2017, 2, 230–243. [Google Scholar] [CrossRef] [PubMed]
- Yuan, Q.; Zhang, H.; Deng, T.; Tang, S.; Yuan, X.; Tang, W.; Xie, Y.; Ge, H.; Wang, X.; Zhou, Q. Role of artificial intelligence in kidney disease. Int. J. Med. Sci. 2020, 17, 970–984. [Google Scholar] [CrossRef] [PubMed]
- Belur Nagaraj, S.; Pena, M.J.; Ju, W.; Heerspink, H.L.; Consortium, B.D. Machine-learning-based early prediction of end-stage renal disease in patients with diabetic kidney disease using clinical trials data. Diabetes Obes. Metab. 2020, 22, 2479–2486. [Google Scholar] [CrossRef] [PubMed]
- Dong, Z.; Wang, Q.; Ke, Y.; Zhang, W.; Hong, Q.; Liu, C.; Liu, X.; Yang, J.; Xi, Y.; Shi, J. Prediction of 3-year risk of diabetic kidney disease using machine learning based on electronic medical records. J. Transl. Med. 2022, 20, 143. [Google Scholar] [CrossRef]
- Huang, G.-M.; Huang, K.-Y.; Lee, T.-Y.; Weng, J.T.-Y. An interpretable rule-based diagnostic classification of diabetic nephropathy among type 2 diabetes patients. BMC Bioinform. 2015, 16, S5. [Google Scholar] [CrossRef]
- Makino, M.; Yoshimoto, R.; Ono, M.; Itoko, T.; Katsuki, T.; Koseki, A.; Kudo, M.; Haida, K.; Kuroda, J.; Yanagiya, R. Artificial intelligence predicts the progression of diabetic kidney disease using big data machine learning. Sci. Rep. 2019, 9, 11862. [Google Scholar] [CrossRef]
- Rodriguez-Romero, V.; Bergstrom, R.F.; Decker, B.S.; Lahu, G.; Vakilynejad, M.; Bies, R.R. Prediction of nephropathy in type 2 diabetes: An analysis of the ACCORD trial applying machine learning techniques. Clin. Transl. Sci. 2019, 12, 519–528. [Google Scholar] [CrossRef]
- Association, A.D. 11. Microvascular Complications and Foot Care: Standards of Medical Care in Diabetes-2021. Diabetes Care 2020, 44, S151–S167. [Google Scholar] [CrossRef]
- Levin, A.; Stevens, P.E.; Bilous, R.W.; Coresh, J.; De Francisco, A.L.; De Jong, P.E.; Griffith, K.E.; Hemmelgarn, B.R.; Iseki, K.; Lamb, E.J. Kidney Disease: Improving Global Outcomes (KDIGO) CKD Work Group. KDIGO 2012 clinical practice guideline for the evaluation and management of chronic kidney disease. Kidney Int. Suppl. 2013, 3, 1–150. [Google Scholar]
- Pinier, C.; Gatault, P.; Francois, M.; Barbet, C.; Longuet, H.; Rabot, N.; Noble, J.; Bailly, E.; Buchler, M.; Sautenet, B. Renal function at the time of nephrology referral but not dialysis initiation as a risk for death in patients with diabetes mellitus. Clin. Kidney J. 2018, 11, 762–768. [Google Scholar] [CrossRef]
- Emmanuel, T.; Maupong, T.; Mpoeleng, D.; Semong, T.; Mphago, B.; Tabona, O. A survey on missing data in machine learning. J. Big Data 2021, 8, 140. [Google Scholar] [CrossRef] [PubMed]
- Soley-Bori, M. Dealing with missing data: Key assumptions and methods for applied analysis. Boston Univ. 2013, 4, 1–19. [Google Scholar]
- Chauhan, N.K.; Singh, K. Performance assessment of machine learning classifiers using selective feature approaches for cervical cancer detection. Wirel. Pers. Commun. 2022, 124, 2335–2366. [Google Scholar] [CrossRef]
- Kumari, V.A.; Chitra, R. Classification of diabetes disease using support vector machine. Int. J. Eng. Res. Appl. 2013, 3, 1797–1801. [Google Scholar]
- Neamțu, B.M.; Visa, G.; Maniu, I.; Ognean, M.L.; Pérez-Elvira, R.; Dragomir, A.; Agudo, M.; Șofariu, C.R.; Gheonea, M.; Pitic, A. A decision-tree approach to assist in forecasting the outcomes of the neonatal brain injury. Int. J. Environ. Res. Public Health 2021, 18, 4807. [Google Scholar] [CrossRef]
- Prusty, S.; Patnaik, S.; Dash, S.K. SKCV: Stratified K-fold cross-validation on ML classifiers for predicting cervical cancer. Front. Nanotechnol. 2022, 4, 972421. [Google Scholar] [CrossRef]
- Yang, T.; Zhang, L.; Yi, L.; Feng, H.; Li, S.; Chen, H.; Zhu, J.; Zhao, J.; Zeng, Y.; Liu, H. Ensemble Learning Models Based on Noninvasive Features for Type 2 Diabetes Screening: Model Development and Validation. JMIR Med. Inform. 2020, 8, e15431. [Google Scholar] [CrossRef]
- de Oliveira, G.P.; Fonseca, A.; Rodrigues, P.C. Diabetes diagnosis based on hard and soft voting classifiers combining statistical learning models. Braz. J. Biom. 2022, 40, 415–427. [Google Scholar] [CrossRef]
- Kumari, S.; Kumar, D.; Mittal, M. An ensemble approach for classification and prediction of diabetes mellitus using soft voting classifier. Int. J. Cogn. Comput. Eng. 2021, 2, 40–46. [Google Scholar] [CrossRef]
- Pedregosa, F.; Varoquaux, G.; Gramfort, A.; Michel, V.; Thirion, B.; Grisel, O.; Blondel, M.; Prettenhofer, P.; Weiss, R.; Dubourg, V. Scikit-learn: Machine learning in Python. J. Mach. Learn. Res. 2011, 12, 2825–2830. [Google Scholar]
- Lundberg, S.M.; Erion, G.G.; Lee, S.-I. Consistent individualized feature attribution for tree ensembles. arXiv 2018, arXiv:1802.03888. [Google Scholar]
- Tseng, P.-Y.; Chen, Y.-T.; Wang, C.-H.; Chiu, K.-M.; Peng, Y.-S.; Hsu, S.-P.; Chen, K.-L.; Yang, C.-Y.; Lee, O.K.-S. Prediction of the development of acute kidney injury following cardiac surgery by machine learning. Crit. Care 2020, 24, 478. [Google Scholar] [CrossRef] [PubMed]
- Tomek, I. Two Modifications of CNN. IEEE Trans. Syst. Man Cybern 1976, SMC-6, 769–772. [Google Scholar]
- Barros, T.M.; Souza Neto, P.A.; Silva, I.; Guedes, L.A. Predictive models for imbalanced data: A school dropout perspective. Educ. Sci. 2019, 9, 275. [Google Scholar] [CrossRef]
- He, H.; Garcia, E.A. Learning from Imbalanced Data. IEEE Trans. Knowl. Data Eng. 2009, 21, 1263–1284. [Google Scholar]


| Overall (n = 19,892) | Referral Group (n = 648) | Non-Referral Group (n = 19,244) | p-Value | ||||
|---|---|---|---|---|---|---|---|
| Age (years) | 64.21 | (55.85–72.55) | 68.75 | (59.92–76.80) | 64.04 | (55.70–72.30) | <0.001 |
| Male sex | 11,765 | (59.14%) | 391 | (60.34%) | 11,374 | (59.10%) | 0.529 |
| Weight (kg) | 66.50 | (58.0–76.0) | 66.0 | (59.0–75.0) | 66.5 | (58.0–76.0) | 0.904 |
| Height (cm) | 162.0 | (155.5–168.0) | 161.50 | (155.9–168.0) | 162.00 | (155.5–168.0) | 0.188 |
| Hypertension | 10,273 | (51.64%) | 464 | (71.60%) | 9809 | (50.97%) | <0.001 |
| CAD | 3196 | (16.07%) | 139 | (21.45%) | 3057 | (15.89%) | <0.001 |
| Stroke | 2962 | (14.89%) | 133 | (20.52%) | 2829 | (14.70%) | <0.001 |
| PAD | 351 | (1.76%) | 36 | (5.56%) | 315 | (1.64%) | <0.001 |
| CHF | 1147 | (5.77%) | 94 | (14.51%) | 1053 | (5.47%) | <0.001 |
| AKI | 454 | (2.28%) | 103 | (15.9%) | 351 | (1.82%) | <0.001 |
| Liver cirrhosis | 966 | (4.86%) | 42 | (6.48%) | 924 | (4.80%) | 0.050 |
| Cancer | 5480 | (27.55%) | 138 | (21.30%) | 5342 | (27.76%) | <0.001 |
| Bacteremia | 644 | (3.24%) | 39 | (6.02%) | 605 | (3.14%) | <0.001 |
| Shock | 289 | (1.45%) | 15 | (2.31%) | 274 | (1.42%) | 0.060 |
| Peritonitis | 282 | (1.42%) | 8 | (1.23%) | 274 | (1.42%) | 0.689 |
| Ascites | 167 | (0.84%) | 10 | (1.54%) | 157 | (0.82%) | 0.046 |
| EV bleeding | 44 | (0.22%) | 1 | (0.15%) | 43 | (0.22%) | 0.713 |
| Creatinine (mg/dl) | 0.89 | (0.72–1.10) | 1.75 | (1.48–2.05) | 0.88 | (0.71–1.07) | <0.001 |
| BUN (mg/dl) | 16.0 | (13.0–21.0) | 28.0 | (22.0–35.0) | 16.0 | (12.5–20.0) | <0.001 |
| Fasting glucose (mg/dl) | 123.0 | (105.0–147.0) | 123.0 | (103.0–161.0) | 123.0 | (105.0–146.0) | <0.001 |
| Random glucose (mg/dl) | 136.0 | (111.0–180.0) | 143.0 | (113.0–197.0) | 135.5 | (111.0–180.0) | 0.019 |
| HbA1c (%) | 6.8 | (6.2–7.7) | 7.1 | (6.3–8.0) | 6.8 | (6.2–6.7) | <0.001 |
| HGB (g/dL) | 13.3 | (11.8–14.6) | 11.4 | (10.0–12.8) | 13.4 | (11.9–14.7) | <0.001 |
| HCT (%) | 39.29 | (34.80–43.00) | 34.50 | (30.33–38.50) | 39.45 | (35.10–43.10) | <0.001 |
| Albumin (g/dL) | 4.10 | (3.60–4.40) | 3.80 | (3.40–4.10) | 4.10 | (3.60–4.40) | <0.001 |
| AST (U/L) | 25.0 | (19.0–36.0) | 23.3 | (17.0–33.0) | 25.0 | (19.0–36.0) | <0.001 |
| ALT (U/L) | 24.0 | (17.0–37.0) | 20.0 | (13.0–28.0) | 24.0 | (17.0–37.0) | <0.001 |
| CPK (U/L) | 87.0 | (54.0–144.0) | 88.0 | (54.3–165.8) | 87.0 | (53.6–143.0) | 0.1415 |
| hsCRP (mg/dl) | 0.66 | (0.15–3.80) | 1.29 | (0.23–4.69) | 0.64 | (0.15–3.77) | <0.001 |
| K (mEq/L) | 4.10 | (3.80–4.40) | 4.30 | (3.90–4.61) | 4.10 | (3.80–4.40) | <0.001 |
| RBC (×106/μL) | 4.32 | (3.83–4.78) | 3.81 | (3.28–4.32) | 4.33 | (3.85–4.79) | <0.001 |
| WBC (/μL) | 7320 | (5808–9350) | 7310 | (5800–9350) | 7510 | (6015–9376) | 0.282 |
| Bil-T (mg/dl) | 0.60 | (0.40–0.80) | 0.50 | (0.30–0.70) | 0.60 | (0.40–0.80) | <0.001 |
| Uric acid (mg/dl) | 5.9 | (4.9–7.9) | 6.8 | (5.4–8.2) | 5.9 | (4.9–7.0) | <0.001 |
| CHO (mg/dl) | 163.0 | (140.0–190.9) | 160.0 | (130.0–191.8) | 163.0 | (140.0–190.0) | 0.568 |
| LDL (mg/dl) | 93.0 | (74.0–117.0) | 93.0 | (74.0–115.0) | 93.0 | (74.0–117.0) | 0.9311 |
| TG (mg/dl) | 122.0 | (86.0–174.0) | 139.0 | (98.5–201.3) | 121.0 | (86.0–173.0) | <0.001 |
| UPCR (mg/g) | 140.0 | (79.5–380.0) | 1180.0 | (317.5–3318.0) | 120.0 | (71.0–270.0) | <0.001 |
| UACR (mg/g) | 16.1 | (6.9–61.8) | 696.9 | (118.5–2106.0) | 14.9 | (6.7–51.3) | <0.001 |
| Models | Data Sets | Accuracy | Referral Group (n = 648) | Non-Referral Group (n = 19,244) | AUROC | ||
|---|---|---|---|---|---|---|---|
| Recall | Precision | Recall | Precision | ||||
| XGB | Validation | 0.96 ± 0.01 | 0.87 ± 0.04 | 0.42 ± 0.02 | 0.96 ± 0.00 | 1.00 ± 0.00 | 0.97 ± 0.01 |
| Test | 0.95 ± 0.00 | 0.80 ± 0.02 | 0.37 ± 0.01 | 0.95 ± 0.00 | 0.99 ± 0.00 | 0.96 ± 0.00 | |
| LR | Validation | 0.94 ± 0.00 | 0.91 ± 0.03 | 0.34 ± 0.02 | 0.94 ± 0.01 | 1.00 ± 0.00 | 0.97 ± 0.01 |
| Test | 0.93 ± 0.00 | 0.87 ± 0.01 | 0.30 ± 0.01 | 0.93 ± 0.00 | 1.00 ± 0.00 | 0.97 ± 0.00 | |
| RF | Validation | 0.91 ± 0.01 | 0.91 ± 0.02 | 0.26 ± 0.02 | 0.91 ± 0.01 | 1.00 ± 0.00 | 0.97 ± 0.01 |
| Test | 0.91 ± 0.00 | 0.91 ± 0.01 | 0.26 ± 0.00 | 0.91 ± 0.00 | 1.00 ± 0.00 | 0.96 ± 0.00 | |
| Voting | Validation | 0.95 ± 0.00 | 0.91 ± 0.03 | 0.37 ± 0.02 | 0.95 ± 0.00 | 1.00 ± 0.00 | 0.98 ± 0.01 |
| Test | 0.94 ± 0.00 | 0.86 ± 0.01 | 0.33 ± 0.01 | 0.94 ± 0.00 | 1.00 ± 0.00 | 0.97 ± 0.00 | |
| Overall (n = 16,145) | Referral Group (n = 986) | Non-Referral Group (n = 15,159) | p-Value | ||||
|---|---|---|---|---|---|---|---|
| Age (years) | 63.88 | (55.62–72.05) | 69.84 | (61.79–78.05) | 62.46 | (54.37–70.13) | <0.001 |
| Male sex | 9425 | (58.38%) | 563 | (57.10%) | 8862 | (58.46%) | 0.401 |
| Weight (kg) | 66.3 | (58.0–75.9) | 64.5 | (57.0–73.1) | 67.0 | (58.3–76.5) | <0.001 |
| Height (cm) | 162.0 | (155.5–168.0) | 161.0 | (154.0–166.7) | 162.1 | (156.0–168.5) | <0.001 |
| Hypertension | 8066 | (49.96%) | 662 | (67.14%) | 7404 | (48.84%) | <0.001 |
| CAD | 2565 | (15.89%) | 207 | (20.99%) | 2358 | (15.56%) | <0.001 |
| Stroke | 2256 | (13.97%) | 202 | (20.49%) | 2054 | (13.55%) | <0.001 |
| PAD | 248 | (1.54%) | 32 | (3.25%) | 216 | (1.42%) | <0.001 |
| CHF | 786 | (4.87%) | 132 | (13.39%) | 654 | (4.31%) | <0.001 |
| AKI | 165 | (1.02%) | 79 | (8.01%) | 86 | (0.57%) | <0.001 |
| Liver cirrhosis | 748 | (4.63%) | 62 | (6.29%) | 686 | (4.53%) | 0.011 |
| Cancer | 4345 | (26.91%) | 279 | (28.30%) | 4066 | (26.82%) | 0.312 |
| Bacteremia | 426 | (2.64%) | 52 | (5.27%) | 374 | (2.47%) | <0.001 |
| Shock | 179 | (1.11%) | 23 | (2.33%) | 156 | (1.03%) | <0.001 |
| Peritonitis | 211 | (1.31%) | 22 | (2.23%) | 189 | (1.25%) | 0.008 |
| Ascites | 114 | (0.71%) | 17 | (1.72%) | 97 | (0.64%) | <0.001 |
| EV bleeding | 37 | (0.23%) | 4 | (0.41%) | 33 | (0.22%) | 0.232 |
| Creatinine (mg/dl) | 0.88 | (0.71–1.07) | 1.14 | (0.94–1.38) | 0.83 | (0.70–0.99) | <0.001 |
| BUN (mg/dl) | 16.0 | (12.3–20.0) | 19.5 | (15.0–25.0) | 15.0 | (12.0–18.5) | <0.001 |
| Fasting glucose (mg/dl) | 123.0 | (106.0–147.0) | 124.0 | (104.6–153.0) | 123.0 | (106.0–146.0) | 0.277 |
| Random glucose (mg/dl) | 136.0 | (111.0–180.6) | 142.0 | (112.0–192.0) | 134.0 | (111.0–177.0) | <0.001 |
| HbA1c (%) | 6.8 | (6.2–7.7) | 6.9 | (6.2–7.8) | 6.8 | (6.3–7.7) | 0.632 |
| HGB (g/dL) | 13.4 | (11.9–14.6) | 12.1 | (10.7–13.5) | 13.6 | (12.2–14.8) | <0.001 |
| HCT (%) | 39.20 | (34.70–42.90) | 35.90 | (31.60–40.00) | 40.00 | (35.90–43.45) | <0.001 |
| Albumin (g/dL) | 4.10 | (3.55–4.40) | 3.90 | (3.37–4.20) | 4.10 | (3.65–4.40) | <0.001 |
| AST (U/L) | 25.0 | (19.0–37.0) | 25.0 | (19.0–39.0) | 25.0 | (19.0–36.0) | 0.017 |
| ALT (U/L) | 24.0 | (17.0–37.0) | 21.0 | (15.0–34.0) | 25.0 | (17.0–38.0) | <0.001 |
| CPK (U/L) | 86.0 | (52.0–141.0) | 79.7 | (47.0–138.0) | 89.0 | (55.0–142.0) | <0.001 |
| hsCRP (mg/dl) | 0.65 | (0.15–3.74) | 1.28 | (0.26–5.46) | 0.51 | (0.12–3.16) | <0.001 |
| K (mEq/L) | 4.10 | (3.80–4.40) | 4.20 | (3.81–4.50) | 4.10 | (3.80–4.40) | <0.001 |
| RBC (×106/μL) | 4.31 | (3.82–4.77) | 3.94 | (3.46–4.44) | 4.41 | (3.96–4.84) | <0.001 |
| WBC (/μL) | 7250 | (5760–9260) | 7300 | (5700–9307) | 7240 | (5780–9250) | 0.797 |
| Bil-T (mg/dl) | 0.60 | (0.40–0.80) | 0.54 | (0.40–0.80) | 0.60 | (0.40–0.80) | <0.001 |
| Uric acid (mg/dl) | 5.9 | (4.9–7.1) | 6.4 | (5.2–7.6) | 5.8 | (4.8–6.9) | <0.001 |
| CHO (mg/dl) | 163.0 | (140.0–190.0) | 157.0 | (133.0–185.0) | 165.0 | (142.0–192.0) | <0.001 |
| LDL (mg/dl) | 93.0 | (74.0–116.0) | 90.0 | (70.0–113.0) | 94.0 | (75.0–117.0) | <0.001 |
| TG (mg/dl) | 121.0 | (86.0–174.0) | 124.0 | (88.0–179.0) | 120.0 | (85.0–172.0) | 0.003 |
| UPCR (mg/g) | 141.0 | (80.0–370.0) | 200.0 | (98.8–572.3) | 115.0 | (70.0–240.0) | <0.001 |
| UACR (mg/g) | 15.9 | (6.8–60.5) | 57.7 | (14.7–334.5) | 12.6 | (6.2–38.1) | <0.001 |
| Models | Data Sets | Accuracy | Referral Group (n = 986) | Non-Referral Group (n = 15,159) | AUROC | ||
|---|---|---|---|---|---|---|---|
| Recall | Precision | Recall | Precision | ||||
| XGB | Validation | 0.93 ± 0.01 | 0.84 ± 0.03 | 0.44 ± 0.02 | 0.93 ± 0.01 | 0.99 ± 0.00 | 0.95 ± 0.01 |
| Test | 0.92 ± 0.00 | 0.84 ± 0.01 | 0.42 ± 0.01 | 0.93 ± 0.00 | 0.99 ± 0.00 | 0.93 ± 0.01 | |
| LR | Validation | 0.90 ± 0.01 | 0.88 ± 0.04 | 0.37 ± 0.02 | 0.90 ± 0.01 | 0.99 ± 0.00 | 0.95 ± 0.01 |
| Test | 0.90 ± 0.00 | 0.87 ± 0.03 | 0.35 ± 0.01 | 0.90 ± 0.00 | 0.99 ± 0.00 | 0.94 ± 0.01 | |
| RF | Validation | 0.89 ± 0.01 | 0.89 ± 0.03 | 0.33 ± 0.01 | 0.89 ± 0.00 | 0.99 ± 0.00 | 0.95 ± 0.01 |
| Test | 0.88 ± 0.00 | 0.86 ± 0.03 | 0.32 ± 0.01 | 0.88 ± 0.00 | 0.99 ± 0.00 | 0.93 ± 0.00 | |
| Voting | Validation | 0.91 ± 0.00 | 0.88 ± 0.02 | 0.40 ± 0.01 | 0.91 ± 0.01 | 0.99 ± 0.00 | 0.95 ± 0.01 |
| Test | 0.91 ± 0.00 | 0.87 ± 0.02 | 0.39 ± 0.01 | 0.91 ± 0.00 | 0.99 ± 0.00 | 0.94 ± 0.00 | |
| Loose Inclusion and Labeling Criteria Compared with Experiment 1 | |||||||
|---|---|---|---|---|---|---|---|
| Models | Data Sets | Accuracy | Referral Group (n = 2541) | Non-Referral Group (n = 19,244) | AUROC | ||
| Recall | Precision | Recall | Precision | ||||
| XGB | Validation | 0.87 ± 0.00 | 0.78 ± 0.02 | 0.46 ± 0.01 | 0.88 ± 0.01 | 0.97 ± 0.00 | 0.92 ± 0.00 |
| Test | 0.87 ± 0.00 | 0.80 ± 0.01 | 0.47 ± 0.00 | 0.88 ± 0.00 | 0.97 ± 0.00 | 0.92 ± 0.00 | |
| LR | Validation | 0.85 ± 0.01 | 0.81 ± 0.01 | 0.42 ± 0.01 | 0.85 ± 0.01 | 0.97 ± 0.00 | 0.91 ± 0.01 |
| Test | 0.84 ± 0.00 | 0.80 ± 0.01 | 0.41 ± 0.00 | 0.85 ± 0.00 | 0.97 ± 0.00 | 0.90 ± 0.00 | |
| RF | Validation | 0.83 ± 0.00 | 0.83 ± 0.03 | 0.40 ± 0.01 | 0.83 ± 0.01 | 0.97 ± 0.00 | 0.92 ± 0.01 |
| Test | 0.84 ± 0.00 | 0.84 ± 0.01 | 0.41 ± 0.01 | 0.84 ± 0.00 | 0.98 ± 0.00 | 0.92 ± 0.00 | |
| Loose Inclusion and Labeling Criteria Compared with Experiment 2 | |||||||
| Models | Data Sets | Accuracy | Referral Group (n = 3836) | Non-Referral Group (n = 15,159) | AUROC | ||
| Recall | Precision | Recall | Precision | ||||
| XGB | Validation | 0.84 ± 0.01 | 0.81 ± 0.01 | 0.58 ± 0.01 | 0.85 ± 0.00 | 0.95 ± 0.00 | 0.91 ± 0.00 |
| Test | 0.84 ± 0.00 | 0.79 ± 0.00 | 0.57 ± 0.01 | 0.85 ± 0.00 | 0.94 ± 0.00 | 0.90 ± 0.00 | |
| LR | Validation | 0.83 ± 0.00 | 0.81 ± 0.01 | 0.55 ± 0.01 | 0.83 ± 0.00 | 0.95 ± 0.00 | 0.90 ± 0.01 |
| Test | 0.83 ± 0.00 | 0.82 ± 0.00 | 0.55 ± 0.00 | 0.83 ± 0.00 | 0.95 ± 0.00 | 0.89 ± 0.00 | |
| RF | Validation | 0.82 ± 0.01 | 0.83 ± 0.01 | 0.53 ± 0.01 | 0.81 ± 0.01 | 0.95 ± 0.00 | 0.90 ± 0.01 |
| Test | 0.82 ± 0.00 | 0.81 ± 0.01 | 0.54 ± 0.01 | 0.83 ± 0.00 | 0.95 ± 0.00 | 0.89 ± 0.00 | |
Disclaimer/Publisher’s Note: The statements, opinions and data contained in all publications are solely those of the individual author(s) and contributor(s) and not of MDPI and/or the editor(s). MDPI and/or the editor(s) disclaim responsibility for any injury to people or property resulting from any ideas, methods, instructions or products referred to in the content. |
© 2023 by the authors. Licensee MDPI, Basel, Switzerland. This article is an open access article distributed under the terms and conditions of the Creative Commons Attribution (CC BY) license (https://creativecommons.org/licenses/by/4.0/).
Share and Cite
Hsu, C.-T.; Pai, K.-C.; Chen, L.-C.; Lin, S.-H.; Wu, M.-J. Machine Learning Models to Predict the Risk of Rapidly Progressive Kidney Disease and the Need for Nephrology Referral in Adult Patients with Type 2 Diabetes. Int. J. Environ. Res. Public Health 2023, 20, 3396. https://doi.org/10.3390/ijerph20043396
Hsu C-T, Pai K-C, Chen L-C, Lin S-H, Wu M-J. Machine Learning Models to Predict the Risk of Rapidly Progressive Kidney Disease and the Need for Nephrology Referral in Adult Patients with Type 2 Diabetes. International Journal of Environmental Research and Public Health. 2023; 20(4):3396. https://doi.org/10.3390/ijerph20043396
Chicago/Turabian StyleHsu, Chia-Tien, Kai-Chih Pai, Lun-Chi Chen, Shau-Hung Lin, and Ming-Ju Wu. 2023. "Machine Learning Models to Predict the Risk of Rapidly Progressive Kidney Disease and the Need for Nephrology Referral in Adult Patients with Type 2 Diabetes" International Journal of Environmental Research and Public Health 20, no. 4: 3396. https://doi.org/10.3390/ijerph20043396
APA StyleHsu, C.-T., Pai, K.-C., Chen, L.-C., Lin, S.-H., & Wu, M.-J. (2023). Machine Learning Models to Predict the Risk of Rapidly Progressive Kidney Disease and the Need for Nephrology Referral in Adult Patients with Type 2 Diabetes. International Journal of Environmental Research and Public Health, 20(4), 3396. https://doi.org/10.3390/ijerph20043396