
Exploring the Quantitative Assessment of Spatial Risk in Response to Major Epidemic Disasters in Megacities: A Case Study of Qingdao


Abstract
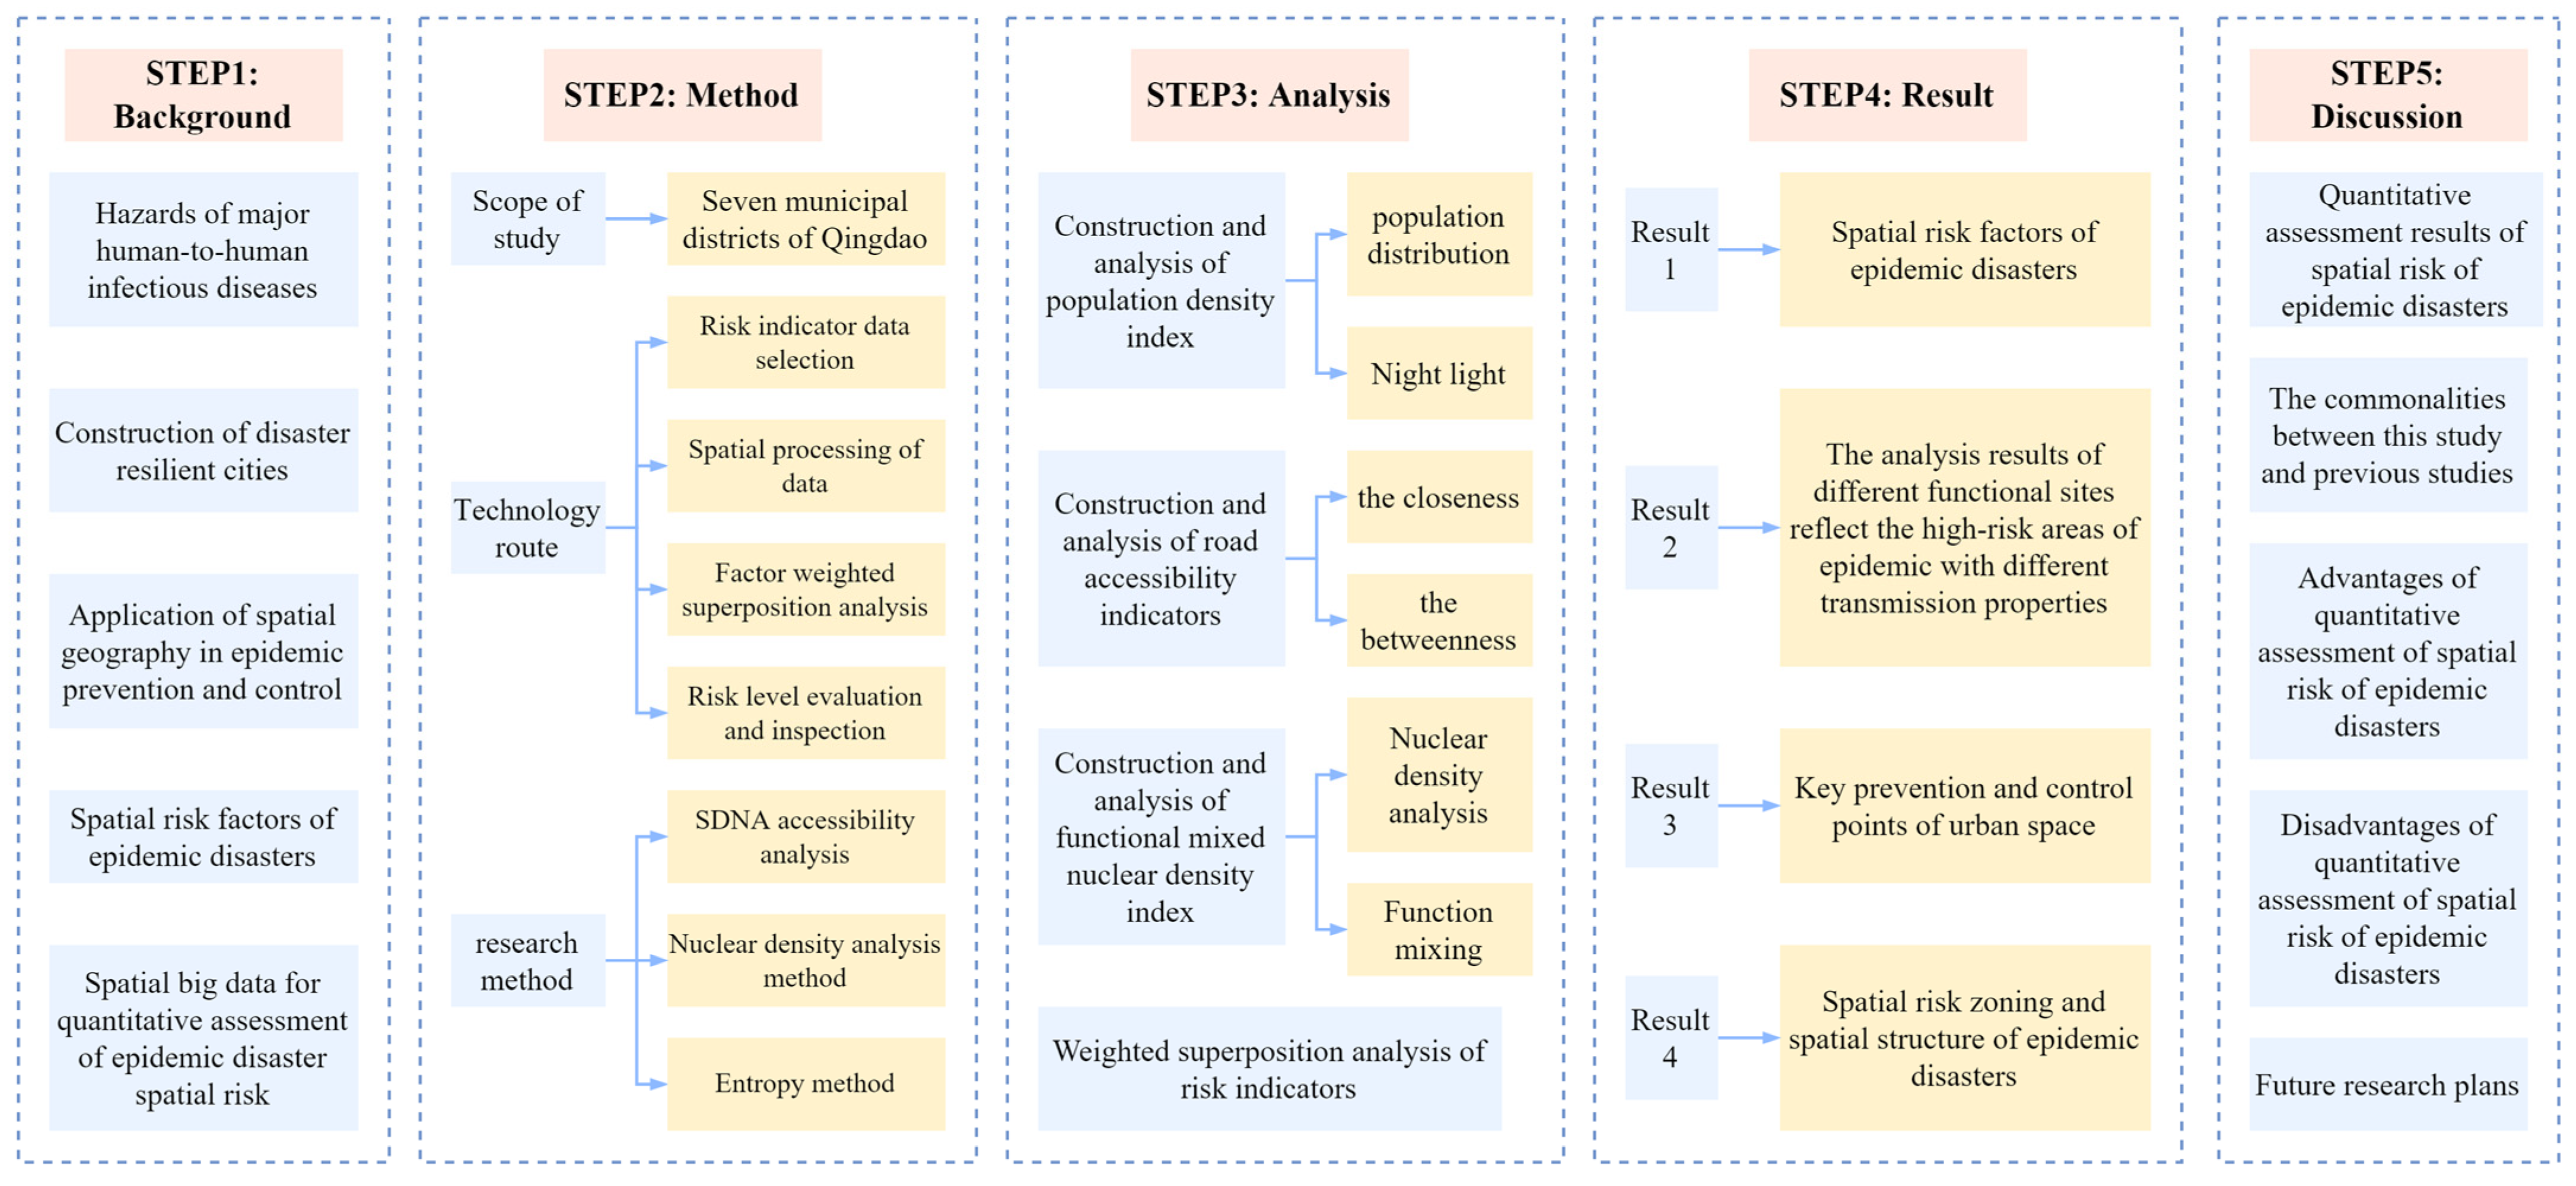
1. Introduction
2. Materials and Methods
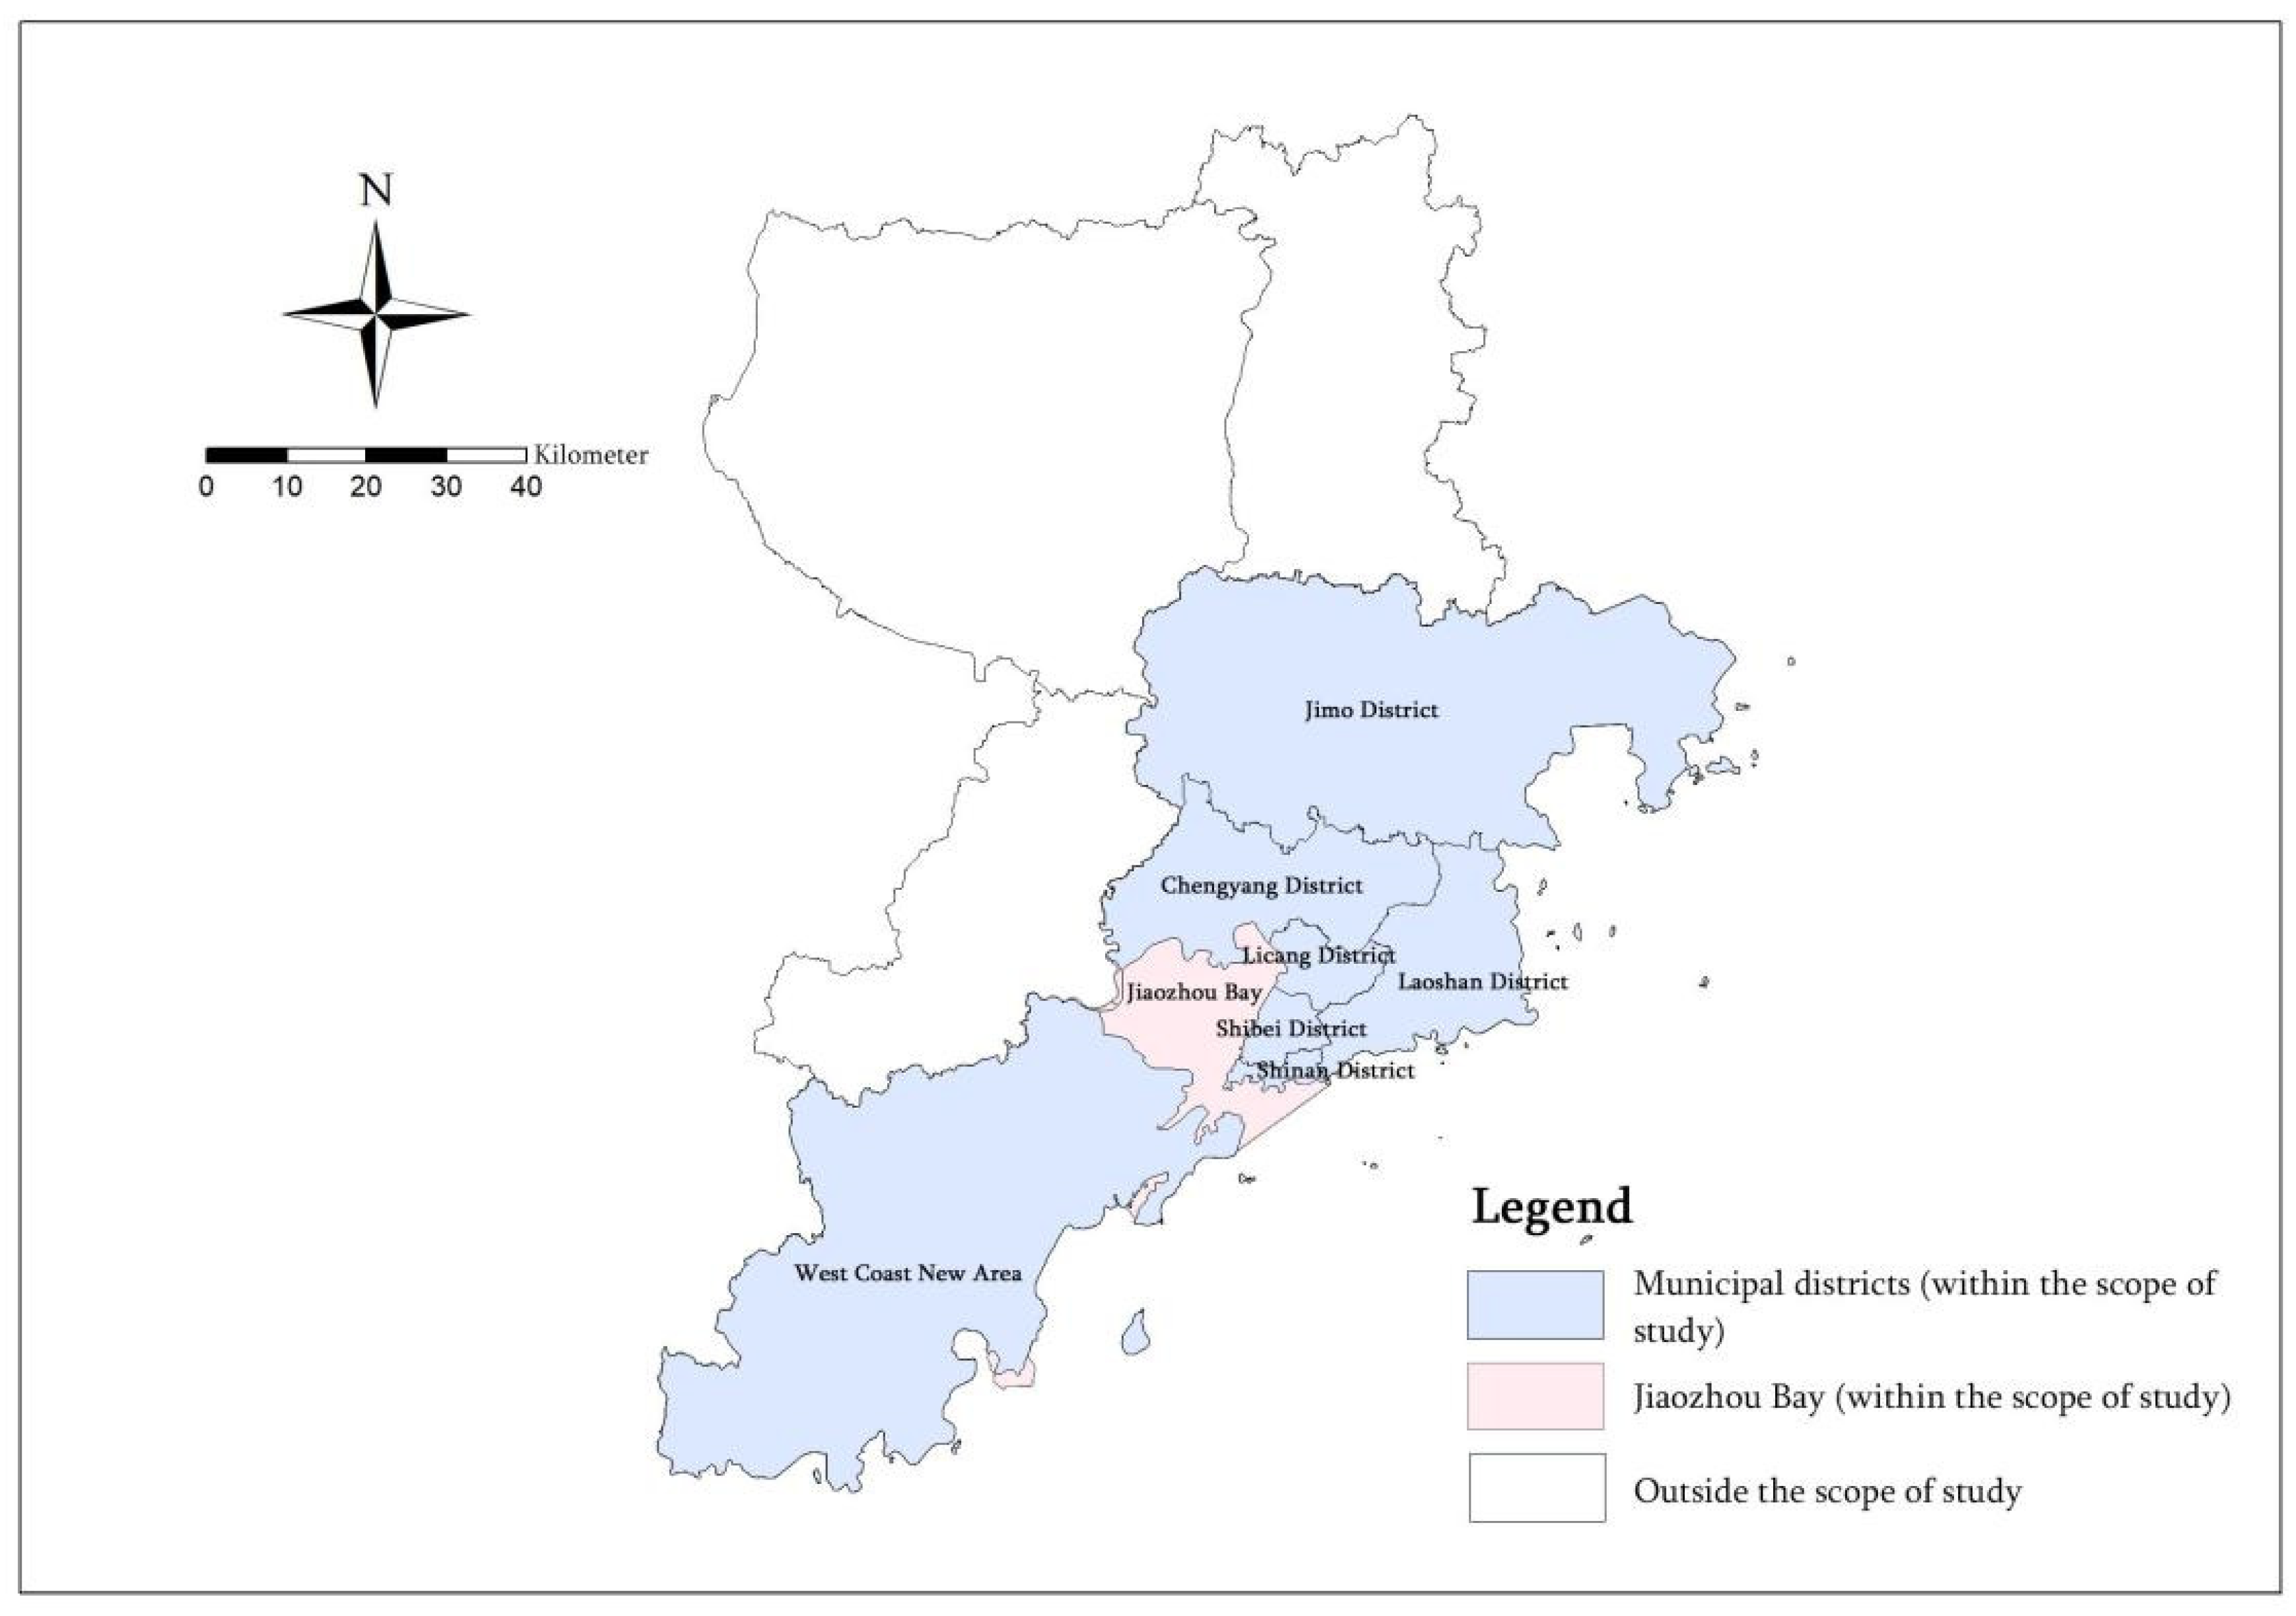
2.1. Research Scope
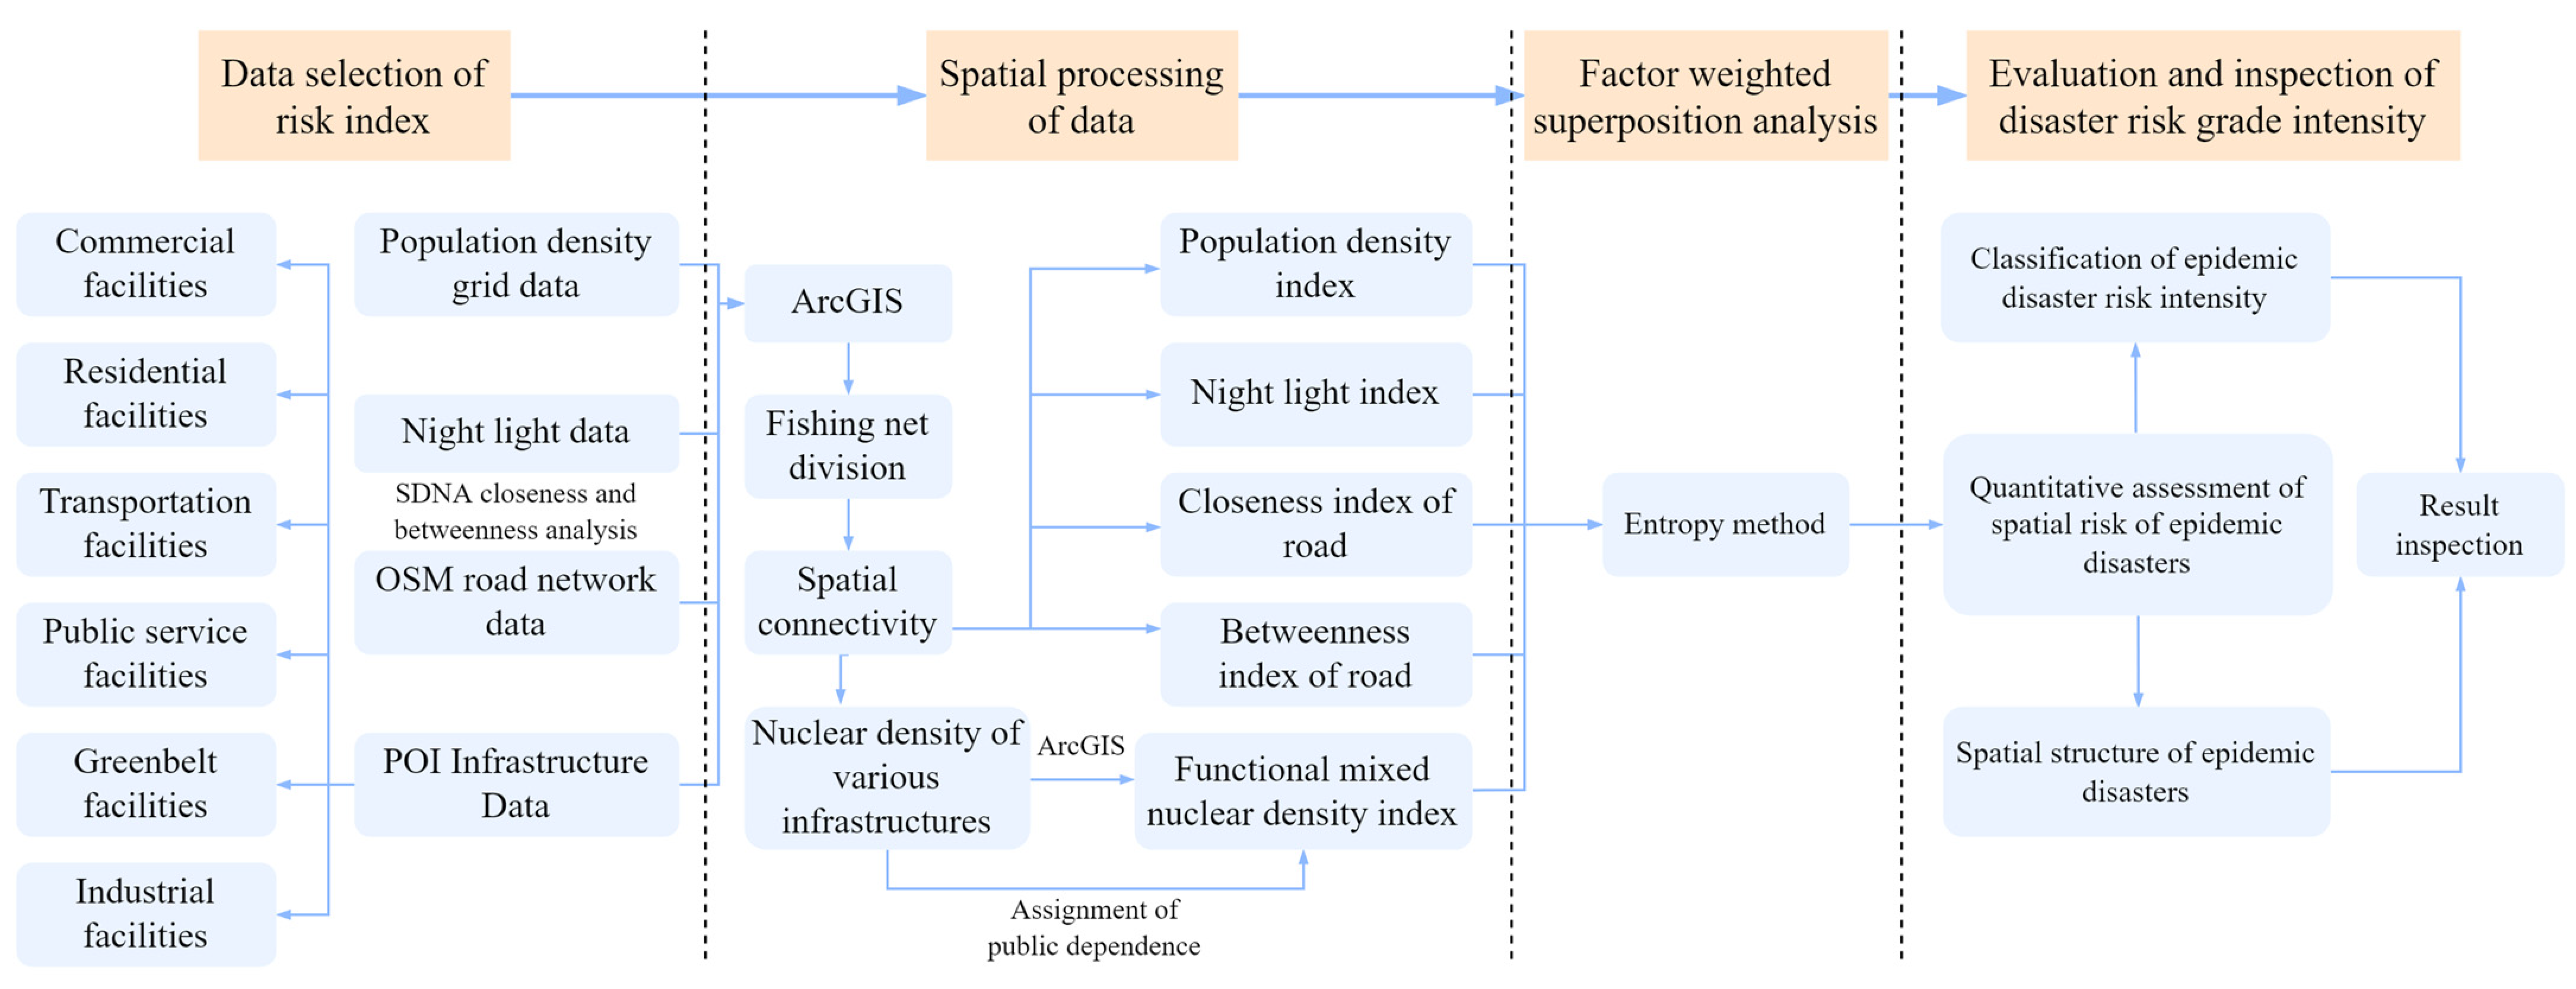
2.2. Technology Route
2.2.1. Data Selection of Risk Index
2.2.2. Application of Population Data in Identification of Epidemic Risk Areas
2.2.3. Spatial Processing of Data
2.2.4. Factor-Weighted Superposition Analysis
2.2.5. Evaluation and Inspection of Disaster Risk Grade Intensity
2.3. Research Method
2.3.1. SDNA Accessibility Analysis Method
2.3.2. Kernel Density Estimation Analysis
2.3.3. Entropy Methody
3. Results and Analysis
3.1. Construction and Analysis of Population Density Index and Night Light Index
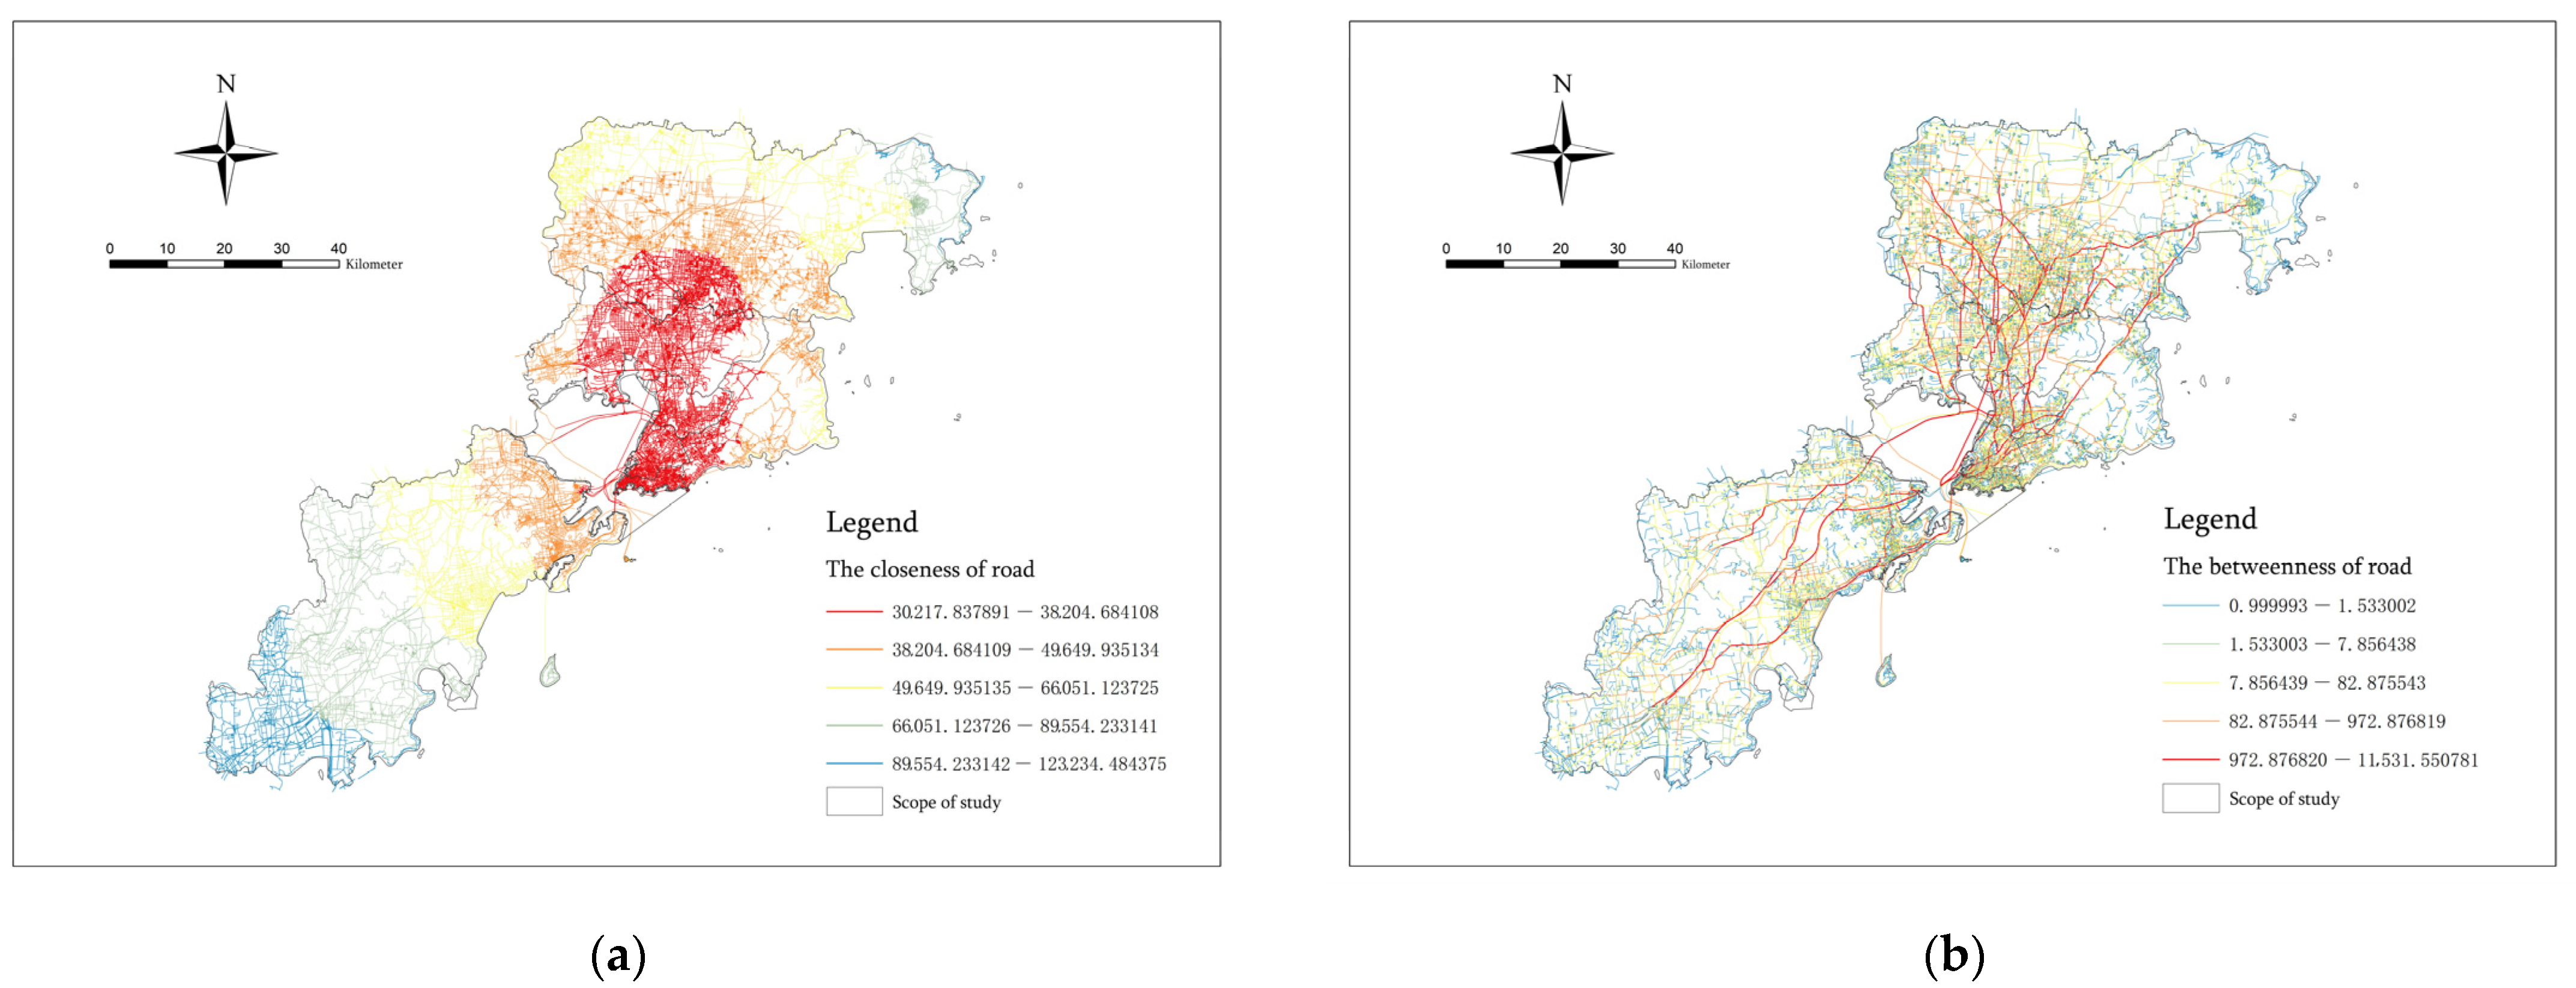
3.2. Construction and Analysis of Road Network Accessibility Indicators
3.3. Construction and Analysis of Functional Mixed Nuclear Density Index
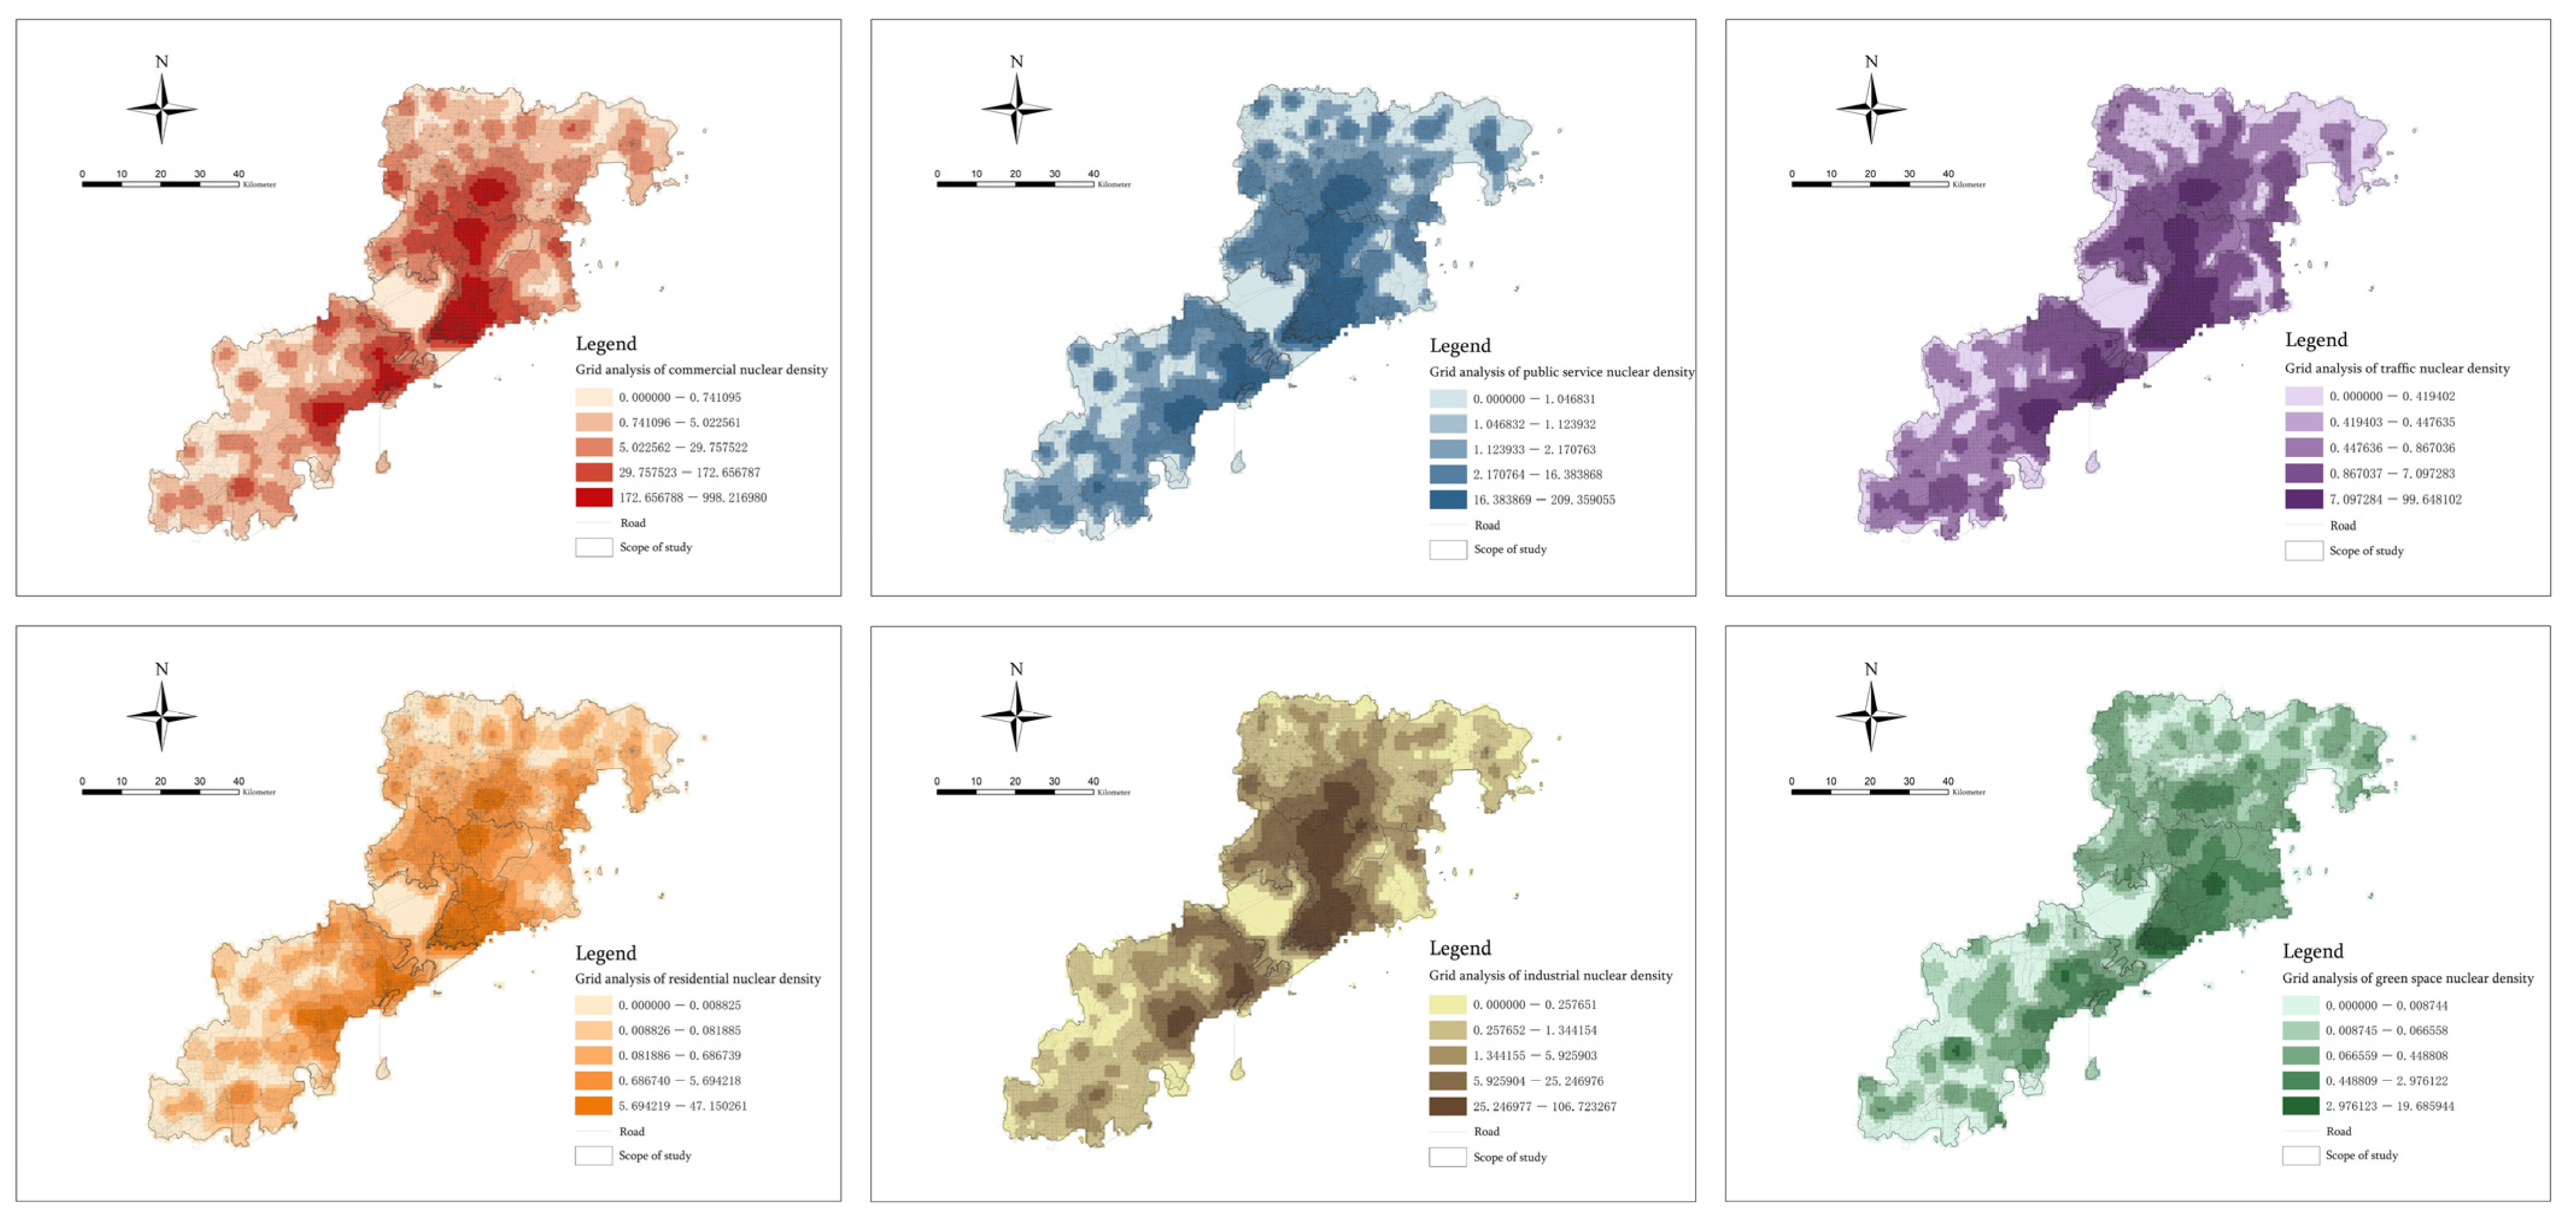
3.3.1. Classification and Analysis of Infrastructure Nuclear Density
3.3.2. Construction of Functional Mixed Nuclear Density Index
3.4. Weighted Superposition Analysis of Risk Indicators
3.5. Quantitative Assessment and Verification of Space Risk
4. Discussion
5. Conclusions
Author Contributions
Funding
Institutional Review Board Statement
Informed Consent Statement
Data Availability Statement
Conflicts of Interest
References
- Guo, T.Y. Research on the Synergistic Mechanism of Urban Basic Public Services’ Resilience to Disasters in the Context of Epidemic Prevention and Control. J. Yunnan Univ. Natl. (Philos. Soc. Sci. Ed.) 2022, 39, 96–103. [Google Scholar] [CrossRef]
- Jiang, H.; Guo, E.D.; Lin, X.C.; Liu, Z.; Lu, B.H.; Liu, A.W.; Zhang, Y. A Probe into the Risk Assessment Method of Earthquake Disasters in Urban Agglomerations: Taking the Greater Bay Area of Guangdong, Hong Kong and Macao as an Example. J. Seismol. 2022, 44, 868–880. [Google Scholar]
- Li, X.; Zhou, L.; Jia, T.; Liu, F.Y.; Zou, Y.L. Analysis of urban space risk factors under the “COVID-19” epidemic: A case study of Wuhan. China City Plan. Rev. 2021, 45, 78–86. [Google Scholar]
- Snow, J. On The Mode of Communication of Cholera, 2nd ed.; John Churchill: London, UK, 1855. [Google Scholar]
- Zheng, L.L.; Xu, D.Y.; Lou, Y. Cluster Analysis of incidence rate of Main Respiratory Infectious Diseases in China’s Provinces. J. Prev. Med. Inf. 2017, 33, 969–972. [Google Scholar]
- Li, W.H.; Qiu, X.Q. Research on the spatial spread and governance of urban epidemic based on social network: A case study of COVID-19 in Shenzhen. World Geogr. Res. 2022, 31, 637–648. [Google Scholar]
- Guo, L.; Peng, Y.Q.; He, H. Epidemic prevention risk prediction and prevention and control factors in large cities based on crowd activities: A case study of Wuhan. West. J. Hum. Settl. 2022, 37, 52–58. [Google Scholar] [CrossRef]
- Song, G. Epidemiological progresses of hemorrhagic fever with renal syndrome in China. Chin. Mwdical J. 1999, 112, 472–477. [Google Scholar]
- Li, X. Recognition of Zhengzhou urban multi-center spatial form based on influence sphere of gravity. Acta Geogr. Sin. 2022, 77, 1475–1489. [Google Scholar]
- Greene, K.L.; Tonjes, D.J. Quantitative assessments of municipal waste management systems: Using different indicators to compare and rank programs in New York State. Waste Manag. 2014, 34, 825–836. [Google Scholar] [CrossRef] [PubMed]
- Zheng, J.L. Multi-Scale Spatiotemporal Characteristics Analysis and Risk Factors of Infectious Diseases; Zhejiang University: Hangzhou, China, 2018. [Google Scholar]
- Yang, K.J.; Qiao, G.M.; Li, J.L.; Chen, H.L.; Xin, X.; Zhu, Y. Spatial diffusion characteristics and influencing factors of novel coronavirus epidemic in Zhejiang Province. J. Virol. 2021, 37, 10–18. [Google Scholar] [CrossRef]
- Hao, S.X. Study on The Risk Assessment System of Territorial Space Planning Based on Major Public Health Emergencies; Hebei Engineering University: Handan, China, 2022. [Google Scholar] [CrossRef]
- Xiang, Y. Risk assessment and spatial pattern analysis of major infectious diseases in China. Disaster Sci. 2021, 36, 35–40. [Google Scholar]
- Huang, X.H.; Fu, Y.C.; Zhang, J.Y.; Yang, J.; Hong, J.Z. The Early Spatiotemporal Diffusion Characteristics of COVID-19 Epidemic and the Risk of Public Space in Guangzhou. Trop. Geomorphol. 2020, 41, 8–17. [Google Scholar]
- Li, W.T. Study on the Spatiotemporal Pattern Evolution and Atmospheric Environmental Risk Factors of Tuberculosis in China from 2004 to 2017; Hunan Normal University: Changsha, China, 2021. [Google Scholar] [CrossRef]
- Sun, J.; Wang, H.; Song, Z.L.; Lu, J.B.; Meng, P.Y.; Qin, S.H. Mapping Essential Urban Land Use Categories in Nanjing by Integrating Multi-Source Big Data. Remote Sens. 2020, 12, 2386. [Google Scholar] [CrossRef]
- Inostroza, L. The new science of cities. Eure-Rev. Latinoam. De Estud. Urbano Reg. 2015, 41, 279–283. [Google Scholar]
- Zhao, L.; Liu, H. Assessment of tourism system’s ecological disaster risk based on fuzzy matter-element model. J. Arid. Land Resour. Environ. 2010, 24, 185–190. [Google Scholar]
- Hong, B.; Chen, J.X.; Wang, L.S.; Yu, R.S. Analysis and prediction of the spread trend of COVID-19 based on SEIR-LSTM mixed mode. J. Xiamen Univ. Nat. Sci. 2020, 59, 1034–1040. [Google Scholar]
- Ma, Q.; Wang, L.X.; Gong, X.; Li, K. Research on the Rationality of Public Toilet Space Layout Based on POI Data from the Perspective of Urban Functional Area. J. Earth Inf. Sci. 2022, 24, 50–62. [Google Scholar]
- Sun, Y.; Liu, X.; Su, Y.C.; Xu, S.; Ji, B.; Zhang, Z.J. Estimation of urbanization level at county level in anhui province based on night light data. J. Earth Inf. Sci. 2020, 22, 1837–1847. [Google Scholar]
- Gu, H.; Zuo, J.T. Quantitative evaluation of the vitality of the material carrier of the cultural catalyst of the village in the city and research on the influencing factors. Settlements 2022, 2, 129–135. [Google Scholar]
- Ye, Y.; Richards, D.; Lu, Y.; Song, X.P.; Zhuang, Y.; Zeng, W.; Zhong, T. Measuring daily accessed street greenery: A human-scale approach for informing better urban planning practices. Landsc. Urban Plan. 2019, 191, 103434. [Google Scholar] [CrossRef]
- Huang, X.; Xie, C.; Fang, X.; Zhang, L.P. Combining Pixel- and Object-Based Machine Learning for Identification of Water-Body Types From Urban High-Resolution Remote-Sensing Imagery. IEEE J. Sel. Top. Appl. Earth Obs. Remote Sens. 2015, 8, 2097–2110. [Google Scholar] [CrossRef]
- Liu, J.H.; Zhang, J.W.; Jia, K. Boundary Identification and Spatial Pattern Optimization of Central Urban Area Based on POI Data: A Case Study of Gaotang County. Res. Urban Dev. 2021, 28, 74–83. [Google Scholar]
- Liu, B.H.; Deng, Y.B.; Li, M.; Yang, J.; Liu, T. Classification Schemes and Identification Methods for Urban Functional Zone: A Review of Recent Papers. Appl. Sci.-Basel 2021, 11, 9968. [Google Scholar] [CrossRef]
- Zhang, J.Y.; Yuan, Y.; Zhou, M.H.; Yang, Y.; Zhu, L.Y. Research on Fine Recognition and Distribution Characteristics of Street Types Based on POI: A Case Study of Fuzho’u City. J. Xi’an Univ. Archit. Technol. (Nat. Sci. Ed.) 2022, 54, 406–413. [Google Scholar] [CrossRef]
- Wang, T.T.; Ren, J.J.; Yang, D.H.; Xiao, K.; Sun, L. Research on urban development level based on spatial form and population agglomeration. Sci. Surv. Mapp. 2022, 47, 219–226. [Google Scholar]
- Zhang, Y.Z.; Bambrick, H.; Mengersen, K.; Tong, S.L.; Feng, L.; Zhang, L.; Liu, G.F.; Xu, A.Q.; Hu, W.B. Using big data to predict pertussis infections in Jinan city, China: A time series analysis. Int. J. Biometeorol. 2020, 64, 95–104. [Google Scholar] [CrossRef] [PubMed]
- Zhang, L.Z.; Qiang, D. Empirical analysis of spatial network based on the integration model of subway passenger volume and urban traffic: Taking Shanghai as an example. Resid. Technol. 2021, 41, 16–20. [Google Scholar]
- Wu, J.W. A Study on the Walkability of Historic Waterfront Districts Based on Spatial Network Analysis. City Build. 2022, 19, 12–17. [Google Scholar] [CrossRef]
- Liang, L.F.; Zeng, W.X.; Song, Y.X.; Shao, Z.F.; Liu, X.J. Urban comprehensive vitality evaluation and influencing factors considering crowd concentration and emotional intensity. J. Earth Inf. Sci. 2022, 24, 1854–1866. [Google Scholar]
- Gu, H.Y.; Shen, T.Y.; Zhou, L.; Chen, H.L.; Xiao, F. Spatial and Temporal Analysis of the Influence of Guangzhou Road Network Form on Housing Price Based on GWR and sDNA Model. Econ. Geogr. 2018, 38, 82–91. [Google Scholar] [CrossRef]
- Sheng, Q.; Cui, S. Study on the distribution of people flow in commercial complexes before and after epidemic control: Taking Taikouli, Sanlitun, Beijing as an example. New Build. 2022, 3, 9–14. [Google Scholar]
- Yu, W.H.; Ai, T.H. The visualization and analysis of POI features under network space supported by kernel density estimation. Acta Geod. Et Cartogr. Sin. 2015, 44, 82–90. [Google Scholar]
- Cheng, C.; Yang, H.Q.; King, I.; Lyu, M.R. A unified point-of-interest recommendation framework in location-based social networks. ACM Trans. Intell. Syst. Technol. 2016, 8, 10. [Google Scholar] [CrossRef]
- Cao, Y.W.; Liu, Y.; Zhou, C.S. Spatial and temporal diffusion characteristics and influencing factors of COVID-19 from the perspective of urban agglomeration. Reg. Res. Dev. 2021, 40, 1–7. [Google Scholar]
- Wu, Q.Q.; Qian, L.X.; Wu, Z.F. Research on spatial structure identification and spatial form of megacities based on multi-source data. Geogr. Inf. World 2020, 27, 32–38. [Google Scholar]
- Zhai, Q.; Li, M.; Jiang, W.X. Analysis of the spatio-temporal characteristics of urban spatial vitality based on multi-source data: A case study of Hexi and Xianlin New Town in Nanjing. Resour. Dev. Mark. 2021, 37, 153–160. [Google Scholar]
- Yao, S.Y. Analysis and Application of Crime Hotspot Data Based On Space-Time Characteristics; Hubei University of Technology: Wuhan, China, 2020. [Google Scholar] [CrossRef]
- Le Boedec, K. Reference interval estimation of small sample sizes: A methodologic comparison using a computer-simulation study. Vet. Clin. Pathol. 2019, 48, 335–346. [Google Scholar] [CrossRef] [PubMed]
- Zhang, W.J.; Zibibla, S. Spatial pattern and driving force of new urbanization in northern xinjiang. J. Northwest Norm. Univ. (Nat. Sci. Ed.) 2020, 56, 125–134. [Google Scholar] [CrossRef]
- Zhou, C.H.; Su, F.Z.; Pei, T. COVID-19: Challenges to GIS with Big Data. Geogr. Sustain. 2020, 1, 77–87. [Google Scholar] [CrossRef]
- Shen, T.; Li, F.X.; Chen, Z.J. Urban vitality evaluation and spatial correlation analysis based on multi-source data. Resour. Environ. Yangtze River Val. 2022, 31, 1006–1015. [Google Scholar]
- Mao, Z.R.; Chen, X.K.; Xiang, Z.H.; Chen, Y.R. Research on the Measurement and Influencing Factors of Street Vigour in Historic Districts: A Case Study of Wenming Street Historic District in Kunming. South Archit. 2021, 4, 54–61. [Google Scholar]
- Chen, Q.; Yan, Y.B.; Zhang, X.; Chen, J. A Study on the Impact of Built Environment Elements on Satisfaction with Residency Whilst Considering Spatial Heterogeneity. Sustainability 2022, 14, 15011. [Google Scholar] [CrossRef]
- Li, Y.Q.; Yabuki, N.; Fukuda, T. Integrating GIS, deep learning, and environmental sensors for multicriteria evaluation of urban street walkability. Landsc. Urban Plan. 2023, 230, 104603. [Google Scholar] [CrossRef]
- Dong, Q.; Qu, S.X.; Qin, J.H.; Yi, D.S.; Liu, Y.S.; Zhang, J. A Method to Identify Urban Fringe Area Based on the Industry Density of POI. ISPRS Int. J. Geo-Inf. 2022, 11, 128. [Google Scholar] [CrossRef]
- Sun, M.; Meng, Q.X. Using spatial syntax and GIS to identify spatial heterogeneity in the main urban area of Harbin, China. Front. Earth Sci. 2022, 10, 893414. [Google Scholar] [CrossRef]
- Hu, Q.S.; Li, R.; Wu, H.Y.; Liu, Z.H. Construction of a refined population analysis unit based on urban forms and population aggregation patterns. Int. J. Digit. Earth 2022, 15, 79–107. [Google Scholar] [CrossRef]
- Yang, J.Y.; Shao, D.; Wang, Q.; Zhang, Y.H. Exploration on a method for precision identification of urban land use type using artificial intelligence: Based on big data of building forms and business POI data. City Plan. Rev. 2021, 45, 46–56. [Google Scholar]
- Chen, X.; Li, X.M.; Zhan, R.; Xu, W.M. Research on the Method of Extracting Multilevel Landmarks from Urban Interest Points. Surv. Mapp. Spat. Geogr. Inf. 2015, 38, 129–132+136. [Google Scholar]
- Zhao, W.; Li, Q.; Li, B. Extracting Hierarchical Landmarks from Urban POI Data. J. Remote Sens. 2011, 15, 973–988. [Google Scholar]
- Li, X. Recognition of Urban Polycentric Structure Based on Spatial Aggregation Characteristics of POI Elements: A Case of Zhengzhou City. Acta Sci. Nat. Univ. Pekin. 2020, 56, 692–702. [Google Scholar] [CrossRef]
- Liu, Z. Quantitative Evaluation Model of Balanced Development at Two Sides of an Urban Waterfront Area. South Archit. 2021, 6, 22–31. [Google Scholar]
- Kang, C.G.; Fan, D.W.; Jiao, H.Z. Validating activity, time, and space diversity as essential components of urban vitality. Environ. Plan. B-Urban Anal. City Sci. 2021, 48, 1180–1197. [Google Scholar] [CrossRef]
- Wang, T.W.; Li, Y.; Li, H.D.; Chen, S.J.; Li, H.K.; Zhang, Y.X. Research on the Vitality Evaluation of Parks and Squares in Medium-Sized Chinese Cities from the Perspective of Urban Functional Areas. Int. J. Environ. Res. Public Health 2022, 19, 15238. [Google Scholar] [CrossRef] [PubMed]
- Lu, S.W.; Huang, Y.P.; Zhao, Z.F. Relationships between Urban Form and Neighborhood Vibrancy in Main Urban Area of Chengdu City. Areal Res. Dev. 2021, 40, 73–77. [Google Scholar]
- Sun, M.; Ren, Q.M. A new method to explore the abnormal space of urban hidden dangers under epidemic outbreak and its prevention and control: A case study of Jinan City. Open Geosci. 2022, 14, 1356–1379. [Google Scholar] [CrossRef]
- He, X.; Cao, Y.W.; Zhou, C.S. Evaluation of Polycentric Spatial Structure in the Urban Agglomeration of the Pearl River Delta (PRD) Based on Multi-Source Big Data Fusion. Remote Sens. 2021, 13, 3639. [Google Scholar] [CrossRef]
- Cao, Z.D.; Wang, J.F.; Gao, Y.G.; Han, W.G.; Feng, X.L.; Zeng, G. Spatial risk factors and spatial correlation characteristics of SARS epidemic in Guangzhou. J. Geogr. 2008, 9, 981–993. [Google Scholar]
- Wang, J.F.; Meng, B.; Zheng, X.Y.; Liu, J.Y.; Han, W.G.; Wu, J.L.; Liu, X.H.; Li, X.W.; Song, X.M. Multi-dimensional distribution of SARS epidemic in Beijing in 2003 and analysis of its influencing factors. Chin. J. Epidemiol. 2005, 3, 16–20. [Google Scholar]
- Li, M.F.; Shi, X.; Li, X.; Ma, W.J.; He, J.F.; Liu, T. Epidemic forest: A spatiotemporal model for communicable disease. Ann. Am. Assoc. Geogr. 2019, 109, 812–836. [Google Scholar] [CrossRef]
- She, K.L.; Li, C.Y.; Qi, C.; Liu, T.X.; Jia, Y.; Zhu, Y.C.; Liu, L.L.; Wang, Z.Q.; Zhang, Y.; Li, X.J. Epidemiological Characteristics and Regional Risk Prediction of Hemorrhagic Fever with Renal Syndrome in Shandong Province, China. Int. J. Environ. Res. Public Health 2021, 18, 8495. [Google Scholar] [CrossRef]
- Sun, M.; Jiao, X.Y. Identification of spaces with cluster infection risks in small cities in China based on spatial syntax and GIS. J. Comput. Methods Sci. Eng. 2022, 22, 1081–1097. [Google Scholar] [CrossRef]
- Moghadas, S.M.; Shoukat, A.; Fitzpatrick, M.C.; Wells, C.R.; Sah, P.; Pandey, A.; Sachs, J.D.; Wang, Z.; Meyers, L.A.; Singer, B.H. Projecting Hospital Utilization During the COVID-19 Outbreaks in the United States. Proc. Natl. Acad. Sci. USA 2020, 117, 9122–9126. [Google Scholar] [CrossRef] [PubMed]


| Dimensions | Index (Risk Factors) | Indicator Characteristics | Data Sources | |
|---|---|---|---|---|
| Social activity dimension | Population density index | Daily crowd activity density | Woldpop dataset | |
| Night light index | Night population distribution density | DMSP-OLS dataset | ||
| Physical space dimension | Closeness index of roads | Regional access to central section | OSM open-source network map platform | |
| Betweenness index of roads | Traffic flow potential | |||
| Functional mixed nuclear density index | Commercial facilities | Agglomeration density after mixed functions of various infrastructures | Gaode, Baidu POI crawling | |
| Public service facilities | ||||
| Traffic facilities | ||||
| Green space facilities | ||||
| Residential facilities | ||||
| Industrial facilities | ||||
| Major Categories | Subcategory | POI Quantity | Total POI | Percent % |
|---|---|---|---|---|
| Commercial function | Catering service | 54,304 | 231,128 | 65.4% |
| Shopping service | 92,448 | |||
| Accommodation service | 12,364 | |||
| Living service | 68,669 | |||
| Leisure and Entertainment | 3343 | |||
| Residential function | Business residence | 9250 | 9250 | 2.6% |
| Public service function | Medical care | 14,439 | 51,439 | 14.6% |
| Education and Culture | 17,474 | |||
| Government agencies | 15,507 | |||
| Athletic sports | 4019 | |||
| Traffic function | Transportation facilities | 21,379 | 21,379 | 6% |
| Green space function | Scenic spots | 2007 | 2007 | 0.7% |
| Industrial function | Companies | 37,940 | 37,940 | 10.7% |
| Area | Chengyang District | Shibei District | Shinan District | West Coast New Area | Licang District | Laoshan District | Jimo District | Total |
|---|---|---|---|---|---|---|---|---|
| Quantity | 36 | 38 | 39 | 4 | 32 | 5 | 0 | 154 |
| Major Categories | Subcategory | Mean Value | Standard Deviation | Public Dependence | Weight |
|---|---|---|---|---|---|
| Commercial function | Catering service | 4.588 | 0.707 | 0.794 | 0.175 |
| Shopping service | 4.784 | 0.518 | 0.892 | ||
| Accommodation service | 3.814 | 1.164 | 0.407 | ||
| Living service | 4.270 | 1.003 | 0.635 | ||
| Leisure and Entertainment | 3.574 | 1.271 | 0.287 | ||
| Residential function | Business residence | 3.191 | 1.082 | 0.096 | 0.130 |
| Public service function | Medical care | 4.221 | 0.918 | 0.610 | 0.165 |
| Education and Culture | 4.368 | 0.748 | 0.684 | ||
| Government agencies | 4.093 | 0.960 | 0.547 | ||
| Athletic sports | 3.240 | 1.143 | 0.120 | ||
| Traffic function | Transportation facilities | 4.961 | 0.195 | 1.000 | 0.200 |
| Green space function | Scenic spots | 4.064 | 0.983 | 0.532 | 0.167 |
| Industrial functions | Companies | 3.951 | 1.026 | 0.475 | 0.162 |
| Indicators | Population Density Index | Night Light Index | Closeness Index of Roads | Betweenness Index of Roads | Functional Mixed Nuclear Density Index |
|---|---|---|---|---|---|
| Weights | 0.273 | 0.131 | 0.001 | 0.358 | 0.237 |
| Area | Shinan District | Shibei District | Licang District | Chengyang District | West Coast New District | Laoshan District | Jimo District | Whole Area |
|---|---|---|---|---|---|---|---|---|
| Level I risk area | 34 | 34 | 20 | 26 | 3 | 4 | 0 | 121 |
| Level II risk area | 5 | 4 | 12 | 10 | 1 | 1 | 0 | 33 |
Disclaimer/Publisher’s Note: The statements, opinions and data contained in all publications are solely those of the individual author(s) and contributor(s) and not of MDPI and/or the editor(s). MDPI and/or the editor(s) disclaim responsibility for any injury to people or property resulting from any ideas, methods, instructions or products referred to in the content. |
© 2023 by the authors. Licensee MDPI, Basel, Switzerland. This article is an open access article distributed under the terms and conditions of the Creative Commons Attribution (CC BY) license (https://creativecommons.org/licenses/by/4.0/).
Share and Cite
Ren, Q.; Sun, M. Exploring the Quantitative Assessment of Spatial Risk in Response to Major Epidemic Disasters in Megacities: A Case Study of Qingdao. Int. J. Environ. Res. Public Health 2023, 20, 3274. https://doi.org/10.3390/ijerph20043274
Ren Q, Sun M. Exploring the Quantitative Assessment of Spatial Risk in Response to Major Epidemic Disasters in Megacities: A Case Study of Qingdao. International Journal of Environmental Research and Public Health. 2023; 20(4):3274. https://doi.org/10.3390/ijerph20043274
Chicago/Turabian StyleRen, Qimeng, and Ming Sun. 2023. "Exploring the Quantitative Assessment of Spatial Risk in Response to Major Epidemic Disasters in Megacities: A Case Study of Qingdao" International Journal of Environmental Research and Public Health 20, no. 4: 3274. https://doi.org/10.3390/ijerph20043274
APA StyleRen, Q., & Sun, M. (2023). Exploring the Quantitative Assessment of Spatial Risk in Response to Major Epidemic Disasters in Megacities: A Case Study of Qingdao. International Journal of Environmental Research and Public Health, 20(4), 3274. https://doi.org/10.3390/ijerph20043274