
The Application of Hyperspectral Imaging to the Measurement of Pressure Injury Area


Abstract
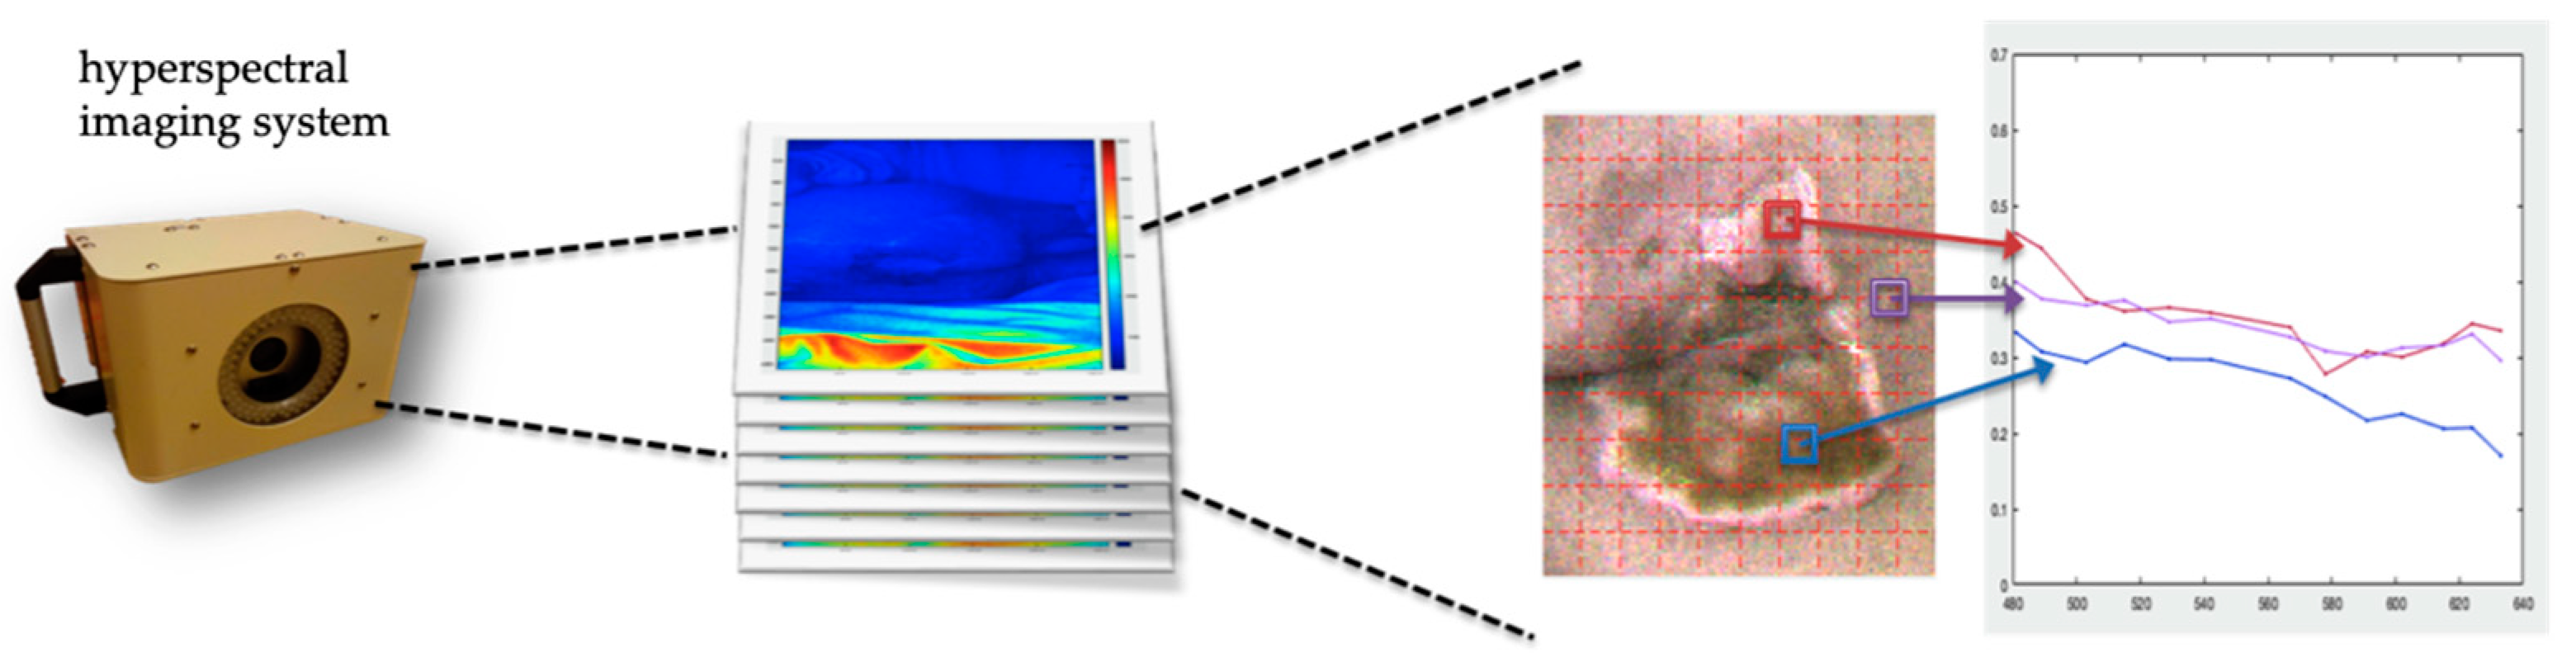
:1. Introduction
2. Method
2.1. Research Design
2.2. Measurements
2.3. Data Collection
2.4. Statistics and Data Analysis
2.5. Ethical Considerations
3. Results
3.1. Demographic Data of Patients
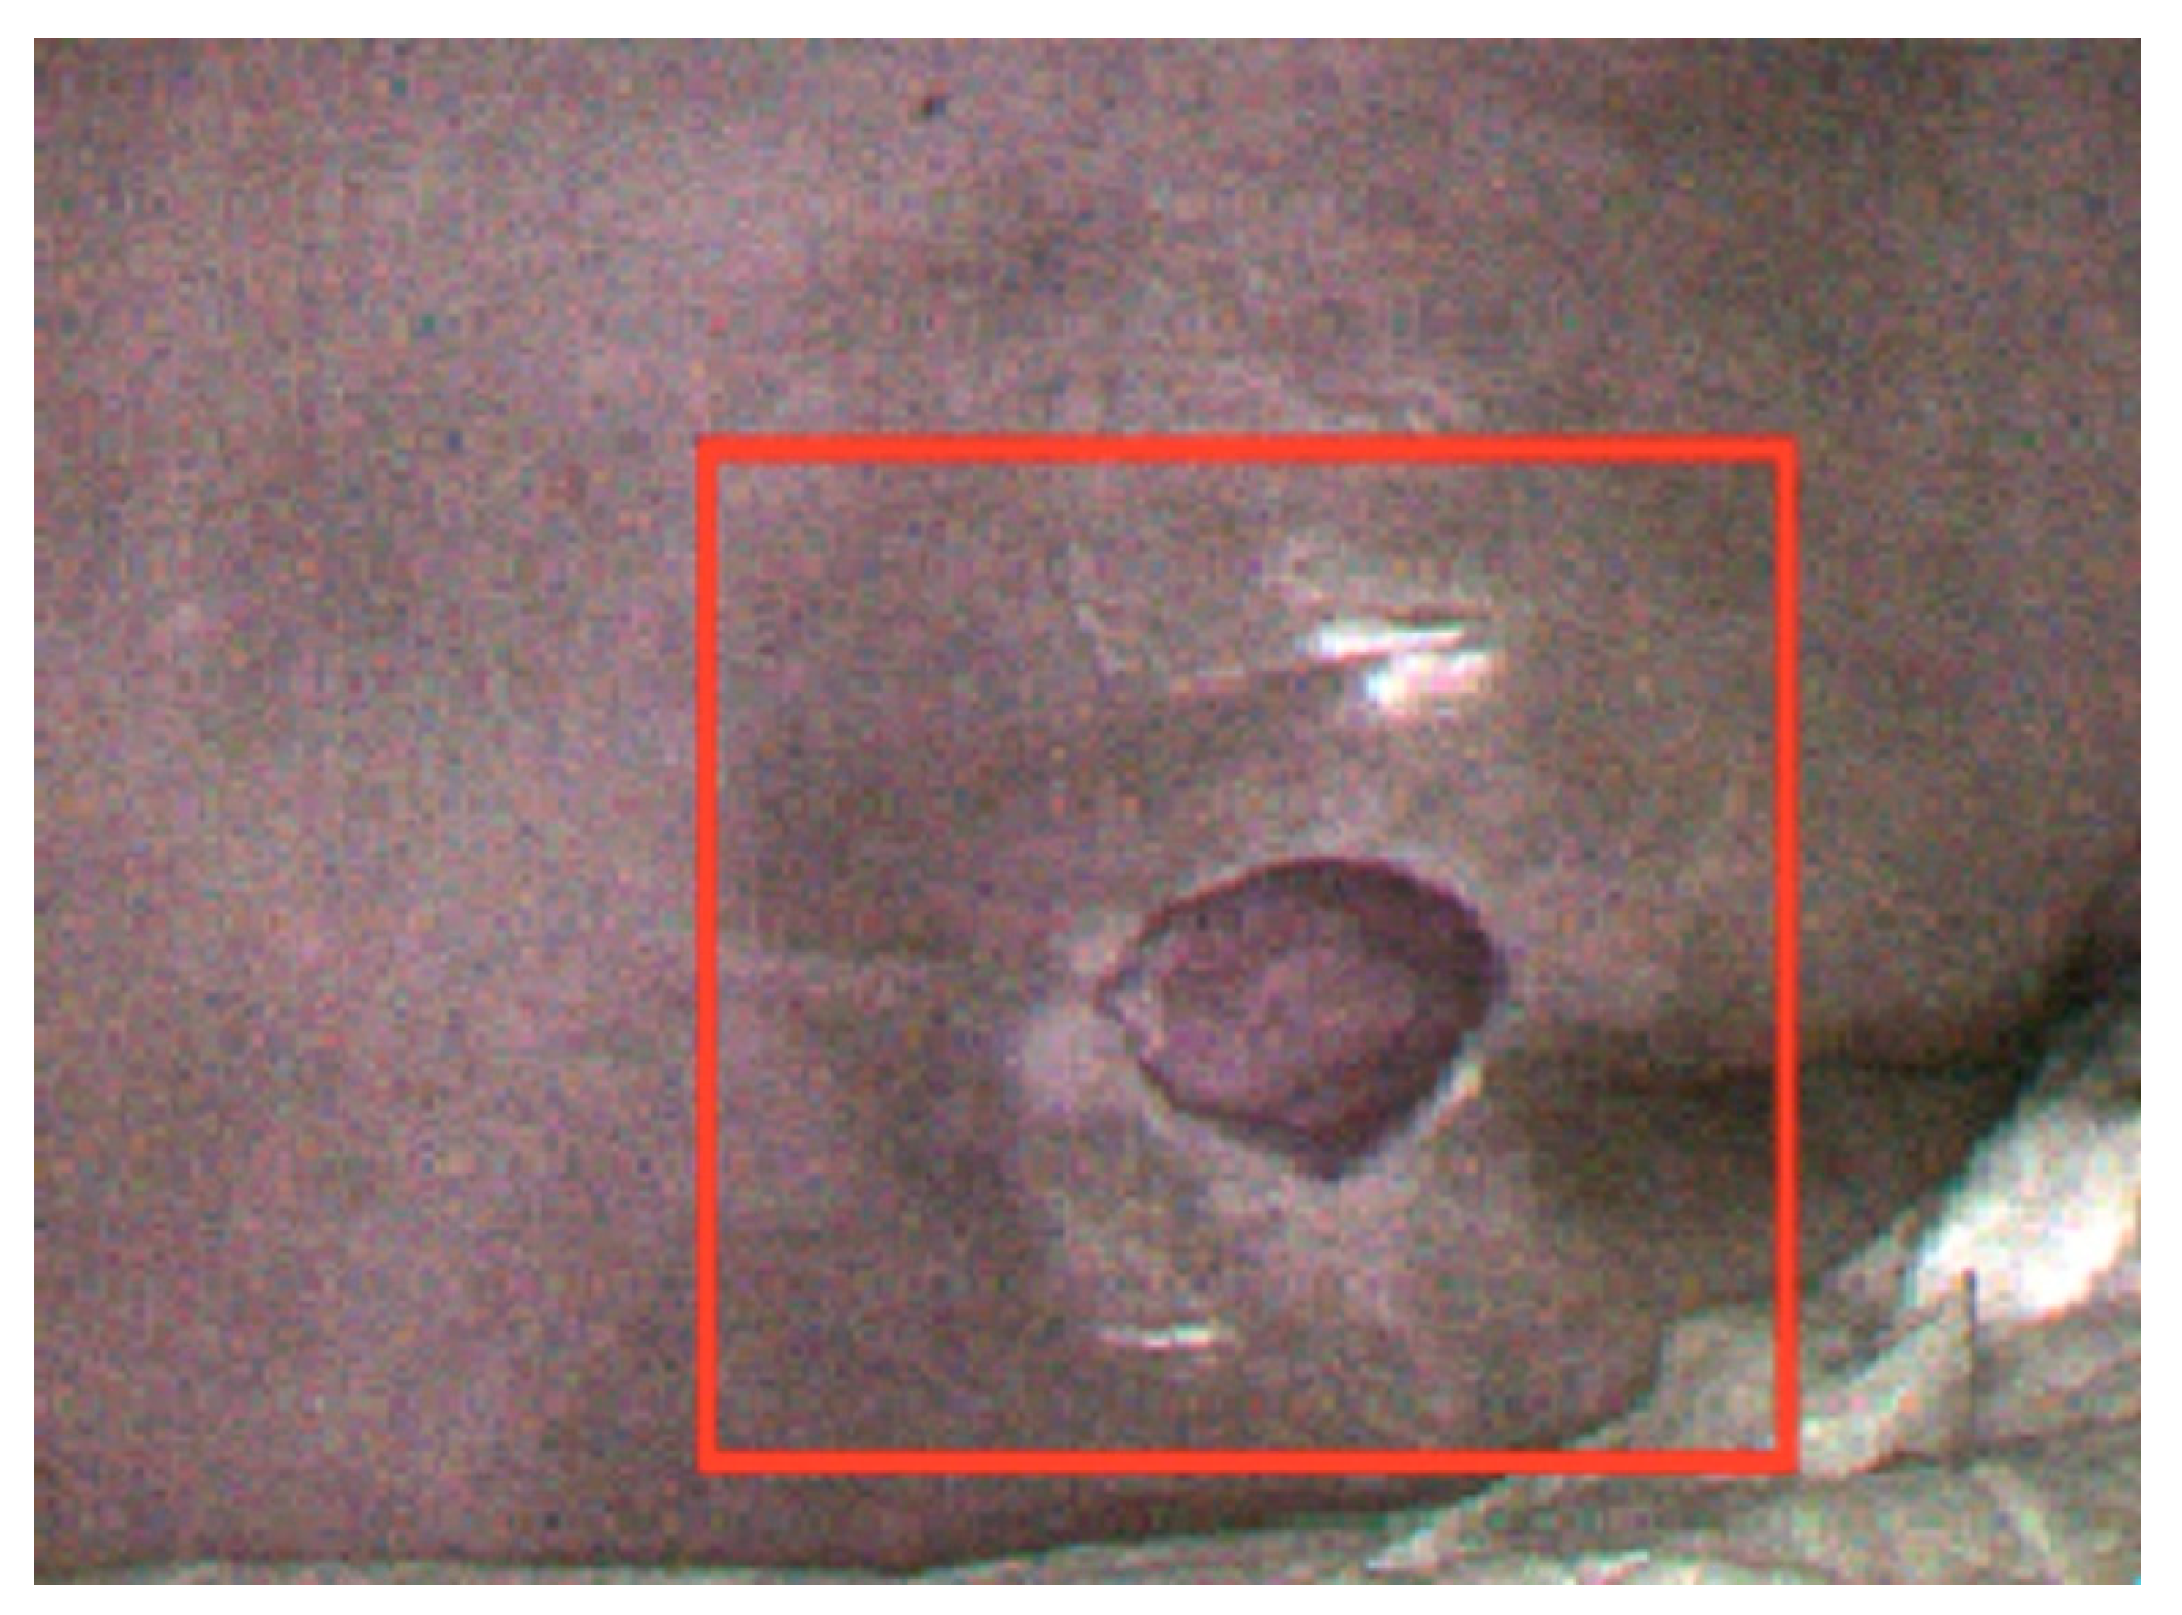
3.2. Hyperspectral Image Data
3.3. Comparison of Related Statistical Parameters of Various Wound Area Methods
3.4. Difference in Measurement Time for Pressure Injury Assessment
4. Discussion
5. Limitations
6. Conclusions
Author Contributions
Funding
Institutional Review Board Statement
Informed Consent Statement
Data Availability Statement
Acknowledgments
Conflicts of Interest
References
- Berlowitz, D.; Berman, R.S.; Cochran, A. Epidemiology, Pathogenesis, and Risk Assessment of Pressure-Induced Skin and Soft Tissue Injury. UpToDate 2019. Available online: https://www.medilib.ir/uptodate/show/2884 (accessed on 18 April 2022).
- Chen, C.W.; Fu, P.I.; Chai, L.P.; Chen, T.H. Reducing pressure injuries incidence of patients in respiratory care wards (RCW). Leadersh. Nurs. 2022, 23, 150–165. [Google Scholar]
- Liu, Y.; Wu, X.; Ma, Y.; Li, Z.; Cao, J.; Jiao, J.; Liu, G.; Li, F.; Song, B.; Jin, J.; et al. The prevalence, incidence, and associated factors of pressure injuries among immobile inpatients: A multicentre, cross-sectional, exploratory descriptive study in China. Int. Wound J. 2019, 16, 459–466. [Google Scholar] [CrossRef] [PubMed]
- Saghaleini, S.H.; Dehghan, K.; Shadvar, K.; Sanaie, S.; Mahmoodpoor, A.; Ostadi, Z. Pressure ulcer and nutrition. Indian J. Crit. Care Med. 2018, 22, 283–289. [Google Scholar] [CrossRef] [PubMed]
- Yu, B.R.; Hou, Y.J.; Chai, X.Z.; Chai, X.M.; Chang, M.J.; Huang, J.G. The New Concepts Wound Care, 3rd ed.; Huaxing: Taipei City, Taiwan, 2017; pp. 252–285. [Google Scholar]
- Xu, S.X.; Yang, R.S. Clinical Wound Medicine; Lida: Taipei City, Taiwan, 2010. [Google Scholar]
- Doughty, D.B. Wound Assessment: Tips and Techniques. Adv. Ski. Wound Care 2004, 17, 369–372. [Google Scholar] [CrossRef] [PubMed]
- Chiang, N.; Rodda, O.A.; Kang, A.; Sleigh, J.; Vasudevan, T. Clinical Evaluation of Portable Wound Volumetric Measurement Devices. Adv. Ski. Wound Care 2018, 31, 374–380. [Google Scholar] [CrossRef] [PubMed]
- Langemo, D.; Spahn, J.; Spahn, T.; Pinnamaneni, V.C. Comparison of Standardized Clinical Evaluation of Wounds Using Ruler Length by Width and Scout Length by Width Measure and Scout Perimeter Trace. Adv. Ski. Wound Care 2015, 28, 116–121. [Google Scholar] [CrossRef] [PubMed]
- Nouvong, A.; Hoogwerf, B.; Mohler, E.; Davis, B.; Tajaddini, A.; Medenilla, E. Evaluation of Diabetic Foot Ulcer Healing With Hyperspectral Imaging of Oxyhemoglobin and Deoxyhemoglobin. Diabetes Care 2009, 32, 2056–2061. [Google Scholar] [CrossRef] [PubMed]
- Pu, Y.Y.; Sun, D.W. Vis–NIR hyperspectral imaging in visualizing moisture distribution of mango slices during micro-wave-vacuum drying. Food Chem. 2015, 188, 271–278. [Google Scholar] [CrossRef] [PubMed]
- Gmur, S.; Vogt, D.; Zabowski, D.; Moskal, L.M. Hyperspectral Analysis of Soil Nitrogen, Carbon, Carbonate, and Organic Matter Using Regression Trees. Sensors 2012, 12, 10639–10658. [Google Scholar] [CrossRef] [PubMed]
- Mo, C.; Kim, G.; Lim, J.; Kim, M.S.; Cho, H.; Cho, B.K. Detection of lettuce discoloration using hyperspectral reflectance im-aging. Sensors 2015, 15, 29511–29534. [Google Scholar] [CrossRef] [PubMed]
- Pan, L.; Zhang, Q.; Zhang, W.; Sun, Y.; Hu, P.; Tu, K. Detection of cold injury in peaches by hyperspectral reflectance imaging and artificial neural network. Food Chem. 2016, 192, 134–141. [Google Scholar] [CrossRef] [PubMed]
- Sacré, P.-Y.; Lebrun, P.; Chavez, P.-F.; De Bleye, C.; Netchacovitch, L.; Rozet, E.; Klinkenberg, R.; Streel, B.; Hubert, P.; Ziemons, E. A new criterion to assess distributional homogeneity in hyperspectral images of solid pharmaceutical dosage forms. Anal. Chim. Acta 2014, 818, 7–14. [Google Scholar] [CrossRef] [PubMed]
- Honkavaara, E.; Hakala, T.; Markelin, L.; Jaakkola, A.; Saari, H.; Ojanen, H.; Pölönen, I.; Tuominen, S.; Näsi, R.; Rosnell, T.; et al. Autonomous hyperspectral UAS photogrammetry for environmental monitoring applications. ISPRS Int. Arch. Photogramm. Remote Sens. Spat. Inf. Sci. 2014, XL-1, 155–159. [Google Scholar] [CrossRef]
- Carrasco, O.; Gomez, R.B.; Chainani, A.; Roper, W.E. Hyperspectral imaging applied to medical diagnoses and food safety. Geo-Spat. Temporal Image Data Exploit. III 2003, 5097, 215–222. [Google Scholar] [CrossRef]
- Paul, D.W.; Ghassemi, P.; Ramella-Roman, J.C.; Prindeze, N.J.; Moffatt, L.T.; Alkhalil, A.; Shupp, J.W. Noninvasive imaging technologies for cutaneous wound assessment: A review. Wound Repair Regen. 2015, 23, 149–162. [Google Scholar] [CrossRef] [PubMed]
- Dicker, D.T.; Lerner, J.; Van Belle, P.; Guerry, D., 4th; Herlyn, M.; Elder, D.E.; El-Deiry, W.S. Differentiation of normal skin and melanoma using high resolution hyperspectral imaging. Cancer Biol Ther. 2006, 5, 1033–1038. [Google Scholar] [CrossRef] [PubMed]
- Lee, L.-L.; Chen, S.-L. Assessment of hyperspectral imaging in pressure injury healing. Adv. Ski. Wound Care 2022, 35, 429–434. [Google Scholar] [CrossRef] [PubMed]
- Luo, S.F.; Hu, W.Y. Principles of assessment and measurement of chronic wounds. Hu Li Za Zhi 2007, 54, 62–67. [Google Scholar]
- Saiko, G.; Lombardi, P.; Au, Y.; Queen, D.; Armstrong, D.; Harding, K. Hyperspectral imaging in wound care: A systematic review. Int. Wound J. 2020, 17, 1840–1856. [Google Scholar] [CrossRef] [PubMed]
- Zahia, S.; Zapirain, M.B.G.; Sevillano, X.; González, A.; Kim, P.J.; Elmaghraby, A. Pressure injury image analysis with machine learning techniques: A systematic review on previous and possible future methods. Artif. Intell. Med. 2020, 102, 101742. [Google Scholar] [CrossRef] [PubMed]


| Variable | n | % |
|---|---|---|
| Gender | ||
| Male | 20 | 66.7 |
| Female | 10 | 33.3 |
| Age (Mean ± SD), Y | 71.7 ± 15.97 | |
| Admission diagnosis Pneumonia | 8 | 26.7 |
| Respiratory failure | 4 | 13.3 |
| Obstructive lung disease | 1 | 3.3 |
| Cerebrovascular disease | 5 | 16.7 |
| Brain tumor | 1 | 3.3 |
| Intracranial injury | 3 | 10.0 |
| Diabetes Urinary tract infection Septicemia Buttock abscess Fever | 3 3 2 1 1 | 10.0 10.0 6.7 3.3 3.3 |
| Pressure injury stage | ||
| Stage 1 | 2 | 6.6 |
| Stage 2 | 13 | 43.3 |
| Stage 3 | 10 | 33.3 |
| Stage 4 | 1 | 3.3 |
| Unstageable | 4 | 13.3 |
| Subject | Classification |
|---|---|
| Case 01 | Stage 2 |
| Case 02 | Stage 3 |
| Case 03 | Unstageable |
| Case 04 | Stage 2 |
| Case 05 | Stage 3 |
| Case 06 | Stage 3 |
| Case 07 | Unstageable |
| Case 08 | Unstageable |
| Case 09 | Stage 4 |
| Case10 | Stage 3 |
| Case 11 | Stage 2 |
| Case 12 | Stage 2 |
| Case 13 | Stage 2 |
| Case 14 | Stage 3 |
| Case 15 | Unstageable |
| Case 16 | Stage 2 |
| Case 17 | Stage 3 |
| Case 18 | Stage 3 |
| Case 19 | Stage 2 |
| Case 20 | Stage 2 |
| Case 21 | Stage 1 |
| Case 22 | Stage 3 |
| Case 23 | Stage 1 |
| Case 24 | Stage 2 |
| Case 25 | Stage 3 |
| Case 26 | Stage 2 |
| Case 27 | Stage 3 |
| Case 28 | Stage 2 |
| Case 29 | Stage 2 |
| Case 30 | Stage 2 |
| Subject | Nurses Using the Length × Width Rule to Determine the Wound Area and Cal-culate the Area | The Machine Learning Meth-od Using the Length × Width Rule to Determine the Wound Area and Calculate the Area | Machine Learning Method Using Image Morphology Algorithm to Determine Wound Area and Calculate Area |
|---|---|---|---|
| Case 01 | 1.46 | 2.19 | 3.60 |
| Case 02 | 12.05 | 10.22 | 22.60 ** |
| Case 03 | 9.86 | 7.42 | 5.00 |
| Case 04 | 0.18 | 0.09 | 0.30 |
| Case 05 | 34.49 | 26.28 | 26.10 |
| Case 06 | 4.93 | 5.11 | 20.70 ** |
| Case 07 | 6.57 | 14.86 | 26.50 ** |
| Case 08 | 54.75 | 40.88 | 26.80 |
| Case 09 | 14.60 | 10.07 | 7.90 |
| Case10 | 35.95 | 11.68 | 11.60 |
| Case 11 | 23.66 | 11.41 | 7.00 |
| Case 12 | 18.25 | 8.76 | 7.10 |
| Case 13 | 10.95 | 8.41 | 8.80 |
| Case 14 | 3.65 | 3.10 | 2.70 |
| Case 15 | 39.79 | 36.73 | 34.40 |
| Case 16 | 1.21 | 5.26 | 3.80 |
| Case 17 | 39.89 | 35.77 | 35.40 |
| Case 18 | 25.55 | 15.42 | 13.70 |
| Case 19 | 59.13 | 35.04 | 25.70 |
| Case 20 | 77.38 | 29.20 | 29.60 |
| Case 21 | 1.64 | 7.01 | 39.10 ** |
| Case 22 | 65.70 | 33.73 | 32.60 |
| Case 23 | 0.04 | 0.73 | 27.20 ** |
| Case 24 | 4.38 | 4.38 | 20.40 ** |
| Case 25 | 20.44 | 13.14 | 12.10 |
| Case 26 | 14.60 | 6.48 | 6.50 |
| Case 27 | 24.09 | 21.90 | 16.10 |
| Case 28 | 52.56 | 2.92 | 1.10 ** |
| Case 29 | 3.07 | 0.61 | 0.50 |
| Case 30 | 3.29 | 0.73 | 0.70 |
| Wound Assessment Method | Staff Length × Width vs. Machine Learning Length × Width | Staff Length × Width vs. Machine Learning Combined with Morphology | Machine Learning Length × Width vs. Machine Learning Combined with Morphology | |
|---|---|---|---|---|
| Statistical Parameters | ||||
| With Outliers | ||||
| Pearson’s correlation coefficient | 0.80 p < 0.001 | 0.44 p < 0.05 | 0.69 p < 0.001 | |
| Spearman’s correlation coefficient | 0.82 p < 0.001 | 0.44 p < 0.05 | 0.70 p < 0.001 | |
| Intraclass correlation coefficient ICC | 0.81 p < 0.001 | 0.54 p < 0.05 | 0.81 p < 0.001 | |
| Unweighted kappa value κ | 0.03 95% CI: [−0.02, 0.09] | 0.01 95% CI: [0.01, 0.01] | 0.01 95% CI: [0.01, 0.01] | |
| Weighted kappa value Weighted κ | 0.76 95% CI: [0.55, 0.97] | 0.42 95% CI: [0.06, 0.78] | 0.71 95% CI: [0.46, 0.95] | |
| Without Outliers (The number of cases with inconsistent determination of wound location has been deducted) | ||||
| Pearson’s correlation coefficient | 0.88 p < 0.001 | 0.87 p < 0.001 | 0.96 p < 0.001 | |
| Spearman’s correlation coefficient | 0.93 p < 0.001 | 0.92 p < 0.001 | 0.97 p < 0.001 | |
| Intraclass correlation coefficient ICC | 0.87 p < 0.001 | 0.85 p < 0.001 | 0.98 p < 0.001 | |
| Unweighted kappa value κ | 0.01 95% CI: [0.01, 0.01] | 0.01 95% CI: [0.01, 0.01] | 0.01 95% CI: [0.01, 0.01] | |
| Weighted kappa value Weighted κ | 0.85 95% CI: [0.77, 0.94] | 0.81 95% CI: [0.71, 0.91] | 0.9560 95% CI: [0.92, 0.99] | |
| Wound Assessment Method | Machine Learning Length × Width | Machine Learning Combined with Morphology | |
|---|---|---|---|
| Statistical Parameters | |||
| Intraclass correlation coefficient ICC | 0.7728 p < 0.05 | 0.8372 p < 0.05 | |
Disclaimer/Publisher’s Note: The statements, opinions and data contained in all publications are solely those of the individual author(s) and contributor(s) and not of MDPI and/or the editor(s). MDPI and/or the editor(s) disclaim responsibility for any injury to people or property resulting from any ideas, methods, instructions or products referred to in the content. |
© 2023 by the authors. Licensee MDPI, Basel, Switzerland. This article is an open access article distributed under the terms and conditions of the Creative Commons Attribution (CC BY) license (https://creativecommons.org/licenses/by/4.0/).
Share and Cite
Lee, L.-L.; Chen, S.-L. The Application of Hyperspectral Imaging to the Measurement of Pressure Injury Area. Int. J. Environ. Res. Public Health 2023, 20, 2851. https://doi.org/10.3390/ijerph20042851
Lee L-L, Chen S-L. The Application of Hyperspectral Imaging to the Measurement of Pressure Injury Area. International Journal of Environmental Research and Public Health. 2023; 20(4):2851. https://doi.org/10.3390/ijerph20042851
Chicago/Turabian StyleLee, Lin-Lin, and Shu-Ling Chen. 2023. "The Application of Hyperspectral Imaging to the Measurement of Pressure Injury Area" International Journal of Environmental Research and Public Health 20, no. 4: 2851. https://doi.org/10.3390/ijerph20042851
APA StyleLee, L.-L., & Chen, S.-L. (2023). The Application of Hyperspectral Imaging to the Measurement of Pressure Injury Area. International Journal of Environmental Research and Public Health, 20(4), 2851. https://doi.org/10.3390/ijerph20042851