Abstract
Epidemiological studies reported that ozone (O3) is associated with cardiovascular diseases. However, only few of these studies examined the impact of multiple O3 indicators on cardiovascular hospital admissions. This study aimed to explore and compare the impacts of different O3 indicators on cardiovascular hospital admissions in Guangzhou, China. Based upon the data on daily cardiovascular hospital admissions, air pollution, and meteorological factors in Guangzhou from 2014 to 2018, a time-stratified case-crossover design model was used to analyze the associations between different O3 indicators and cardiovascular hospital admissions. Moreover, the sensitivities of different age and gender groups were analyzed for the whole year and different seasons (i.e., warm and cold). During the warm season, for the single-pollutant model, the odds ratio (OR) value of cardiovascular hospital admissions was 1.0067 (95% confidence interval (CI): 1.0037, 1.0098) for every IQR increase in MDA8 O3 at a lag of five days. The effect of O3 on people over 60 year was stronger than that on the 15–60 years age group. Females were more sensitive than males to O3 exposure. These results provided valuable references for further scientific research and environmental improvement in Guangzhou. Given that short-term O3 exposure poses a threat to human health, the government should therefore pay attention to prevention and control policies to reduce and eliminate O3 pollution and protect human health.
1. Introduction
Ozone (O3), a secondary pollutant, is formed by the photochemical reactions of precursors that mainly include volatile organic compounds (VOCs) and nitrogen oxides (NOx). It can negatively impact human and animal health, plant growth, climate change, and ecological balance on a local, regional, or even global scale [1,2,3,4]. O3 pollution poses a huge threat to the global public health, especially in developing countries such as China and India [5,6]. In recent years, rapid economic development and urbanization have been closely related to severe O3 pollution. Although China implemented an important policy in 2013 (i.e., Air Pollution Prevention and Control Action Plan), the concentration of particulate matter dominated by PM2.5 (particulate matter with an aerodynamic diameter ≤2.5 μm) shows an obvious decreasing trend, while O3 concentration shows an increasing trend, gradually becoming the dominant air pollutant in China [7,8]. Notably, the reduction of PM2.5 slows down the absorption of hydroperoxyl radicals, thereby accelerating the formation of O3 [9]. As China is facing a serious O3 pollution problem, it is therefore necessary to fully understand the susceptible diseases associated with O3 exposure.
O3 exposure not only has a negative impact on human health [10], but also imposes great economic burden [6,11,12]. Epidemiological studies showed that short-term O3 exposure leads to platelet activation and increases blood pressure and is positively associated with cardiovascular mortality [2,13,14,15]. Moreover, a high O3 concentration can cause respiratory diseases and aggravate the conditions of patients with such diseases, including asthma and chronic lung disease [16]. Therefore, examining the impact of O3 on human health, especially in the period of severe O3 pollution, is an urgent concern.
Many epidemiological studies have evaluated the impact of O3 pollution on human health worldwide. It is worth noting that the selection of O3 indicators will affect the results of risk estimation [17,18,19]. At present, three O3 indicators, which represent different exposure times are commonly used in epidemiological studies; the maximum daily 8 h average O3 concentration (MDA8 O3), the maximum daily 1 h average O3 concentration (MDA1 O3), and the daily 24 h average O3 concentration are also considered [17,20]. For example, Yang et al. (2004) used a case-crossover method to estimate whether an association exists between O3 concentration (daily 24 h average O3 concentration) and cardiovascular hospital admissions in Taiwan [21]. Their results showed that O3 was significantly and positively associated with cardiovascular hospital admissions in the warm season. On the basis of a generalized additive model, Wu et al. (2022) investigated the health effects of O3 exposure (MDA8 O3) on cardiovascular mortality in Nanchang, China [2]. Their results showed that, for every 10 μg/m3 rise in O3 concentration, cardiovascular mortality increased by 1.26% (95% confidence interval (CI): 0.68, 1.83%). Using a generalized additive model as well, Yang et al. (2012) estimated the effect of O3 concentration (MDA1 O3) on cardiovascular mortality from 2006 to 2008 in Suzhou, China [19]. Their results showed that O3 level was positively associated with cardiovascular mortality, with every 10 μg/m3 increase in MDA1 O3 related to a 4.31% (95% CI: 1.34, 7.27%) increase in cardiovascular mortality.
Most of the previous studies only included a single O3 indicator, and few analyzed different O3 indicators simultaneously and compared their associations with cardiovascular admissions. Accordingly, this study aimed to (1) use a time-stratified case-crossover (TSCC) model to explore and identify the short-term impact of different O3 indicators (MDA8 O3 and MDA1 O3) on daily cardiovascular hospital admissions in Guangzhou, China; (2) investigate the association between different O3 indicators and daily cardiovascular hospital admissions in different age and gender groups for the whole year and for different seasons (warm and cold); and (3) compare the results of the single-day lag model and the moving average lag model, as well as perform further sensitivity analysis.
2. Method and Data Sources
2.1. Hospital Admissions
Guangzhou is the largest metropolis in South China, with more than 18 million people. Owing to rapid economic development and increased energy consumption in the past few decades, Guangzhou has suffered severe air pollution, possibly caused by the considerable emissions of anthropogenic precursors [22]. In 2019, the annual average O3 concentration in Guangzhou was 178 μg/m3, far more than the standard (100 μg/m3) recommended by the World Health Organization (WHO) [23]. The dense population and high O3 concentration in Guangzhou contributed to its selection as a typical city to examine the health effects of O3 pollution. In this study, data on daily cardiovascular hospital admissions from 1 January 2014 to 31 August 2018 collected from the First Affiliated Hospital of Sun Yat-Sen University, located in Yuexiu District, central Guangzhou, were used to investigate the association between O3 and cardiovascular hospital admissions. The data information included: hospitalization date, gender, age, residential address, and diagnosis from the 10th International Classification of Diseases (ICD-10: I01-I59). As 93.65% of the people in this dataset were over 15 years old, the hospital admissions data in this study were thus divided into two age groups: 15–60 and 60+ years old. Screening was performed according to the residential address of the patients, who were all residents of Guangzhou.
2.2. Air Pollutants and Meteorological Data
The data on pollutants from January 1, 2014 to August 31, 2018, including O3 (MDA8 O3 and MDA1 O3), PM2.5, and NO2, were obtained from the Guangzhou Air Quality Monitoring Station. Among them, PM2.5 and NO2 concentrations were used to identify the stability of the relationship between O3 and cardiovascular admissions in the multi-pollution model. The pollutant data were collected from the National Environmental Monitoring Center of China (http://quotsoft.net/air/ accessed on 8 July 2022). The 10 air quality monitoring stations in Guangzhou can be divided into three categories, namely, urban, suburban, and mountainous stations, which are located in the densely populated area with high traffic pressure, areas where the industrial base is less developed and the population is relatively sparse, and areas that have high altitude and location in mountainous scenic spots. More importantly, due to data maybe being affected by unpredictable weather conditions, equipment/data transmission failures, etc., the O3 monitoring data contain a large number of missing values and potential outliers. To guarantee the stability of the results, we adopt a strict quality control of the data according to [24]. For each city, when we have not less than 20 h of data, then the daily O3 concentration was the average of the hourly data of all monitoring stations in this city [8]. Moreover, if a large amount of data was lost on a day, then the data for that day were considered as invalid and replaced with the average value from the corresponding month [25]. Considering that the hospitalized patients came from different districts in Guangzhou, the average value of pollutants from 10 monitoring stations was thus used in this study.
The meteorological data from 2014 to 2018 were obtained from the China Meteorological Data Sharing Service System (http://data.cma.gov.cn/). Daily average temperature and relative humidity were included to test the sensitivity of the results. All the data were divided into two seasons, warm and cold, according to their monthly average temperature. In particular, months with an average temperature above 20 °C were classified as warm season (May to October) and those below 20 °C were classified as cool season (November to April).
2.3. Statistical Analysis
Given that each case serves as its own control, a TSCC design can well control the temporal and seasonal confounders, as well as individual confounders, such as age, gender, and socioeconomic status. Therefore, TSCC is widely used in epidemiological studies [26,27]. Time-stratified refers to the method of comparing the day a patient was hospitalized (case day) with the same day in other weeks within one previous month (control day) [28]. Specifically, if a patient visited on a Tuesday in August 2015, all Tuesdays a month prior would be control days; according to this rule, every case will thus have three to four controls.
In the present study, TSCC was used to evaluate the effect of short-term exposure to different O3 indicators on cardiovascular hospital admissions. We used conditional logistic regression to generate the odds ratio (OR) values and their 95% CI. If the value of p was less than 0.05, the results were considered statistically significant. Additionally, daily average temperature and relative humidity were involved as covariates. The model is as follows:
where t is the date of hospital admission, and X represents the independent variable, including pollutants and meteorological factors. The item log (h (t, X)) represents the risk function of exposure to X on the day t, and log (h0 (t)) refers to the baseline risk function [28]. Cs is the daily concentration of pollutants; and Temp and RH represent average temperature and relative humidity, respectively, with the coefficients β1, β2, and β3.
To examine whether O3 has a lag effect on cardiovascular hospital admissions, we analyzed the impacts of O3 with a single-day lag model (from lag0 to lag5) and a multi-day lag model (from lag01 to lag05). The pollutant concentration of lag0 refers to the concentration on the current day, and the pollutant concentration of lag1 refers to the O3 concentration of the previous one day. The pollutant concentration of lag01 represents the 2-day average concentration of the pollutant concentrations on the current day and the previous one day, and the pollutant concentration of lag05 represents the concentration averaged on the current day and the previous five days. In the lag model, we obtained the ORs and optimal lag period for O3 based on the maximum value of the ORs.
We also performed a series of subgroup analyses stratified by age (15–60 years age group and more than 60 years age group) and gender (male and female) to identify potentially susceptible subgroups. These age stratifications refer to previously published studies [5,29]. Seasonal analysis of O3-related effects was also performed by dividing the whole year into warm season (May to October) and cold season (November to April). The effects of different O3 indicators on daily cardiovascular hospital admissions in Guangzhou were both examined in these subgroup analyses.
2.4. Sensitivity Analysis
To further verify the stability of the results, we (1) performed a multi-pollutant analysis, where we added other severe pollutants (e.g., NO2 and PM2.5) one by one to test whether the results were stable; and (2) we changed the lag days of meteorological factors (i.e., average temperature and relative humidity) from lag0 to lag3 to test whether the results were sensitive to changes in meteorological factors.
All of the above analyses were performed in R software (version 3.6.3). The p-values less than 0.05 were regarded as statistically significant.
3. Results
3.1. Basic Information of Data
Table 1 describes the basic statistical characteristics of the daily data on cardiovascular hospital admissions, two different O3 indicators, two other major air pollutants (PM2.5 and NO2), and meteorological factors (average temperature and relative humidity). From 1 January 2014 to 31 August 2018, the cumulative number of inpatients with cardiovascular disease was 20,356, of which 11,360 (55.8%) were male and 8996 (44.2%) were female. There were 13,936 (68.5%) people aged 60+ years old and 6420 (31.5%) people aged 15–60 years old. The average daily concentrations of MDA8 O3, MDA1 O3, PM2.5, and NO2 were 91 ± 51, 105 ± 59, 38 ± 22, and 46 ± 18 μg/m3, respectively.

Table 1.
Descriptive statistics of air pollutants, meteorological variables, and cardiovascular hospital admissions.
Notably, PM2.5 and NO2 concentrations were higher in the cold season, whereas O3 was higher in the warm season. The daily concentration range of MDA8 O3 and MDA1 O3 during the study period (2014–2018) were 4.0–271.0 and 4.3–311.1 μg/m3, respectively. The daily concentration of NO2 was in the range of 14.0–148.0 μg/m3, with an annual average of 46.1 μg/m3. During the study period, NO2 exceeded the level II of the Chinese Ambient Air Quality Standards (40 μg/m3) for 963 days, accounting for 54.93% of the total number of days. The annual average value of PM2.5 was 38.2 μg/m3, which was 46.8% higher than the 35 μg/m3 threshold recommended by the level II of the Chinese Ambient Air Quality Standards, and it was 99.0% higher than the annual average reported by the WHO (10 μg/m3). Moreover, the daily average temperature and relative humidity ranged from 3.3 °C to 31.7 °C (annual average was 22.2 °C) and from 28% to 97% (annual average was 78.7%), respectively, which were included in the model as confounding factors. Figure 1 shows the temporal evolution of the four pollutants and the two meteorological factors.
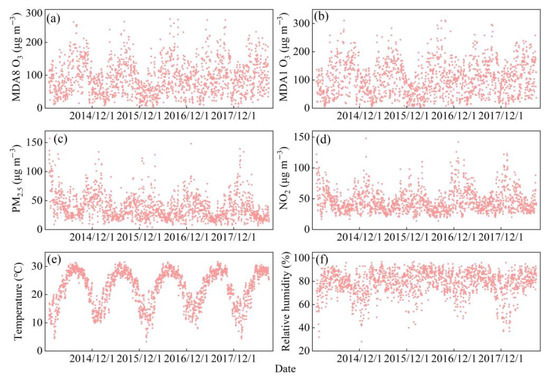
Figure 1.
Time series of monthly average air pollutants and meteorological factors in Guangzhou, China from 2014 to 2018.
3.2. The Relationship between Ozone and Cardiovascular Hospitalization
Figure 2 shows the percentage change in cardiovascular hospital admissions with an IQR increase in MDA8 O3 and MDA1 O3. Figure S1 shows the association between two O3 indicators and the daily cardiovascular hospital admissions in a single pollutant model. Similar lagged effects were observed for the two O3 indicators. For MDA8 O3, significant and negative OR values were observed at lag1-lag05, and only the result of lag0 was not statistically significant (Figure S1a). For MDA1 O3, significant and negative OR values of 0.9966 (95% CI: 0.9940, 0.9993), 0.9965 (95% CI: 0.9940, 0.9990), 0.9951 (95% CI: 0.9912, 0.9990), and 0.9947 (95% CI: 0.9907, 0.9989) were observed at lag3, lag4, lag04, and lag05 days, respectively (Figure S1b).
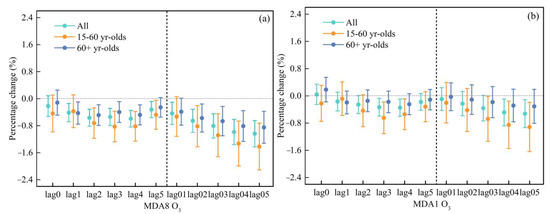
Figure 2.
Comparison the effects for an IQR increase in different O3 indicators (MDA8 O3 (a) and MDA1 O3 (b)) on cardiovascular hospitalization admissions in different age groups.
The risk of cardiovascular hospital admissions in different age groups was further examined by applying the same model to determine whether there were differences between age groups. As shown in Figure S1a, MDA8 O3 was negatively related to cardiovascular hospital admissions. At the lag of five days, the effect of MDA8 O3 on cardiovascular hospital admissions in the 15–60 years age group was the highest and significant, with an OR value of 0.9999 (95% CI: 0.9952, 0.9909). The highest OR value at the day of lag3 was significant for the 60+ years age group, with an OR value of 0.9960 (95% CI: 0.9929, 0.9991).
For MDA1 O3, its effect on the 15–60 years age group was significant and the highest at the day of lag4, with an OR value of 0.9946 (95% CI: 0.9901, 0.9991), while its effect on the 60+ years age group had no significant association (Figure S1b).
The OR estimates for different gender groups were further analyzed using the same model (Figure S2). For MDA8 O3, at the lag of three days, the effect of MDA8 O3 on cardiovascular hospital admissions in the male group was the highest and significant, with an OR value of 0.9965 (95% CI: 0.9931, 0.9998). For the female group, the highest and significant association occurred at the day of lag 2, with an OR value of 0.9951 (95% CI: 0.9913, 0.9989) (Figure S2a).
For MDA1 O3, no significant association was found for the male group. Meanwhile, for the female group, significant associations were found at the days of lag3 and lag4, with OR values of 0.9958 (95% CI: 0.9918, 0.9997) and 0.9951 (95% CI: 0.9913, 0.9989), respectively (Figure S2b). Figure 3 shows the percentage change in cardiovascular hospital admissions with an IQR increase in MDA8 O3 and MDA1 O3 for different gender people.
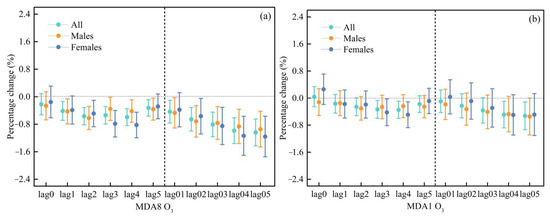
Figure 3.
Comparison the effects for an IQR increase in different O3 indicators (MDA8 O3 (a) and MDA1 O3 (b)) on cardiovascular hospitalization admissions in different gender groups.
3.3. Seasonal Estimates of the Effects of Different Ozone Indicators on Cardiovascular Hospital Admissions
The continuous high temperature and strong sunshine in the warm season are conducive to the photochemical reaction of VOCs and NOx, which will accelerate the formation of O3. That is, there is a phenomenon that the O3 concentration in summer is higher than that in winter. Therefore, we evaluated the effect of different O3 indicators on cardiovascular hospital admissions in the warm season (May to October) and the cold season (November to April) (Figures S3 and S4, respectively). The results showed that O3 had different effects on cardiovascular hospital admissions in different seasons. Specifically, a significant and positive association between MDA8 O3/MDA1 O3 and cardiovascular hospital admissions in the warm season and a negative association in the cold season. Figure 4 and Figure 5 show the percentage change in cardiovascular hospital admissions with an IQR increase in MDA8 O3 and MDA1 O3 in different seasons.
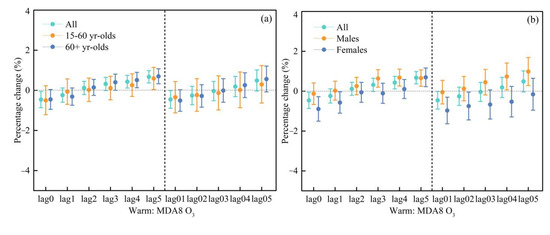
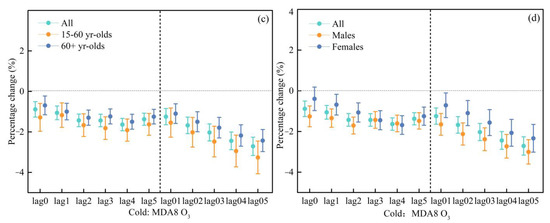
Figure 4.
Comparison of the effects for an IQR increase in MDA8 O3 on cardiovascular hospitalization admissions during the warm periods (a,b) and the cold periods (c,d).
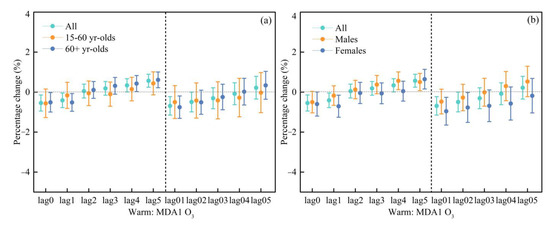
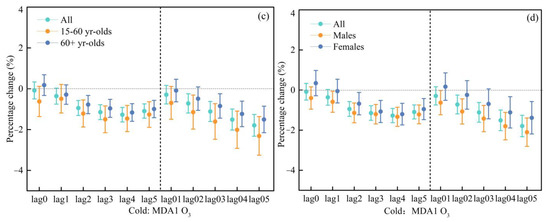
Figure 5.
Comparison the effects for an IQR increase in MDA1 O3 on cardiovascular hospitalization admissions during the warm periods (a,b) and the cold periods (c,d).
During the warm season, similar lagged effects on cardiovascular hospital admissions were observed for the two different O3 indicators. MDA8 O3 was significantly and positively related to all the people from lag4 and lag5 days, with OR values of 1.0043 (95% CI: 1.0011, 1.0075) and 1.0067 (95% CI: 1.0037, 1.0098), respectively (Figure S3). For the moving average lag model, the results were not significant. As for MDA1 O3, there was also a positive association at a lag of four and five days, with the OR values of 1.0034 (95% CI: 1.0001, 1.0067) and 1.0057 (95% CI: 1.0024, 1.0089), respectively (Figure S4). In the cold season, MDA8 O3/MDA1 O3 was significantly and negatively correlated with cardiovascular hospital admissions (Figure S3 and S4).
We further examined the OR value in different seasons by using the same model to determine whether there were differences between different seasons. As shown in Figure 4, MDA8 O3 was positively associated with the cardiovascular hospital admissions in the warm periods. At the lag of five days, the effect of MDA8 O3 on cardiovascular hospital admissions in the 15–60 years age group was the highest and significant, with an OR value of 1.0059 (95% CI: 1.0004, 1.0115). Meanwhile, significant and positive associations for the 60+ years age group were found at the days of lag3 to lag5, with OR values of 1.0040 (95% CI: 1.0000, 1.0081), 1.0051 (95% CI: 1.0013, 1.0090), and 1.0070 (95% CI: 1.0033, 1.0107), respectively (Figure S3a).
For MDA1 O3, its significant effect on the 60+ years age group was observed at the days of lag4 and lag5, with OR values of 1.0043 (95% CI: 1.0002, 1.0083) and 1.0061 (95% CI: 1.0022, 1.0101), respectively. Meanwhile, its effect on the 15–60 years age group had no significant association (Figure S4a).
For MDA8 O3, significant associations were found for the male group at the days of lag3 to lag5, with OR values of 1.0064 (95% CI: 1.0020, 1.0108), 1.0068 (95% CI: 1.0026, 1.0110), and 1.0066 (95% CI: 1.0025, 1.0107), respectively. Meanwhile, for the female group, the significant and highest association was found at the day of lag5, with an OR value of 1.0069 (95% CI: 1.0023, 1.0106) (Figure S3b).
For MDA1 O3, significant associations were found for the male group at the days of lag4 and lag5, with OR values of 1.0057 (95% CI: 1.0012, 1.0101) and 1.0050 (95% CI: 1.0007, 1.0093), respectively. Meanwhile, for the female group, the significant and highest association was found at the day of lag5, with an OR value of 1.0064 (95% CI: 1.0016, 1.0114) (Figure S4b).
3.4. Sensitivity Analysis
Sensitivity analyses demonstrated that these results are stable by implementing the single- and multi-pollutant model. In the multi-pollutant model analysis, after PM2.5 was added, the OR values of different O3 indicators decreased slightly, but still without statistical significance (purple color in Figure 6). For the MDA8 O3, after adding NO2 or adding PM2.5 and NO2 simultaneously, the change in the effect of O3 on cardiovascular hospital admissions was small, with OR values of −0.0312%, −0.0015%, −0.0698%, and −0.0078%, respectively. For MDA1 O3, the values were 0.0049%, 0.0297%, −0.0207, and 0.0178, respectively (purple color in Figure 6).
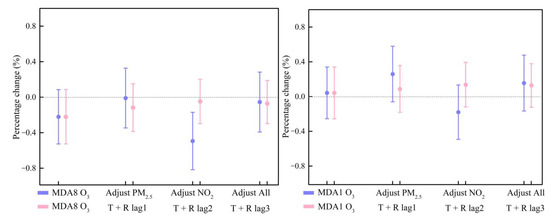
Figure 6.
Percentage increase in daily cardiovascular hospitalization admissions with an IQR increase in MDA8 O3 (left)/MDA1 O3 (right) concentrations using the single and multiple pollutant models (purple color) and sensitivity to different lag days of meteorological factors (pink color).
To further verify the stability of the results, we likewise adjusted the different lag days for meteorological factors. The results showed that when the lag days of meteorological factors were 0, 1, 2, and 3 days, the OR values changed only slightly, which for MDA8 O3 were −0.031%, −0.017%, −0.007% and −0.008%, respectively (pink color in Figure 6). The changed OR values for the MDA1 O3 were 0.005%, 0.010%, 0.016%, and 0.015%, respectively (pink color in Figure 6). The very minimal change in results indicated that these results are stable.
4. Discussion
As far as we know, this is one of the few studies that reported the effect of different O3 indicators on daily cardiovascular hospital admissions. In this study, we employed a TSCC design to evaluate the short-term effect of MDA8 O3/MDA1 O3 on daily cardiovascular hospital admissions in Guangzhou from 2014 to 2018. The results showed that the associations between cardiovascular hospital admissions and O3 varied with different O3 indicators, age, gender groups, and season. The association between MDA8 O3/MDA1 O3 and daily cardiovascular hospital admissions was significantly positive in the warm season and negative in the cold season. Compared with MDA1 O3, MDA8 O3 was more strongly associated with cardiovascular hospital admissions. The effects of O3 on cardiovascular hospital admissions were stronger in the 60+ years age group than in the 15–60 years age group, and females were slightly more sensitive than males to O3. These findings not only help us understand the differences in impact of different O3 indicators on cardiovascular hospital admissions, but also present the differences in the effect of O3 on different groups.
Three O3 indicators (MDA8 O3, MDA1 O3, and daily 24 h average O3) are commonly used in O3-related epidemiological studies. In this study, we reviewed studies about the effects of different O3 indicators on cardiovascular disease worldwide since 2000 (Table 2) and found that different studies used different O3 indicators. For example, in the United States, daily all-cause, cardiovascular, and respiratory mortality are closely associated with MDA8 O3 levels [30]. Based on a generalized additive model, Qin et al. (2017) evaluated the relationship between daily O3 and cardiovascular mortality in 2013–2015 [31]. Their results showed that MDA8 O3 was positively associated with cardiovascular mortality. Gryparis et al. (2004) reported that, in Europe, a 10 μg/m3 increase in MDA1 O3 was associated with a 0.33%, 0.45%, and 1.13% increase in all-cause, cardiovascular, and respiratory mortality, respectively [32]. The daily 24 h average O3 indicator is also widely used in the previous epidemiological studies [17,20,33]. Sun et al. (2018) conducted an epidemiological analysis in 34 Chinese counties, using three O3 indicators (MDA8 O3, MDA1 O3, and daily 24 h average O3) from 2013 to 2015 to explore the relationship between short-term exposure to different O3 indicators and cardiovascular mortality [34]. Shi et al. (2020) conducted a time-series analysis in 128 Chinese counties from 2013 to 2018 and reported the associations between short-term exposure to three different O3 indicators and cardiovascular mortality [35].

Table 2.
Various studies on cardiovascular diseases attributed to different O3 indicators after the year 2000 worldwide.
In the aforementioned studies, we observed that different O3 indicators have different estimates and that the correlation between MDA8 O3 and cardiovascular hospital admissions was stronger than that between MDA1 O3 and cardiovascular hospital admissions, except in the US study [36] (Table 2). For example, Sun et al. (2018) conducted an epidemiological study in 34 Chinese counties from 2013 to 2015 considering that three different O3 indicators (MDA8 O3, MDA1 O3, and 24 h daily average O3) simultaneously to examine the associations between short-term exposure to different O3 indicators and cardiovascular mortality [34]. Their results showed that the association between MDA8 O3 and cardiovascular mortality was stronger than that between MDA1 O3 and cardiovascular mortality. On the basis of data from 2008 to 2009, Chen et al. (2013) used a generalized additive model to examine the effects of different O3 indicators on cardiovascular mortality in Suzhou [37]. Their results showed that MDA8 O3 and MDA1 O3 were positively related to daily cardiovascular hospital admissions, and the association was stronger for MDA8 O3 than for MDA1 O3. The potential reason may be that the MDA8 O3 indicator is the most relevant to individual exposure levels, as people come into cities for work during the daytime and return home at night. Furthermore, high O3 exposure during the daytime may have more negative health impacts than commute period and nighttime [38]. Li et al. (2015) also demonstrated that the health effects caused by short-term O3 exposure was more related to higher O3 concentration, such as MDA8 O3, rather than peak concentration, such as MDA1 O3 [38].
The strong solar radiation and higher temperature in summer are helpful to the photochemical reactions of NOx and VOCs, resulting in the production of the secondary pollutant O3. Therefore, there is a high O3 concentration in summer and low O3 concentration in winter [8,39]. According to the characteristics of O3, we evaluated the effects of two O3 indicators on daily cardiovascular hospital admissions in Guangzhou in different seasons: warm and cold. Notably, there are different associations in the warm and cold seasons, which was consistent with the previous studies. We also examined the susceptibility of different age and gender groups to O3 pollution during the warm season and the cold season. The results showed that, in the warm season, both MDA8 O3 and MDA1 O3 were significantly and positively related to daily cardiovascular hospital admissions. By contrast, in the cold season, the two O3 indicators were significantly and negatively related to daily cardiovascular hospital admissions. That is, in the warm season, there are positive associations between MDA8 O3/MDA1 O3 and daily cardiovascular hospital admissions, whereas in the cold season, there are negative associations between them, results that are consistent with other studies [2,40]. Similarly, Yang et al. (2004) aimed to use a case-crossover method to determine the association between O3 concentration and cardiovascular hospital admissions in Taiwan [21]. Their results showed that O3 was positively associated with cardiovascular hospital admissions in the warm season, as well as negatively in the cold season. Based upon O3 data from 2014 to 2017, Lu et al. (2022) used cardiovascular disease emergency data collected from famous hospitals in Shanghai to explore the relationship between O3 and cardiovascular hospital visits in different seasons [41]. Their results also showed that O3 had different relationships with cardiovascular hospital visits in different seasons. The underlying reason may be that temperature modulates the impacts of O3 on the health risks, and some studies have found that the health risks related to O3 exposure are enhanced in low temperature environment [42,43]. In addition, temperature has a long-term lag effect on human health, especially low temperatures, which are delayed and may last for 2–3 weeks [44]. Therefore, the modifying effects of temperature on the O3-cardiovascular mortality association may also result in insufficient control for temperature effects and increased O3 mortality risks [45].
In addition, O3 pollution had a lagged effect on daily cardiovascular hospital admissions. Compared to the single-day lag model, O3 showed similar effects on the results of the moving average lag model for different age and gender subgroups. These results suggested a cumulative effect of O3 pollutants on cardiovascular hospital admissions, which was similar to the previous studies [2,38,46].
There are some limitations in this study that should be mentioned. First of all, the data on air pollution in this study were collected from monitoring stations. During the study period, these may be affected by distance, climate, and other factors and could not fully reflect individual exposure, which may cause a certain impact on the estimated association between O3 and cardiovascular hospital admissions. Second, we did not consider some individual behavioral factors in this study, that is, we did not consider individual-level O3 exposure (i.e., are they smokers or not, educational background, body mass, or occupation); thus, some uncertainty may be involved. Third, our hospital admissions data include all cardiovascular and cerebrovascular diseases. The absence of detailed data about hypotension disease or the use of data that were not divided into more detailed disease subgroups may introduce some uncertainty in the results. Fourth, we do not consider the long-term trend in our model, which also may introduce some uncertainties. Finally, as our cardiovascular hospital admissions data were obtained from a large general hospital, and not all hospitals in Guangzhou, the sample size is lower than that in other epidemiological studies. Hence, care should be taken when generalizing the results to other regions.
5. Conclusions
This study provided evidence to examine the impact of different O3 indicators on cardiovascular hospital admissions in Guangzhou, China, from 2014 to 2018. To our knowledge, this is one of the few studies comparing the differences of the effects of different O3 indicators on cardiovascular hospital admissions. The results of this study confirmed that O3 pollution increases the risk of cardiovascular hospital admissions in the warm season. With the rapid economic growth of Guangzhou, there is still a long way to go in the field of controlling O3 pollution. Based on the above results, we have some suggestions to reduce and improve O3 pollution. (1) Establish a comprehensive prevention and control strategy to coordinate the control of air pollutants and greenhouse gas emissions. (2) Control the use of fossil energy, improve gas development, and promote the transformation of the energy structure. (3) Formulate goals and implementation strategies for the coordinated control of PM2.5 and O3 pollution, since PM2.5 and O3 have similar precursors. (4) Strengthen the emission control of traffic sources and coordinately control the emission of NOx and VOCs. Traffic source control is the most important strategy for O3 pollution control because motor vehicles contribute significantly to NOx and VOCs emissions.
Supplementary Materials
The following supporting information can be downloaded at: https://www.mdpi.com/article/10.3390/ijerph20032056/s1, Figure S1. Comparison the effects for an IQR increase in different O3 indicators (MDA8 O3 (a) and MDA1 O3 (b)) on cardiovascular hospitalization admissions in different age groups. Figure S2. Comparison the effects for an IQR increase in different O3 indicators (MDA8 O3 (a) and MDA1 O3 (b)) on cardiovascular hospitalization admissions in different gender groups. Figure S3. Comparison the effects for an IQR increase in MDA8 O3 on cardiovascular hospitalization admissions during the warm periods ((a) and (b)) and the cold periods ((c) and (d)). Figure S4. Comparison the effects for an IQR increase in MDA1 O3 on cardiovascular hospitalization admissions during the warm periods ((a) and (b)) and the cold periods ((c) and (d)).
Author Contributions
X.Z. and K.J.M.: Conceptualization. F.F.Y., X.Z., Z.W. and G.W.: Data curation, Resources, and Formal analysis. X.Z., K.J.M. and G.W.: Methodology. X.Z.: Writing—original draft preparation. C.C., K.J.M. and Z.W.: Supervision, Writing—review and revising the manuscript. All authors have read and agreed to the published version of the manuscript.
Funding
This work was supported by the National Key Research and Development Plan of China (2019YFA0606901); the National Natural Science Foundation of China (42071178, 41671139); and the Visiting Fellowship from China Scholarship Council (No. 202106040072). The authors gratefully acknowledge the Faculty of Geo-Information Science and Earth Observation (ITC), University of Twente for hosting the first author to carry out this study.
Institutional Review Board Statement
Not applicable.
Informed Consent Statement
Not applicable.
Data Availability Statement
The data analyzed in this study are available on request from the corresponding author.
Conflicts of Interest
The authors declare that they have no known competing financial interest or personal relationships that could have appeared to influence the work reported in this paper.
Abbreviations
VOCs: Volatile organic compounds; NOx: Nitrogen oxides; APPCAP: Air Pollution Prevention and Control Action Plan; PM2.5: Particulate matter with aerodynamic diameter ≤ 2.5 μg/m3; MDA8 O3: the maximum daily 8 h average ozone concentration; MDA1 O3: the maximum daily 1 h average ozone concentration; CI: Confidence interval; TSCC: Time-stratified case-crossover; OR: Odds ratio; WHO: World Health Organization.
References
- Jerrett, M.; Burnett, R.T.; Pope III, C.A.; Ito, K.; Thurston, G.; Krewski, D.; Shi, Y.; Calle, E.; Thun, M. Long-term ozone exposure and mortality. N. Engl. J. Med. 2009, 360, 1085–1095. [Google Scholar] [CrossRef] [PubMed]
- Wu, H.; Lu, K.; Fu, J. A time-series study for effects of ozone on respiratory mortality and cardiovascular mortality in Nanchang, Jiangxi Province, China. Front. Public Health 2022, 10, 864537. [Google Scholar] [CrossRef] [PubMed]
- Zhang, X.X.; Yan, B.; Zhou, Y.Y.; Osei, F.; Li, Y.; Zhao, H.; Cheng, C.X.; Stein, A. Short-term health impacts related to ozone in China before and after implementation of policy measures: A systematic review and meta-analysis. Sci. Total Environ. 2022, 847, 157588. [Google Scholar] [CrossRef] [PubMed]
- Zhao, H.; Wang, L.; Zhang, Z.; Qi, Q.; Zhang, H. Quantifying ecological and health risks of ground-level O3 across China during the implementation of the “Three-year Action Plan for Cleaner Air”. Sci. Total Environ. 2022, 817, 153011. [Google Scholar] [CrossRef]
- Wang, Y.Y.; Zu, Y.Q.; Huang, L.; Zhang, H.L.; Wang, C.H.; Hu, J.L. Associations between daily outpatient visits for respiratory diseases and ambient fine particulate matter and ozone levels in Shanghai, China. Environ. Pollut. 2018, 240, 754–763. [Google Scholar] [CrossRef]
- Zhang, X.X.; Cheng, C.X.; Zhao, H. A health impact and economic loss assessment of O3 and PM2.5 exposure in China from 2015 to 2020. GeoHealth 2022, 6, e2021GH000531. [Google Scholar] [CrossRef]
- Zhang, X.X.; Osei, F.; Stein, A.; Cheng, C.X.; Maji, J.K. Temporal and spatial evolution of short-term exposure to ozone pollution: Its health impacts in China based on a meta-analysis. J. Clean. Prod. 2022, 373, 133938. [Google Scholar] [CrossRef]
- Zhao, H.; Chen, K.; Liu, Z.; Zhang, Y.; Shao, T.; Zhang, H. Coordinated control of PM2.5 and O3 is urgently needed in China after implementation of the “Air pollution prevention and control action plan”. Chemosphere 2021, 270, 129441. [Google Scholar] [CrossRef]
- Li, K.; Jacob, D.J.; Liao, H.; Shen, L.; Zhang, Q.; Bates, K.H. Anthropogenic drivers of 2013–2017 trends in summer surface ozone in China. Proc. Natl. Acad. Sci. USA 2019, 116, 422–427. [Google Scholar] [CrossRef]
- Shang, Y.; Sun, Z.W.; Cao, J.J.; Wang, X.M.; Zhong, L.J.; Bi, X.H.; Li, H.; Liu, W.X.; Zhu, T.; Huang, W. Systematic review of Chinese studies of short-term exposure to air pollution and daily mortality. Environ. Int. 2013, 54, 100–111. [Google Scholar] [CrossRef]
- Maji, K.J.; Ye, W.F.; Arora, M.; Nagendra, S.M.S. Ozone pollution in Chinese cities: Assessment of seasonal variation, health effects and economic burden. Environ. Pollut. 2019, 247, 792–801. [Google Scholar] [CrossRef] [PubMed]
- Wang, Y.Y.; Hu, J.L.; Zhu, J.; Li, J.; Qin, M.; Liao, H.; Chen, K.; Wang, M. Health Burden and economic impacts attributed to PM2.5 and O3 in China from 2010 to 2050 under different representative concentration pathway scenarios. Resour. Conserv. Recycl. 2021, 173, 105731. [Google Scholar] [CrossRef]
- Li, M.; Dong, H.; Wang, B.; Zhao, W.; Sakhvidi, M.J.Z.; Li, L.; Lin, G.; Yang, J. Association between ambient ozone pollution and mortality from a spectrum of causes in Guangzhou, China. Sci. Total Environ. 2021, 754, 142110. [Google Scholar] [CrossRef]
- Tao, Y.; Huang, W.; Huang, X.; Zhong, L.; Lu, S.E.; Li, Y.; Dai, L.; Zhang, Y.; Zhu, T. Estimated acute effects of ambient ozone and nitrogen dioxide on mortality in the Pearl River Delta of southern China. Environ. Health Perspect. 2012, 120, 393–398. [Google Scholar] [CrossRef]
- Day, D.B.; Xiang, J.; Mo, J.; Li, F.; Chung, M.; Gong, J.; Weschler, C.J.; Ohman-Strickland, P.A.; Sundell, J.; Weng, W. Association of ozone exposure with cardiorespiratory pathophysiologic mechanisms in healthy adults. JAMA Intern. Med. 2017, 177, 1344–1353. [Google Scholar] [CrossRef]
- Li, Y.; Shang, Y.; Zheng, C.; Ma, Z. Estimated acute effects of ozone on mortality in a rural district of Beijing, China, 2005–2013: A time-stratified case-crossover study. Int. J. Environ. Res. Public Health 2018, 15, 2460. [Google Scholar] [CrossRef] [PubMed]
- Bell, M.L.; Dominici, F. Effect modification by community characteristics on the short-term effects of ozone exposure and mortality in 98 US communities. Am. J. Epidemiol. 2008, 167, 986–997. [Google Scholar] [CrossRef] [PubMed]
- Ji, M.; Cohan, D.S.; Bell, M. Meta-analysis of the association between short-term exposure to ambient ozone and respiratory hospital admissions. Environ. Res. Lett. 2011, 6, 024006. [Google Scholar] [CrossRef] [PubMed]
- Yang, C.X.; Yang, H.B.; Guo, S.; Wang, Z.S.; Xu, X.H.; Duan, X.L.; Kan, H.D. Alternative ozone metrics and daily mortality in Suzhou: The China Air Pollution and Health Effects Study (CAPES). Sci. Total Environ. 2012, 426, 83–89. [Google Scholar] [CrossRef]
- Bell, M.L.; McDermott, A.; Zeger, S.L.; Samet, J.M.; Dominici, F. Ozone and short-term mortality in 95 US urban communities, 1987–2000. Jama 2004, 292, 2372–2378. [Google Scholar] [CrossRef]
- Yang, C.Y.; Chen, Y.S.; Yang, C.H.; Ho, S. Relationship between ambient air pollution and hospital admissions for cardiovascular diseases in Kaohsiung, Taiwan. J. Toxicol. Environ. Health 2004, 67, 483–493. [Google Scholar] [CrossRef]
- Wang, T.; Xue, L.; Brimblecombe, P.; Lam, Y.F.; Li, L.; Zhang, L. Ozone pollution in China: A review of concentrations, meteorological influences, chemical precursors, and effects. Sci. Total Environ. 2017, 575, 1582–1596. [Google Scholar] [CrossRef] [PubMed]
- WHO. Ambient (Outdoor) Air Quality and Health. 2014. Available online: http://www.who.int/mediacentre/factsheets/fs313/en/ (accessed on 11 November 2017).
- Barrero, M.; Orza, J.; Cabello, M.; Cantón, L. Categorisation of air quality monitoring stations by evaluation of PM10 variability. Sci. Total Environ. 2015, 524, 225–236. [Google Scholar] [CrossRef] [PubMed]
- Feng, L.; Ye, B.; Feng, H.; Ren, F.; Huang, S.; Zhang, X.; Zhang, Y.; Du, Q.; Ma, L. Spatiotemporal changes in fine particulate matter pollution and the associated mortality burden in China between 2015 and 2016. Int. J. Environ. Res. Publ. Health 2017, 14, 1321. [Google Scholar] [CrossRef]
- Lumley, T.; Levy, D. Bias in the case–crossover design: Implications for studies of air pollution. Env. Off. J. Int. Env. Soc. 2000, 11, 689–704. [Google Scholar] [CrossRef]
- Maclure, M. The case-crossover design: A method for studying transient effects on the risk of acute events. Am. J. Epidemiol. 1991, 133, 144–153. [Google Scholar] [CrossRef]
- Ding, L.; Zhu, D.; Peng, D.; Zhao, Y. Air pollution and asthma attacks in children: A case–crossover analysis in the city of Chongqing, China. Environ. Pollut. 2017, 220, 348–353. [Google Scholar] [CrossRef]
- Jiao, A.Q.; Xiang, Q.Q.; Ding, Z.; Cao, J.G.; Ho, H.C.; Chen, D.Y.; Cheng, J.; Yang, Z.M.; Zhang, F.X.; Yu, Y.; et al. Short-term impacts of ambient fine particulate matter on emergency department visits: Comparative analysis of three exposure metrics. Chemosphere 2020, 241, 125012. [Google Scholar] [CrossRef]
- Zanobetti, A.; Schwartz, J. Is there adaptation in the ozone mortality relationship: A multi-city case-crossover analysis. Environ. Health 2008, 7, 22. [Google Scholar] [CrossRef]
- Qin, L.; Gu, J.; Liang, S.; Fang, F.; Bai, W.; Liu, X.; Zhao, T.; Walline, J.; Zhang, S.; Cui, Y. Seasonal association between ambient ozone and mortality in Zhengzhou, China. Int. J. Biometeorol. 2017, 61, 1003–1010. [Google Scholar] [CrossRef]
- Gryparis, A.; Forsberg, B.; Katsouyanni, K.; Analitis, A.; Touloumi, G.; Schwartz, J.; Samoli, E.; Medina, S.; Anderson, H.R.; Niciu, E.M. Acute effects of ozone on mortality from the “air pollution and health: A European approach” project. Am. J. Respir. Crit. Care Med. 2004, 170, 1080–1087. [Google Scholar] [CrossRef] [PubMed]
- Lin, Y.K.; Chang, S.C.; Lin, C.; Chen, Y.C.; Wang, Y.C. Comparing ozone metrics on associations with outpatient visits for respiratory diseases in Taipei Metropolitan area. Environ. Pollut. 2013, 177, 177–184. [Google Scholar] [CrossRef] [PubMed]
- Sun, Q.; Wang, W.; Chen, C.; Ban, J.; Xu, D.; Zhu, P.; He, M.Z.; Li, T. Acute effect of multiple ozone metrics on mortality by season in 34 Chinese counties in 2013–2015. J. Intern. Med. 2018, 283, 481–488. [Google Scholar] [CrossRef]
- Shi, W.; Sun, Q.; Du, P.; Tang, S.; Chen, C.; Sun, Z.; Wang, J.; Li, T.; Shi, X. Modification effects of temperature on the ozone–mortality relationship: A nationwide multicounty study in China. Environ. Sci. Technol. 2020, 54, 2859–2868. [Google Scholar] [CrossRef] [PubMed]
- Kazemiparkouhi, F.; Eum, K.D.; Wang, B.Y.; Manjourides, J.; Suh, H.H. Long-term ozone exposures and cause-specific mortality in a US Medicare cohort. J. Expo. Sci. Environ. Epidemiol. 2020, 30, 650–658. [Google Scholar] [CrossRef]
- Chen, K.; Yang, H.B.; Ma, Z.W.; Bi, J.; Huang, L. Influence of temperature to the short-term effects of various ozone metrics on daily mortality in Suzhou, China. Atmos. Environ. 2013, 79, 119–128. [Google Scholar] [CrossRef]
- Li, T.; Yan, M.; Ma, W.; Ban, J.; Liu, T.; Lin, H.; Liu, Z. Short-term effects of multiple ozone metrics on daily mortality in a megacity of China. Environ. Sci. Pollut. Res. 2015, 22, 8738–8746. [Google Scholar] [CrossRef]
- Cheng, L.; Wang, S.; Gong, Z.; Li, H.; Yang, Q.; Wang, Y. Regionalization based on spatial and seasonal variation in ground-level ozone concentrations across China. J. Environ. Sci. 2018, 67, 179–190. [Google Scholar] [CrossRef]
- Pothirat, C.; Chaiwong, W.; Liwsrisakun, C.; Bumroongkit, C.; Deesomchok, A.; Theerakittikul, T.; Limsukon, A.; Tajarernmuang, P.; Phetsuk, N. Acute effects of air pollutants on daily mortality and hospitalizations due to cardiovascular and respiratory diseases. J. Thorac. Dis. 2019, 11, 3070–3083. [Google Scholar] [CrossRef]
- Lu, K.; Kang, J.; Wang, G. The Impact of Air Quality on Cardiovascular Disease in Shanghai. J. Healthc. Eng. 2022, 2022, 4421686. [Google Scholar] [CrossRef]
- Ren, C.; Williams, G.M.; Mengersen, K.; Morawska, L.; Tong, S. Does temperature modify short-term effects of ozone on total mortality in 60 large eastern US communities?—An assessment using the NMMAPS data. Environ. Int. 2008, 34, 451–458. [Google Scholar] [CrossRef] [PubMed]
- Chen, K.; Wolf, K.; Hampel, R.; Stafoggia, M.; Breitner, S.; Cyrys, J.; Samoli, E.; Andersen, Z.J.; Bero-Bedada, G.; Bellander, T.; et al. Does temperature-confounding control influence the modifying effect of air temperature in ozone–mortality associations? Environ. Epidemiol. 2018, 2, e008. [Google Scholar] [CrossRef]
- Pascal, M.; Wagner, V.; Chatignoux, E.; Falq, G.; Corso, M.; Blanchard, M.; Host, S.; Larrieu, S.; Pascal, L.; Declercq, C. Ozone and short-term mortality in nine French cities: Influence of temperature and season. Atmos. Environ. 2012, 62, 566–572. [Google Scholar] [CrossRef]
- Chen, R.; Cai, J.; Meng, X.; Kim, H.; Honda, Y.; Guo, Y.L.; Samoli, E.; Yang, X.; Kan, H. Ozone and daily mortality rate in 21 cities of East Asia: How does season modify the association? Am. J. Epidemiol. 2014, 7, 729–736. [Google Scholar] [CrossRef]
- Murray, C.J.; Aravkin, A.Y.; Zheng, P.; Abbafati, C.; Abbas, K.M.; Abbasi-Kangevari, M.; Abd-Allah, F.; Abdelalim, A.; Abdollahi, M.; Abdollahpour, I. Global burden of 87 risk factors in 204 countries and territories, 1990–2019: A systematic analysis for the Global Burden of Disease Study 2019. Lancet 2020, 396, 1223–1249. [Google Scholar] [CrossRef]
Disclaimer/Publisher’s Note: The statements, opinions and data contained in all publications are solely those of the individual author(s) and contributor(s) and not of MDPI and/or the editor(s). MDPI and/or the editor(s) disclaim responsibility for any injury to people or property resulting from any ideas, methods, instructions or products referred to in the content. |
© 2023 by the authors. Licensee MDPI, Basel, Switzerland. This article is an open access article distributed under the terms and conditions of the Creative Commons Attribution (CC BY) license (https://creativecommons.org/licenses/by/4.0/).