
Origin and Enrichment Mechanisms of Salinity and Fluoride in Sedimentary Aquifers of Datong Basin, Northern China

 ,
, 
Abstract
1. Introduction
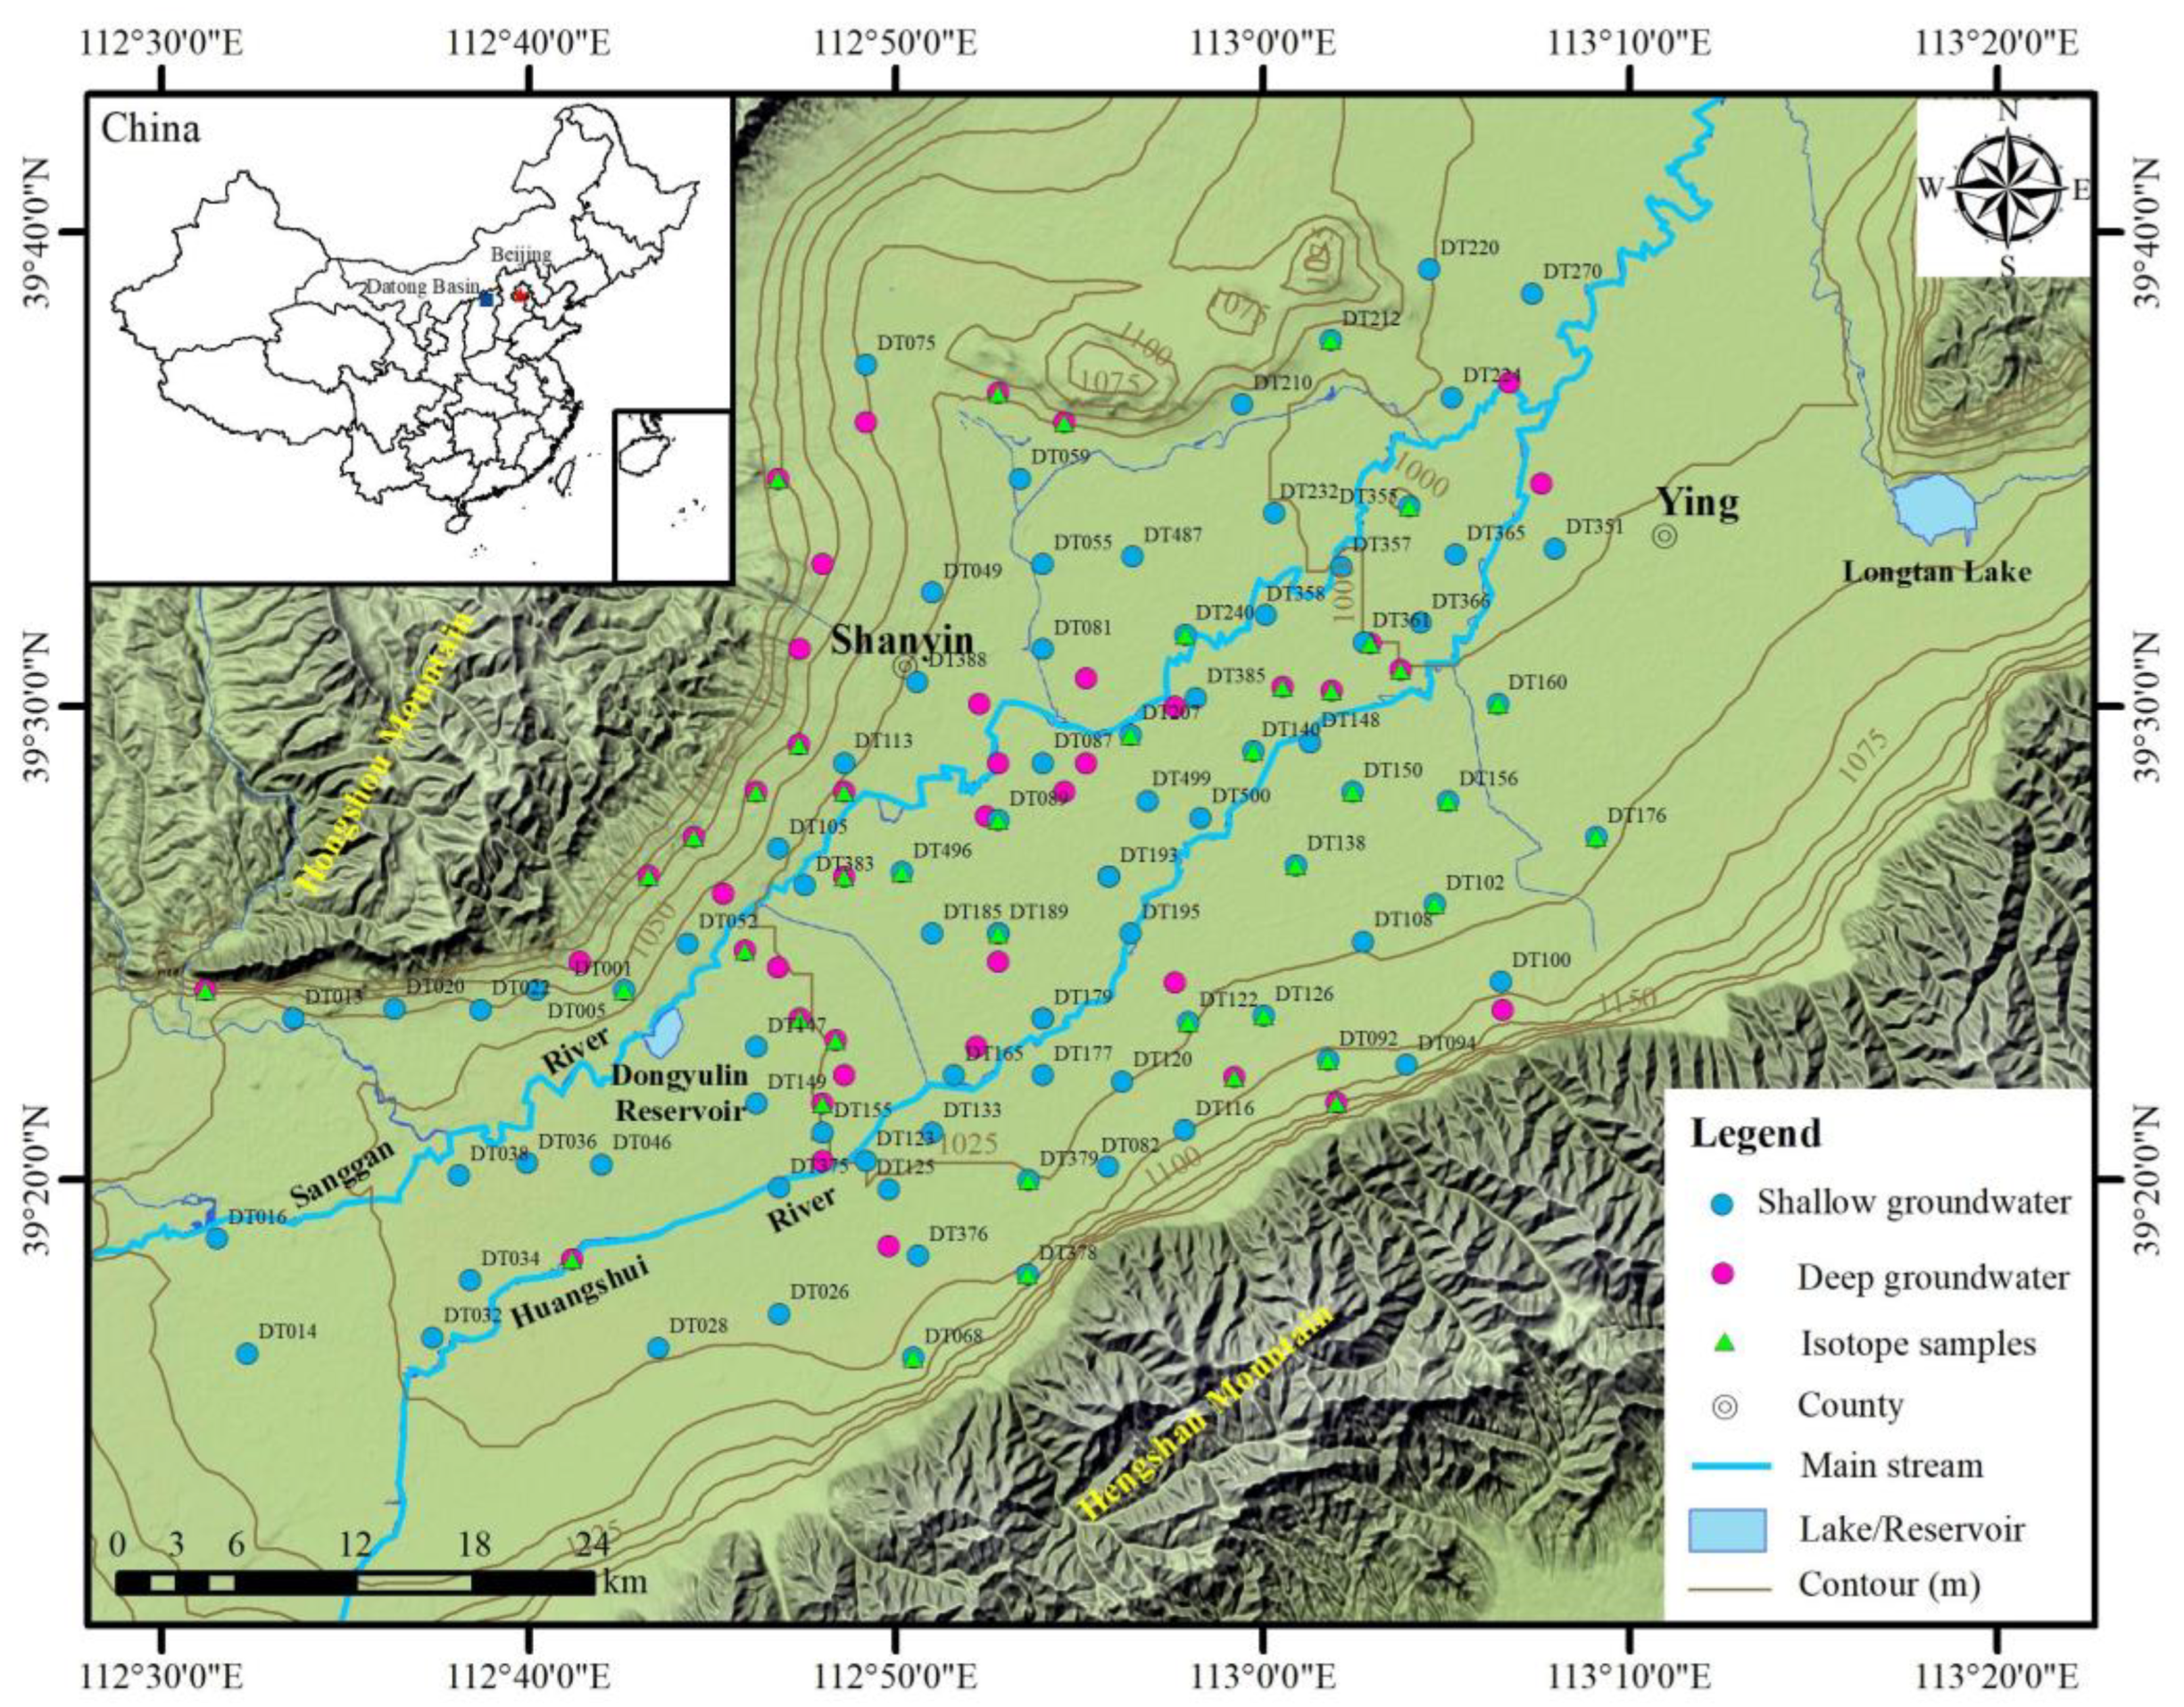
2. Study Area
3. Methodology
3.1. Sampling and Analysis
3.2. Data Processing
4. Results and Discussion
4.1. Hydrochemical Characteristic and Differentiation
4.2. Spatial Distribution of TDS and Fluorides
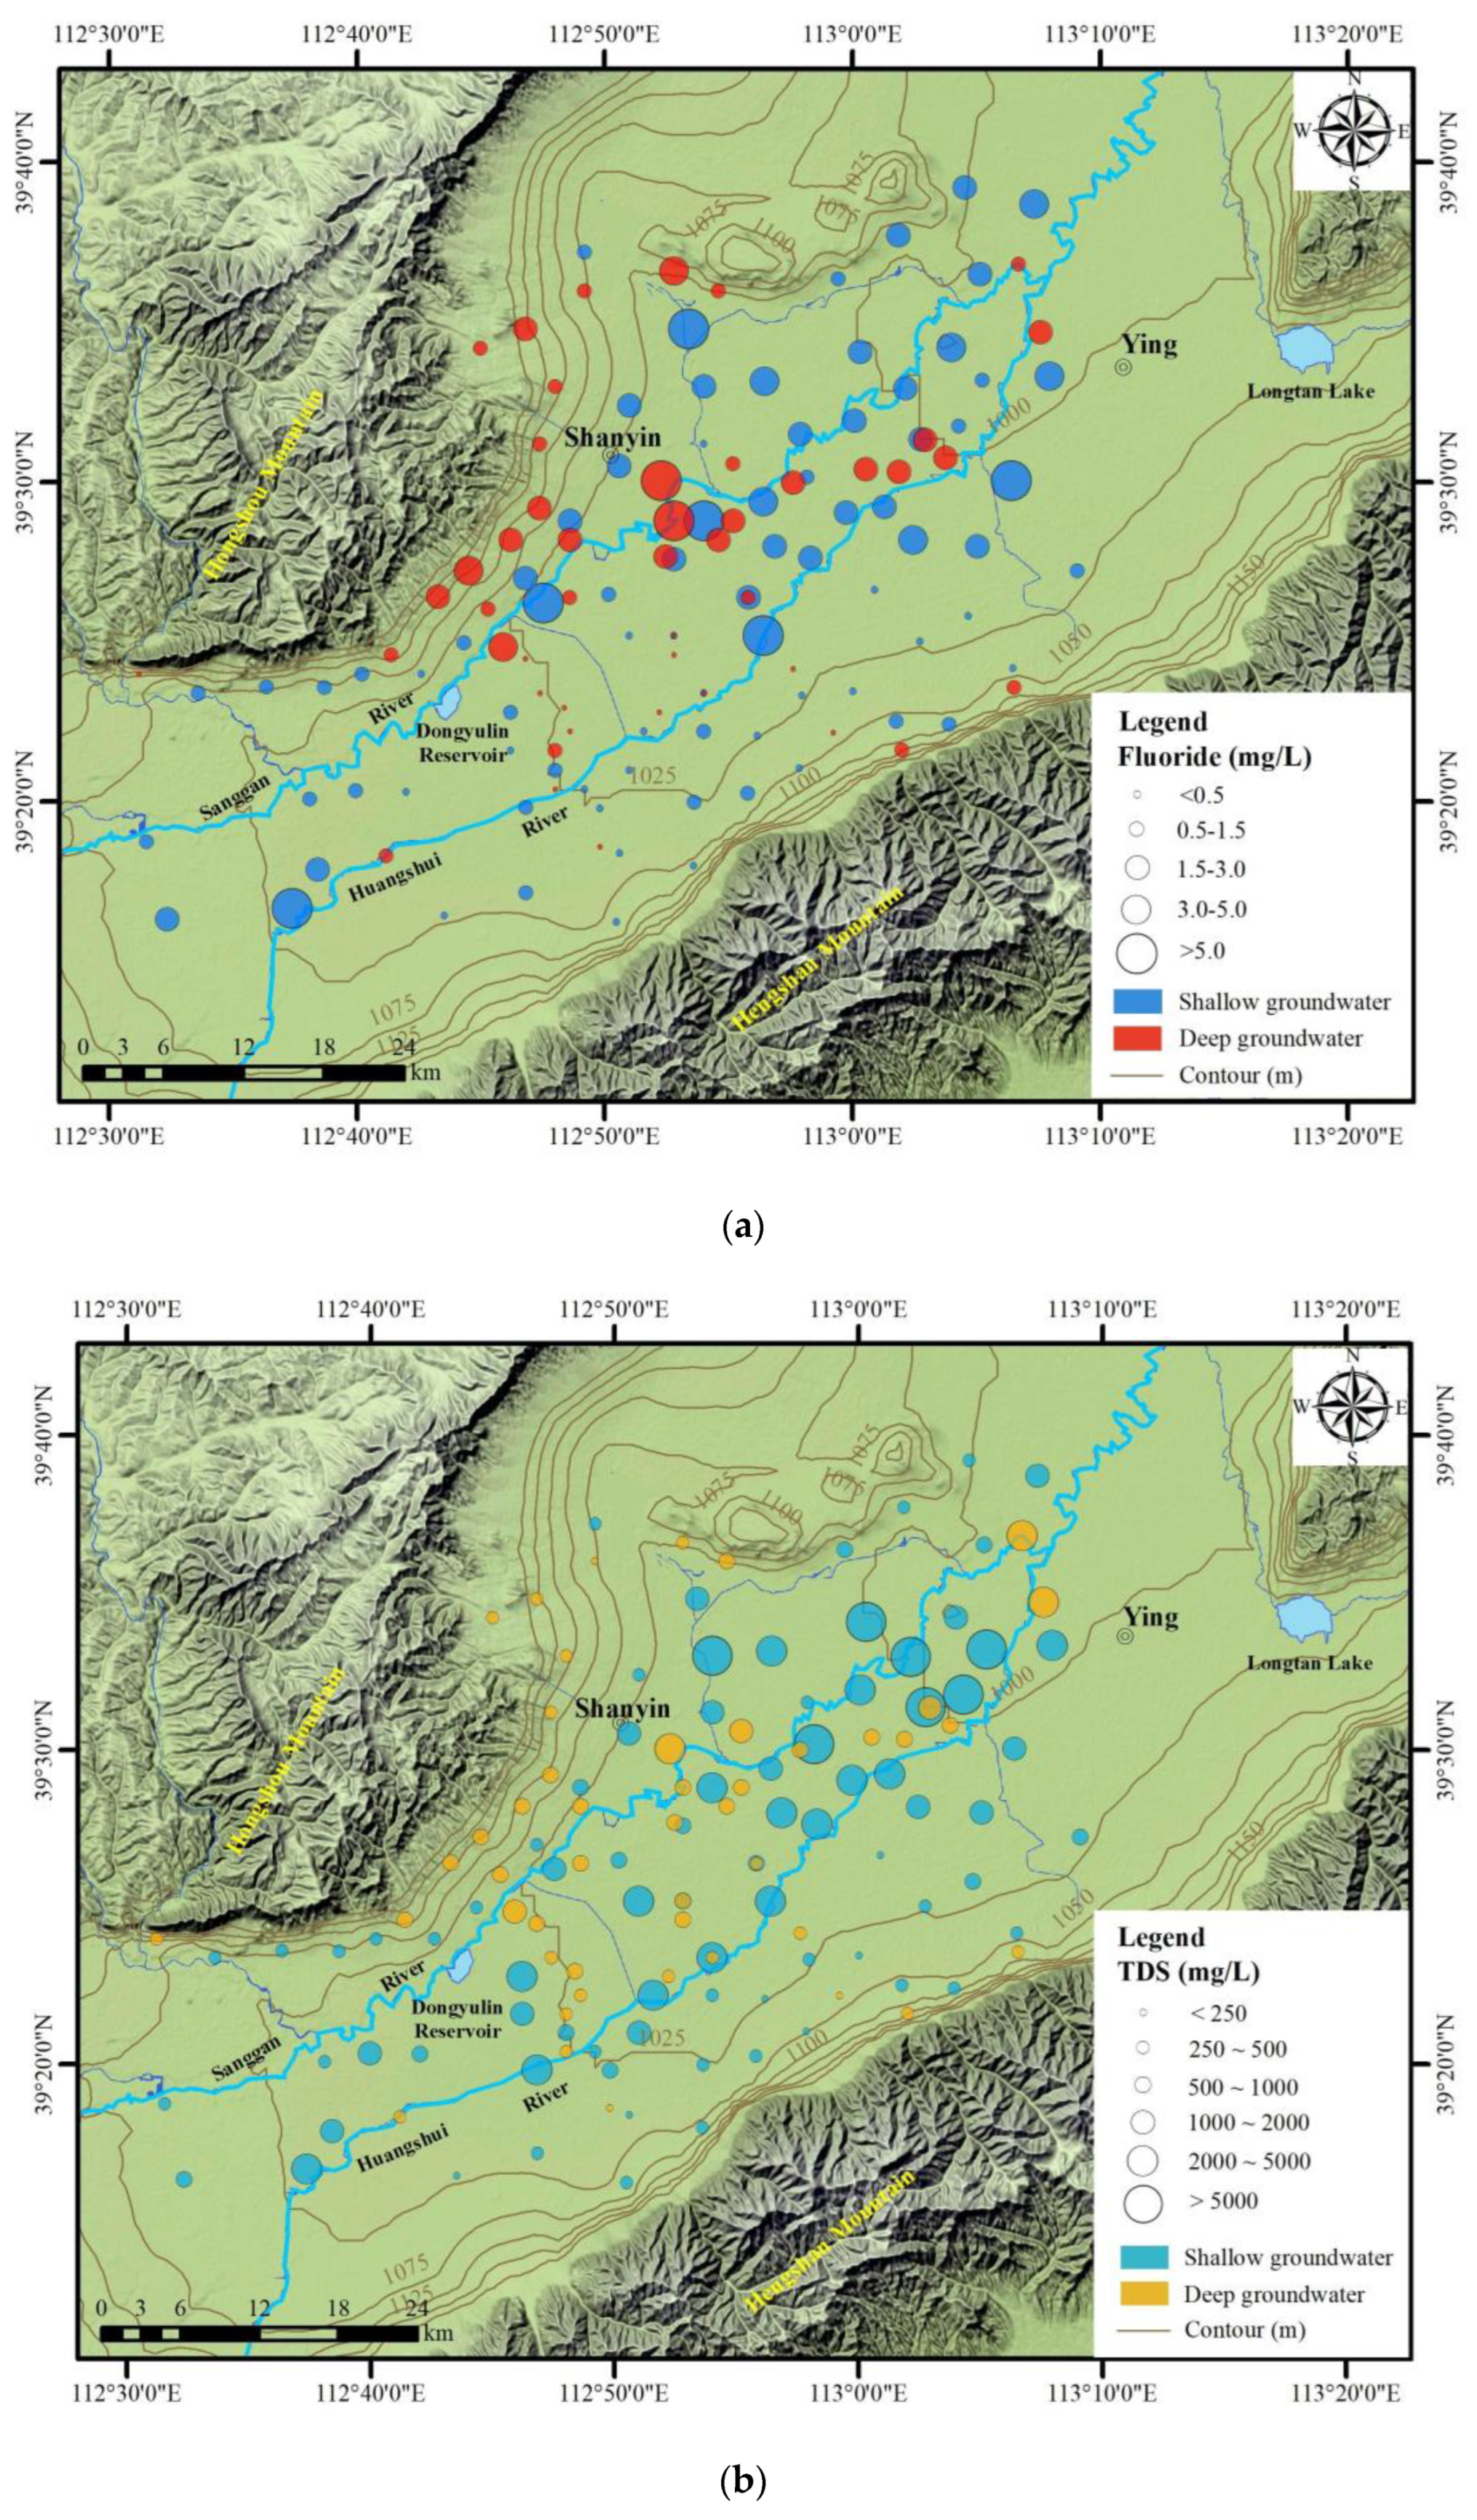
4.2.1. Horizontal Distribution
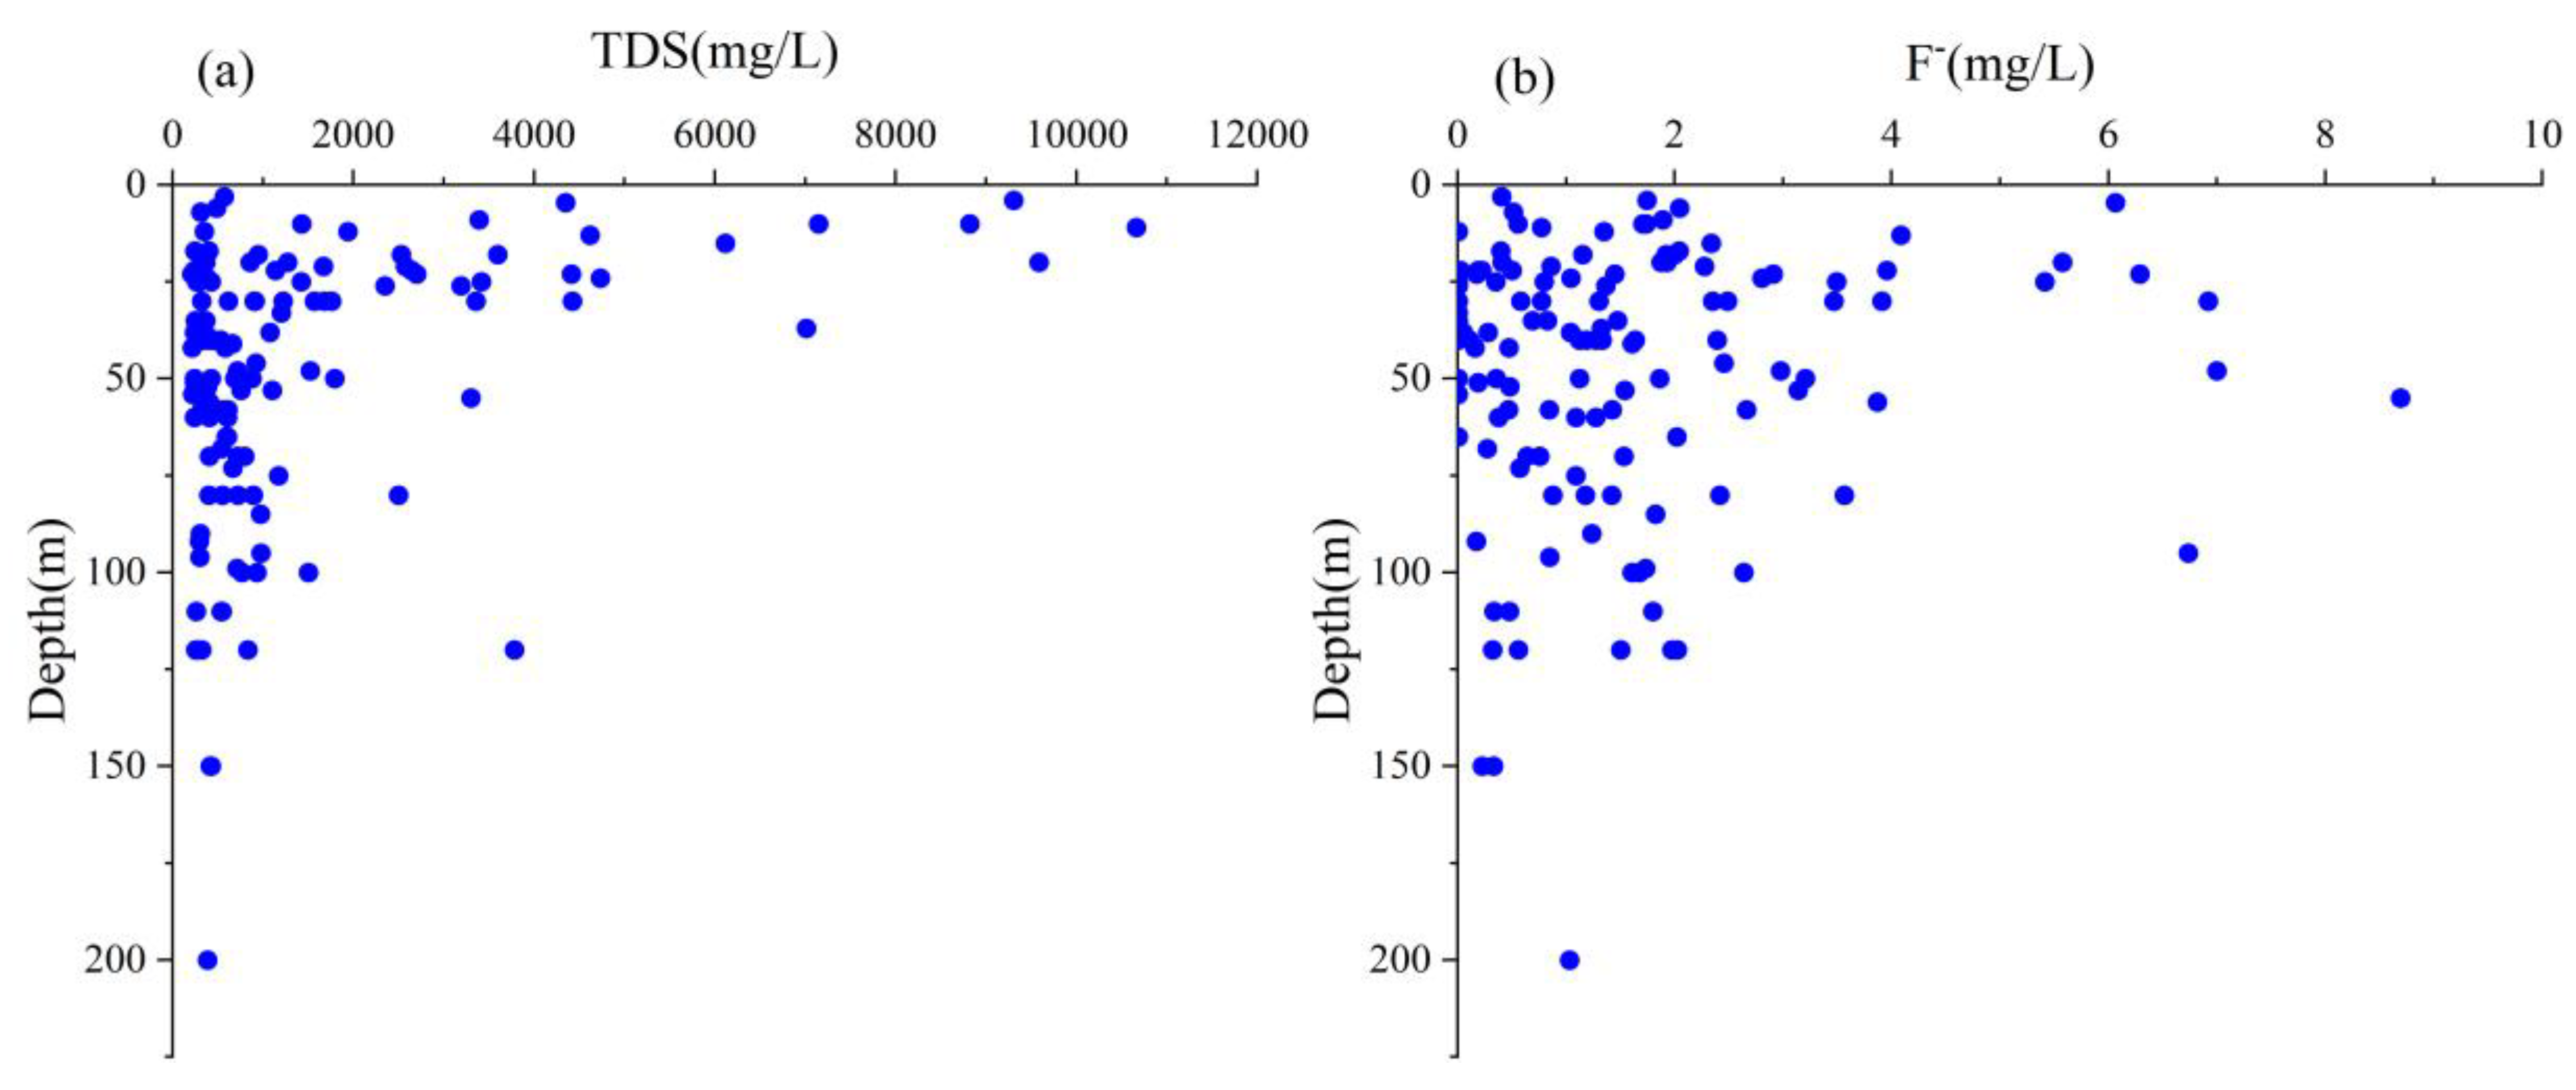
4.2.2. Vertical Distribution
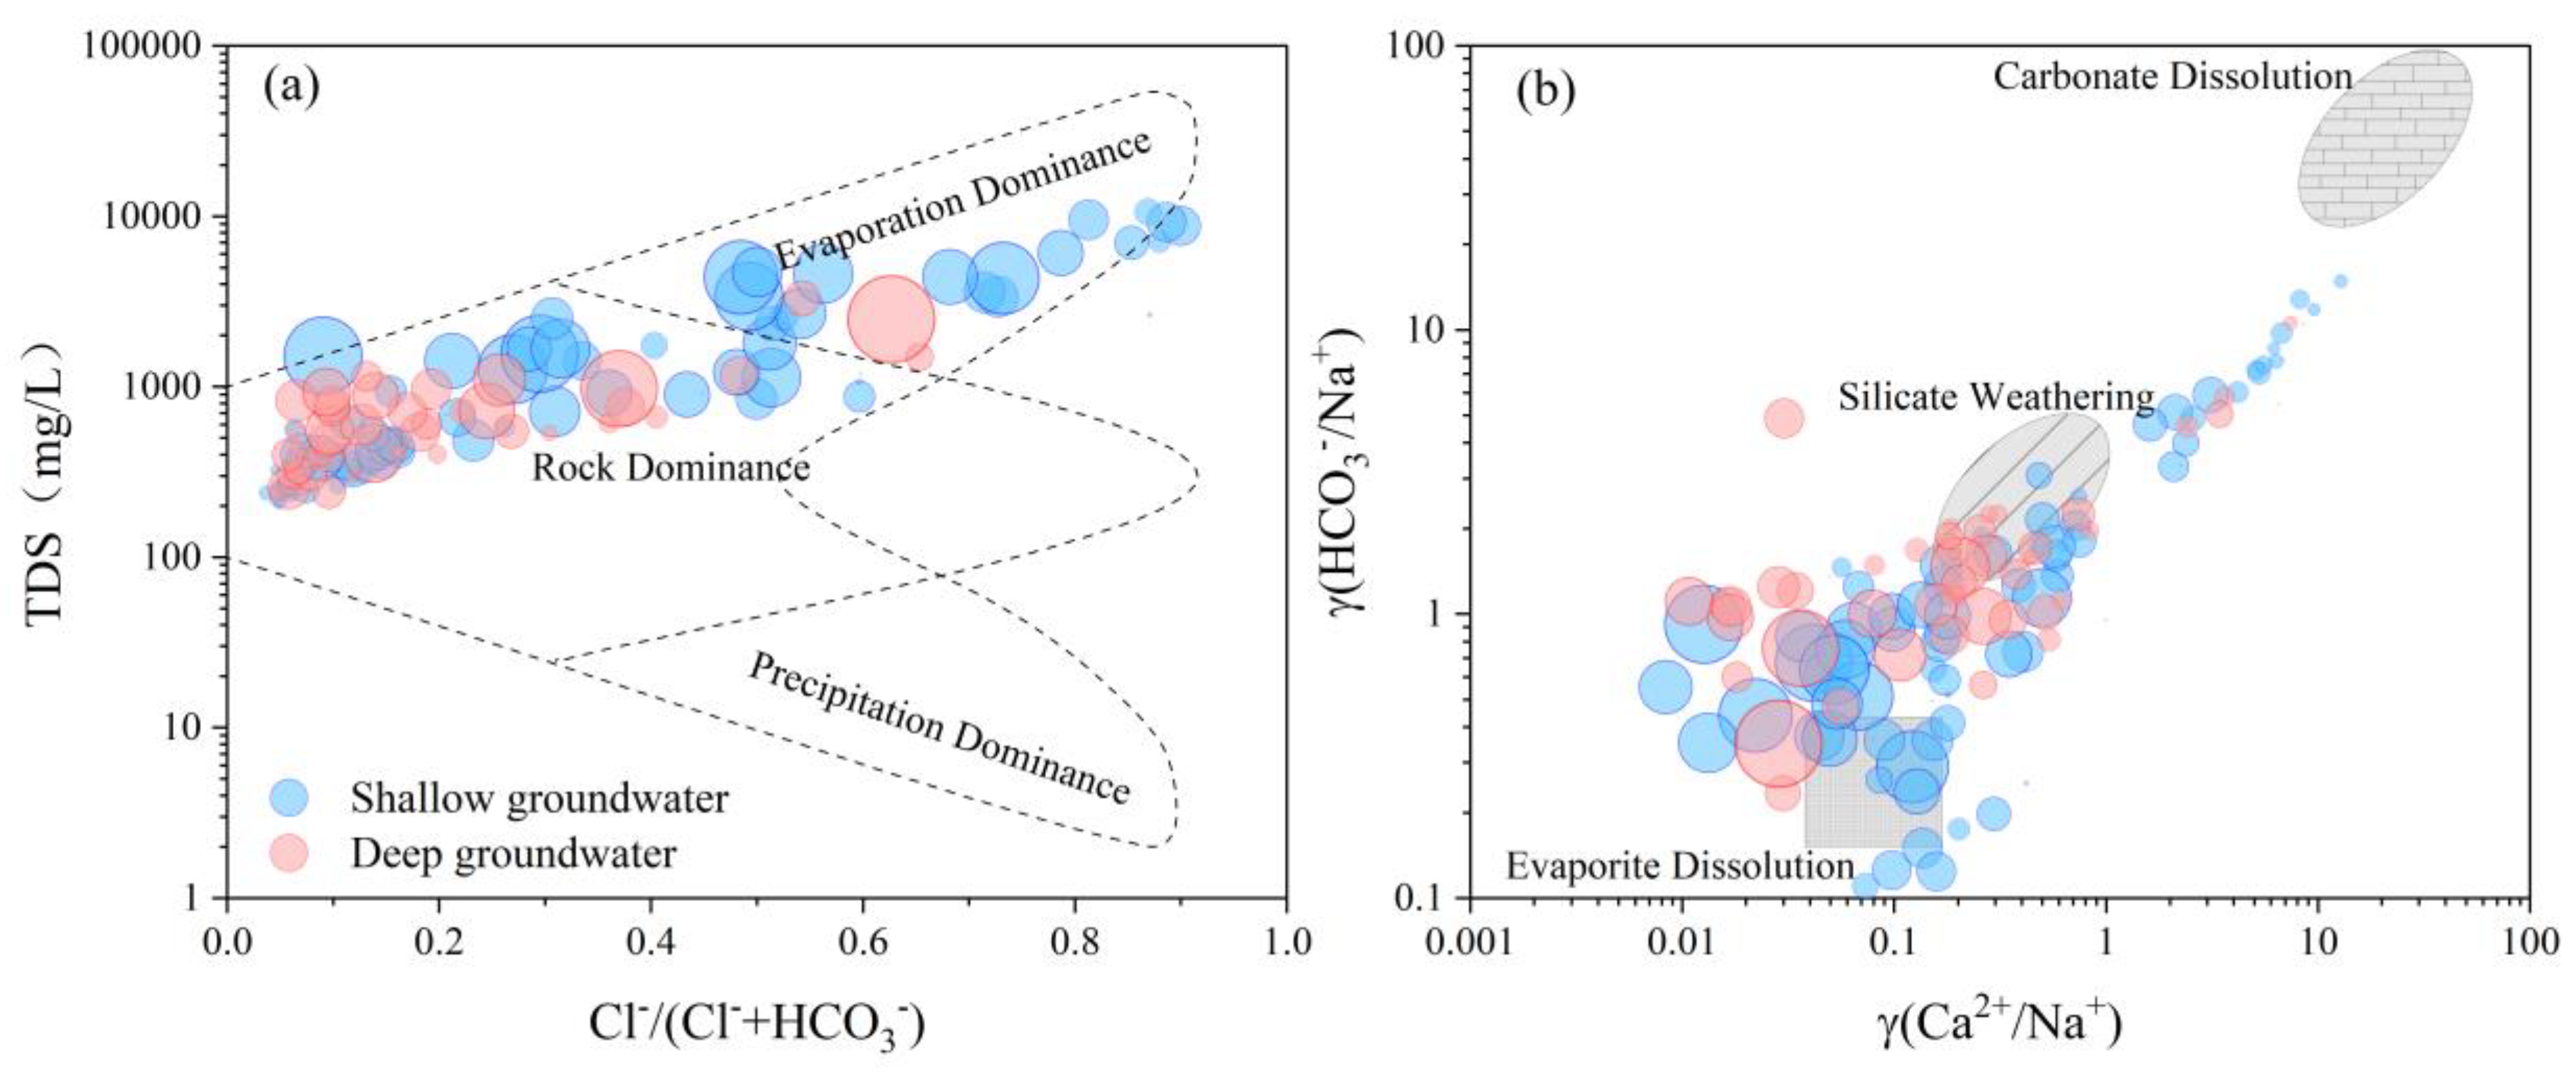
4.3. Hydrochemical Evolution Processes
4.4. Source Appointment by PCA
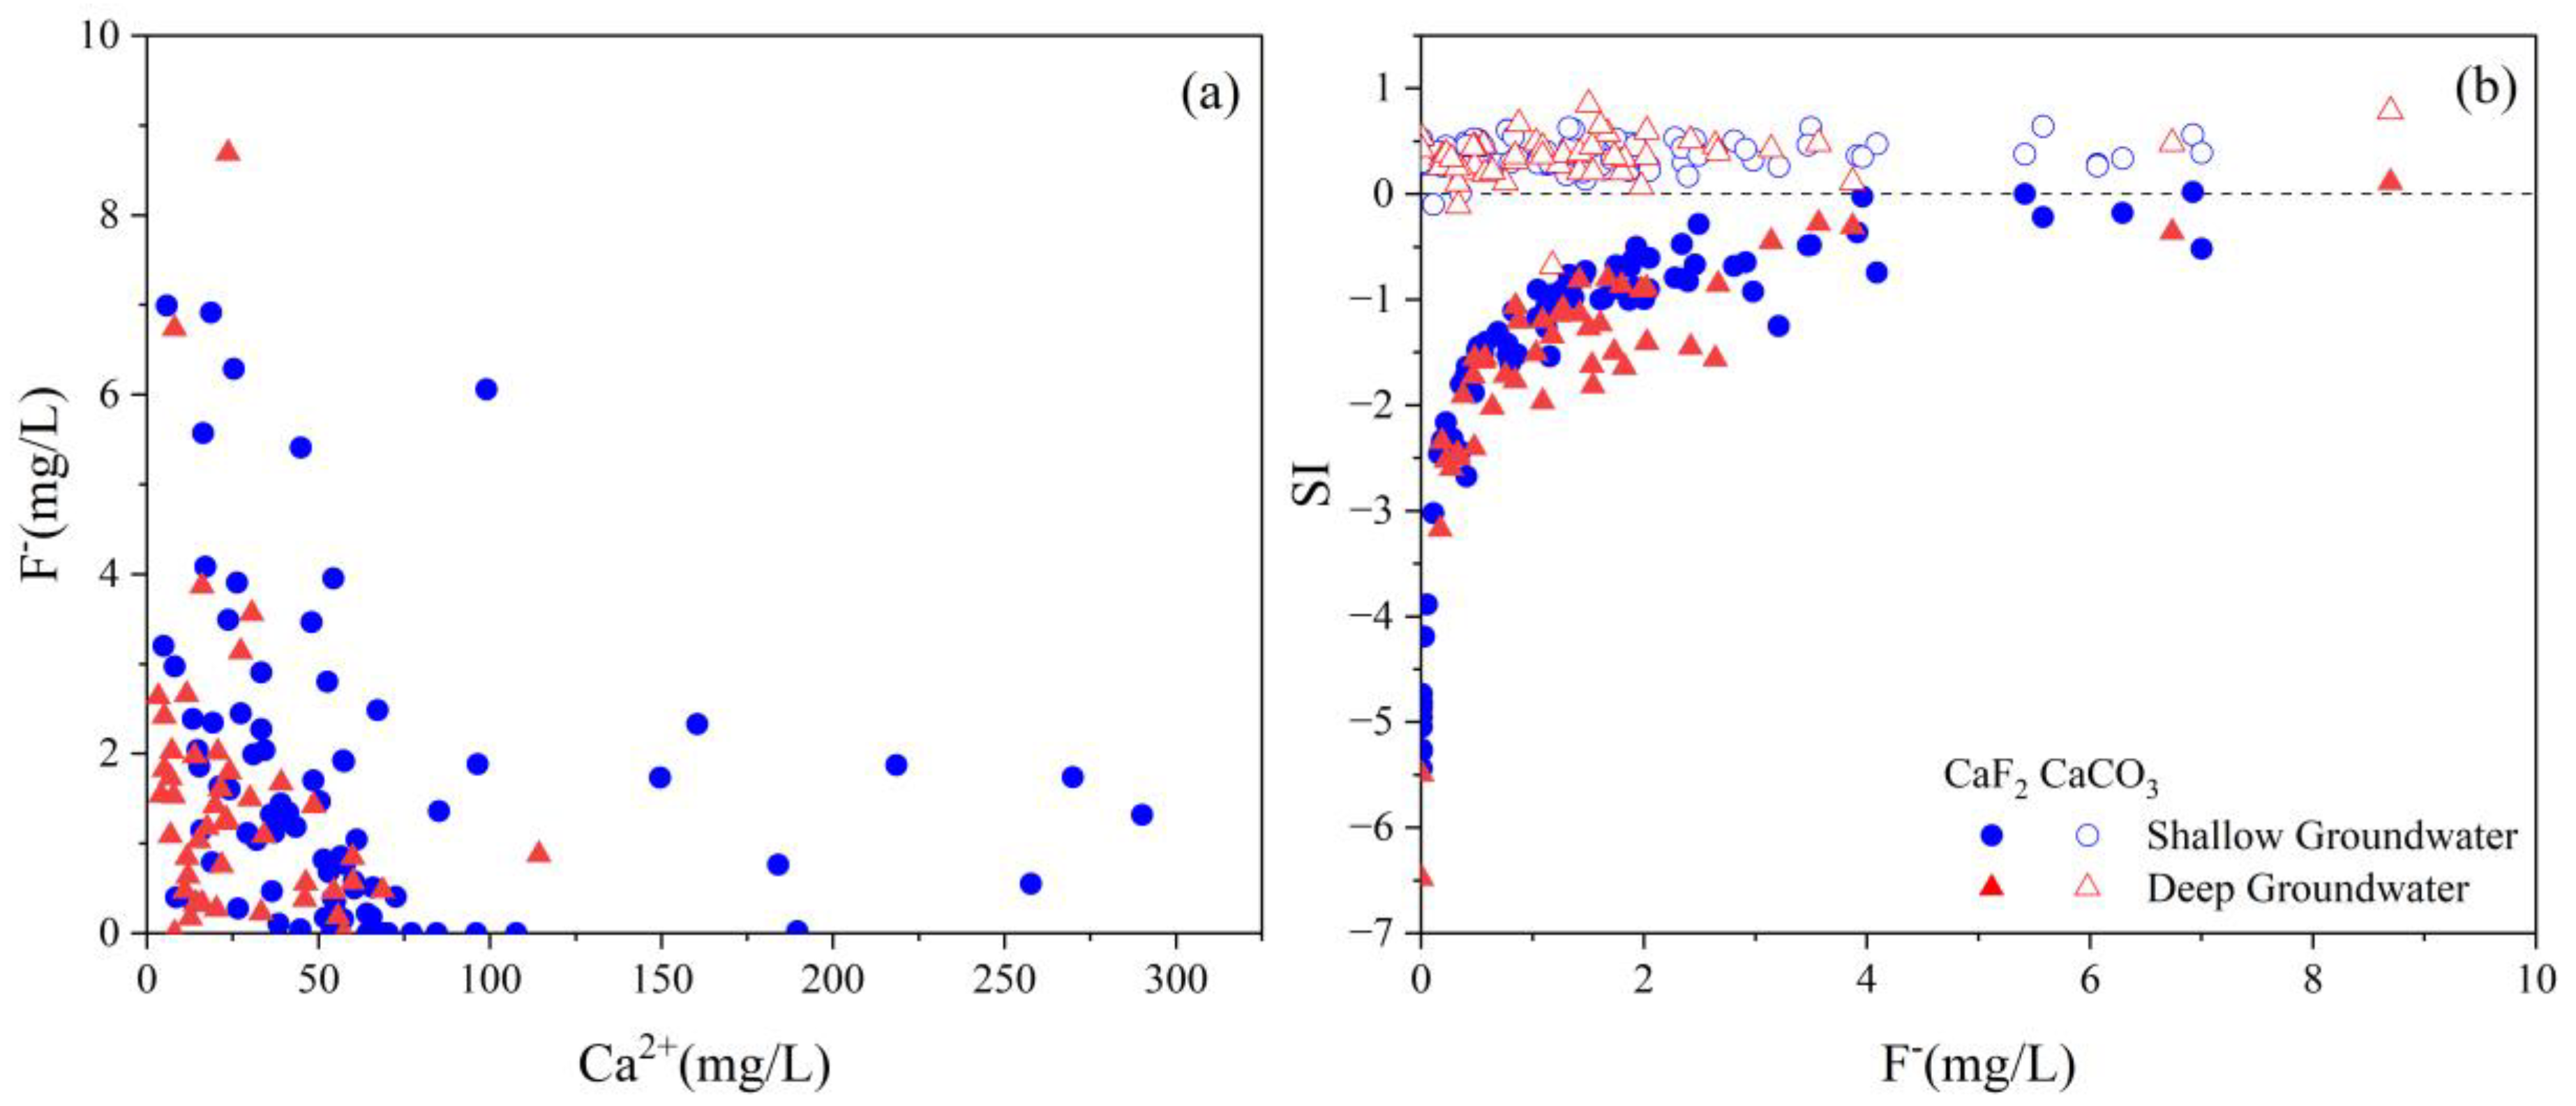
4.5. Key Factors Responsible for High TDS and Fluoride Level
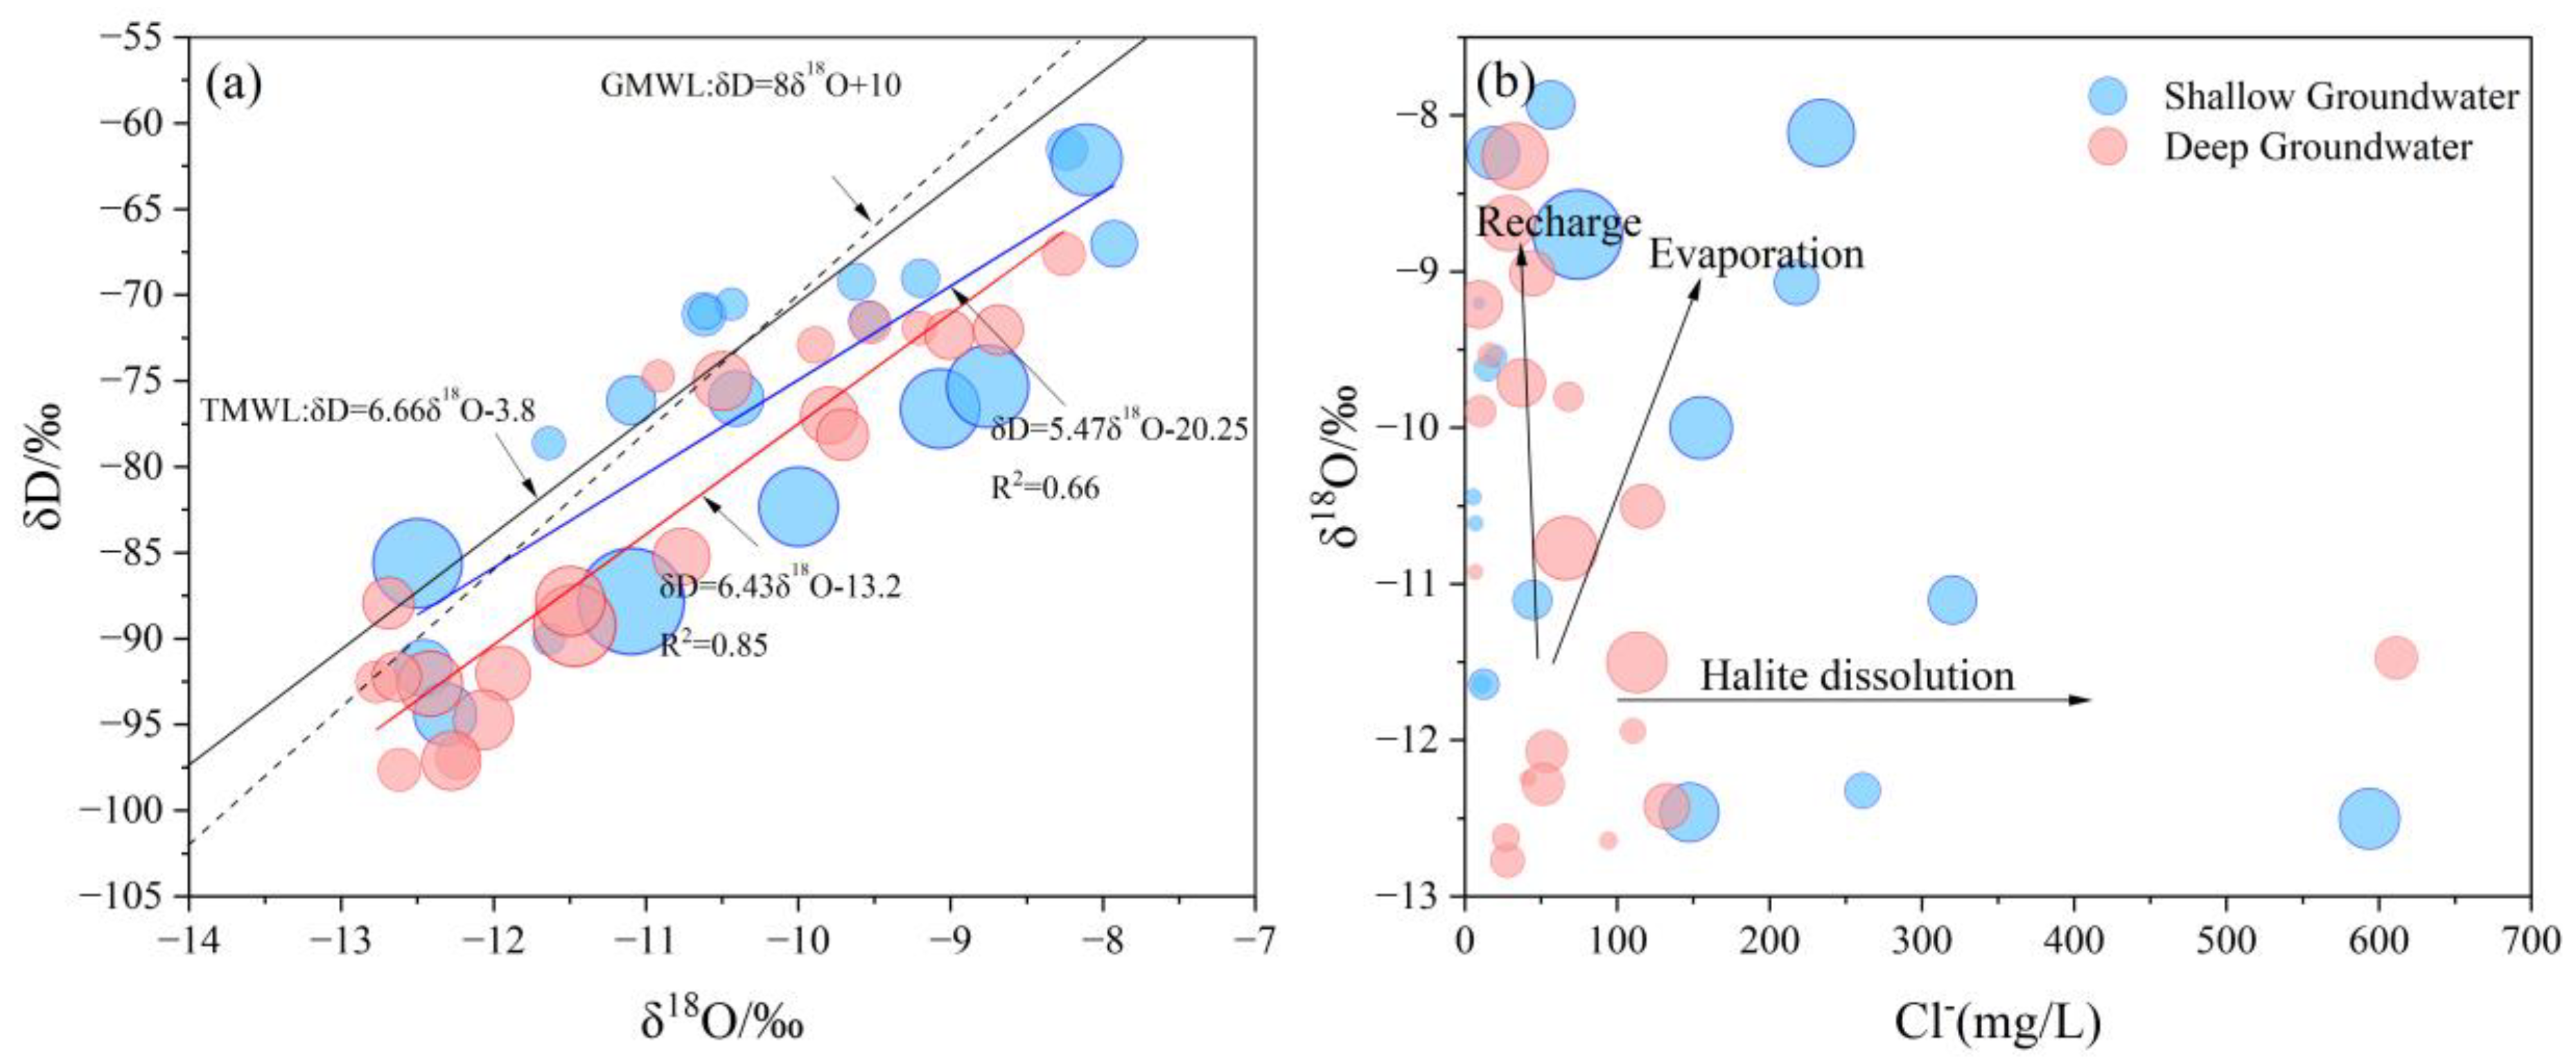
4.5.1. Evaporation
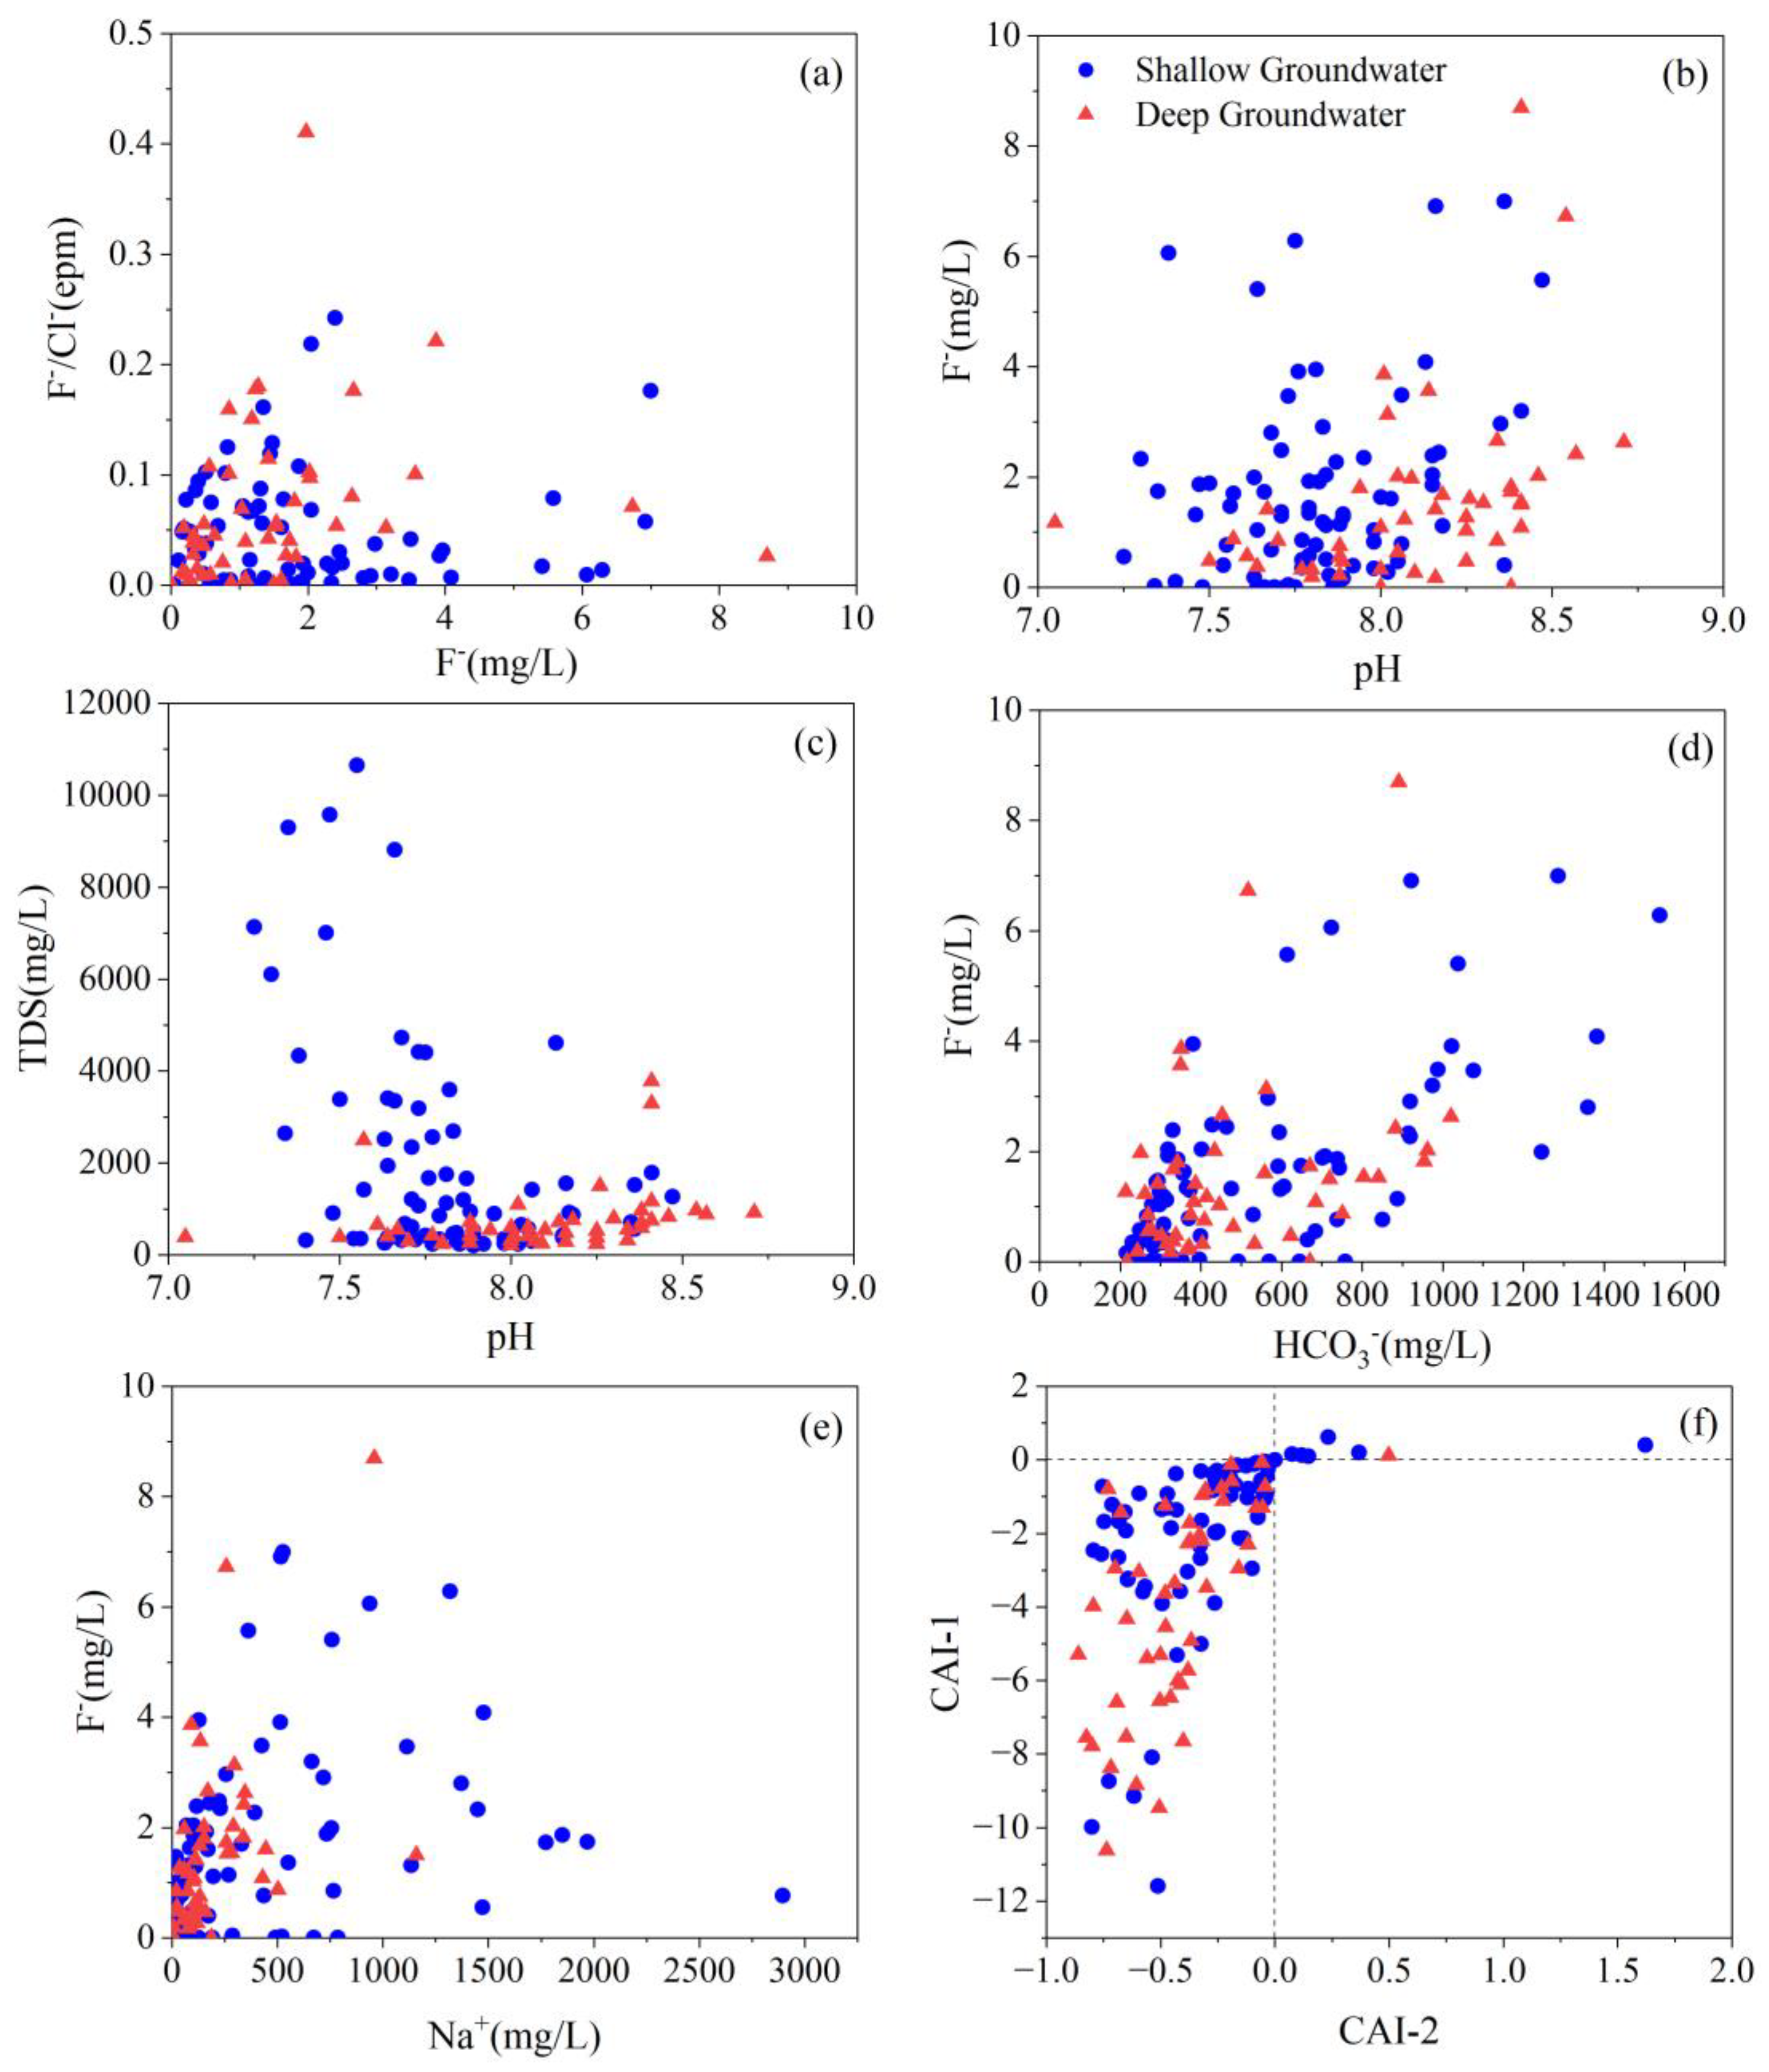
4.5.2. pH and Alkalinity
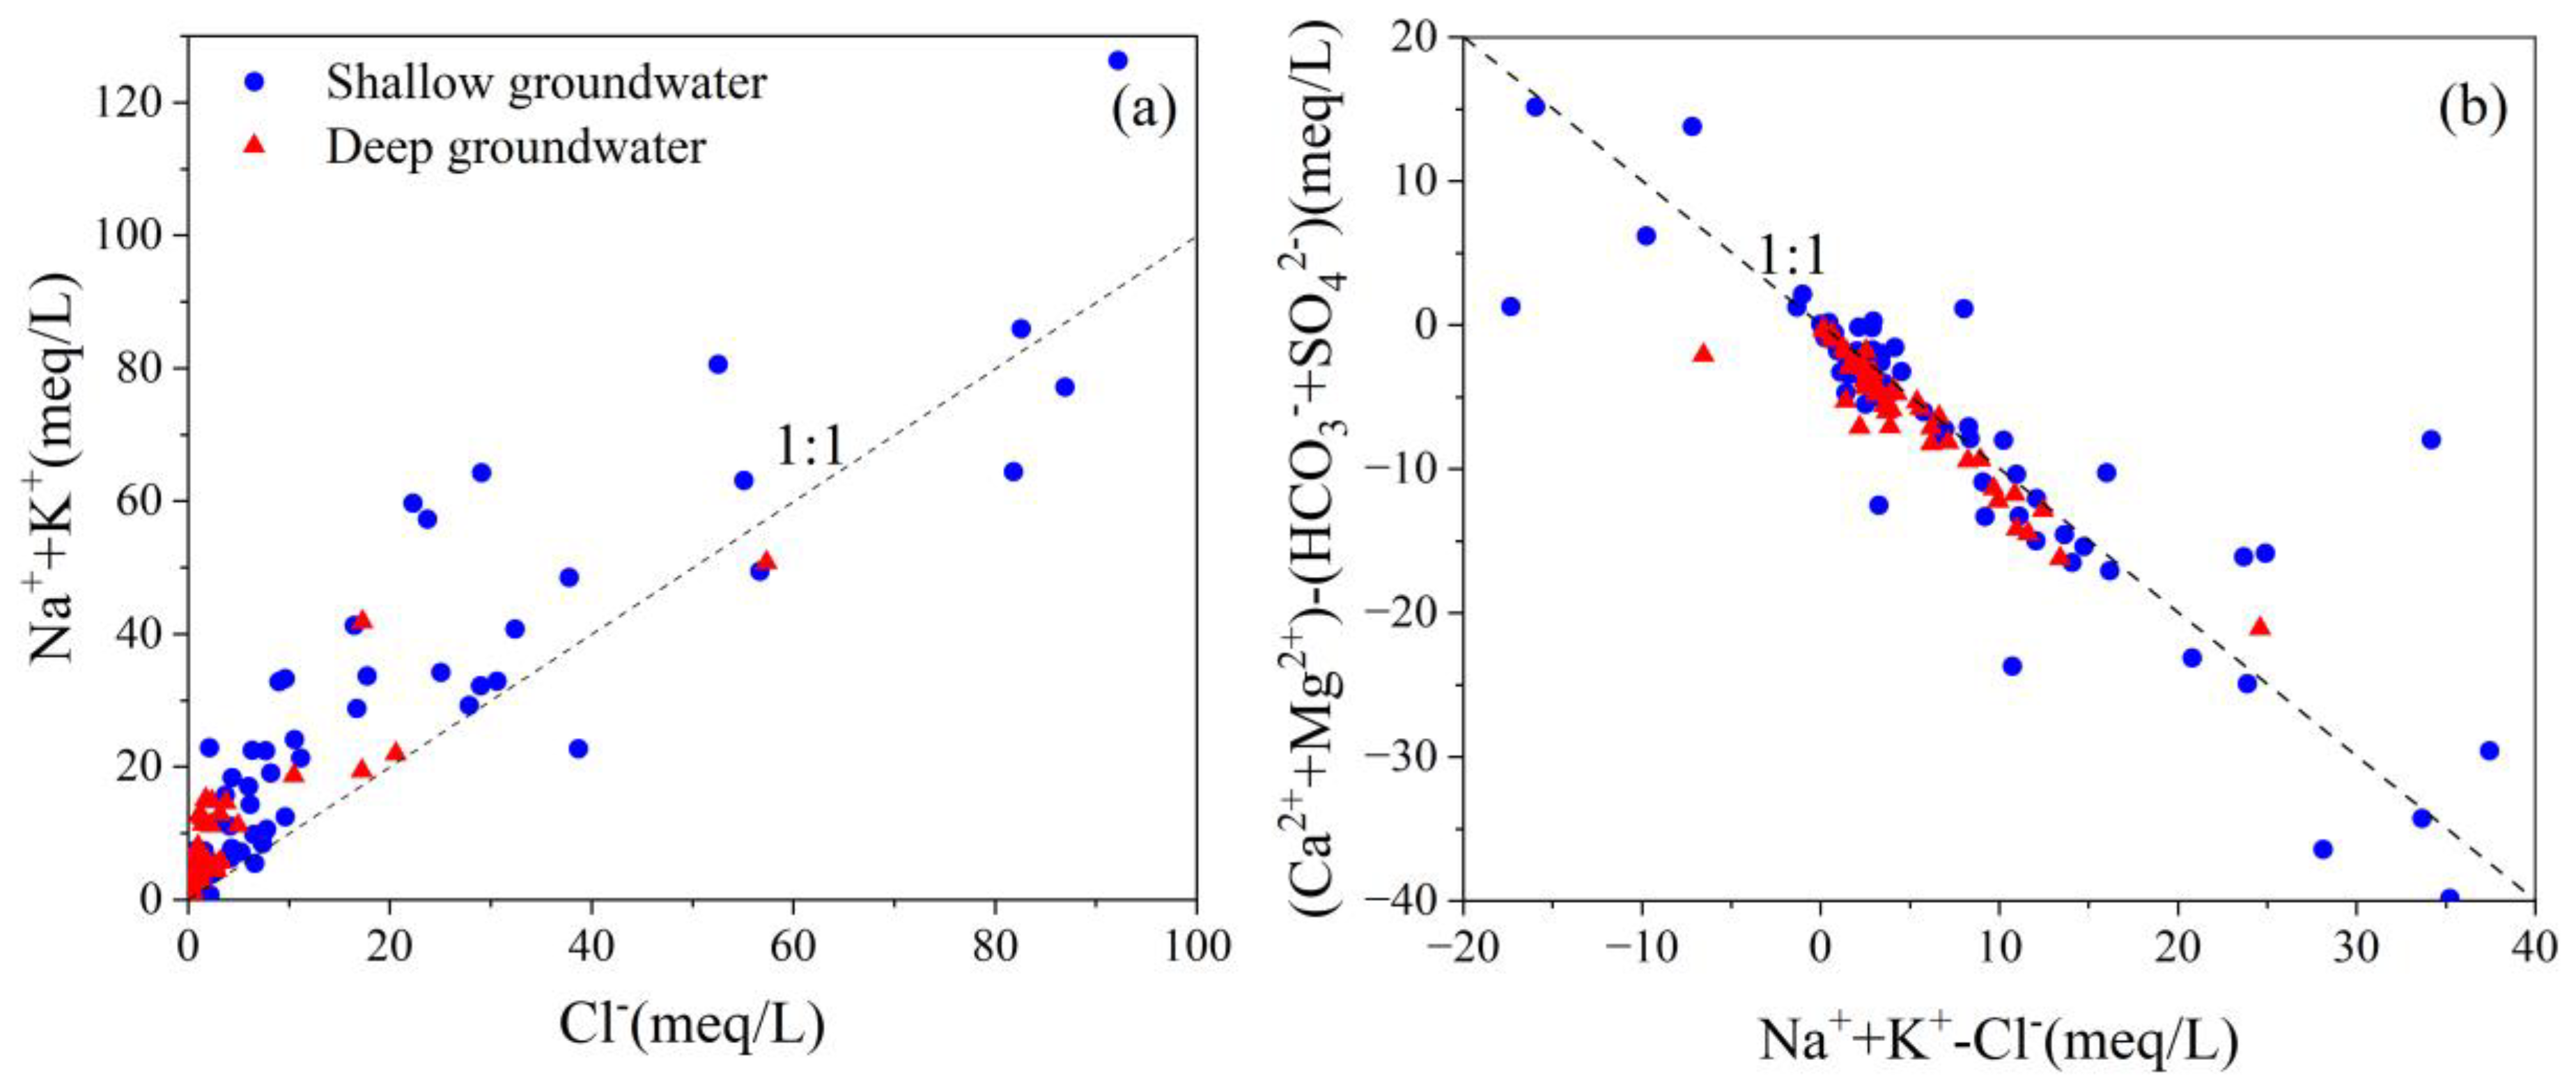
4.5.3. Cation Exchange
5. Conclusions
Author Contributions
Funding
Institutional Review Board Statement
Informed Consent Statement
Acknowledgments
Conflicts of Interest
References
- Brindha, K.; Elango, L. Fluoride in groundwater: Causes, implications and mitigation measures. Fluoride Prop. Appl. Environ. Manag. 2011, 1, 111–136. [Google Scholar]
- Chowdhury, A.; Adak, M.K.; Mukherjee, A.; Dhak, P.; Khatun, J.; Dhak, D. A critical review on geochemical and geological aspects of fluoride belts, fluorosis and natural materials and other sources for alternatives to fluoride exposure. J. Hydrol. 2019, 574, 333–359. [Google Scholar] [CrossRef]
- Han, D.; Currell, M.J. Review of drivers and threats to coastal groundwater quality in China. Sci. Total Environ. 2022, 806 Pt 4, 150913. [Google Scholar] [CrossRef] [PubMed]
- Nikolić, V.; Jokanović, D.; Petrović, J.; Anđelković, A. The assessment of water quality in hygrophilous forests of Ravni Srem. Šumarstvo 2018, 1–2, 155–166. [Google Scholar]
- Wang, Z.; Guo, H.; Xing, S.; Liu, H. Hydrogeochemical and geothermal controls on the formation of high fluoride groundwater. J. Hydrol. 2021, 598, 126372. [Google Scholar] [CrossRef]
- Rao, N.S.; Das, R.; Gugulothu, S. Understanding the factors contributing to groundwater salinity in the coastal region of Andhra Pradesh, India. J. Contam. Hydrol. 2022, 250, 104053. [Google Scholar]
- Qu, S.; Duan, L.; Shi, Z.; Mao, H.; Wang, G.; Liu, T.; Yu, R.; Peng, X. Identifying the spatial pattern, driving factors and potential human health risks of nitrate and fluoride enriched groundwater of Ordos Basin, Northwest China. J. Clean. Prod. 2022, 376, 134289. [Google Scholar] [CrossRef]
- Regenspurg, S.; Virchow, L.; Wilke, F.D.; Zimmer, M.; Jolie, E.; Hachenberger, A.; Yirgu, G.; Gebru, E.F.; Vieth-Hillebrand, A.; Gizaw, B. Origin and migration of fluoride in the area of the Aluto Volcanic Complex (Main Ethiopian Rift). Appl. Geochem. 2022, 146, 105403. [Google Scholar] [CrossRef]
- Nafouanti, M.B.; Li, J.; Mustapha, N.A.; Uwamungu, P.; Al-Alimi, D. Prediction on the fluoride contamination in groundwater at the Datong Basin, Northern China: Comparison of random forest, logistic regression and artificial neural network. Appl. Geochem. 2021, 132, 105054. [Google Scholar] [CrossRef]
- Wang, S.; Chen, J.; Jiang, W.; Zhang, S.; Jing, R.; Yang, S. Identifying the geochemical evolution and controlling factors of the shallow groundwater in a high fluoride area, Feng County, China. Environ. Sci. Pollut. Res. 2022. [Google Scholar] [CrossRef]
- Jia, H.; Qian, H.; Qu, W.; Zheng, L.; Feng, W.; Ren, W. Fluoride Occurrence and Human Health Risk in Drinking Water Wells from Southern Edge of Chinese Loess Plateau. Int. J. Environ. Res. Public Health 2019, 16, 1683. [Google Scholar] [CrossRef] [PubMed]
- Li, J.; Zhou, H.; Qian, K.; Xie, X.; Xue, X.; Yang, Y.; Wang, Y. Fluoride and iodine enrichment in groundwater of North China Plain: Evidences from speciation analysis and geochemical modeling. Sci. Total Environ. 2017, 598, 239–248. [Google Scholar] [CrossRef] [PubMed]
- Qasemi, M.; Darvishian, M.; Nadimi, H.; Gholamzadeh, M.; Afsharnia, M.; Farhang, M.; Allahdadi, M.; Darvishian, M.; Zarei, A. Characteristics, water quality index and human health risk from nitrate and fluoride in Kakhk city and its rural areas, Iran. J. Food Compos. Anal. 2023, 115, 104870. [Google Scholar] [CrossRef]
- Qiu, H.; Gui, H.; Xu, H.; Cui, L.; Yu, H. Occurrence, controlling factors and noncarcinogenic risk assessment based on Monte Carlo simulation of fluoride in mid-layer groundwater of Huaibei mining area, North China. Sci. Total Environ. 2022, 856 Pt 2, 159112. [Google Scholar] [CrossRef]
- WHO. Guidelines for Drinking Water Quality; World Health Organization: Geneva, Switzerland, 2022.
- Kimambo, V.; Bhattacharya, P.; Mtalo, F.; Mtamba, J.; Ahmad, A. Fluoride occurrence in groundwater systems at global scale and status of defluoridation—State of the art. Groundw. Sustain. Dev. 2019, 9, 100223. [Google Scholar] [CrossRef]
- Jaydhar, A.K.; Pal, S.C.; Saha, A.; Islam, A.R.M.T.; Ruidas, D. Hydrogeochemical evaluation and corresponding health risk from elevated arsenic and fluoride contamination in recurrent coastal multi-aquifers of eastern India. J. Clean. Prod. 2022, 369, 133150. [Google Scholar] [CrossRef]
- Mukherjee, I.; Singh, U.K.; Singh, R.P.; Anshumali; Kumari, D.; Jha, P.K.; Mehta, P. Characterization of heavy metal pollution in an anthropogenically and geologically influenced semi-arid region of east India and assessment of ecological and human health risks. Sci. Total Environ. 2019, 705, 135801. [Google Scholar] [CrossRef]
- Qiao, W.; Cao, W.; Gao, Z.; Pan, D.; Ren, Y.; Li, Z.; Zhang, Z. Contrasting behaviors of groundwater arsenic and fluoride in the lower reaches of the Yellow River basin, China: Geochemical and modeling evidences. Sci. Total Environ. 2022, 851, 158134. [Google Scholar] [CrossRef]
- Hu, B.; Song, X.; Lu, Y.; Liang, S.; Liu, G. Fluoride enrichment mechanisms and related health risks of groundwater in the transition zone of geomorphic units, northern China. Environ Res. 2022, 212 Pt D, 113588. [Google Scholar] [CrossRef]
- Su, H.; Wang, J.; Liu, J. Geochemical factors controlling the occurrence of high-fluoride groundwater in the western region of the Ordos basin, northwestern China. Environ. Pollut. 2019, 252 Pt B, 1154–1162. [Google Scholar] [CrossRef]
- Hao, C.; Wang, Y.; He, K.; Gui, H. Seasonal distribution of deep groundwater fluoride, geochemical factors and ecological risk for irrigation in the Shendong mining area, China. Front. Environ. Sci. 2022, 10, 1957. [Google Scholar] [CrossRef]
- Su, C.; Wang, Y.; Xie, X.; Li, J. Aqueous geochemistry of high-fluoride groundwater in Datong Basin, Northern China. J. Geochem. Explor. 2013, 135, 79–92. [Google Scholar] [CrossRef]
- Su, C.; Wang, Y.; Xie, X.; Zhu, Y. An isotope hydrochemical approach to understand fluoride release into groundwaters of the Datong Basin, Northern China. Environ. Sci. Process. Impacts 2015, 17, 791–801. [Google Scholar] [CrossRef]
- Yang, F.; Jia, C.; Yang, X.; Yang, H.; Chang, W. Probabilistic potential health risk quantification, hydrochemistry, driving forces of groundwater nitrate and fluoride in a typical irrigation district, Northern China. J. Environ. Manag. 2022, 323, 116171. [Google Scholar] [CrossRef] [PubMed]
- Nadiri, A.A.; Aghdam, F.S.; Razzagh, S.; Barzegar, R.; Jabraili-Andaryan, N.; Senapathi, V. Using a soft computing OSPRC risk framework to analyze multiple contaminants from multiple sources; a case study from Khoy Plain, NW Iran. Chemosphere 2022, 308, 136527. [Google Scholar] [CrossRef]
- Nadiri, A.A.; Sedghi, Z.; Barzegar, R.; Nikoo, M.R. Establishing a Data Fusion Water Resources Risk Map Based on Aggregating Drinking Water Quality and Human Health Risk Indices. Water 2022, 14, 3390. [Google Scholar] [CrossRef]
- Nadiri, A.A.; Sedghi, Z.; Khatibi, R. Qualitative risk aggregation problems for the safety of multiple aquifers exposed to nitrate, fluoride and arsenic contaminants by a ‘Total Information Management’ framework. J. Hydrol. 2021, 595, 126011. [Google Scholar] [CrossRef]
- Kumari, R.; Chander, K.S.; Datta, P.S.; Singh, N.; Mukherjee, S. Geochemical modelling, ionic ratio and GIS based mapping of groundwater salinity and assessment of governing processes in Northern Gujarat, India. Environ. Earth. Sci. 2013, 69, 2377–2391. [Google Scholar]
- Huang, L.; Sun, Z.; Zhou, A.; Bi, J.; Liu, Y. Source and enrichment mechanism of fluoride in groundwater of the Hotan Oasis within the Tarim Basin, Northwestern China. Environ. Pollut. 2022, 300, 118962. [Google Scholar] [CrossRef]
- Moussaoui, I.; Rosa, E.; Cloutier, V.; Neculita, C.M.; Dassi, L. Chemical and isotopic evaluation of groundwater salinization processes in the Djebeniana coastal aquifer, Tunisia. Appl. Geochem. 2023, 149, 105555. [Google Scholar] [CrossRef]
- Li, J.; Wang, Y.; Zhu, C.; Xue, X.; Qian, K.; Xie, X.; Wang, Y. Hydrogeochemical processes controlling the mobilization and enrichment of fluoride in groundwater of the North China Plain. Sci Total Environ. 2020, 730, 138877. [Google Scholar] [CrossRef] [PubMed]
- Li, J.; Wang, Y.; Guo, W.; Xie, X.; Zhang, L.; Liu, Y.; Kong, S. Iodine mobilization in groundwater system at Datong basin, China: Evidence from hydrochemistry and fluorescence characteristics. Sci. Total Environ. 2013, 468, 738–745. [Google Scholar] [CrossRef] [PubMed]
- Li, J.; Wang, Y.; Xie, X.; Su, C. Hierarchical cluster analysis of arsenic and fluoride enrichments in groundwater from the Datong basin, Northern China. J. Geochem. Explor. 2012, 118, 77–89. [Google Scholar] [CrossRef]
- Wang, Y.; Shvartsev, S.L.; Su, C. Genesis of arsenic/fluoride-enriched soda water: A case study at Datong, northern China. Appl. Geochem. 2009, 24, 641–649. [Google Scholar] [CrossRef]
- GB/T 14848-2017; Standard for Ground Water Quality. Standradization-Administration: Huizhou, China, 2018.
- MOH. National Standards of the People’s Republic of China—Standards for Drinking Water Quality; Ministry of Health: Beijing, China, 2022. [Google Scholar]
- USEPA. Drinking Water Standards and Health Advisories; Office of Water U.S. Environmental Protection Agency: Washington, DC, USA, 2022.
- WHO. Guidelines for Drinking-Water Quality: Fourth Edition Incorporating the First Addendum; World Health Organization: Geneva, Switzerland, 2017.
- Hounslow, A. Water Quality Data: Analysis and Interpritation; CRC Press: Boca Raton, FL, USA, 1995. [Google Scholar]
- Wilcox, L.V. Classification and Use of Irrigation Water; USDA Circular: Washington, DC, USA, 1955.
- Magesh, N.S.; Chandrasekar, N.; Elango, L. Occurrence and distribution of fluoride in the groundwater of the Tamiraparani River basin, South India: A geostatistical modeling approach. Environ. Earth Sci. 2016, 75, 1483. [Google Scholar] [CrossRef]
- Liu, H.; Guo, H.; Yang, L.; Wu, L.; Li, F.; Li, S.; Ni, P.; Liang, X. Occurrence and formation of high fluoride groundwater in the Hengshui area of the North China Plain. Environ. Earth Sci. 2015, 74, 2329–2340. [Google Scholar] [CrossRef]
- Kaka, E.A.; Akiti, T.T.; Nartey, V.K.; Bam, E.K.P.; Adomako, D. Hydrochemistry and evaluation of groundwater suitability for irrigation and drinking purposes in the southeastern Volta river basin: Manya krobo area, Ghana. Elixier. Agriculture 2011, 39, 4793–4807. [Google Scholar]
- Yan, J.; Chen, J.; Zhang, W.; Ma, F. Determining fluoride distribution and influencing factors in groundwater in Songyuan, Northeast China, using hydrochemical and isotopic methods. J. Geochem. Explor. 2020, 217, 106605. [Google Scholar] [CrossRef]
- Sun, Z.; Ma, R.; Wang, Y. Using Landsat data to determine land use changes in Datong basin, China. Environ. Geol. 2008, 57, 1825–1837. [Google Scholar] [CrossRef]
- Wang, Y.; Zheng, C.; Ma, R. Review: Safe and sustainable groundwater supply in China. Hydrogeol. J. 2018, 26, 1301–1324. [Google Scholar] [CrossRef]
- Cloutier, V.; Lefebvre, R.; Therrien, R.; Savard, M.M. Multivariate statistical analysis of geochemical data as indicative of the hydrogeochemical evolution of groundwater in a sedimentary rock aquifer system. J. Hydrol. 2008, 353, 294–313. [Google Scholar] [CrossRef]
- Li, C.; Gao, X.; Zhang, X.; Wang, Y.; Howard, K. Groundwater fluoride and arsenic mobilization in a typical deep aquifer system within a semi-arid basin. J. Hydrol. 2022, 609, 127767. [Google Scholar] [CrossRef]
- Mamatha, P.; Rao, S.M. Geochemistry of fluoride rich groundwater in Kolar and Tumkur Districts of Karnataka. Environ. Earth Sci. 2009, 61, 131–142. [Google Scholar] [CrossRef]
- Furi, W.; Razack, M.; Abiye, T.A.; Ayenew, T.; Legesse, D. Fluoride enrichment mechanism and geospatial distribution in the volcanic aquifers of the Middle Awash basin, Northern Main Ethiopian Rift. J. Afr. Earth Sci. 2011, 60, 315–327. [Google Scholar] [CrossRef]
- Xie, X.; Wang, Y.; Su, C.; Duan, M. Effects of recharge and discharge on delta2H and delta18O composition and chloride concentration of high arsenic/fluoride groundwater from the Datong Basin, northern China. Water. Environ. Res. 2013, 85, 113–123. [Google Scholar] [CrossRef] [PubMed]
- Guo, H.; Zhang, Y.; Xing, L.; Jia, Y. Spatial variation in arsenic and fluoride concentrations of shallow groundwater from the town of Shahai in the Hetao basin, Inner Mongolia. Appl. Geochem. 2012, 27, 2187–2196. [Google Scholar] [CrossRef]
- Sreedevi, P.; Ahmed, S.; Made, B.; Ledoux, E.; Gandolfi, J. Association of hydrological factors in temporal variations offluoride concentration in a crystalline aquifer in India. Environ. Geol. 2006, 50, 1–11. [Google Scholar] [CrossRef]
- Saxena, V.; Ahmed, S. Inferring the chemical parameters for the dissolution of fluoride in groundwater. Environ. Geol. 2003, 43, 731–736. [Google Scholar] [CrossRef]
- Gomez, D.E.; Alvarez, P.J.J. Modeling the natural attenuation of benzene in groundwater impacted by ethanol-blended fuels: Effect of ethanol content on the lifespan and maximum length of benzene plumes. Water Resour. Res. 2009, 45. [Google Scholar] [CrossRef]
- Hu, S.; Tiang, L.; Chuangyong, L. Principal component analysis of fluoride geochemistry of grounwater in Shanxi and Inner Mongolia, China. J. Geochem. Explor. 2013, 135, 124–129. [Google Scholar] [CrossRef]
- Lin, D.; Wang, W.; Tian, H.; Yang, X. Chemical Characteristics of Shallow High-Fluoride Groundwater in Guanzhong Basin, China. In Proceedings of the 2009 3rd International Conference on Bioinformatics and Biomedical Engineering, ICBBE 2009, Beijing, China, 11–13 June 2009; pp. 1–5. [Google Scholar]
- Guo, H.; Wang, Y. Geochemical characteristics of shallow groundwater in Datong basin, northwestern China. J. Geochem. Explor. 2005, 87, 109–120. [Google Scholar] [CrossRef]
- Wu, Y.; Wang, Y. Geochemical evolution of groundwater salinity at basin scale: A case study from Datong basin, northern China. Environ. Sci. Process. Impacts 2014, 16, 1469–1479. [Google Scholar] [CrossRef] [PubMed]
- Xie, X.; Wang, Y.; Ellis, A.; Su, C.; Li, J.; Li, M.; Duan, M. Delineation of groundwater flow paths using hydrochemical and strontium isotope composition: A case study in high arsenic aquifer systems of the Datong basin, northern China. J. Hydrol. 2013, 476, 87–96. [Google Scholar] [CrossRef]


| Chemical Parameters | Min | Max | Mean | SD | China- Standard for Groundwater Quality (GB/T 14848-2017) [36] | WHO Guideline for Drinking Water Quality (2017) [35] |
|---|---|---|---|---|---|---|
| T (°C) | 9.6 | 17.8 | 12.1 | 1.6 | - | - |
| pH | 7.05 | 8.71 | 7.91 | 0.31 | - | - |
| EC (µs/cm) | 206 | 22,600 | 2531 | 3581 | - | - |
| TDS (mg/L) | 208.9 | 10,661 | 1462 | 2021 | 1000 | 1000 |
| F− (mg/L) | 0.01 | 8.69 | 1.61 | 1.65 | 1 | 1.5 |
| Cl− (mg/L) | 5.31 | 3272 | 336.7 | 650.8 | 250 | 250 |
| NO3− (mg/L) | 0.05 | 1118 | 63.41 | 160.2 | 20 | 50 |
| SO42−(mg/L) | 0.05 | 4456 | 317.9 | 630.8 | 250 | 250 |
| HCO3− (mg/L) | 214 | 1537 | 525.9 | 288.2 | - | - |
| K+ (mg/L) | 0.01 | 326.8 | 7.99 | 31.21 | - | - |
| Na+ (mg/L) | 5.89 | 2895 | 342.3 | 479.3 | 200 | - |
| Ca2+ (mg/L) | 3.22 | 290 | 48.68 | 50.85 | - | - |
| Mg2+ (mg/L) | 4.30 | 773.3 | 80.1 | 134 | - | - |
| Li (mg/L) | 0.01 | 0.33 | 0.07 | 0.05 | - | - |
| Ba (mg/L) | 0.06 | 2.23 | 0.64 | 0.399 | 0.7 | 0.7 |
| Sr (mg/L) | 0.17 | 8.07 | 1.25 | 1.43 | - | - |
| Fe (mg/L) | 0.00 | 0.71 | 0.03 | 0.08 | 0.3 | Not exceeding 0.1 |
| Mn (mg/L) | 0.00 | 1.12 | 0.08 | 0.17 | 0.1 | Not exceeding 0.05 |
| Component | ||||
|---|---|---|---|---|
| PC1 | PC2 | PC3 | PC4 | |
| TDS | 0.97 | 0.06 | 0.21 | 0.1 |
| EC | 0.95 | 0.04 | 0.22 | 0.07 |
| Cl− | 0.94 | −0.05 | 0.16 | 0.06 |
| Mg2+ | 0.94 | −0.15 | 0.17 | 0.02 |
| Na+ | 0.94 | 0.23 | 0.14 | 0.11 |
| SO42− | 0.93 | −0.03 | 0.13 | 0.02 |
| Ca2+ | 0.72 | −0.53 | 0.34 | 0.02 |
| F− | 0.09 | 0.78 | 0.47 | 0.08 |
| HCO3− | 0.49 | 0.72 | −0.05 | 0.24 |
| pH | −0.37 | 0.69 | −0.18 | −0.22 |
| NO3− | 0.46 | 0.03 | 0.79 | 0.24 |
| K+ | 0.03 | 0.03 | 0.15 | 0.97 |
| Eigenvalues | 7.07 | 2.01 | 1.14 | 0.57 |
| Variance (%) | 58.93 | 16.72 | 9.47 | 4.77 |
| Cumulative (%) | 58.93 | 75.66 | 85.13 | 89.9 |
Disclaimer/Publisher’s Note: The statements, opinions and data contained in all publications are solely those of the individual author(s) and contributor(s) and not of MDPI and/or the editor(s). MDPI and/or the editor(s) disclaim responsibility for any injury to people or property resulting from any ideas, methods, instructions or products referred to in the content. |
© 2023 by the authors. Licensee MDPI, Basel, Switzerland. This article is an open access article distributed under the terms and conditions of the Creative Commons Attribution (CC BY) license (https://creativecommons.org/licenses/by/4.0/).
Share and Cite
Wang, X.; Weerasinghe, R.N.N.; Su, C.; Wang, M.; Jiang, J. Origin and Enrichment Mechanisms of Salinity and Fluoride in Sedimentary Aquifers of Datong Basin, Northern China. Int. J. Environ. Res. Public Health 2023, 20, 1832. https://doi.org/10.3390/ijerph20031832
Wang X, Weerasinghe RNN, Su C, Wang M, Jiang J. Origin and Enrichment Mechanisms of Salinity and Fluoride in Sedimentary Aquifers of Datong Basin, Northern China. International Journal of Environmental Research and Public Health. 2023; 20(3):1832. https://doi.org/10.3390/ijerph20031832
Chicago/Turabian StyleWang, Xianguo, Ranpatiyalage Nishamani Nuwandika Weerasinghe, Chunli Su, Mengzhu Wang, and Jiaqi Jiang. 2023. "Origin and Enrichment Mechanisms of Salinity and Fluoride in Sedimentary Aquifers of Datong Basin, Northern China" International Journal of Environmental Research and Public Health 20, no. 3: 1832. https://doi.org/10.3390/ijerph20031832
APA StyleWang, X., Weerasinghe, R. N. N., Su, C., Wang, M., & Jiang, J. (2023). Origin and Enrichment Mechanisms of Salinity and Fluoride in Sedimentary Aquifers of Datong Basin, Northern China. International Journal of Environmental Research and Public Health, 20(3), 1832. https://doi.org/10.3390/ijerph20031832