


Spatial Cognition of the Visually Impaired: A Case Study in a Familiar Environment


Abstract
1. Introduction
2. Materials and Methods
2.1. Overview
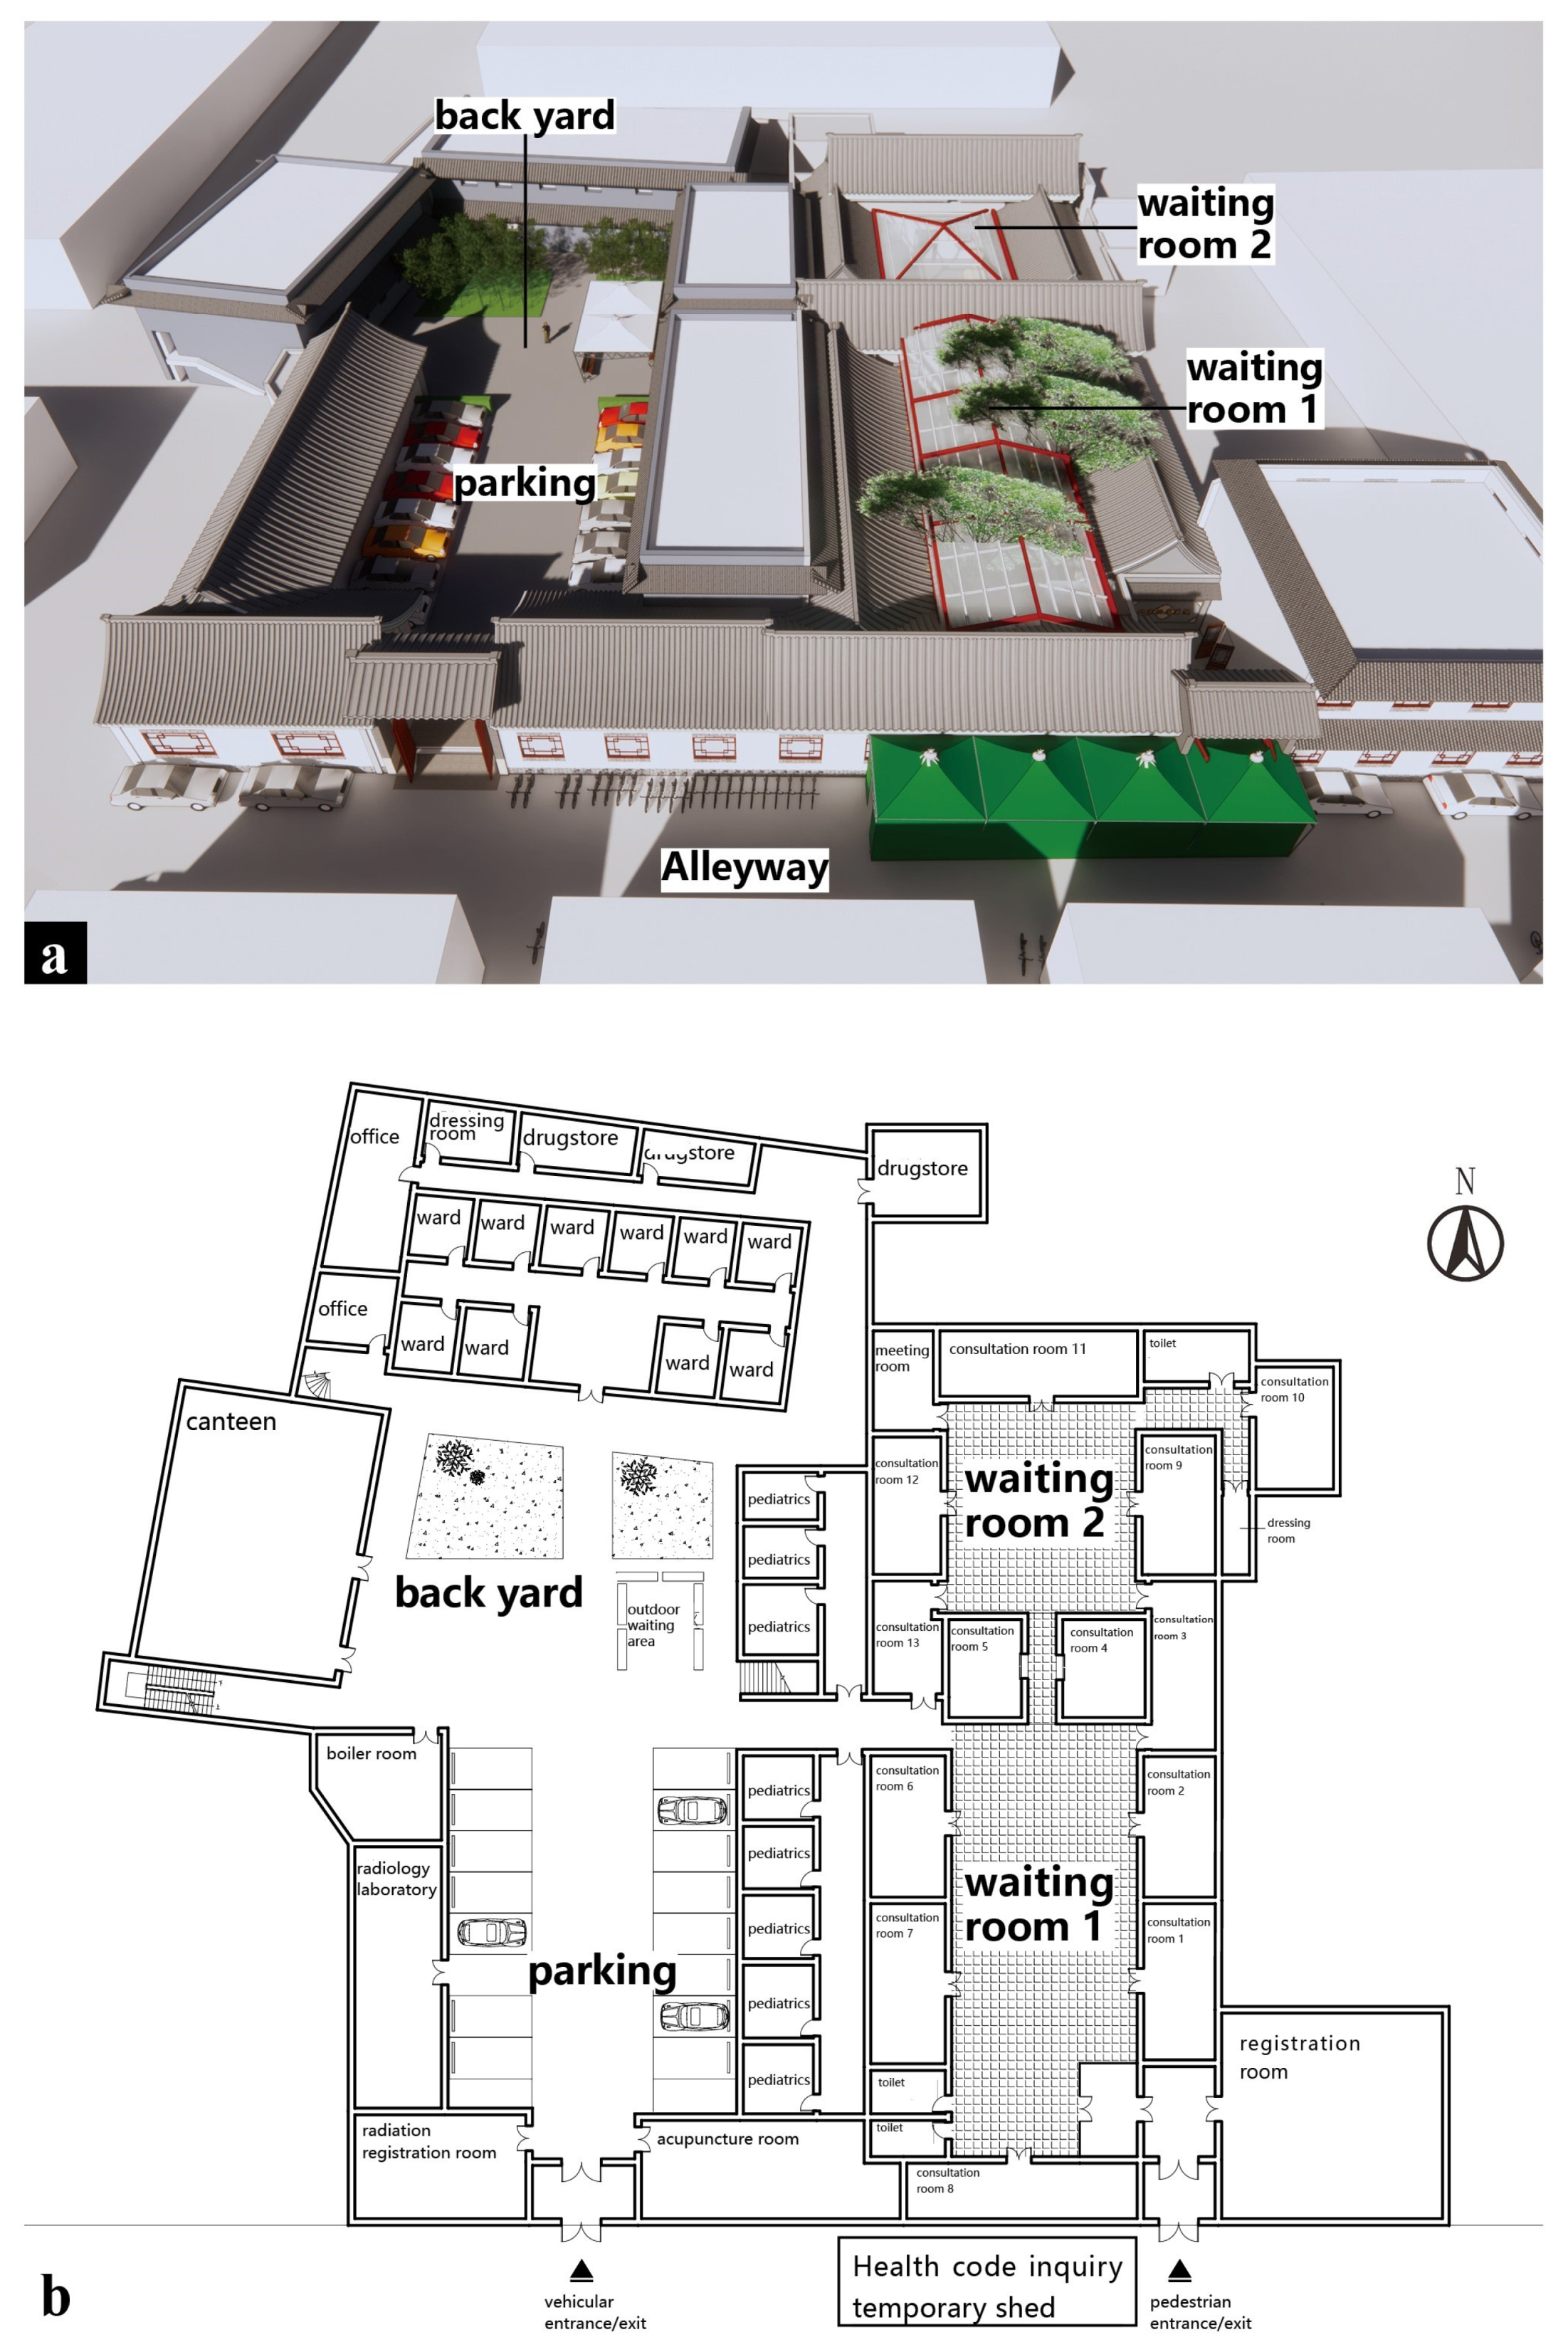
2.2. Case Study
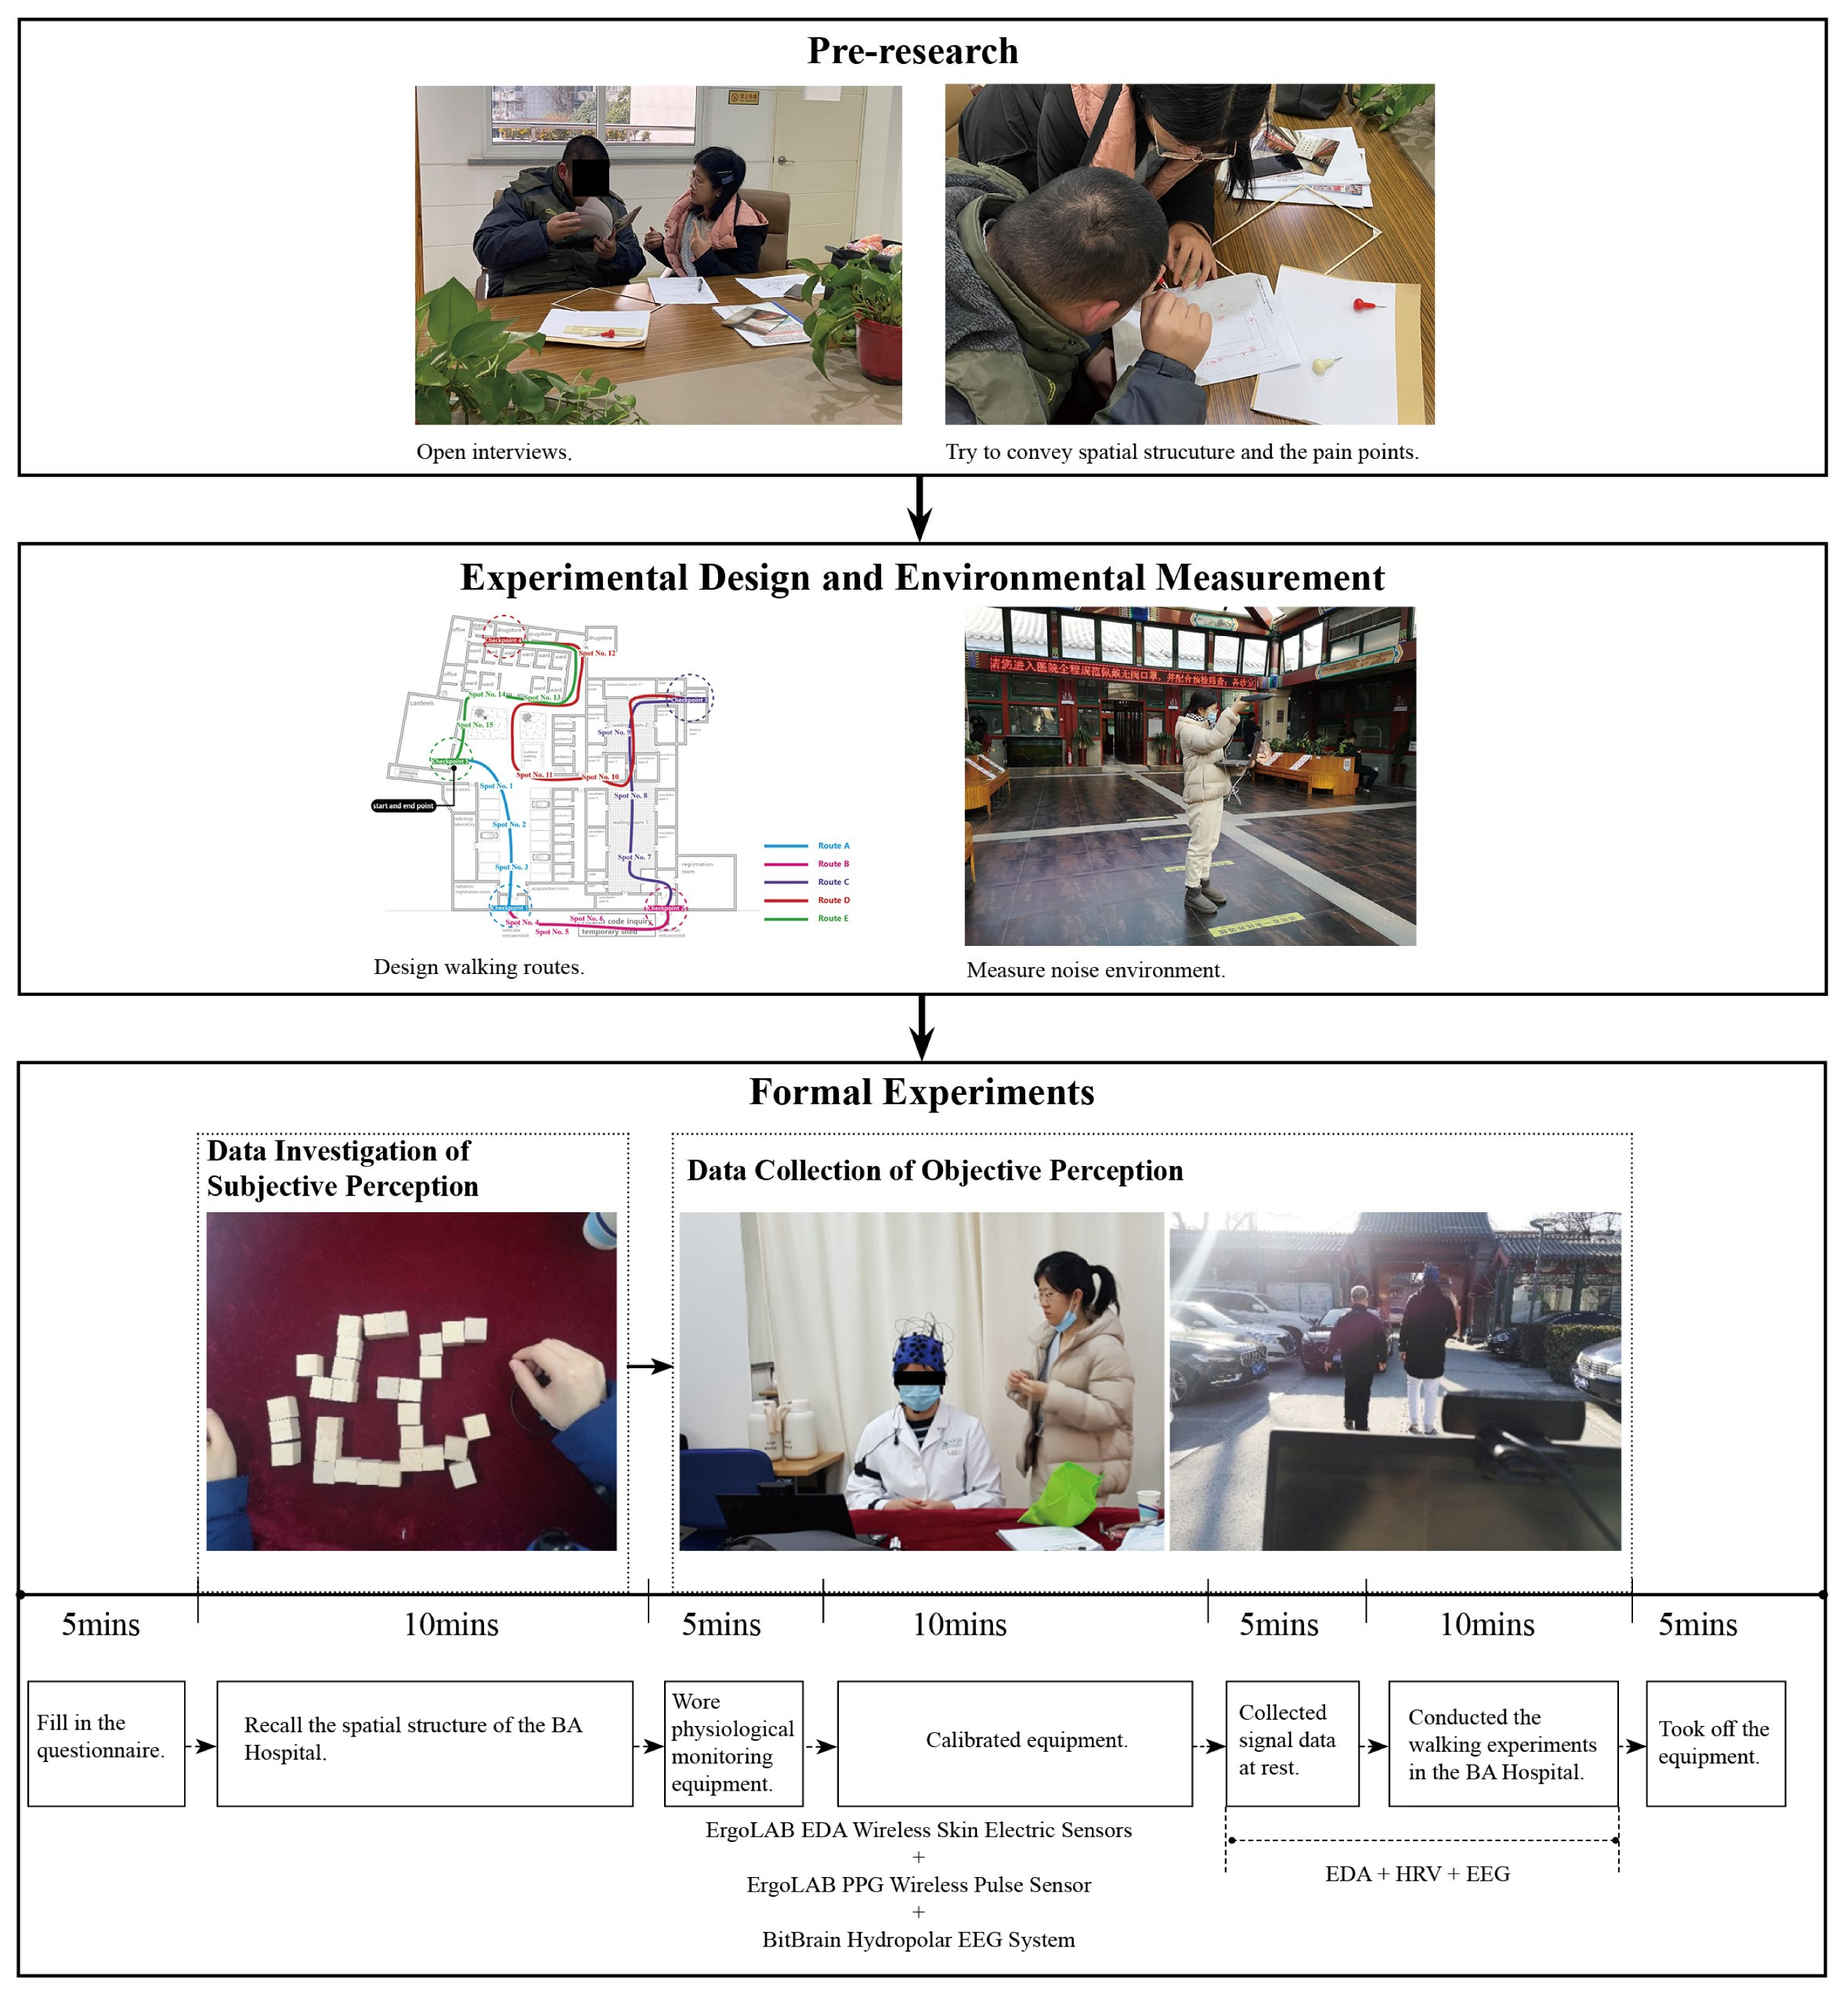
2.3. Pre-Research
2.4. Preparation for Formal Experiment
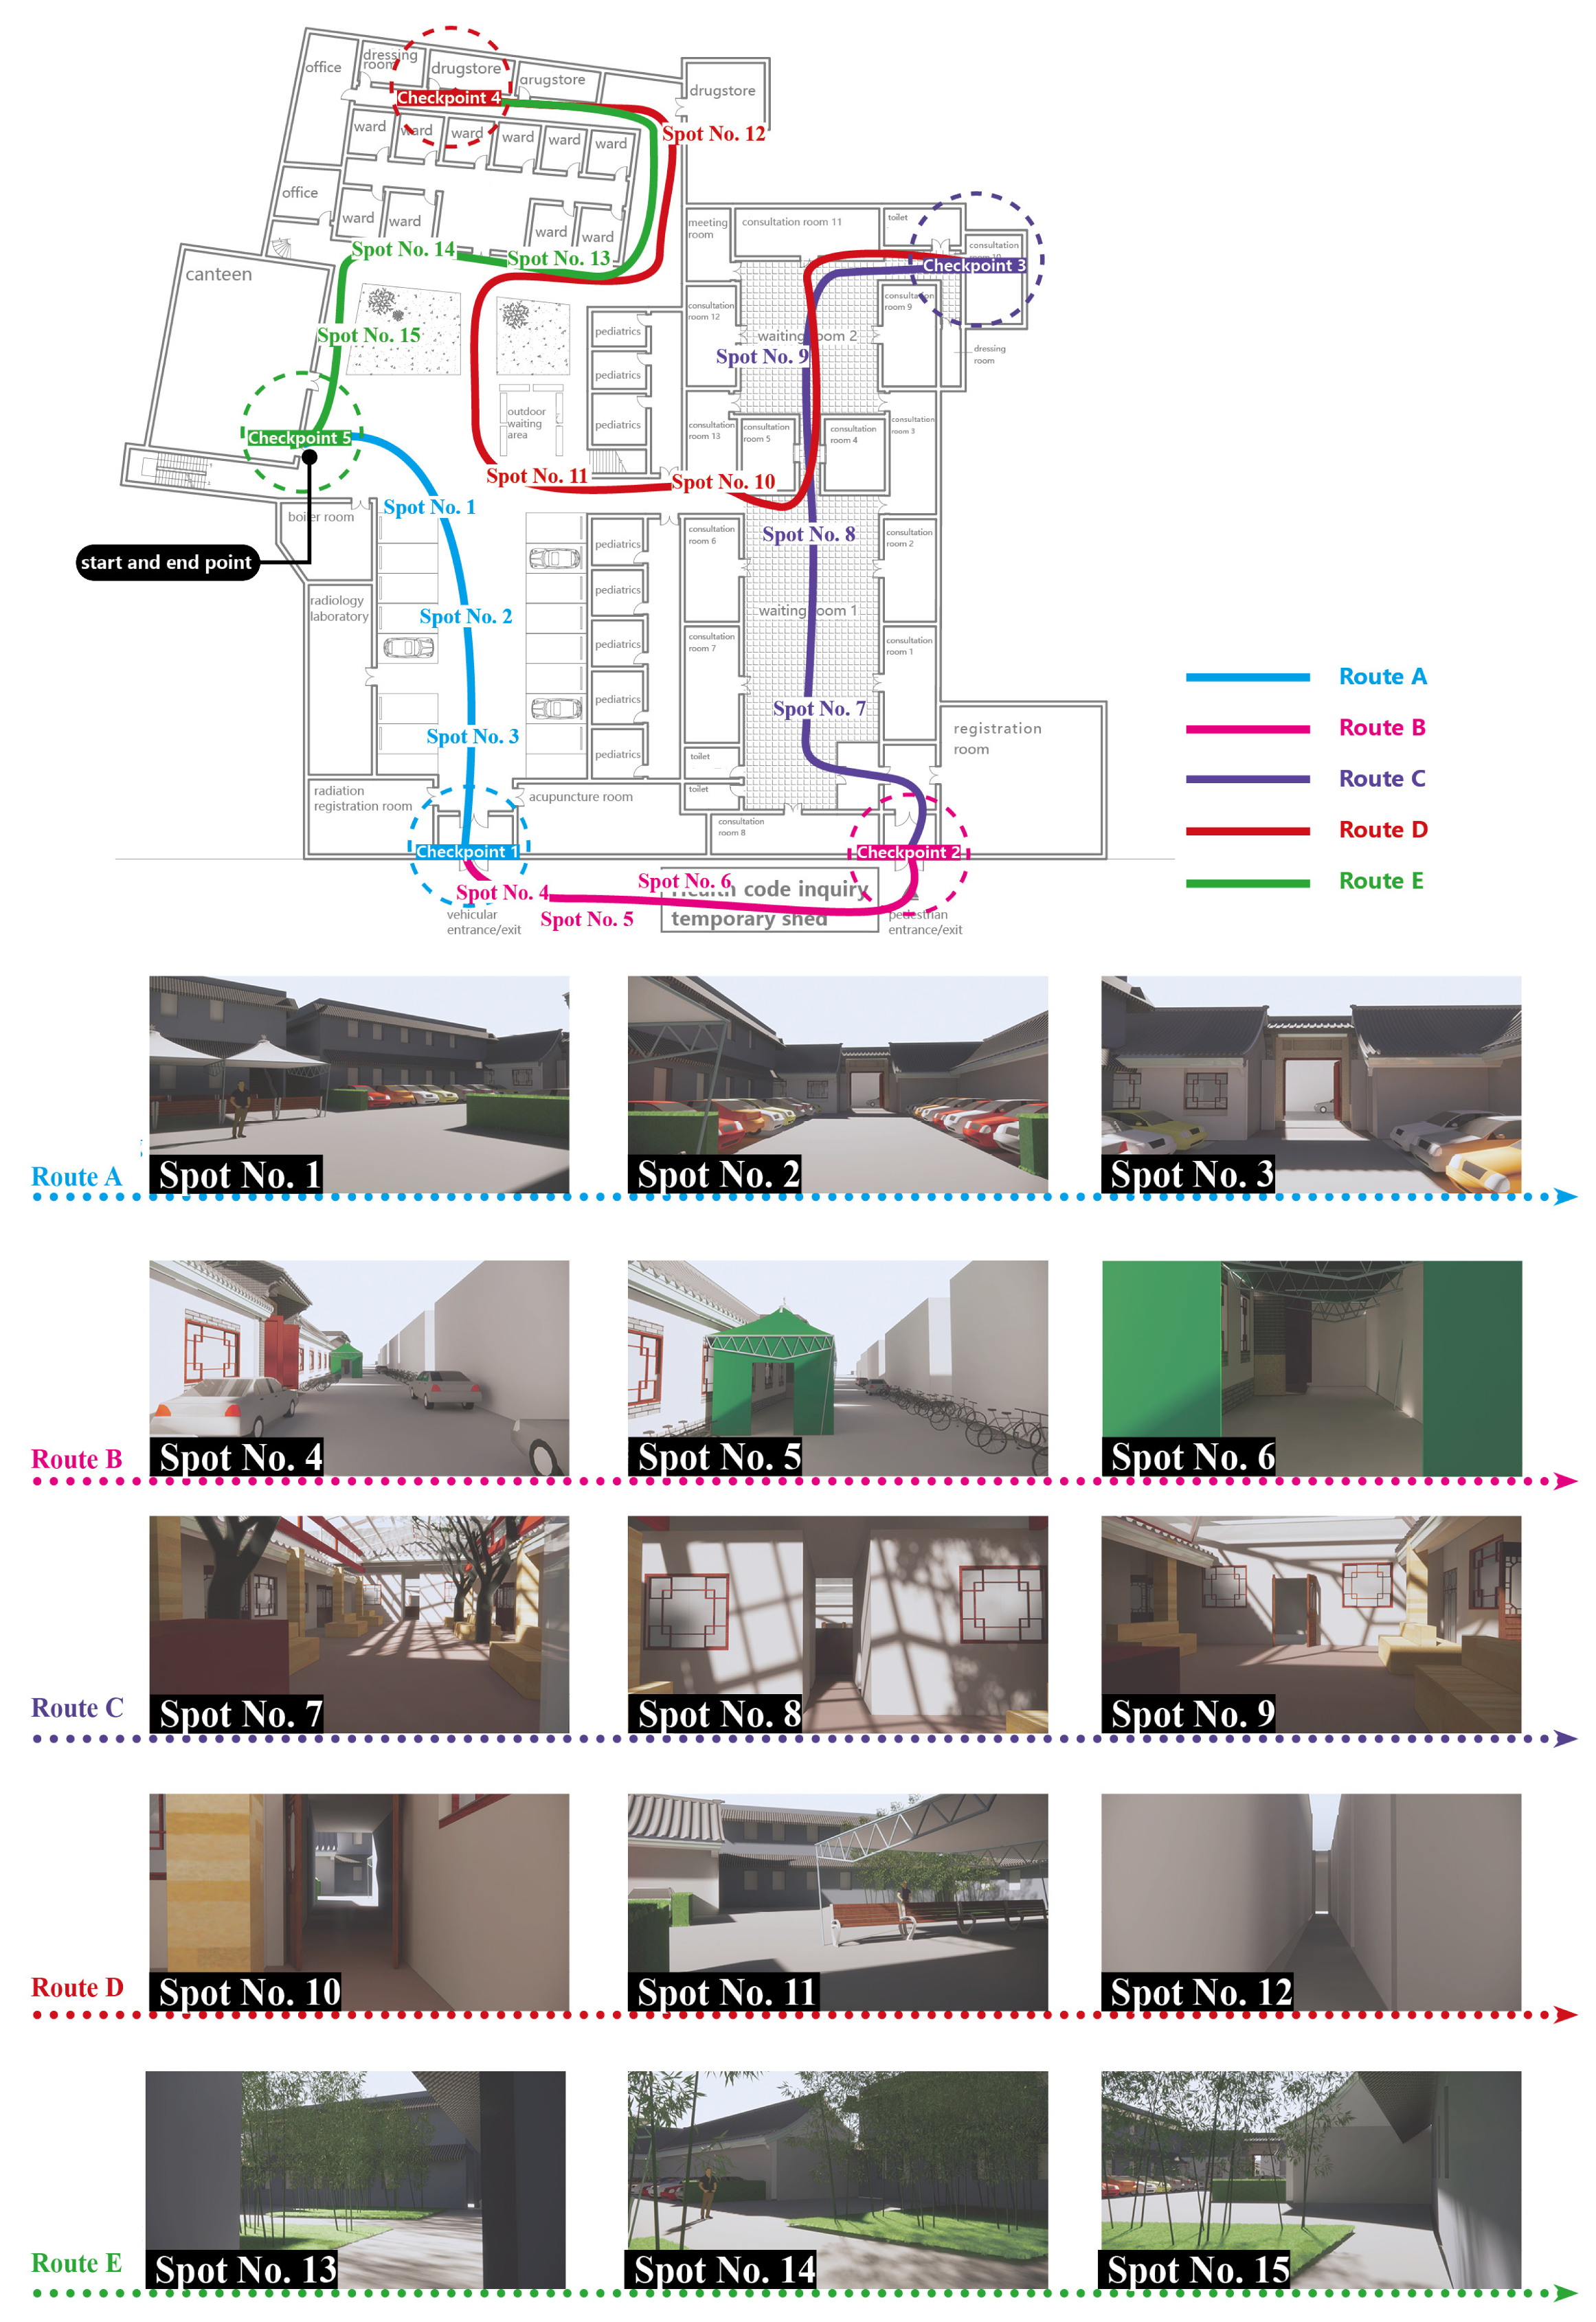
2.4.1. Design of Walking Routes
2.4.2. Measurement of Noise Environment
2.5. Participants
2.6. Data Investigation of Subjective Cognition
2.7. Data Collection of Objective Cognition
2.8. Statistical Analysis
3. Results
3.1. Noise Measurement
3.2. Subjective Investigations of Spatial Cognition Based on the Object Layout Tasks
3.3. Objective Measurements of Spatial Cognition Based on Walking Tasks
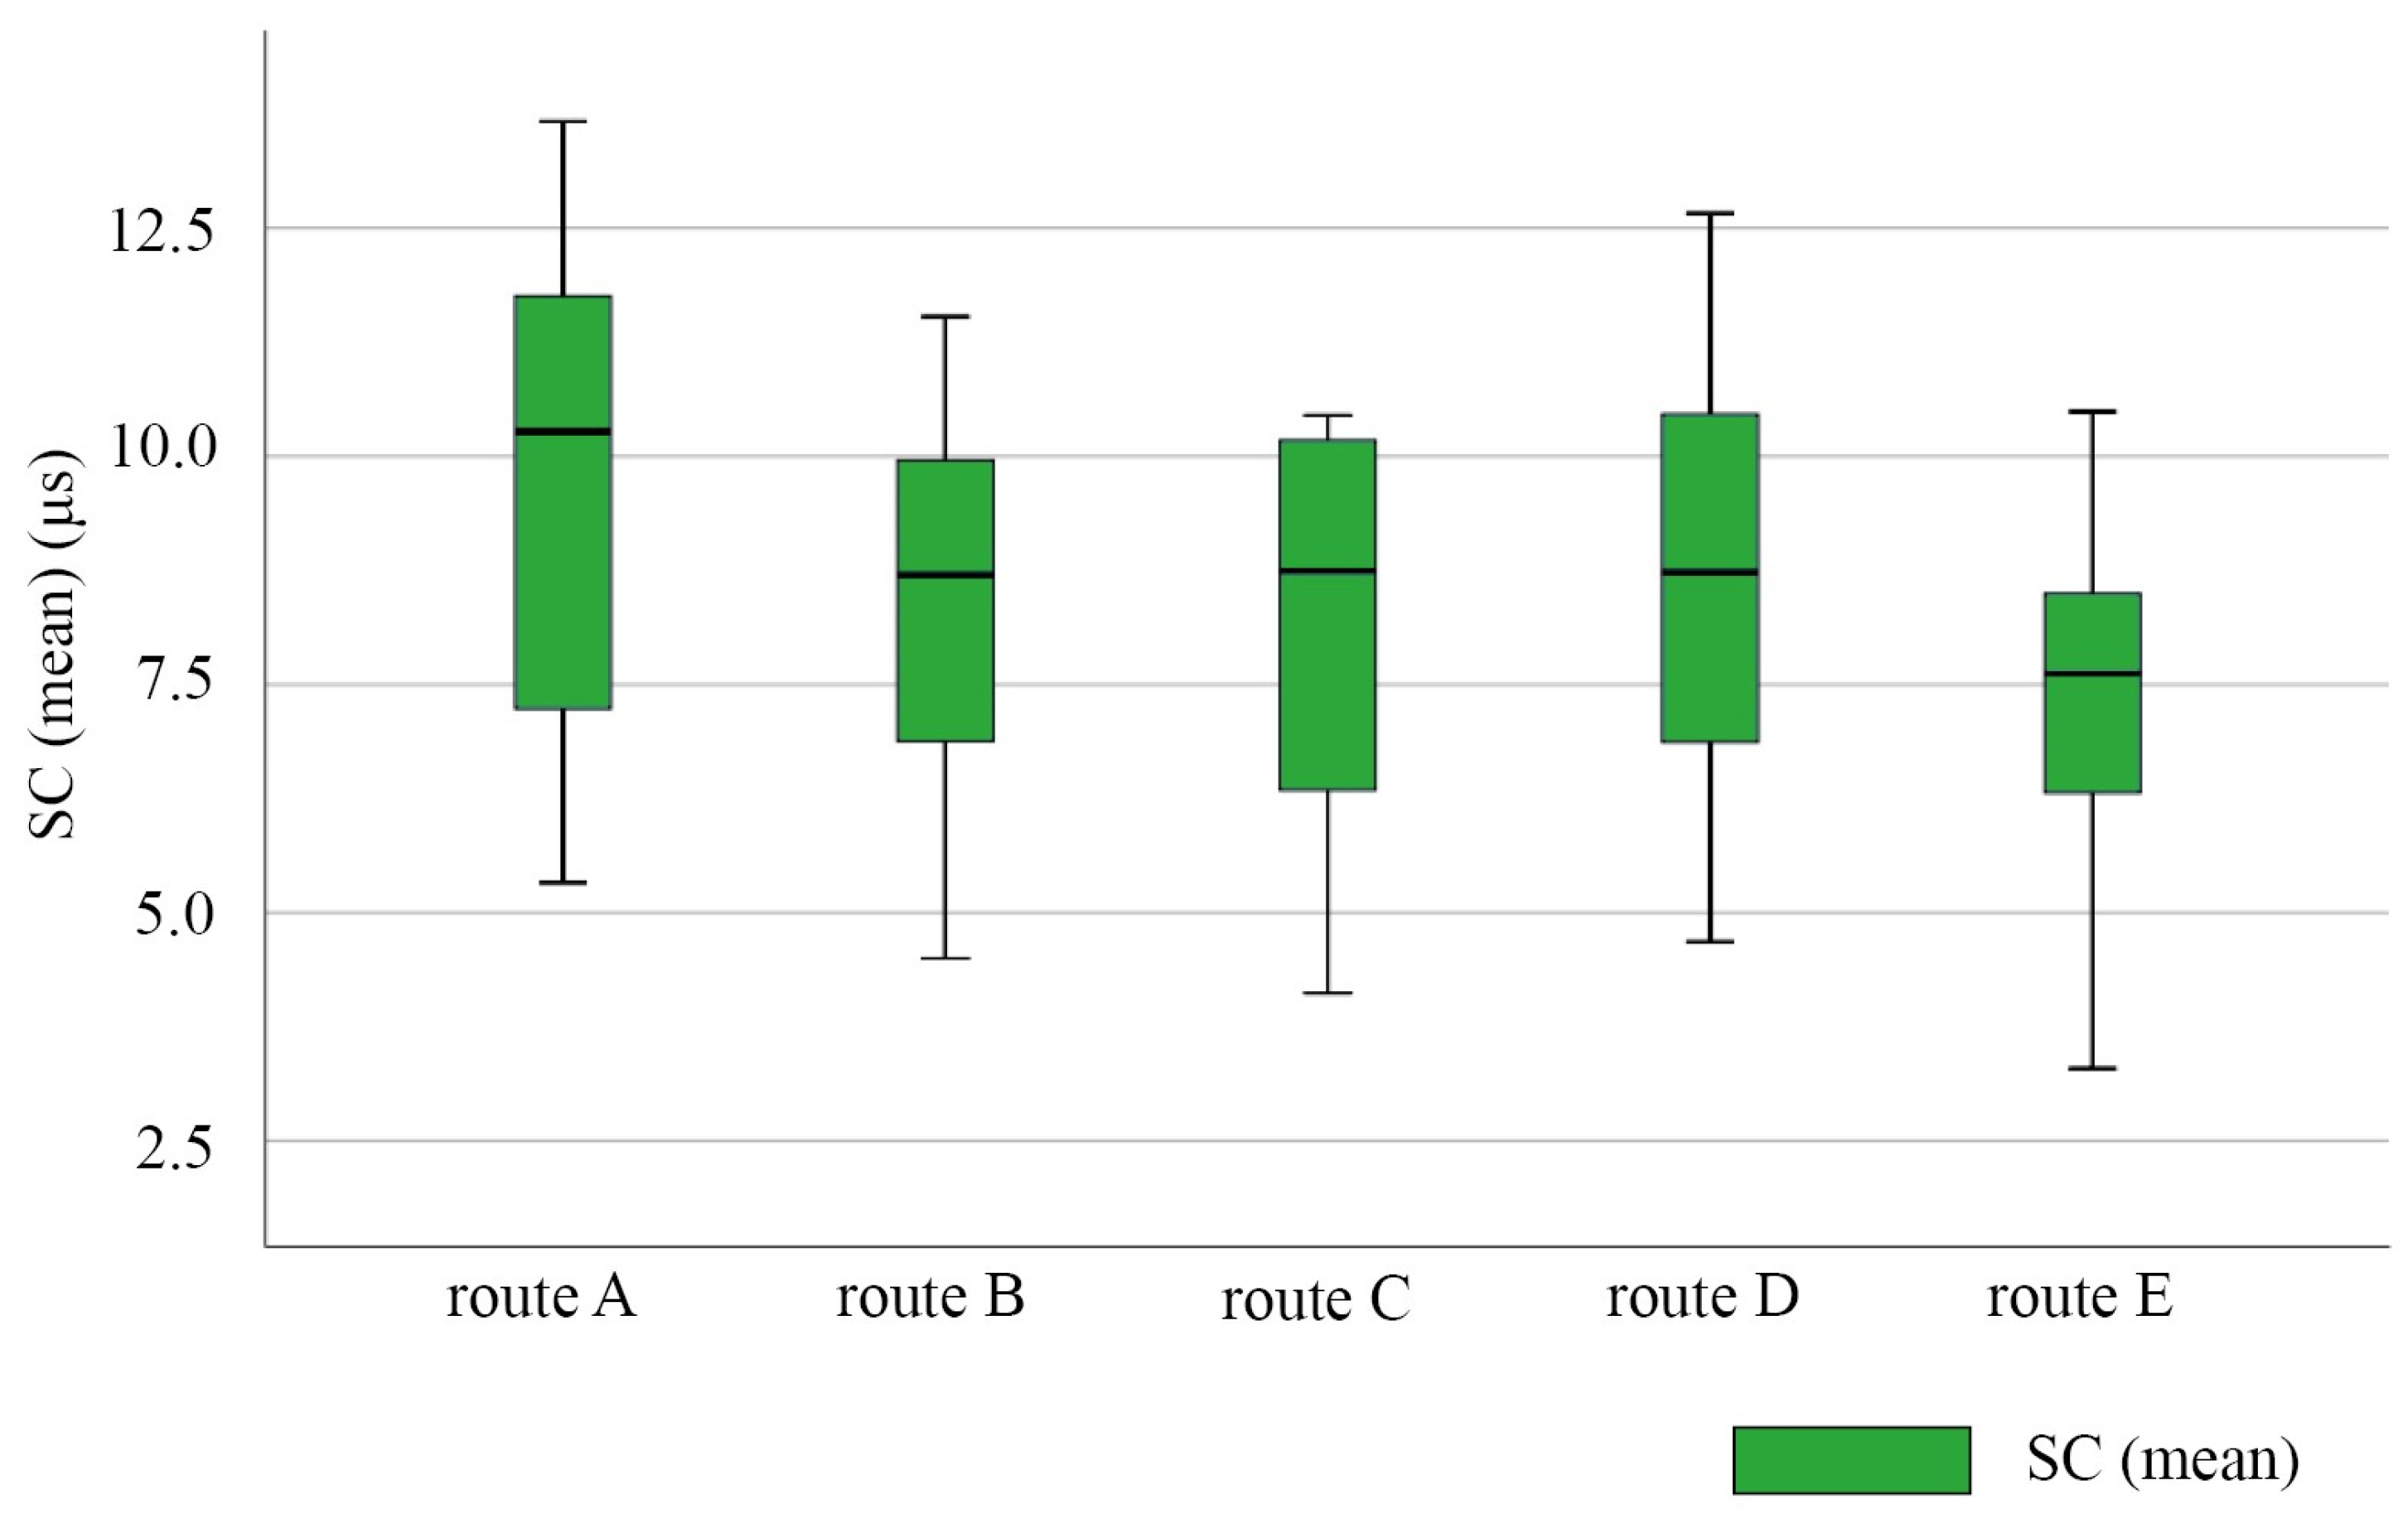
3.3.1. EDA
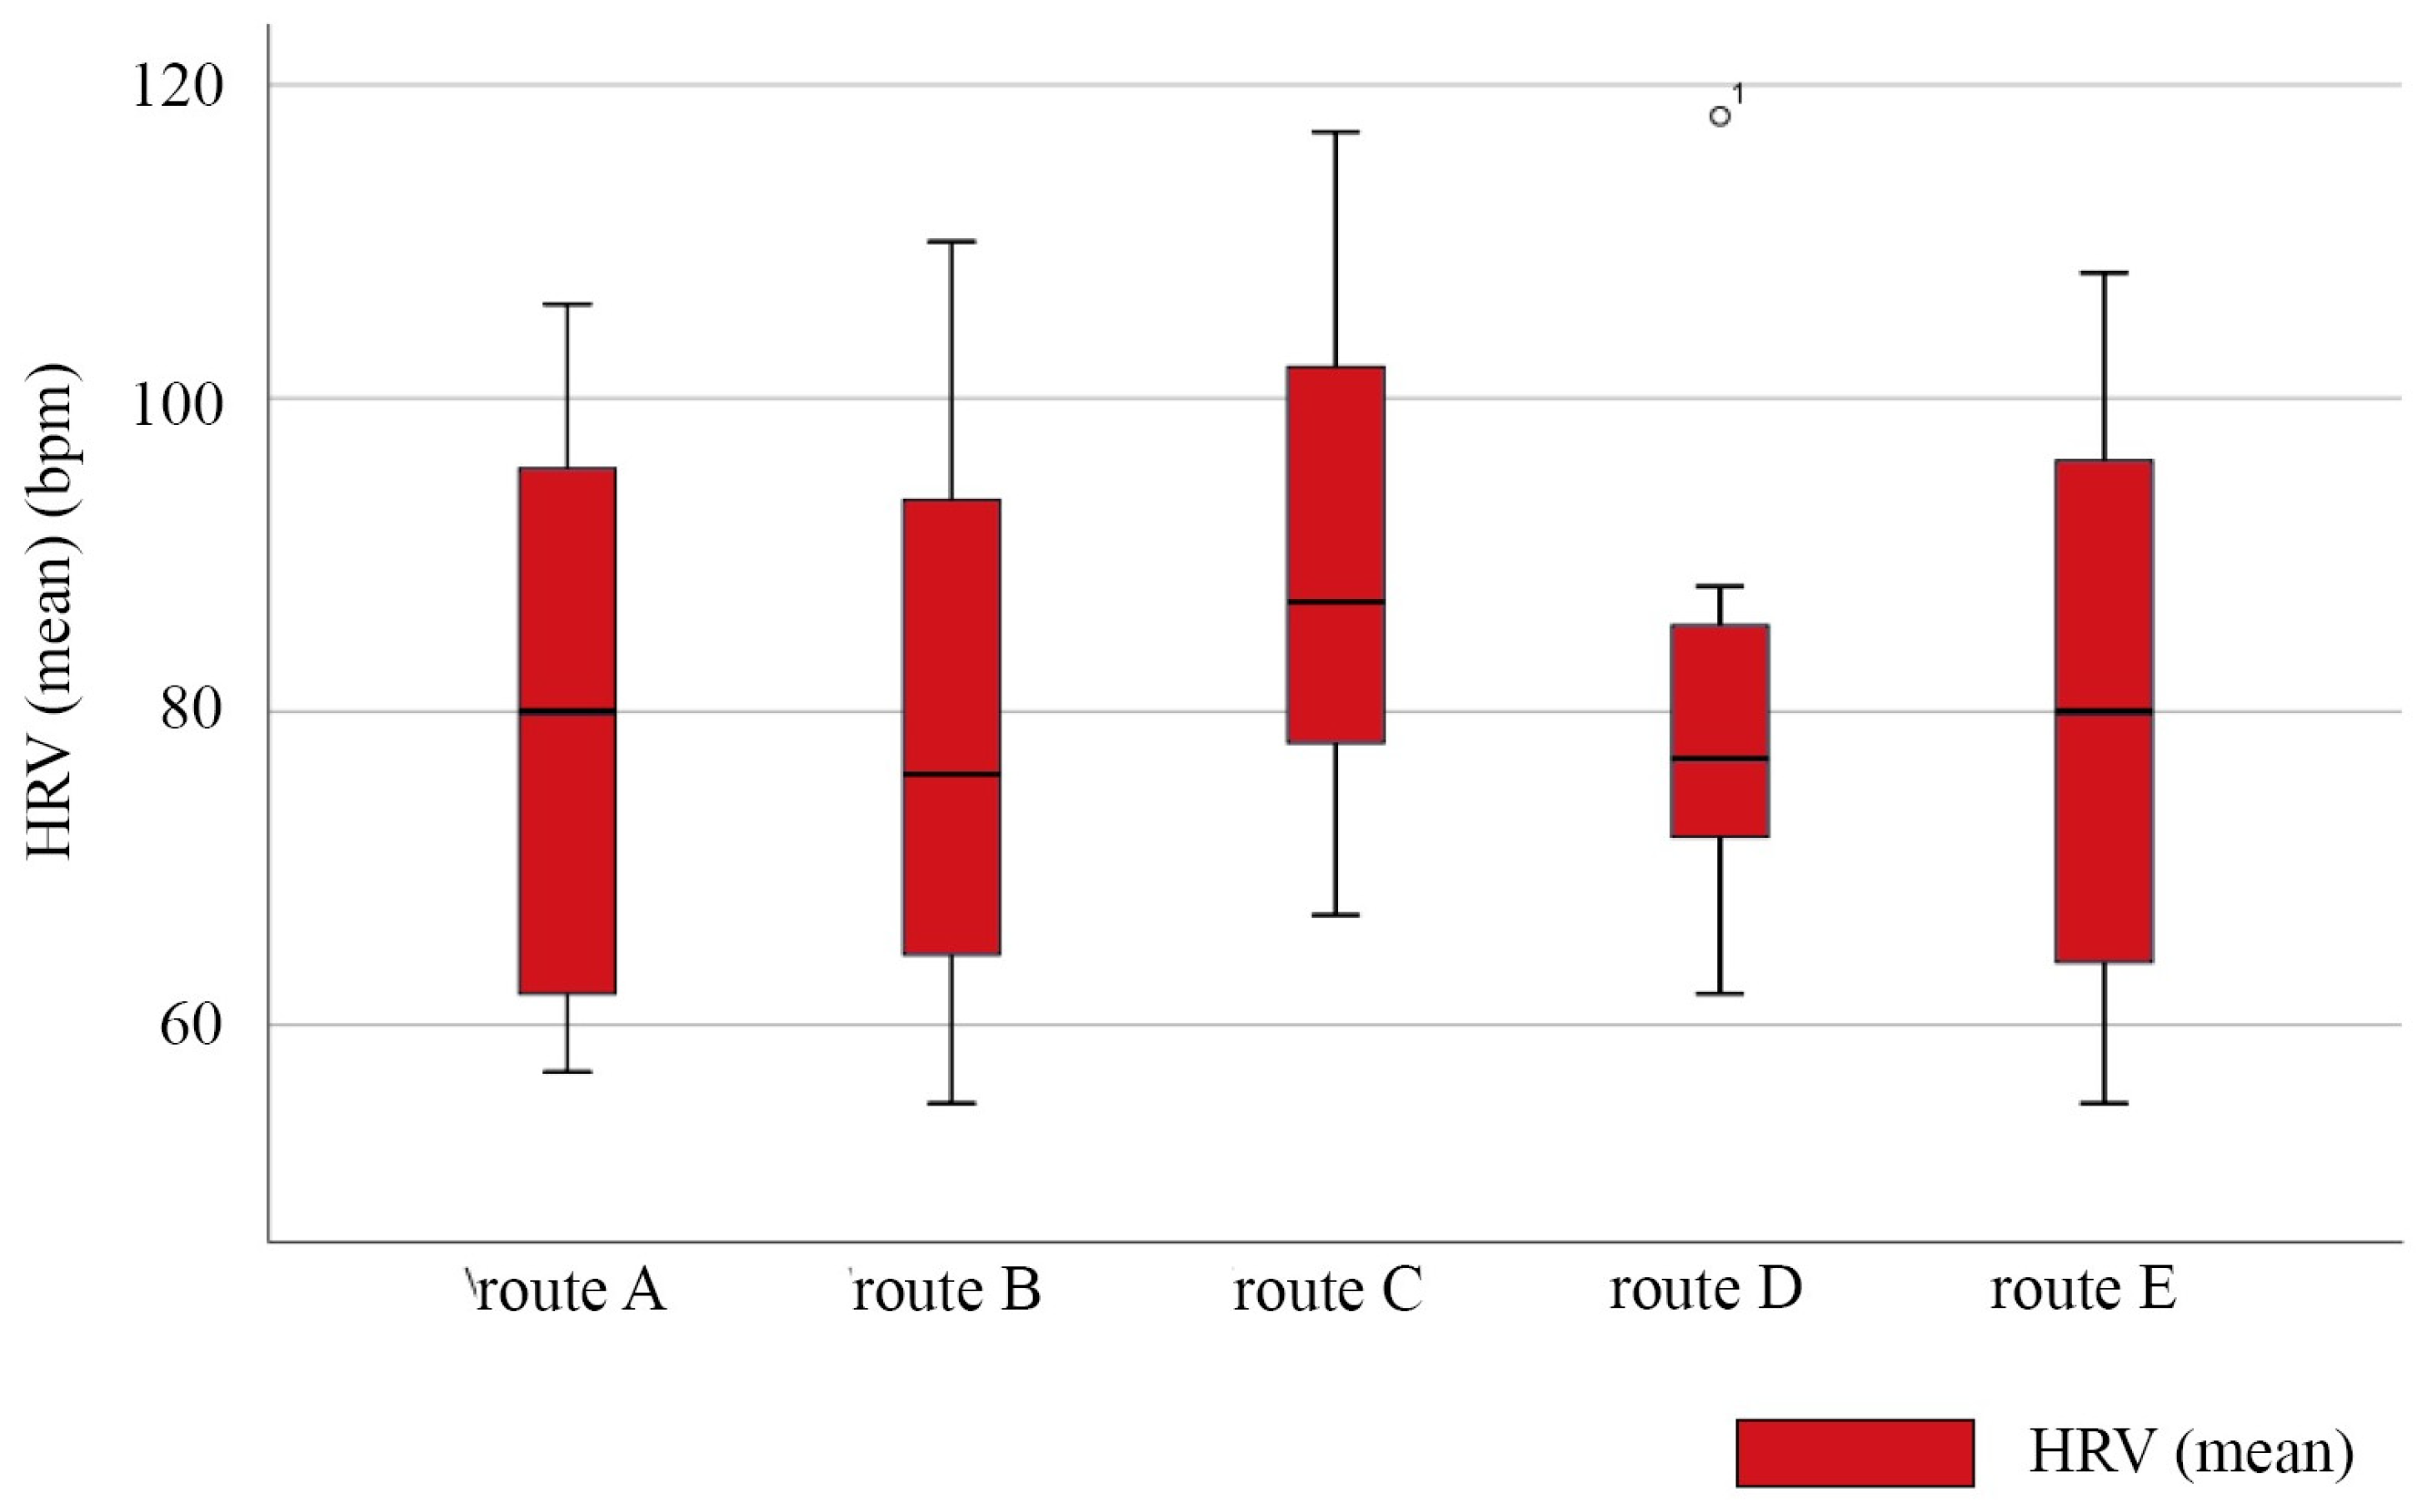
3.3.2. HRV
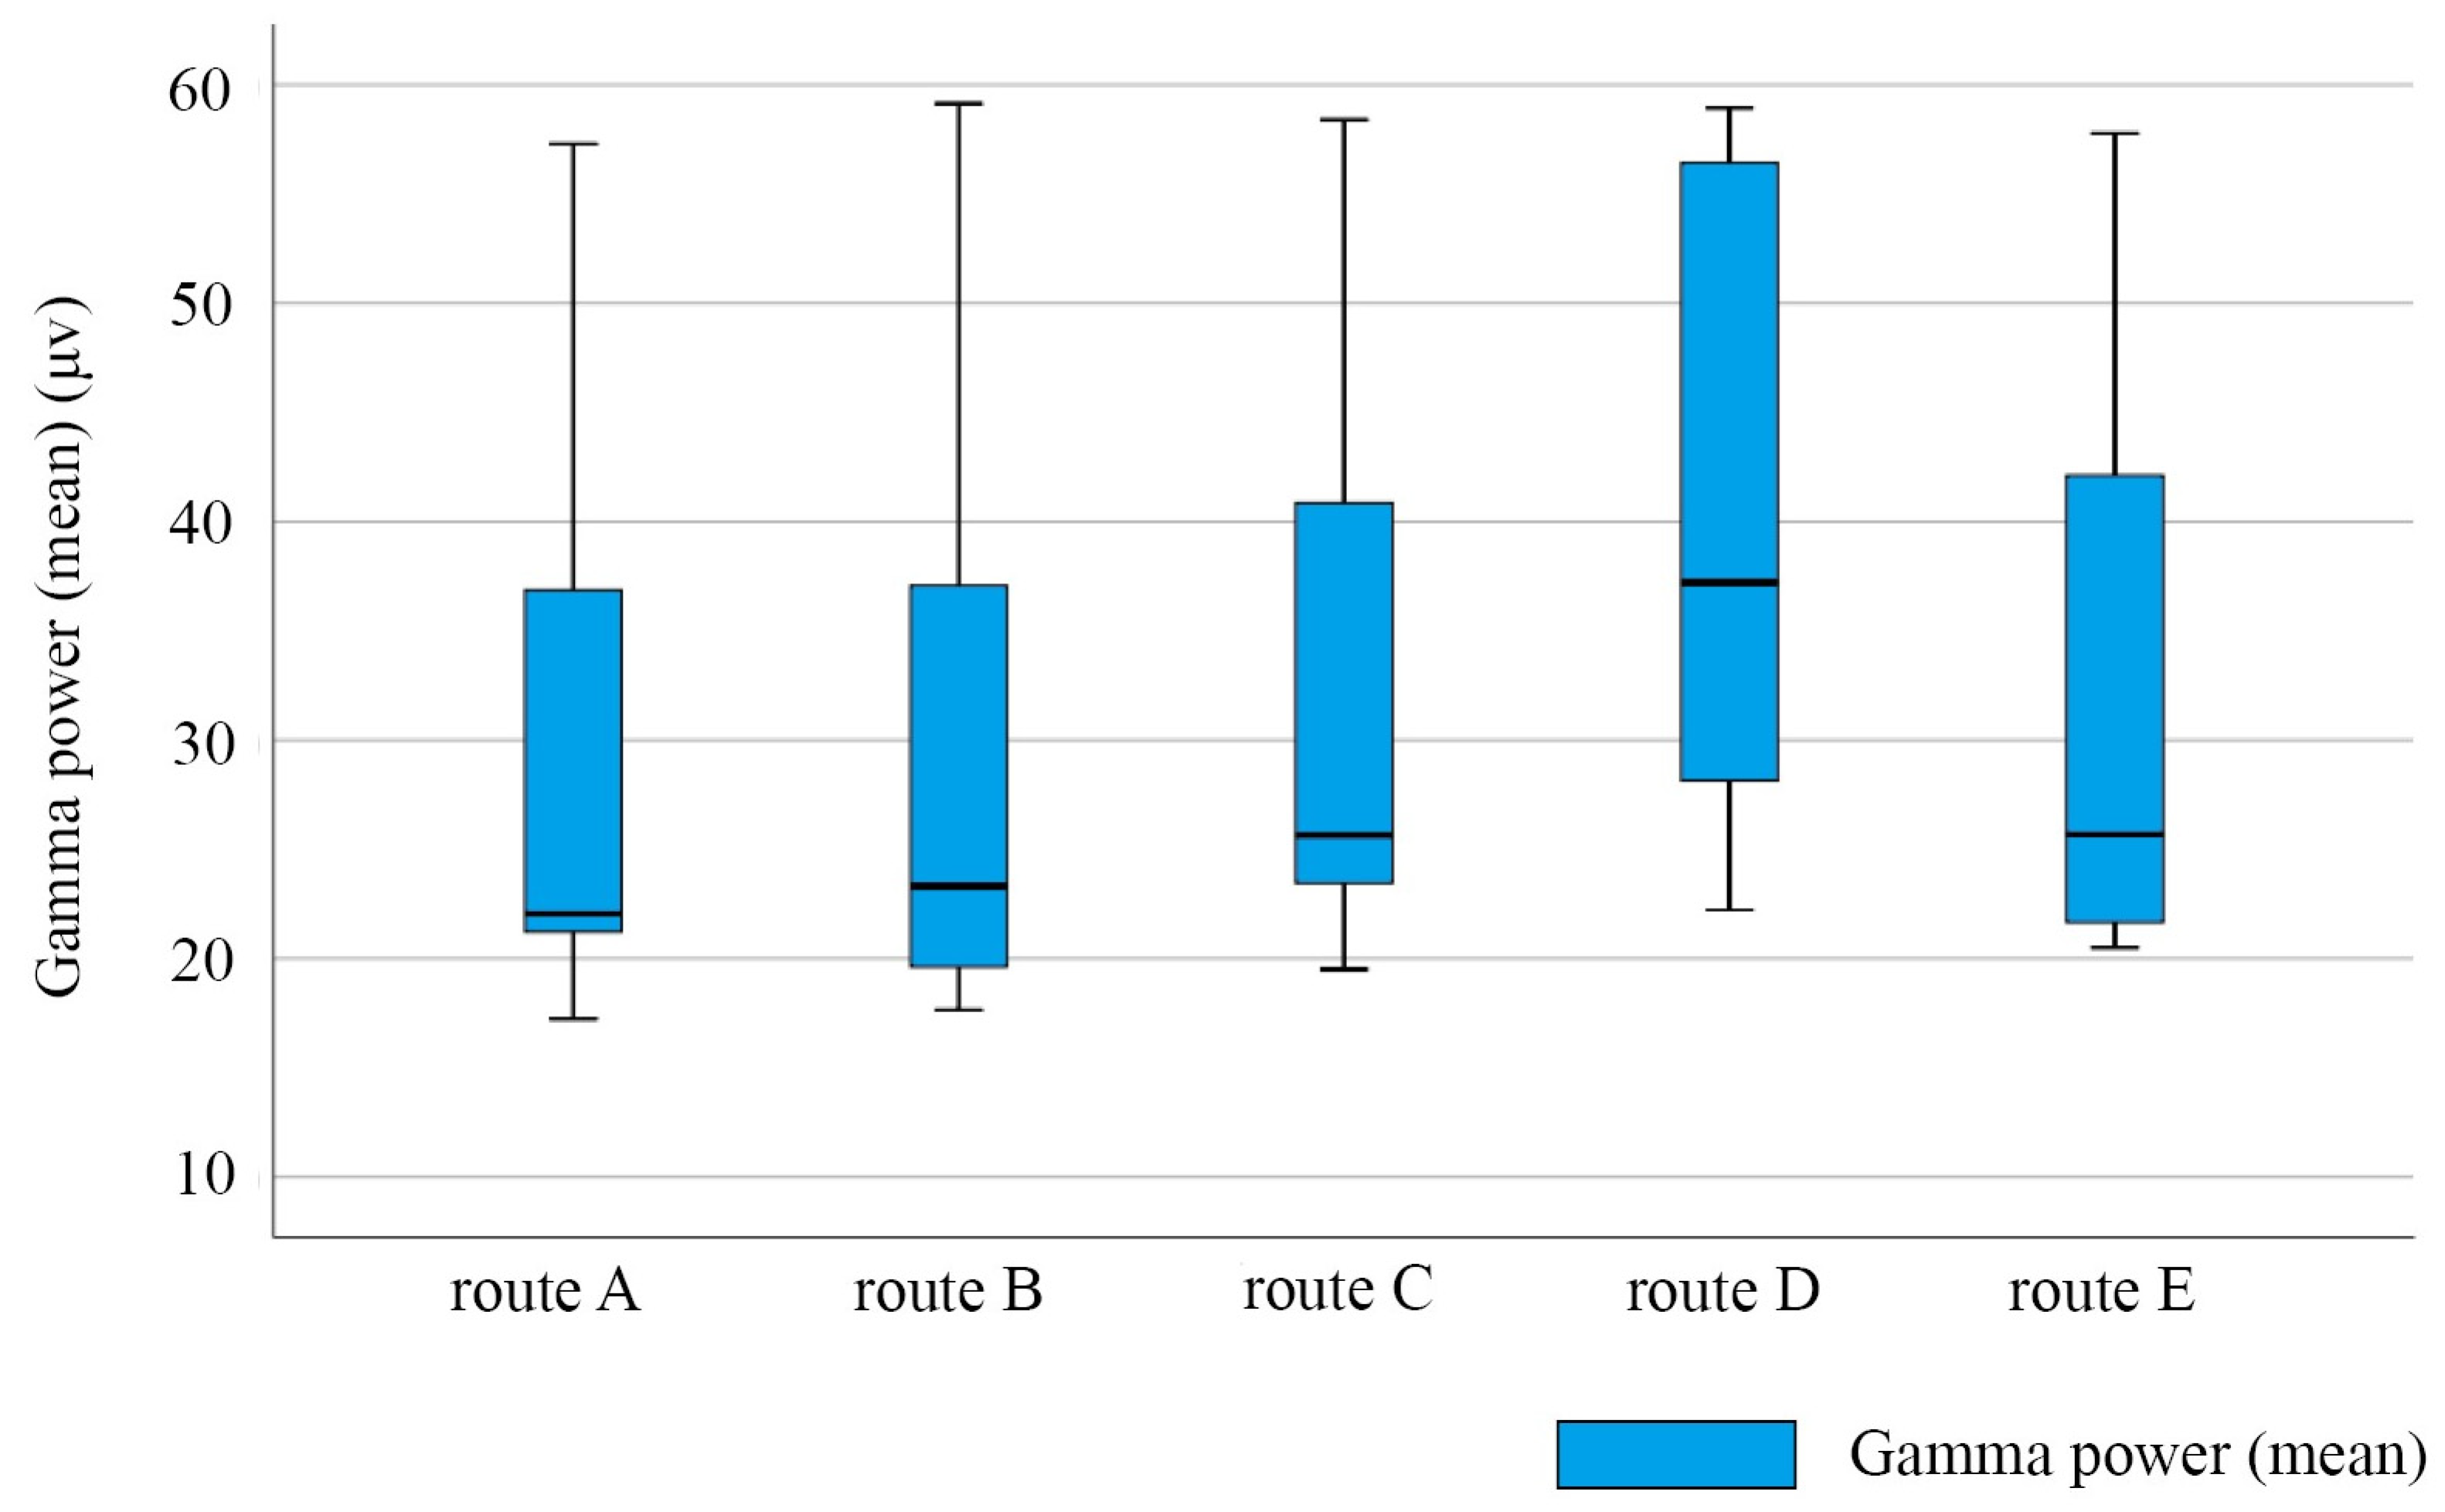
3.3.3. EEG
3.4. Comparative Studies of Subjective Investigations and Objective Measurements
4. Discussion
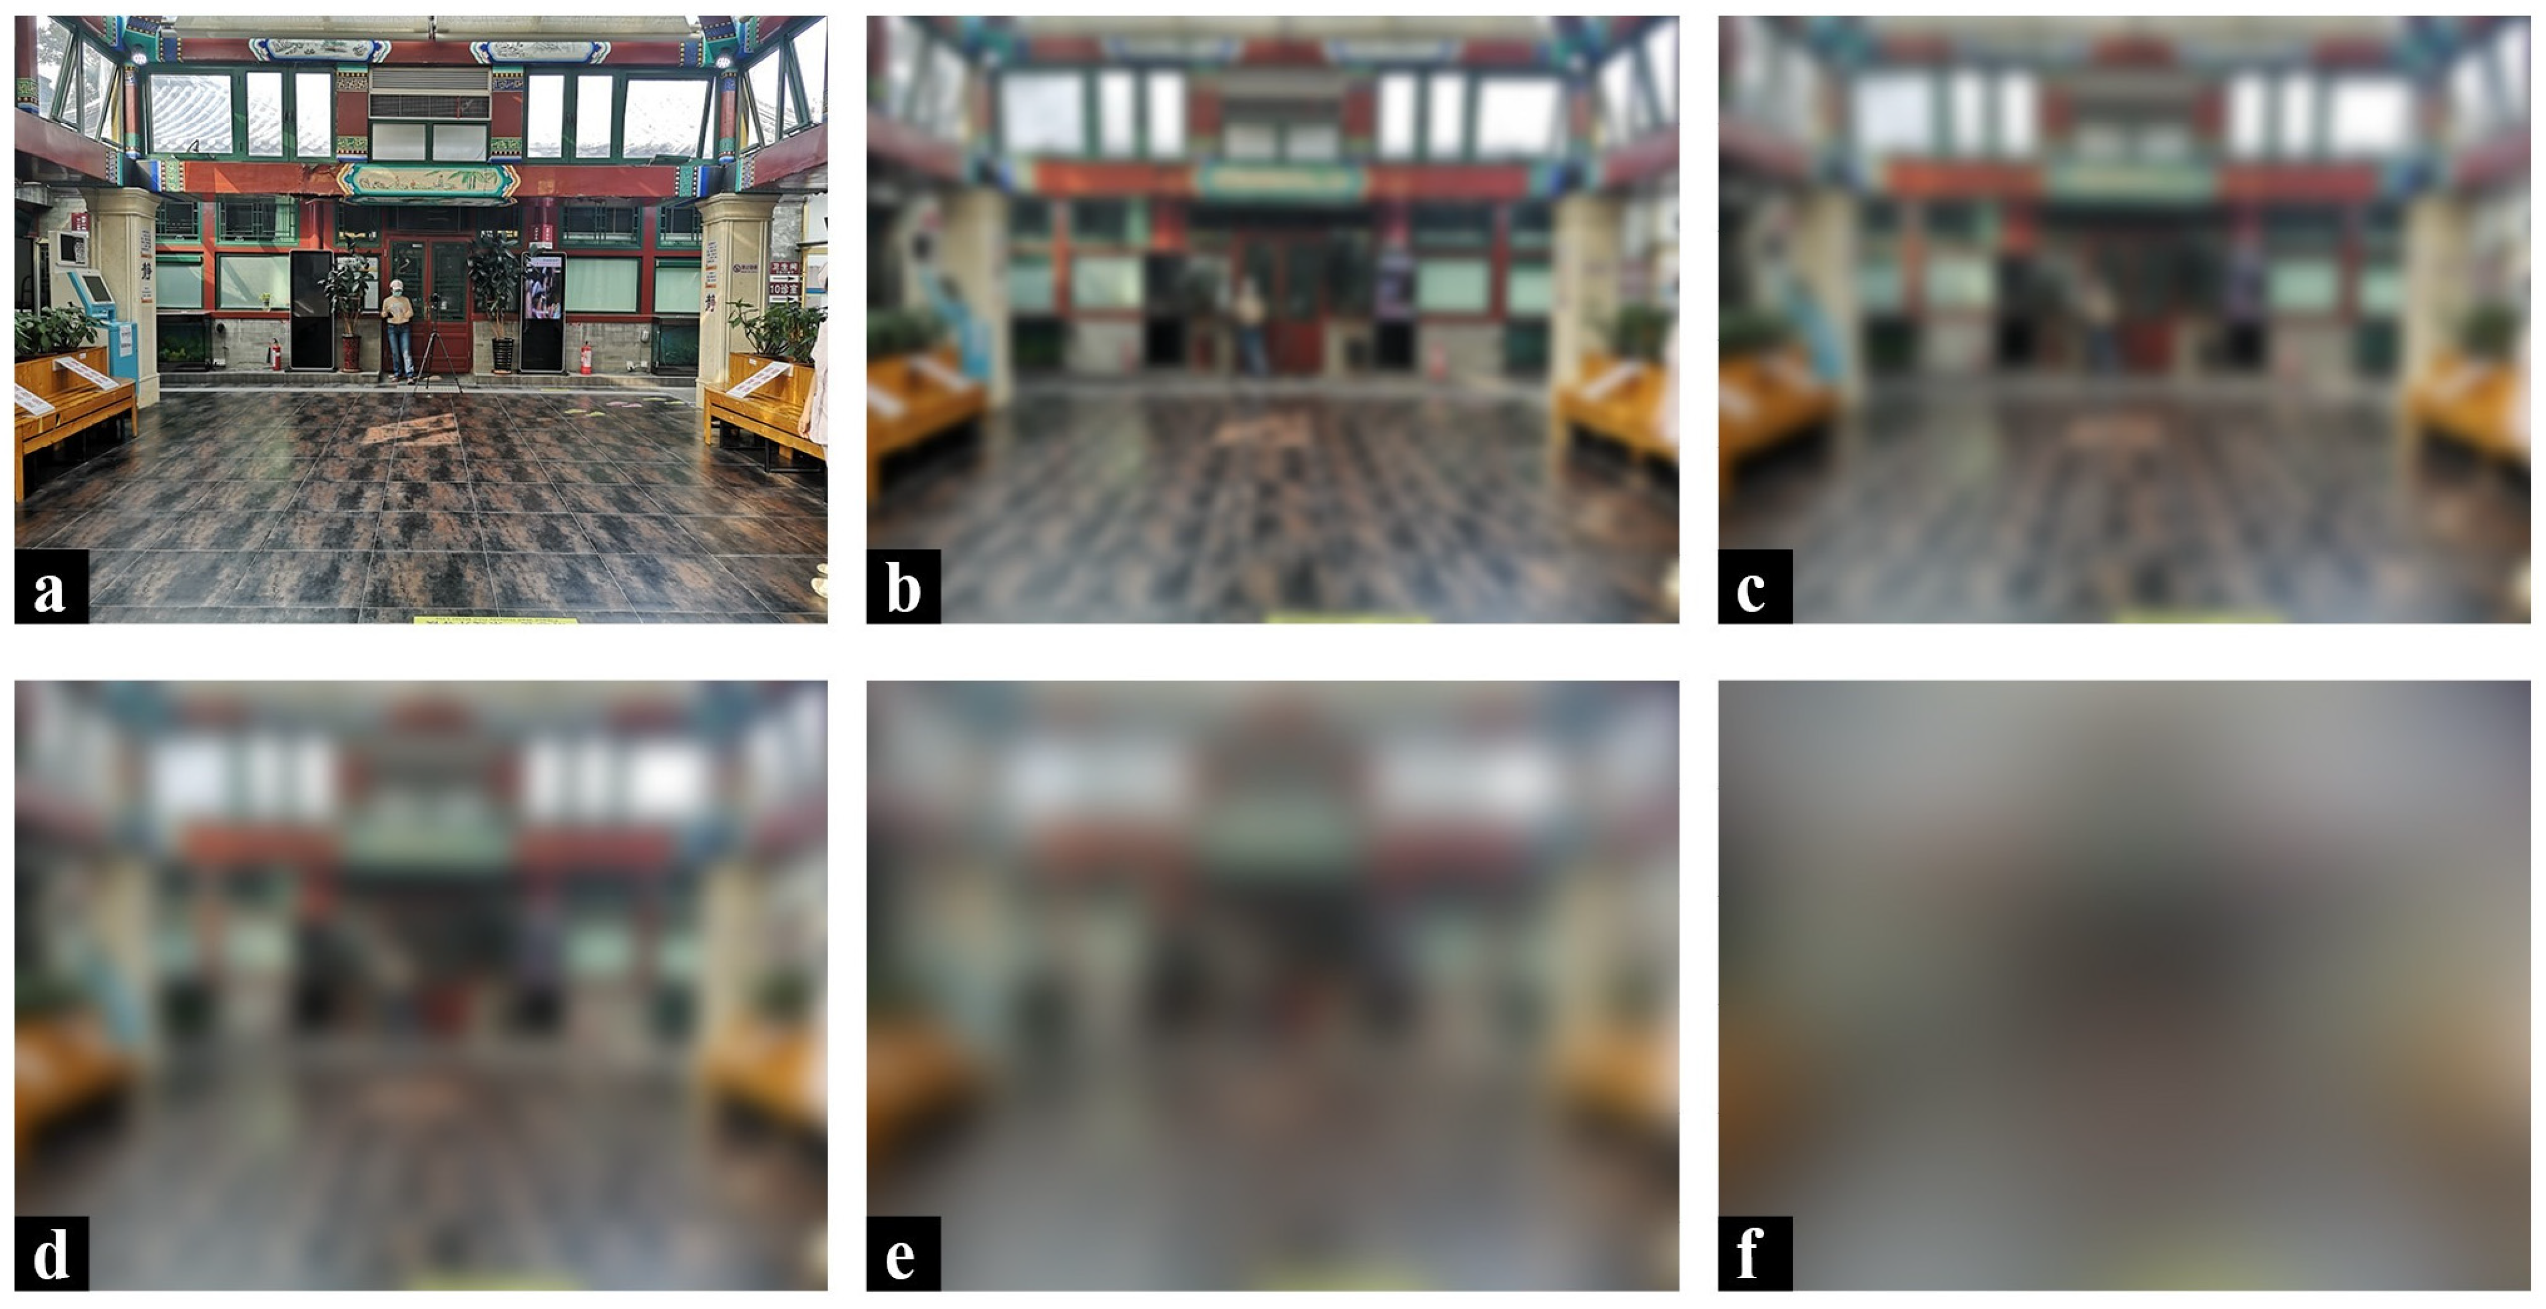
4.1. Visual Factors Affecting Spatial Cognition of the Visually Impaired
4.2. Physical Environmental Factors Affecting Space Cognition of the Visually Impaired
4.2.1. Spatial Characteristics
4.2.2. Separation of Pedestrian and Vehicle
4.2.3. Decorative Elements
4.3. Human–Environment Interactive Factors
4.4. Future Research Directions
4.5. Limitations
5. Conclusions
Author Contributions
Funding
Institutional Review Board Statement
Informed Consent Statement
Data Availability Statement
Acknowledgments
Conflicts of Interest
References
- Pascolini, D.; Mariotti, S.P. Global estimates of visual impairment: 2010. Br. J. Ophthalmol. 2012, 96, 614–618. [Google Scholar] [CrossRef] [PubMed]
- Mori, K.; Sakai, H.; Kaida, M. A Study on Low-vision Environment with Visual Level by Computer Simulated Picture. J. Archit. Plan. 2011, 76, 1213–1221. [Google Scholar] [CrossRef]
- Li, D. Generalization of Environmental Behavior, 1st ed.; Academic Research Building, Tsnghua University Press: Beijing, China, 1999; pp. 68–69. (In Chinese) [Google Scholar]
- Xuan, X.D.; Li, Z.F.; Chen, X.X.; Cao, Y.; Feng, Z. Study of the Physical Environment of Waiting Areas and Its Effects on Patient Satisfaction, Experience, Perceived Waiting Time, and Behavior in China. Health Environ. Res. Des. J. 2021, 14, 108–123. [Google Scholar] [CrossRef] [PubMed]
- Tang, H.D.; Ding, J.H.; Lin, Z.H. On-site measurement of indoor environment quality in a Chinese healthcare facility with a semi-closed hospital street. Build. Environ. 2020, 173, 106637. [Google Scholar] [CrossRef]
- Worchel, P. Space Perception and Orientation in the Blind. Psychol. Monogr. Gen. Appl. 1951, 65, 1–28. [Google Scholar] [CrossRef]
- Iachini, T.; Ruggiero, G.; Ruotolo, F. Does blindness affect egocentric and allocentric frames of reference in small and large scale spaces? Behav. Brain Res. 2014, 273, 73–81. [Google Scholar] [CrossRef]
- Katja, F.; Reuschel, J.; Rosler, F. Early non-visual experience influences proprioceptive-spatial discrimination acuity in adulthood. Neuropsychologia 2009, 47, 897–906. [Google Scholar] [CrossRef]
- Bigelow, A.E. Blind and Sighted Children’s Spatial Knowledge of Their Home Environments. Int. J. Behav. Dev. 1996, 19, 797–816. [Google Scholar] [CrossRef]
- Rieser, J.J.; Hill, E.W.; Talor, C.R.; Bradfield, A.; Rosen, S. Visual experience, visual field size, and the development of nonvisual sensitivity to the spatial structure of outdoor neighborhoods explored by walking. J. Exp. Psychol. Gen. 1992, 121, 210–221. [Google Scholar] [CrossRef]
- Millar, S. Spatial representation by blind and sighted children. J. Exp. Child Psychol. 1976, 21, 460–479. [Google Scholar] [CrossRef]
- Dodds, A.G.; Howarth, C.I.; Carter, D.C. The mental maps of the blind: The role of previous visual experience. J. Vis. Impair. Blind. 1982, 76, 5–12. [Google Scholar] [CrossRef]
- Herman, J.F.; Chatman, S.P.; Roth, S.F. Cognitive mapping in blind people: Acquisition of spatial relationships in a large-scale environment. J. Vis. Impair. Blind. 1983, 77, 161–166. [Google Scholar] [CrossRef]
- Byrne, R.W.; Salter, E. Distances and directions in the cognitive maps of the blind. Can. J. Psychol. Rev. Can. De Psychol. 1983, 37, 293–299. [Google Scholar] [CrossRef] [PubMed]
- Shen, G.; Wang, R.; Yang, M.; Xie, J. Chinese Children with Congenital and Acquired Blindness Represent Concrete Concepts in Vertical Space through Tactile Perception. Int. J. Environ. Res. Public Health 2022, 19, 11055. [Google Scholar] [CrossRef] [PubMed]
- Bilal Salih, H.E.; Takeda, K.; Kobayashi, H.; Kakizawa, T.; Kawamoto, M.; Zempo, K. Use of Auditory Cues and Other Strategies as Sources of Spatial Information for People with Visual Impairment When Navigating Unfamiliar Environments. Int. J. Environ. Res. Public Health 2022, 19, 3151. [Google Scholar] [CrossRef]
- Garcia, S.; Petrini, K.; Rubin, G.S.; Da Cruz, L.; Nardini, M. Visual and Non-Visual Navigation in Blind Patients with a Retinal Prosthesis. PLoS ONE 2015, 10, e0134369. [Google Scholar] [CrossRef] [PubMed]
- Jicol, C.; Lloyd-Esenkaya, T.; Proulx, M.J.; Lange-Smith, S.; Scheller, M.; O’Neill, E.; Petrini, K. Efficiency of Sensory Substitution Devices Alone and in Combination with Self-Motion for Spatial Navigation in Sighted and Visually Impaired. Front. Psychol. 2020, 11, 1443. [Google Scholar] [CrossRef]
- Papadopoulos, K.; Barouti, M.; Koustriava, E. Differences in Spatial Knowledge of Individuals With Blindness When Using Audiotactile Maps, Using Tactile Maps, and Walking. Except. Child. 2018, 84, 330–343. [Google Scholar] [CrossRef]
- Passini, R.; Proulx, G. Wayfinding without Vision an Experiment with Congenitally Totally Blind People. Environ. Behav. 1988, 20, 227–252. [Google Scholar] [CrossRef]
- Morrongiello, B.A.; Timney, B.; Humphrey, G.K.; Anderson, S.; Skory, C. Spatial knowledge in blind and sighted children. J. Exp. Child Psychol. 1995, 59, 211. [Google Scholar] [CrossRef]
- Landau, B. Spatial representation of objects in the young blind child. Cognition 1991, 38, 145–178. [Google Scholar] [CrossRef] [PubMed]
- Fortin, M.; Voss, P.; Lord, C.; Lassonde, M.; Pruessner, J.; Saint-Amour, D.; Rainville, C.; Lepore, F. Wayfinding in the blind: Larger hippocampal volume and supranormal spatial navigation. Brain 2008, 131, 2995–3005. [Google Scholar] [CrossRef] [PubMed]
- Szubielska, M.; Mohring, W.; Szewczyk, M. Spatial scaling in congenitally blind and sighted individuals: Similarities and differences. J. Cogn. Psychol. 2019, 31, 476–486. [Google Scholar] [CrossRef]
- Hill, E.W.; Rieser, J.J. How persons with visual impairments explore novel spaces: Strategies of good and poor performers. J. Vis. Impair. Blind. 1993, 87, 295–301. [Google Scholar] [CrossRef]
- Loomis, J.M.; Klatzky, R.L.; Golledge, R.G.; Cicinelli, J.G.; Pellegrino, J.W.; Fry, P.A. Nonvisual Navigation by Blind and Sighted. J. Exp. Psychol. Gen. 1993, 122, 73–91. [Google Scholar] [CrossRef]
- Espinosa, M.A.; Ungar, S.; Ochaita, E.; Blades, M.; Spencer, C. Comparing Methods for Introducing Blind and Visually Impaired People to Unfamiliar Urban Environments. J. Environ. Psychol. 1998, 18, 277–287. [Google Scholar] [CrossRef]
- Lahav, O. Using virtual environment to improve spatial perception by people who are blind. Cyberpsychol. Behav. 2006, 9, 174–177. [Google Scholar] [CrossRef]
- Kan-Kilic, D.; Dogan, F. Way-finding strategies of blind persons in urban scale. Psych J. 2017, 6, 303–315. [Google Scholar] [CrossRef]
- Kan-Kilic, D.; Dogan, F.; Duarte, E. Nonvisual aspects of spatial knowledge: Wayfinding behavior of blind persons in Lisbon. Psych J. 2020, 9, 769–790. [Google Scholar] [CrossRef]
- Passini, R.; Proulx, G.; Rainville, C. The Spatio-cognitive Abilities of the Visually Impaired Population. Environ. Behav. 1990, 22, 91–118. [Google Scholar] [CrossRef]
- Matsuda, Y.; Hara, T.; Kashiwase, M.; Nishide, K. A study on the eye movement in people with low vision—A case study in an eye clinic. Jpn. Archit. Rev. 2019, 2, 588–602. [Google Scholar] [CrossRef]
- Campus, C.; Brayda, L.; De Carli, F.; Chellali, R.; Famà, F.; Bruzzo, C.; Lucagrossi, L.; Rodriguez, G. Tactile exploration of virtual objects for blind and sighted people: The role of beta 1 EEG band in sensory substitution and supramodal mental mapping. J. Neurophysiol. 2012, 107, 2713–2729. [Google Scholar] [CrossRef] [PubMed]
- Kober, S.E.; Wood, G.; Kampl, C.; Neuper, C.; Ischebeck, A. Electrophysiological correlates of mental navigation in blind and sighted people. Behav. Brain Res. 2014, 273, 106–115. [Google Scholar] [CrossRef] [PubMed]
- Kupers, R.; Chebat, D.R.; Madsen, K.H.; Paulson, O.B.; Ptito, M. Neural correlates of virtual route recognition in congenital blindness. Proc. Natl. Acad. Sci. 2010, 107, 12716–12721. [Google Scholar] [CrossRef]
- Gagnon, L.; Schneider, F.C.; Siebner, H.R.; Paulson, O.B.; Kupers, R.; Ptito, M. Activation of the hippocampal complex during tactile maze solving in congenitally blind subjects. Neuropsychologia 2012, 50, 1663–1671. [Google Scholar] [CrossRef]
- Lynch, K. The Image of the City; The MIT Press: Cambridge, UK, 1960; pp. 46–48. [Google Scholar]
- Huang, T.; Zhou, S.; Chen, X.; Lin, Z.; Gan, F. Color Preference and Healing in Digital Roaming Landscape: A Case Study of Mental Subhealth Populations. Int. J. Environ. Res. Public Health 2022, 19, 10986. [Google Scholar] [CrossRef]
- Chen, N.; Zhao, M.; Gao, K.; Zhao, J. The Physiological Experimental Study on the Effect of Different Color of Safety Signs on a Virtual Subway Fire Escape—An Exploratory Case Study of Zijing Mountain Subway Station. Int. J. Environ. Res. Public Health 2020, 17, 5903. [Google Scholar] [CrossRef]
- Zhou, J.; Jia, X.; Xu, G.; Jia, J.; Hai, R.; Gao, C.; Zhang, S. The Relationship between Different Types of Alarm Sounds and Children’s Perceived Risk Based on Their Physiological Responses. Int. J. Environ. Res. Public Health 2019, 16, 5091. [Google Scholar] [CrossRef]
- Haber, R.N.; Haber, L.R.; Levin, C.A.; Hollyfield, R. Properties of spatial representations: Data from sighted and blind subjects. Percept. Psychophys. 1993, 54, 1–13. [Google Scholar] [CrossRef]
- Iwata, M.; Kitamoto, H. Study on the visibility of the lateral line of stairway edges in low illuminance environments of visually challenged persons. Jpn. Archit. Rev. 2019, 2, 610–625. [Google Scholar] [CrossRef]
- Iwata, M.; Kitamoto, H. Study on the relationship between illuminance and luminance contrast of a target and background for visually challenged people. Jpn. Archit. Rev. 2020, 3, 121–134. [Google Scholar] [CrossRef]
- Rousek, J.B.; Hallbeck, M.S. The use of simulated visual impairment to identify hospital design elements that contribute to wayfinding difficulties. Int. J. Ind. Ergon. 2011, 41, 447–458. [Google Scholar] [CrossRef]
- Cushley, L.N.; Galway, N.; Curran, K.; Peto, T. Navigating the Unseen City: Town Planners, Architects, Ophthalmic Professionals, and Charity Opinions on Navigating of the Built Environment with a Visual Impairment. Int. J. Environ. Res. Public Health 2022, 19, 7299. [Google Scholar] [CrossRef] [PubMed]


| Number of Participants | Characteristics | Major Issues |
|---|---|---|
| 18 | Visual Acuity Low vision (LV): 9 people Light-shadow perception (LSP): 7 people No perception of light and shadow (NPLS): 2 people Length of stay in work environment Less than 0.5 year: 4 people 0.5 to 10 years: 5 people More than 10 years: 9 people | Visually impaired physicians have individual differences in their subjective perception of the hospital environment. Pain points: Visually impaired doctors reported some problems with the hospital: the decorative colors and floor tiles in the waiting room are confusing, the backyard of the hospital and the entrance to the hospital are dangerous because they mix people and vehicles, and the accessibility of the pharmacy is poor. |
| Characteristics | Major Issues | |
|---|---|---|
| Route A | Outdoor space, mainly for parking, a necessary space for hospital entrances and exits. | Mixed traffic of people and vehicles is dangerous for the visually impaired. |
| Route B | The temporary tent set up in front of the hospital is where the hospital checks patients’ health codes during the COVID-19 pandemic. | The space is narrow and dimly lit, and the temporary functional space lacks interest. |
| Route C | The indoor space for patients waiting for consultation is in the traditional courtyard style with bright colors, which is highly ornamental and interesting. | Colorful interior decoration, which may cause dazzling. |
| Route D | It is an isolated area in the BA Hospital with a quiet environment. | Lots of changes and turns in this complex route. |
| Route E | It is an isolated area in the BA Hospital with a quieter environment and rich, green landscape. | The spot view of the route is dominated by gray exterior walls and greenery, which is not as interesting as the indoor space of the BA Hospital. |
| Participants | Age (Years) | Gender | Occupation | Length of Stay in Work Environment | Visual Characteristics | Congenitally Blind | Pathogenesis |
|---|---|---|---|---|---|---|---|
| P1 | 24 | Male | Intern | 0.5 | NPLS | YES | Unknown |
| P2 | 23 | Male | Intern | 0.5 | LV | YES | Unknown |
| P3 | 22 | Male | Intern | 0.5 | LV | YES | Unknown |
| P4 | 22 | Male | Intern | 0.5 | LSP | NO | Retinitis pigmentosa |
| P5 | 37 | Female | Doctor | 3 | NPLS | NO | Glaucoma |
| P6 | 27 | Male | Doctor | 2 | LSP | YES | Retinitis pigmentosa |
| P7 | 26 | Female | Doctor | 0.5 | LV | YES | Unknown |
| P8 | 22 | Male | Intern | 0.5 | LSP | YES | Retinitis pigmentosa |
| P9 | 24 | Male | Intern | 0.5 | LV | YES | Cataract |
| P10 | 21 | Male | Intern | 0.25 | LV | NO | Retinitis pigmentosa |
| P11 | 21 | Male | Intern | 0.25 | NPLS | YES | Retinitis pigmentosa |
| P12 | 28 | Female | Doctor | 3 | LSP | NO | Unknown |
| Content | Significance | |
|---|---|---|
| EDA Equipment name: ErgoLAB EDA Wireless Skin Electric Sensors Sampling rate: 64 Hz Accuracy: 0.01 μS Acquisition range: 0–30 μS Signal name: SC Average (μS) | Due to the steady-state character of the experimental procedure, without specific stimuli, a time-domain analysis was performed, using EDA time domain SC data to represent the skin conductance levels of visually impaired people over a period of travel [38,39,40]. In a person under duress, sweat secretion increases, resistance to the trace current through the sweat decreases, and SC increases. Conversely, in a relaxed person, the SC level decreases. | In this experiment, the tension or relaxation state of the participant in each route is illustrated. Thus, the comfort level of the environment is analyzed. |
| HRV Equipment name: ErgoLAB PPG Wireless Pulse Sensor Sampling rate: 64 Hz; Accuracy: 1% Acquisition range: 0–100% Signal name: HRV Average (bpm) | The mean values of HRV in the time domain were chosen to represent the level of heart rate variability of participants in each route [39,40]. HRV was closely related to emotional awakening. An increase in HRV was associated with an increase in emotion awakening and heart rate. A decrease in HRV was associated with a decrease in emotional awakening. | In this experiment, the degree of physical awakening of the participant in each route is illustrated. Thus, the extent to which the environment was interesting or monotonous is analyzed. |
| EEG Equipment name: BitBrain Hydropolar EEG System Sampling rate: 256 Hz Input range: ±100 mV; Input impedance: >50 GΩ Signal name: Gamma power Average (μV) | Gamma power, which is related to the events of this experiment, was selected for data analysis, representing the level of environmental perception of visually impaired people. Gamma power has an important role in the level of activity of the human brain and in higher activities such as transmission of information in the brain, integrated processing, and feedback [33,34]. It generally occurs when the brain performs cross-modal sensory processing tasks (e.g., synthesizing sound and light stimuli) or attempts to recall an object. It is susceptible to complex thinking operations. | In this experiment, the level of brain activity of the participants in each route is illustrated. Thus, the receptivity of participants to the environments is analyzed as easy or difficult to identify. |
| Participant | Visual Characteristics | Occupation | Length of Stay in Work Environment | Result | Description Method |
|---|---|---|---|---|---|
| P1 | NPLS | Intern | 0.5 year | Uncompleted | / |
| P2 | LV | Intern | 0.5 year |  | Edge |
| P3 | LV | Intern | 0.5 year |  | District |
| P4 | LSP | Intern | 0.5 year |  | Edge |
| P5 | NPLS | Doctor | 3 years |  | Path |
| P6 | LSP | Doctor | 2 years |  | Landmark |
| P7 | LV | Doctor | 0.5 year |  | District |
| P8 | LSP | Intern | 0.5 year |  | Edge |
| P9 | LV | Intern | 0.5 year |  | Landmark |
| P10 | LV | Intern | 0.25 year |  | District |
| P11 | NPLS | Intern | 0.5 year | Uncompleted | / |
| P12 | LSP | Doctor | 3 years |  | District |
| Number of the Visually Impaired Who Mentioned Space | Descriptive Feature Words | Elements | |
|---|---|---|---|
| Route A | 5 people | Vehicular entrance (LV, 0.5); Parking lot (LV, 0.5), (LSP, 0.5), (LSP, 3). | District, node |
| Route B | None | / | / |
| Route C | 11 people | Large waiting room—aisle—small waiting room (NPLS, 3); Rectangle—narrow aisle—square (LV, 0.25); Big hall—aisle—small hall (LSP, 0.5); Front yard—aisle—backyard (LV, 0.5), (LSP, 2), (LSP, 0.5), (LSP, 3). | Path, district |
| Route D | 2 people | Aisle (LV, 0.5), (LSP, 0.5) | Path |
| Route E | 4 people | Backyard (LSP, 3), (NPLS, 3); Yard (LSP, 2); Flower beds (LV, 0.5). | District, landmark |
| Route A | Route B | Route C | Route D | Route E | |
|---|---|---|---|---|---|
| Description | Vehicular entrance; Parking lot | / | Large waiting room—aisle—small waiting room; Rectangle—narrow aisle—square; Big hall—aisle—small hall; Front yard—aisle—backyard. | Aisle | Backyard; Yard; Flower beds |
| SC (μs) | 9.61 ± 2.92 | 8.34 ± 2.43 | 8.05 ± 2.55 | 8.68 ± 2.66 | 7.29 ± 2.20 |
| HRV (bpm) | 79.71 ± 19.17 | 79.57 ± 18.87 | 90.14 ± 16.65 | 81.71 ± 16.73 | 80.43 ± 19.10 |
| Gamma power (μV) | 30.40 ± 14.87 | 30.49 ± 15.33 | 33.17 ± 15.07 | 41.07 ± 14.66 | 33.08 ± 15.18 |
Disclaimer/Publisher’s Note: The statements, opinions and data contained in all publications are solely those of the individual author(s) and contributor(s) and not of MDPI and/or the editor(s). MDPI and/or the editor(s) disclaim responsibility for any injury to people or property resulting from any ideas, methods, instructions or products referred to in the content. |
© 2023 by the authors. Licensee MDPI, Basel, Switzerland. This article is an open access article distributed under the terms and conditions of the Creative Commons Attribution (CC BY) license (https://creativecommons.org/licenses/by/4.0/).
Share and Cite
Zou, X.; Zhou, Y. Spatial Cognition of the Visually Impaired: A Case Study in a Familiar Environment. Int. J. Environ. Res. Public Health 2023, 20, 1753. https://doi.org/10.3390/ijerph20031753
Zou X, Zhou Y. Spatial Cognition of the Visually Impaired: A Case Study in a Familiar Environment. International Journal of Environmental Research and Public Health. 2023; 20(3):1753. https://doi.org/10.3390/ijerph20031753
Chicago/Turabian StyleZou, Xinyi, and Ying Zhou. 2023. "Spatial Cognition of the Visually Impaired: A Case Study in a Familiar Environment" International Journal of Environmental Research and Public Health 20, no. 3: 1753. https://doi.org/10.3390/ijerph20031753
APA StyleZou, X., & Zhou, Y. (2023). Spatial Cognition of the Visually Impaired: A Case Study in a Familiar Environment. International Journal of Environmental Research and Public Health, 20(3), 1753. https://doi.org/10.3390/ijerph20031753