


A Systematic Review of the Efficacy of Microfocused Ultrasound for Facial Skin Tightening

 ,
,
Abstract
1. Introduction
2. Methods
2.1. Search Strategy
2.2. Eligibility Criteria
2.3. Study Selection
2.4. Data Extraction
2.5. Data Synthesis
3. Results
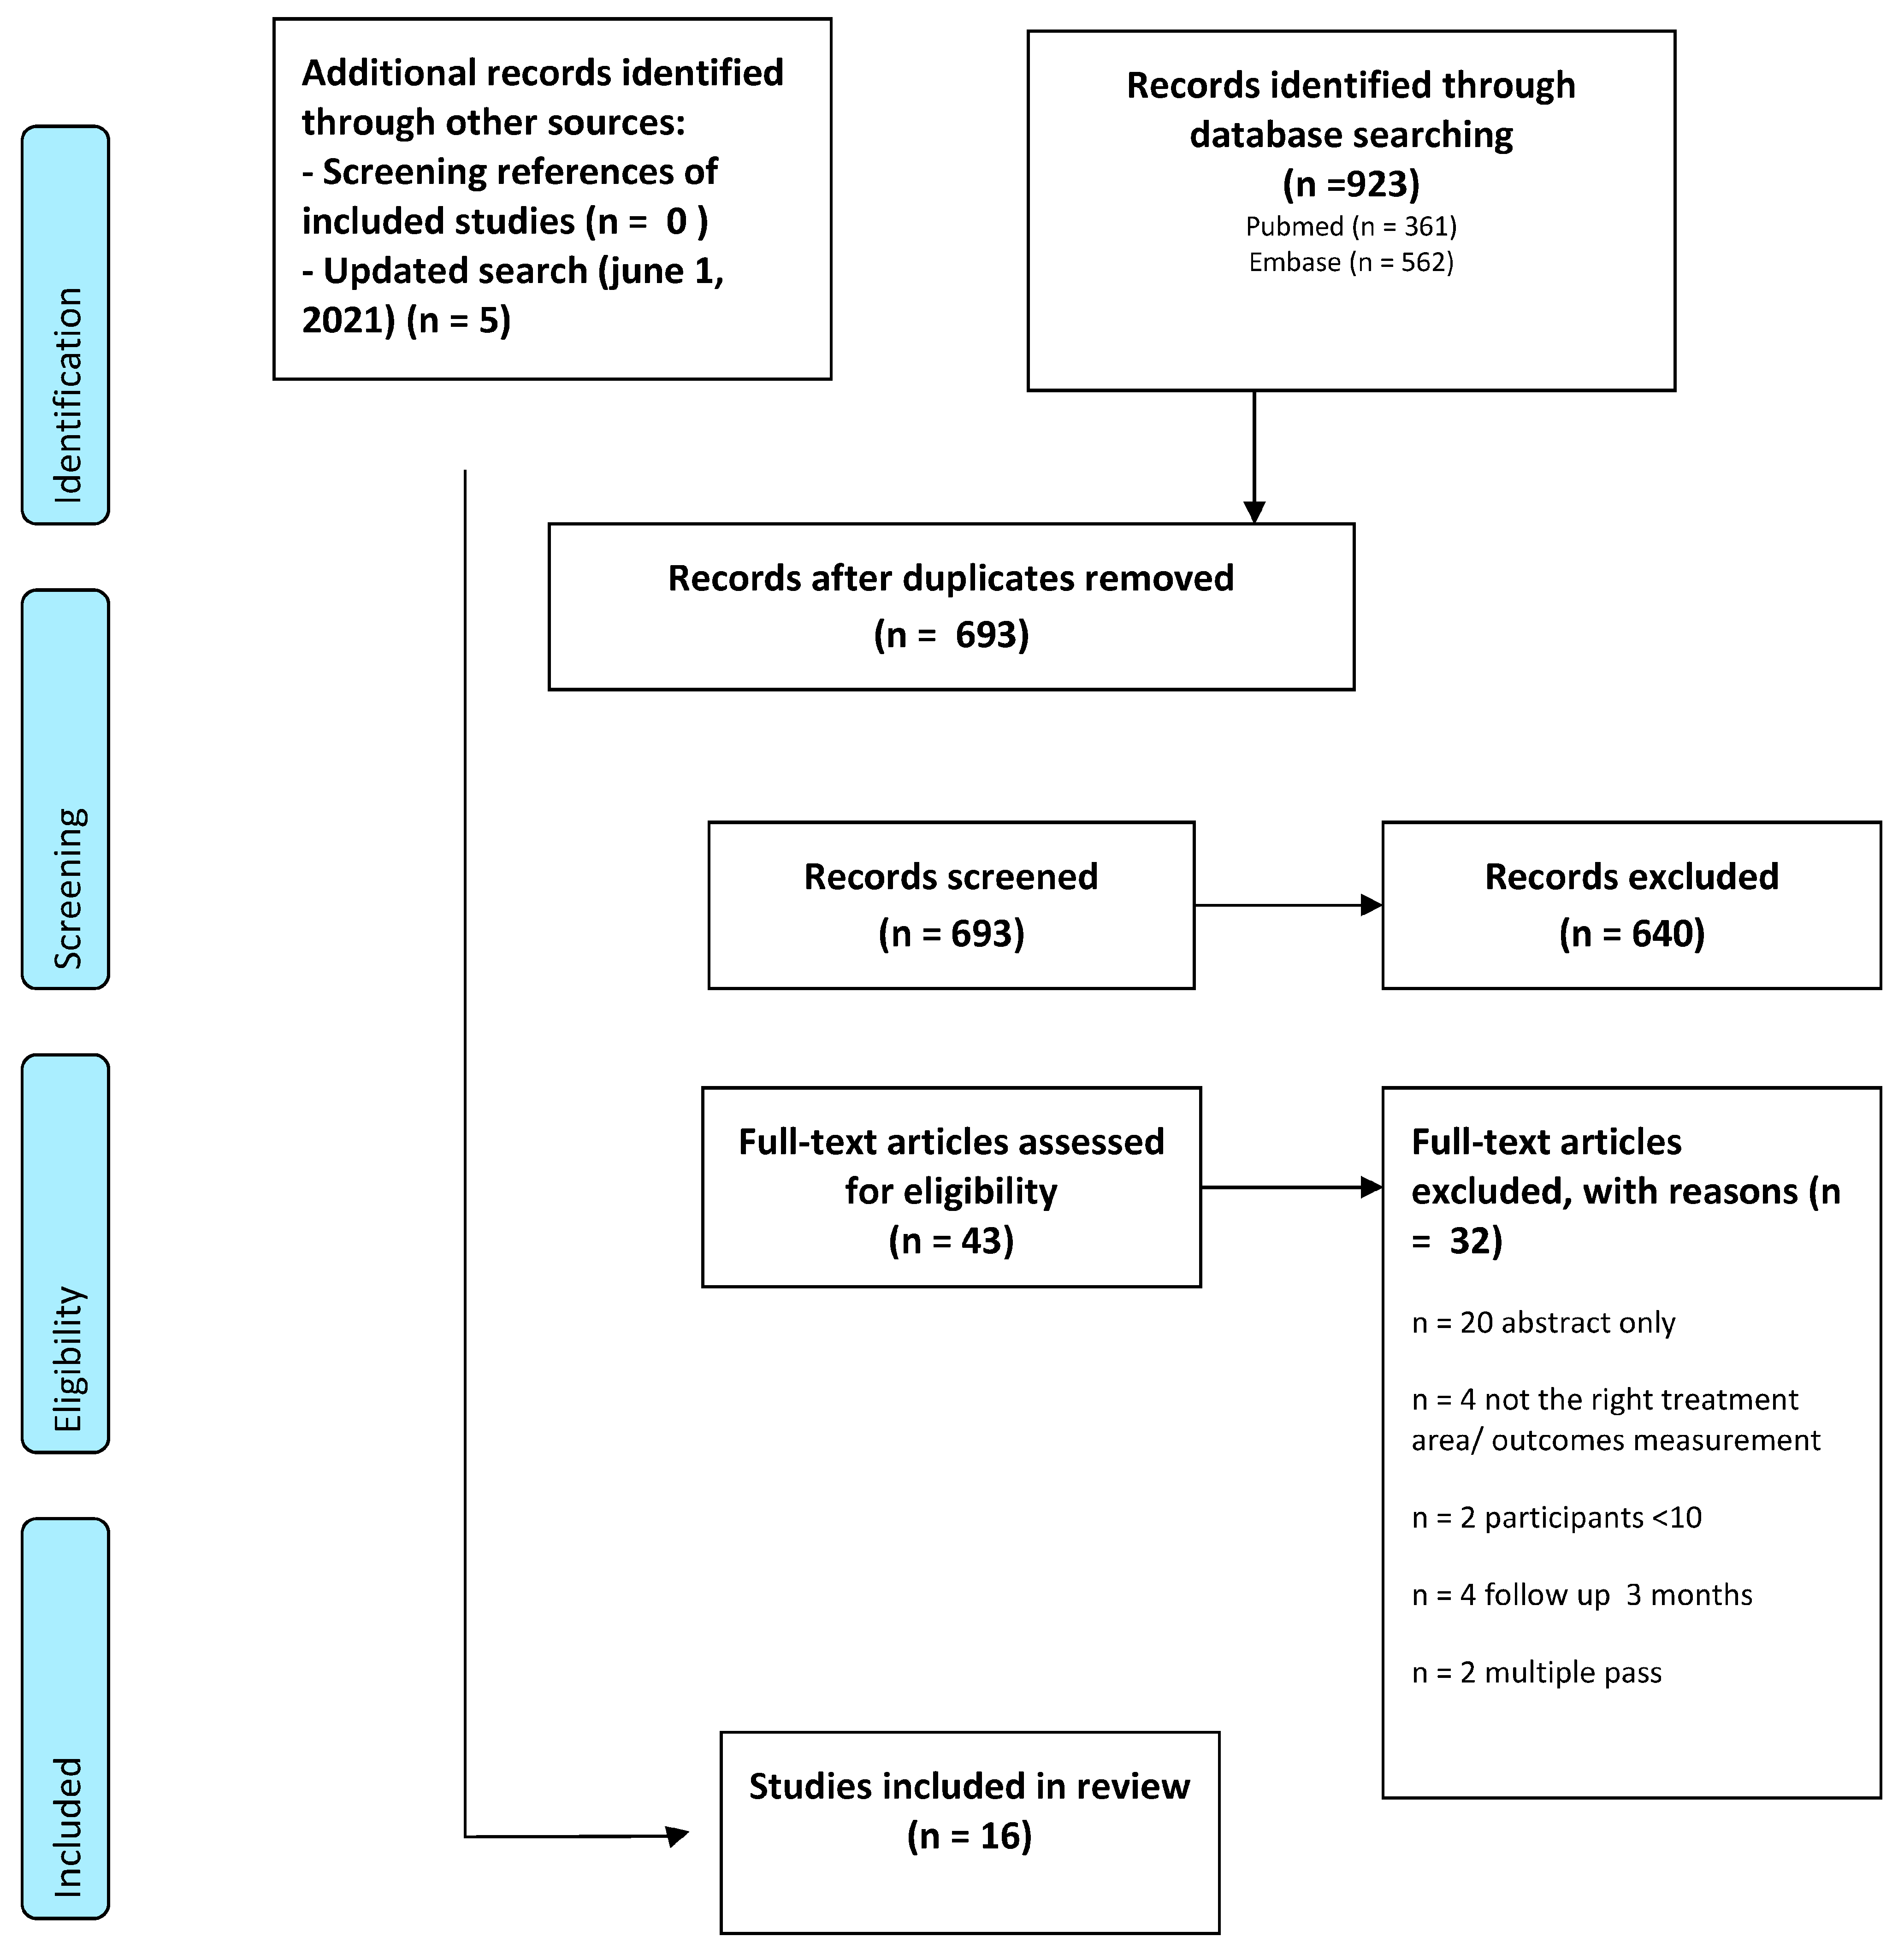
3.1. Study Selection
3.2. Interobserver Agreement
3.3. Study Characteristics
3.4. Treatment Effects
3.4.1. Objective Measurements (Table 3)
3.4.2. Subjective Measurements (Table 4 and Table 5)

| IGAIS 4-Point Scale 0 = No Change, 1 = Mild Improvement, 2 = Moderate Improvement, 3 = Significant Improvement | IGAIS 5-Point Scale 1 = Very Much Improved, 2 = Marked Improvement, 3 = Improved, 4 = No Change, 5 = Worse | ||||
|---|---|---|---|---|---|
| Author | Outcomes (%) Day 90 | Outcomes (%) Day 180 | Author | Outcomes (%) Day 90 | Outcomes (%) Day 180 |
| Sasaki et al. [18] Study group 1 N = 107 | 0: – – 1: 47 2: 53 3: – – | 0: – – 1: 31 2: 69 3: – – | Lu et al. [9] N= Day 90 21 Day 180 22 | 1: – – 2: 16 3: 68 4: 16 5: – – | 1: – – 2: 16 3: 72 4: 12 5: – – |
| Sasaki et al. [18] Study group 2 N = 55 | A 0: – – 1: 34 2: 48 3: 18 | 0: – – 1: 10.4 2: 63.4 3: 26.2 | Fabi et al. [17] N= Day 90 16 Day 180 45 | 1: 0 2: 44 3: 37 4: 19 5: – – | 1: 13 2: 18 3: 47 4: 22 5: – – |
| Ko et al. [9] Cheeks only N = 32 | 0: 9 1: 91 2: – – 3: – – | Werschler et al. [8] N= Day 90 20 Day 180 19 | 1: 5 2: 55 3: 40 4: – – 5: – – | 1: 5 2: 53 3: 42 4: – – 5: – – | |
| Lee et al. [13] Lower face N = 12 | 0: 20 1: 20 2: 40 3: 20 | Yalici-Armagan et al. [18] Lower face N = 24 | 1: – – 2: 4 3: 17 4: 63 5.17 | ||
| Shome et al. [23] Mid and lower face N = 50 | 0: – – 1: 52 2: 24 3: 24 | ||||
| Pooled Investigator Reported Scores (Converted scores) IGAIS 4- and 5-point score, all facial areas: score 0 = no change, 1 = mild improvement, 2 = moderate improvement, 3 = significant improvement, 4 = worsening. Data presented as percentage and number of cases. | |||||
| Day 90 (n = 337) | Day 180 (n = 249) | ||||
| No change (0) Mild improvement (1) Moderate improvement (2) Significant improvement (3) Worsening (4) | 7% (n = 25) 47% (n = 159) 36% (n = 122) 8% (n = 26) 1% (n = 4) | 5% (n = 13) 34% (n = 84) 52% (n = 130) 8% (n = 21) 0% | |||
| SGAIS 5-Point Scale. 1 = Very Much Improved, 2 = Much Improved, 3 = Improved, 4 = No Change, 5 = Worse | |||
|---|---|---|---|
| Author | Outcomes (%) Day 90 | Outcomes (%) Day 180 | Outcomes (%) Day 360 |
| Lu et al. [14] N= Day 90 21 Day 180 22 | 1: 4 2: 12 3: 68 4: 16 5: – – | 1: – – 2: – – 3: 80 4: 20 5: – – | |
| Fabi et al. [24] N= Day 90 16 Day 180 45 | 1: 2: 19 3: 56 4: 25 5 – – | 1: 13 2: 9 3: 56 4: 22 5:– – | |
| Werschler et al. [12] N= Day 90 20 Day 180, 360 19 | 1: 25 2: 25 3: 40 4: 10 5: – – | 1: 16 2: 37 3: 42 4: 5 5: – – | 1: 11 2: 32 3: 53 4: 5 5: – – |
| Yalici-Armagan et al. [19] N = 24 Lower face | 1: 5 2: 40 3: 10 4: 45 5: – – | ||
| Pooled patient-reported scores (Converted) SGAIS 5-point scale: all facial areas: score 0 = no change, 1 = mild improvement, 2 = moderate improvement, 3 = significant improvement, 4 = worsening. Data presented as percentage and number of cases. | |||
| Day 90 (n = 81) | Day 180 (n = 86) | Day 360 (n = 19) | |
| No change (0) Mild improvement (1) Moderate improvement (2) Significant improvement (3) Worsening (4) | 25% (n = 20) 42% (n = 34) 25% (n = 20) 9% (n = 7) 0% | 17% (n = 15) 59% (n = 51) 13% (n = 11) 10% (n = 9) 0% | 5% (n = 1) 53% (n = 10) 32% (n = 6) 11% (n = 2) 0% |
3.5. Devices, Treatment Regimens and Adverse Effects (Table 2)
4. Discussion
Author Contributions
Funding
Data Availability Statement
Conflicts of Interest
Appendix A
Search Strategy
Appendix B
| Was the treatment applied to the face? | Yes | No | ? |
| Were participants 18 years or older | Yes | No | ? |
| Was there a treatment indication for skin tightening, wrinkles, laxity or rhytides in the face? | Yes | No | ? |
| Have improvement outcomes been evaluated? (sGAIS, pGAIS, blind evaluators, quality of life, etc.) | Yes | No | ? |
| Did the study include 10 human participants or more? | Yes | No | ? |
| Was the treatment a combination treatment in which two or more treatments other than ultrasound are applied in the same area? | Yes | No | ? |
| Was the device a hand-held device for home use? | Yes | No | ? |
| Was the follow up < 3 months? | Yes | No | ? |
| Was the only indication for treatment other than skin tightening? (pore size, acne, rosacea, etc.) | Yes | No | ? |
| Is the paper a case report, study with participants < 10 or abstract only? | Yes | No | ? |
Appendix C

References
- Kennedy, J.E.; Ter Haar, G.R.; Cranston, D. High intensity focused ultrasound: Surgery of the future? Br. J. Radiol. 2003, 76, 590–599. [Google Scholar] [CrossRef] [PubMed]
- White, W.M.; Maskin, I.R.; Barthe, P.G.; Slayton Gliklich, R.E. Selective creation of thermal injury zones in the superficial musculoaponeurotic system using intense ultrasound therapy: A new target for noninvasive facial rejuvenation. Arch. Facial Plast. Surg. 2007, 9, 22–29. [Google Scholar] [CrossRef] [PubMed]
- White, W.M.; Makin, I.R.S.; Slayton, M.H.; Barthe, P.G.; Gliklich, R. Selective transcutaneous delivery of energy to porcine soft tissues using Intense Ultrasound (IUS). Lasers Surg. Med. 2008, 40, 67–75. [Google Scholar] [CrossRef] [PubMed]
- Gutowski, K.A. Microfocused Ultrasound for Skin Tightening. Clin. Plast. Surg. 2016, 43, 577–582. [Google Scholar] [CrossRef] [PubMed]
- Hantash, B.M.; Ubeid, A.A.; Chang, H.; Kafi, R.; Renton, B. Bipolar fractional radiofrequency treatment induces neoelastogenesis and neocollagenesis. Lasers Surg. Med. 2009, 41, 1–9. [Google Scholar] [CrossRef] [PubMed]
- Hantash, B.M.; Bedi, V.P.; Kapadia, B.; Rahman, Z.; Jiang, K.; Tanner, H.; Chan, K.F.; Zachary, C.B. In vivo histological evaluation of a novel ablative fractional resurfacing device. Lasers Surg. Med. 2007, 39, 96–107. [Google Scholar] [CrossRef]
- Liberati, A.; Altman, D.G.; Tetzlaff, J.; Mulrow, C.; Gøtzsche, P.C.; Ioannidis, J.P.; Clarke, M.; Devereaux, P.J.; Kleijnen, J.; Moher, D. The PRISMA statement for reporting systematic reviews and meta-analyses of studies that evaluate health care interventions: Explanation and elaboration. PLoS Med. 2009, 6, e1000100. [Google Scholar] [CrossRef]
- Alhaddad, M.; Wu, D.C.; Bolton, J.; Wilson, M.J.; Jones, I.T.; Boen, M.; Goldman, M.P. A Randomized, Split-Face, Evaluator-Blind Clinical Trial Comparing Monopolar Radiofrequency Versus Microfocused Ultrasound with Visualization for Lifting and Tightening of the Face and Upper Neck. Dermatol. Surg. 2019, 45, 131–139. [Google Scholar] [CrossRef]
- Ko, E.J.; Hong, J.Y.; Kwon, T.-R.; Choi, E.J.; Jang, Y.-J.; Choi, S.Y.; Yoo, K.H.; Kim, S.Y.; Kim, B.J. Efficacy and safety of non-invasive body tightening with high-intensity focused ultrasound (HIFU). Ski. Res. Technol. 2017, 23, 558–562. [Google Scholar] [CrossRef]
- Oni, G.; Hoxworth, R.; Teotia, S.; Brown, S.; Kenkel, J. Evaluation of a microfocused ultrasound system for improving skin laxity and tightening in the lower face. Aesthetic. Surg. J. 2014, 34, 1099–1110. [Google Scholar] [CrossRef]
- Park, H.; Kim, E.; Kim, J.; Ro, Y.; Ko, J. High-Intensity Focused Ultrasound for the Treatment of Wrinkles and Skin Laxity in Seven Different Facial Areas. Ann. Dermatol. 2015, 27, 688–693. [Google Scholar] [CrossRef] [PubMed]
- Werschler, W.P.; Werschler, P.S. Long-term Efficacy of Micro-focused Ultrasound with Visualization for Lifting and Tightening Lax Facial and Neck Skin Using a Customized Vectoring Treatment Method. J. Clin. Aesthet. Dermatol. 2016, 9, 27–33. [Google Scholar]
- Lee, H.S.; Jang, W.S.; Cha, Y.-J.; Choi, Y.-H.; Tak, Y.; Hwang, E.; Kim, B.J.; Kim, M.N. Multiple pass ultrasound tightening of skin laxity of the lower face and neck. Dermatologic. Surg. 2012, 38, 20–27. [Google Scholar] [CrossRef] [PubMed]
- Lu, P.-H.; Yang, C.-H.; Chang, Y.; Chang, Y.-C. Quantitative analysis of face and neck skin tightening by microfocused ultrasound with visualization in asians. Dermatologic. Surg. 2017, 43, 1332–1338. [Google Scholar] [CrossRef] [PubMed]
- Fabi, S.G.; Goldman, M.P. Retrospective evaluation of micro-focused ultrasound for lifting and tightening the face and neck. Dermatologic. Surg. 2014, 40, 569–575. [Google Scholar] [CrossRef]
- Saket, P.; Shobeihi, S.; Mehrdadi, S. Study of efficacy of esthetic High-Intensity Focused Ultrasound system on Iranian skin for reducing the laxity and wrinkles of aging. J. Cosm. Dermatol. 2017, 16, 336–341. [Google Scholar] [CrossRef]
- Alam, M.; White, L.E.; Martin, N.; Witherspoon, J.; Yoo, S.; West, D.P. Ultrasound tightening of facial and neck skin: A rater-blinded prospective cohort study. J. Am. Acad. Dermatol. 2010, 62, 262–269. [Google Scholar] [CrossRef]
- Sasaki, G.H.; Tevez, A.; Tevez, A. Clinical efficacy and safety of focused-image ultrasonography: A 2-year experience. Aesthetic. Surg. J. 2012, 32, 601–612. [Google Scholar] [CrossRef]
- Yalici-Armagan, B.; Elcin, G. Evaluation of microfocused ultrasound for improving skin laxity in the lower face: A retrospective study. Dermatol. Ther. 2020, 8, e14132. [Google Scholar] [CrossRef]
- Friedman, O.; Isman, G.; Koren, A.; Shoshany, H.; Sprecher, E.; Artzi, O. Intense focused ultrasound for neck and lower face skin tightening a prospective study. J. Cosmet. Dermatol. 2020, 19, 850–854. [Google Scholar] [CrossRef]
- Araco, A. Prospective Study on Clinical Efficacy and Safety of a Single Session of Microfocused Ultrasound with Visualization for Collagen Regeneration. Aesthetic. Surg. J. 2020, 40, 1124–1132. [Google Scholar] [CrossRef]
- Wanitphakdeedecha, R.; Yan, C.; Ng, J.N.C.; Nokdhes, Y.N.; Tantrapornpong, P.; Techapichetvanich, T.; Eimpunth, S.; Manuskiatti, W. The efficacy of macro-focused ultrasound in the treatment of upper facial laxity: A pilot study. J. Cosmet. Dermatol. 2020, 19, 1955–1961. [Google Scholar] [CrossRef] [PubMed]
- Shome, D.; Vadera, S.; Ram, M.S.; Khare, S.; Kapoor, R. Use of Micro-focused Ultrasound for Skin Tightening of Mid and Lower Face. Plast. Reconstr. Surg. 2019, 7, e2498. [Google Scholar] [CrossRef] [PubMed]
- Fabi, S.G. Microfocused ultrasound with visualization for skin tightening and lifting: My experience and a review of the literature. Dermatologic. Surg. 2014, 40, S164–S167. [Google Scholar] [CrossRef] [PubMed]
- Bozec, L.; Odlyha, M. Thermal denaturation studies of collagen by microthermal analysis and atomic force microscopy. Biophys. J. 2011, 101, 228–236. [Google Scholar] [CrossRef] [PubMed]
- Fritz, K.; Salavastru, C. Ways of Noninvasive Facial Skin Tightening and Fat Reduction. Facial Plast. Surg. 2016, 32, 276–282. [Google Scholar]
- Keagle, J.N.; Welch, W.J.; Young, D.M. Expression of heat shock proteins in a linear rodent wound. Wound Rep. Reg. 2001, 9, 378–385. [Google Scholar] [CrossRef]
- Dąbrowska, M.; Mielcarek, A.; Nowak, I. Evaluation of sex-related changes in skin topography and structure using innovative skin testing equipment. Ski. Res. Technol. 2018, 24, 614–620. [Google Scholar] [CrossRef]
- Shuster, S.; Black, M.M.; McVitie, E. The influence of age and sex on skin thickness, skin collagen and density. Br. J. Dermatol. 1975, 93, 639–643. [Google Scholar] [CrossRef]
| Study | Title | Type | Aim | N Age (Mean) Range | Whole Face/(Separate) Areas on the Face Evaluation | Method of Measurement | Length of Follow-Up |
|---|---|---|---|---|---|---|---|
| Alhaddad et al. [8] | Randomized, Split-Face, Evaluator-Blind Clinical Trial Comparing Monopolar Radiofrequency Versus Microfocused Ultrasound With Visualization for Lifting and Tightening of the Face and Upper Neck | Prospective, single-centre, randomized, evaluator-blinded, split-face clinical trial | To compare the efficacy and safety of MRF versus MFU-V for the lifting and tightening of the face and neck. | N = 20 100% female 52.6 32–60 | Eyelids Cheeks Melolabial folds Jowls | Fasil Face and Neck Laxity Grading Scale (FLR) (clinician evaluation) 5-point Subject Global Aesthetic Improvement Scale (SGAIS) Pain Visual Analogue Score (VAS) | 180 days |
| Ko et al. [9] | Efficacy and safety of non-invasive body tightening with high-intensity focused ultrasound (HIFU) | Prospective clinical trial | Evaluation of the efficacy and safety of HIFU for skin tightening on the face and body. | N = 32 91% female 44.4 21–59 | Cheeks | Independent blinded evaluation by 3 reviewers SGAIS | 12 weeks |
| Oni et al. [10] | Evaluation of a Microfocused Ultrasound System for Improving Skin Laxity and Tightening in the Lower Face | Prospective nonrandomized clinical trial | The authors investigated tightening and lifting of cheek tissue, improvement in jawline definition and reduction in submental skin laxity in patients treated with the Ulthera System. | N = 103 85% female 49.2 35–60 | Cheek/lower face | Masked reviewers Patient satisfaction questionnaire Quantitative evaluation | 90 days |
| Park et al. [11] | High-Intensity Focused Ultrasound for the Treatment of Wrinkles and Skin Laxity in Seven Different Facial Areas | Prospective | This study was aimed at evaluating the clinical efficacy of and patient satisfaction with HIFU treatment for wrinkles and laxity in seven different areas of the face in Asian skin. | N = 20 90% female 52.3 37–75 | Whole face Supraorbital Zygomatic infraorbital Perioral Cheek Preauricular Jawline | Evaluation of pretreatment and post-treatment photographs by two independent clinicians. To assess the severity of facial wrinkles and skin measured by modified eight-point photographic scale. Each facial area was evaluated before treatment and after 3 and 6 months by using the following scale: 0, none; 1, mild; 2, mild/moderate; 3, moderate; and 4, severe. The overall clinical improvement was also assessed. Patient satisfaction score | 6 months |
| Werschler et al. [12] | Long-term Efficacy of Micro-focused Ultrasound with Visualization for Lifting and Tightening Lax Facial and Neck Skin Using a Customized Vectoring Treatment Method | Prospective, open-label pilot study | To evaluate the efficacy and safety of patient-specific, customized micro-focused ultrasound with visualization treatment with vertical vectoring to lift and tighten facial and neck tissue. | N = 20 96% female 47 34–60 | Whole face | Blinded qualitative assessment IGAIS, SGAIS Patient satisfaction questionnaires (PSQ) Quantitative evaluation | 1 year |
| Lee et al. [13] | Multiple Pass Ultrasound Tightening of Skin Laxity of the Lower Face and Neck | Prospective study | To evaluate the efficacy and safety of patient-specific, customized micro-focused ultrasound with visualization treatment with vertical vectoring to lift and tighten facial and neck tissue. | N = 12 100% female 59 55–71 | Lower face | Blinded reviewers evaluated paired pretreatment and post-treatment photographs IGAIS | 90 days |
| Lu et al. [14] | Quantitative Analysis of Face and Neck Skin Tightening by Microfocused Ultrasound With Visualization in Asians | Single-site prospective, nonrandomized clinical trial | To evaluate the 800 treatment lines of MFU-V on skin tightening effect of face and neck in Asians using 2 quantitative analysis systems at 0, 90, and 180 days after treatment. | N = 25 92% female 53.3 40–61 | Whole face | IGAIS blinded, SGAIS (live assessment of the subject with pretreatment digital image) Quantitative evaluation | 180 days |
| Fabi et al. [15] | Retrospective Evaluation of Micro-focused Ultrasound for Lifting and Tightening the Face and Neck | Retrospective study | To evaluate the safety and efficacy of MFU with visualization (MFU-V) for noninvasive treatment of facial and neck skin laxity 180 days after treatment and determine what lifestyle factors affect treatment outcomes. | N = 48 100% Female 58 39–85 | Whole face | Blinded reviewers IGAIS, SGAIS Patient satisfaction questionnaires (PSQ) Quantitative evaluation | 180 days |
| Saket et al. [16] | Study of efficacy of esthetic High-Intensity Focused Ultrasound system on Iranian skin for reducing the laxity and wrinkles of aging | Not stated | To evaluate the clinical efficacy and safety of high-intensity focused ultrasound on skin laxity and wrinkles. | N = 22 100% female 35–62 | Whole face Forehead Brow Infraorbital Nasolabial Perioral Lateral orbit Cheeks | The level of efficacy was evaluated and measured by observation of two reviewers from 10% to 100%, where 10% means no efficacy and 100 means maximum efficacy. Overall and regional measurements. Patient opinion | 3 months |
| Alam et al. [17] | Ultrasound tightening of facial and neck skin: A rater-blinded prospective cohort study | Rater-blinded, prospective cohort study | To assess the efficacy of ultrasound skin tightening for brow-lifts in the context of a procedure treating the full face and neck. | N = 35 97% female 44 32–62 | Brows | Three masked clinicians evaluated paired pre-treatment and post-treatment photos Quantitative evaluation | 90 days |
| Sasaki et al. [18] Gr. 1 | Clinical Efficacy and Safety of Focused-Image Ultrasonography: A 2-Year Experience | Prospective 2-part study | To assess the efficacy of ultrasound skin tightening for brow-lifts in the context of a procedure treating the full face and neck. | N = 107 94% female 53.5 25–77 | Whole face Brows, nasolabial fold | Investigator Global Aesthetic Improvement Scale (IGAIS), blinded Quantitative evaluation The validated Fitzpatrick Wrinkle, Fold, and Tissue Laxity Scale (FWFTLS) | 90 days |
| Sasaki et al. [18] Gr. 2 | N = 55 96% female 64.4 26–74 | 90 days | |||||
| Yalici-Armagan et al. [19] | Evaluation of microfocused ultrasound for improving skin laxity in the lower face: A retrospective study | Retrospective study | To evaluate the efficacy and safety of a newer microfocused ultrasound (MFU) device on the lower face laxity. | 24 96% female 52.5 34–69 | Lower face | Two blinded dermatologists independently assessed paired before and after photographs in a randomised fashion. IGAIS, SGAIS | median of 4.3 months |
| Friedman [20] | Intense focused ultrasound for neck and lower face skin tightening a prospective study | Prospective, single-center study | To report authors experience with Doublo IFUS (Doublo™, HIRONIC Co.,Gyeonggi-do, Korea) for treating neck and lower face laxity. | N = 43 91% female 56.5 24–80 | Lower face | Physician global assessment scale (Ph-GAS) Physician global assessment scale (PHh-GAS): 0—worse, 1—0–25% poor response, 2—25–50% fair response, 3—50–75% good response, 4—75–100%–excellent response. Patient global assessment scale: 1—0–25% poor response, 2—25–50% fair response, 3—50–75% good response, 4—75–100%–excellent response Patient satisfaction: 0—not satisfied, 1—mildly satisfied, 2—moderately satisfied, 3—very satisfied. | 90 days |
| Araco [21] | Prospective Study on Clinical Efficacy and Safety of a Single Session of Microfocused Ultrasound With Visualization for Collagen Regeneration | Prospective study | The primary study endpoint was the improvement of the laxity and ptosis face skin. | N = 50 94% Female 52.8 31–64 | Mid/lower face | Reviewers scored the photographs from 1 to 20 by self-developed scoring system. Self-developed patient satisfaction questionnaire (PSQ) | 6 months |
| Wanitphakdeedecha et al. [22] | The efficacy of macro-focused ultrasound in the treatment of upper facial laxity: A pilot study | Prospective, evaluator-blinded pilot study | To evaluate the efficacy and safety of MFU with a 2.0 mm transducer in the treatment of upper facial laxity in Thai patients. | N = 34 85% female 35.4 20–49 | Upper face | Assessment of upper facial laxity improvement using a grading scale: 0 = no improvement, 1 = minimal improvement, 2 = moderate improvement, 3 = marked improvement, 4 = excellent improvement Quantitative evaluation | 6 months |
| Shome et al. [23] | Use of Micro-focused Ultrasound for Skin Tightening of Mid and Lower Face | Prospective, double-blind study | N = 50 52% female 38.4 25–55 | Mid/lower face | IGAIS, SGAIS | 1 year |
| Study/n | Intervention/Transducers | Settings/Lines/Joules (If Stated) | Anesthetics | Pain | Adverse Effects | Device Used |
|---|---|---|---|---|---|---|
| Alhaddad et al. [8] N = 20 | Target the superficial musculoaponeurotic system of the face 4 MHz, 4.5 mm 7 MHz, 4.5 mm 7 MHz, 3.0 mm 10 MHz, 1.5 mm | A total of 195 lines were delivered to the deeper tissue level, and 205 lines were delivered to the superficial tissue level (one side of the face only) | Topical 7%/7% lidocaine–tetracaine topical ointment | 2.35 ± 2.0 VAS (0–10) | One patient developed Grade 1 erythema. | Ulthera |
| Ko et al. [9] N = 32 | n = 32. The sizes of the involved areas were 5.0 × 5.0 cm2 on each cheek MF1: 7 MHz, 1.5-mm MF3: 2 MHz, 3.0-mm MF4: 2 MHz, 4.5-mm | 120 shots for the cheek, pulse ranged from 1.0 to 1.5 J distributing a total 537.6 J | Topical anaesthetic cream | 3.00 ± 1.6 VAS (0–10) | Erythema was seen in up to 9.38% mostly subsided within 5 days. Ecchymosis was seen in up to 6.25% (n = 2) dissolving in 3 days. | Ultraformer III |
| Oni et al. [10] N = 103 | All treatment areas received 2 passes: 1. Ulthera Deep See 4–4.5 transducer (deeper penetration) 2. DS 7–3.0 transducer (more superficial penetration) for the second pass | Approximately 295 exposure lines were placed on each patient’s face and neck. | Oral medications (5–10 mg of diazepam and 5/325 mg of hydrocodone/acetaminophen. Intramuscular medication (60 mg of ketorolac tromethamine) | Cheeks 5.68 Submental area 6.09 Submandibular region 6.53 NRS (0–10) | Wheal on cheeks in three patients. | Ulthera |
| Park et al. [11] N = 20 | Patients were treated with a HIFU-tightening device to the entire face except for the nose and eyes. 4 MHz, 4.5-mm 7 MHz, 4.5-mm 7 MHz, 3.0-mm | Each probe delivered a set of pulses in a linear array at 1 cm intervals. From 400 to 500 shots were delivered according to the size of the face. | Topical lidocaine/prilocaine cream three patients, received a nerve block of the supraorbital, supratrochlear, intraorbital and mental nerves | Not stated | Six patients with erythema and swelling, and two patients with purpura and bruising. Resolved within 2 weeks. | Ulthera |
| Werschler et al. [12] N = 20 | Treatments were delivered using a vectored pattern 4.0 and 7.0 MHz at focal depth 3.0 and 4.5 mm. | Subjects received a mean of 683 treatment lines (range 609–700) in the cheeks, submentum, submandibular, peri orbital and brow regions | Not stated | 4.0 at 4.0 Mhz/4.5 mm 3.2 at 7.0 Mhz/3.0 mm, 5.5 at 7.0 Mhz/4.5 mm NRS (0–10) | One patient swelling under right eye. Resolved within 4 days. | Ulthera |
| Lee et al. [13] N = 12 | The dermis and subcutaneous tissue were targeted using the 4-MHz, 4.5-mm-focal-depth and 7 MHz, 3.0 mm focal depth probes. | 4 MHz, 4.5 mm focal depth (0.75–1.2 J) 7 MHz, 4.5 mm focal depth (0.75–1.05 J) 7 MHz, 3.0 mm focal depth (0.4–0.63 J | Topical anaesthetic ointment (9% lidocaine) | 3.9 ± 1.66 VAS (0–10) | All subjects developed slight erythema and oedema immediately after treatment. | Ulthera |
| Lu et al. [14] N = 25 | Subjects were treated with MFU-V to the face and neck using 2 different transducers: 4 MHz, 4.5 mm focal depth and 7 MHz, 3.0 mm focal depth with a total of 800 lines. | Total 800 lines were given; 4 MHz, 4.5 mm, 0.90 J, 350 lines on the cheeks and neck; 7 MHz, 3.0 mm 0.30 J 430 lines on the forehead temple area, cheeks and neck 7 MHz, 3.0 mm focal depth, 0.30 J, 20 lines on the infraorbital area. | All subjects had topical anaesthesia containing 2.5% lidocaine and 2.5% prilocaine oral analgesics with ibuprofen 800 mg before the treatment | 4.1 (2.0) 4.5 mm 2.7 (1.6) 3.0 mm VAS (0–10) | Three soreness, 20 bruising/oedema/erythema, two others (contact dermatitis and submandibular burns). | Ulthera |
| Fabi et al. [24] N = 48 | MFU-V treatment of the face and upper neck using the 4 MHz, 4.5 mm and 7 MHz, 3.0 mm depth transducers. | 370–420 treatment lines at the highest energy settings. | 10% of subjects received topical application of 23% lidocaine/7% tetracaine 15% received it in combination with oral diazepam (5–10 mg) The majority of subjects received a combination of topical anaesthesia, oral diazepam (5–10 mg) and an intramuscular injection of 50 to 100 mg of meperidine and 50 mg of hydroxyzine | Not stated | One patient showed evidence of a 2 mm white dermal papule on the upper neck. | Ulthera |
| Saket et al. [16] n = 22 | Treatment of brow, forehead, infraorbital rim, lateral orbit, nasolabial folds, prioral and cheeks. The areas with the thinnest skin treated with superficial depth probes; the brow and temple treated with superficial and deeper probes; cheek and submental skin were treated with the deepest 4 MHz 4.5 mm probe followed by additional treatment with a superficial probe. | The energy level set between; 1.5 mm transducer 0.2 and 0.25 J; 3 mm transducer set between 0.5 and 0.7 J; 4.5 mm transducer set between 0.6 and 0.85 J. The number of shots (varied between 600 and 800 lines that seemed covered the whole faces with maximum efficacy. | None used | 2.5 NRS 1–5 | Not stated | UTIMS A1 |
| Alam et al. [17] N = 35 | Subjects treated with a focused intense ultrasound tightening device to the forehead, temples, cheeks, submental region and side of neck using the following probes: 4 MHz, 4.5 mm focal depth; 7 MHz, 4.5 mm focal depth and 7 MHz, 3.0 mm focal depth. | On average, 110 exposure lines were placed using the focused ultrasound system on the face and neck of each subject. | Topical anaesthetic Ointment (7%/7%) lidocaine-tetracaine | 3–4 NRS (1–10) | Two early subjects developed elevated white linear striations of the neck. | Ulthera |
| Sasaki et al. [18] Gr. 1 N = 107 | Above the superolateral brow, the fibromuscular layer and dermal treatment lines were administered in vertical directions, but these were administered horizontally within crow’s feet sites. Within the malar bag site, all fibromuscular and dermal treatment lines were placed in a superomedial direction. In the face and neck, fibromuscular treatment lines were positioned in a horizontal direction, and dermal treatment lines were placed superolaterally. | 423 J to each lateral brow and crow’s feet (7 MHz, 3.0 mm, 15 lines; 7 MHz, 4.5 mm, 15 lines) 461.2 J to each malar bag (7 MHz, 3.0 mm, 15 lines; 4 MHz, 4.5 mm, 15 lines); 1845 J to each half of the face (7 MHz, 3.0 mm, 60 lines; 4 MHz, 4.5 mm, 60 lines); 2306 J to the entire neck (7 MHz, 3.0 mm, 75 lines; 4 MHz, 4.5 mm, 75 lines). | A pain management program was initiated in a graded fashion. It consisted of administering oral analgesic or sedative medication, giving distractive hand and foot massages, reducing skin temperature with an air coolant device, lowering joule settings (by 1 level for each transducer or by shortening the length of treatment lines) and, if necessary, administering selective nerve blocks or limited amounts of buffered lidocaine (subcutaneously) | Peri-orbital 5.7 face 3.7 NRS (0–10) | All patients experienced transient erythema for 1 to 2 h and mild swelling for several days. Mild bruising generally resolved within 1 to 2 weeks. Three patients had transient dysesthesia (numbness or hypersensitivity). | Ulthera |
| Sasaki et al. [18] Gr. 2 N = 55 | Patients received twice the number of treatment lines (oppose to gr 1) and, therefore, increased joule energy to each site (except the malar bag area where treatment remained the same as before). | 846 J to each lateral brow and crow’s feet (7 MHz, 3.0 mm, 30 lines; 7 MHz, 4.5 mm, 30 lines); 461.2 J to each malar bag (7 MHz, 3.0 mm, 15 lines; 4 MHz, 4.5 mm, 15 lines) 3690 J to each half of the face (7 MHz, 3.0 mm, 120 lines; 4 MHz, 4.5 mm, 120 lines); (3) 4612 J to the entire neck (7 MHz, 3.0 mm, 150 lines; 4 MHz, 4.5 mm, 150 lines). | Not stated | Ulthera | ||
| Yalici-Armagan et al. [19] N = 24 | 7.5 MHz 3.0 mm and 4 MHz 4.5 mm for treating lower facial and submental laxity. Treatment was performed by 2 dermatologists following the manufacturer’s recommended protocol. | Cheeks and submentum: 4.5 mm; 0.9 to 1.2 J and 3.0 mm 0.35 to 0.45 J. Mean treatment line 262 ± 29.7 (range 217–335). | No numeric measurement | One subject reported transient stinging sensation/dysesthesia on the face after the procedure that lasted approximately 6 months. Another subject reported erythema and striation after application. | Microson (Cosmoplus Co., Sungnam, Korea) | |
| Friedman [20] N = 43 | IFUS treatment of neck and lower facial skin laxity | The submental region, cheeks 4 MHz, 4.5 mm probe (1.2 J) and 7 MHz and 3.0 mm probe (0.65 J) | Topical anaesthetic ointment (lidocaine 2.5% and prilocaine 2.5%) oral 1 g acetaminophen | No numeric measurement 4 MHz, 4.5 mm probe was painful at times | Erythema and oedema were acute and transient responses. No numbers mentioned. | Doublo IFUS (Doublo™, HIRONIC Co.) |
| Araco [21] N = 50 | The lower lids, zygomas, cheeks, submental area and mandibular lines were treated. 4.5 mm superficial muscular 3.0 mm aponeurotic system 1.5 mm subcutaneous tissue deep dermis | 4 MHz (0.9 J) 4.5-mm 7 MHz (0.3 J) 3.0-mm 10 MHz (0.25 J) 1.5-mm All patients received 1200 spot lines 400 lines from each transducer at recommended energy power | Lormetazepam 2 mg, tramadol 25 mg and local lidocaine cream | 3.32 ± 1.15 PPSR (10-point scale not validated) | Not stated | Ulthera |
| Wanitphakdeedecha et al. [22] N = 34 | Patients were treated with a single session of MFU with 2.0 mm (5.5 MHz) transducer at the forehead, lateral and just below the eye area. | Total of 140 lines at 0.2–0.4 J; Forehead 90 horizontal lateral eye area five horizontal and vertical under eye area15 horizontal | Topical anaesthetic cream | 3.03 ± 1.57 VAS (0–10) | All patients developed mild erythema immediately after the treatment with spontaneously resolved at 1-week follow-up. | Ultraformer III |
| Shome et al. [23] N = 50 | Patients were treated 3.0 mm for deep dermis 4.5 mm for superficial muscular aponeurotic system. | 7.5-MHz 3.0-mm forehead, 0.3 to 0.35 J; malar, 0.35 J; temple, 0.35 J. cheeks, submental areas; 4.4 MHz, 4.5 mm at 1.2 J; 7.5 MHz with the 3.0-mm 0.45 J. +/−500 exposure lines (range: 480–700) | Topical anaesthetic ointment (7%, lidocaine–prilocaine) | 32% mild pain; 48% moderate pain, 20% severe pain (10-point scale (0 = no pain; 1–4 = mild pain; 5–8 = moderate pain; 9–10 = severe pain) | Almost all the patients had swelling that persisted for 2 to 14 days. | Ulthera |
| Quantitative Analysis | ||||||
|---|---|---|---|---|---|---|
| N= | Method of Measurement | Outcomes | ||||
| Oni et al. [10] | 78 | Submental lift. Fixed points were lateral canthus where the nostril meets the columella and where the chin meets the neck. For each lateral image, a line was first drawn horizontally from the lateral canthus (line a); a vertical line was then dropped down through the point where the columella meets the nostril (line b). An additional horizontal line was then drawn from line b to the point where the chin meets the neck; this line was then extended by 35 mm (line c). Finally, another vertical line was dropped from this point (line d). The area bounded by line c and line d, and the natural line of the neck (area x) was then calculated with AutoCAD software A reduction in area x represented tissue lift. A reduction of >20 mm2 denoted improvement. | At day 90, the average amount of lift was 45.2 mm2, reflecting improvement in skin laxity for 71.8% (56 of 78). Of the patients who experienced a quantitative lift, 82.1% (46 of 56) were Deemed improved according to the masked qualitative assessment, and 75.0% (42 of 56) noted improvement in their face and/or neck at day 90. | |||
| Werschler et al. [12] | 20 | Brow/Submental lift. Quantitative assessments of brow and lower face tissue lift were completed using 2D photographs from all follow-up visits. Baseline and post-treatment photos were matched to ensure proper alignment. For the upper face, a lift measurement was considered improved if the eyebrow was raised ≥0.5 mm. For the lower face, an improved lift measurement was defined as a submental lift ≥1.0 mm. An improved measurement area was defined as a noticeably improved submental area ≥20 mm2 in size. | Day 90: 30 to 40 per cent reporting ≥1 mm lift on the right and left sides, respectively, decreasing to 22 to 33 per cent at one year. 40 to 50 per cent reported improvement over ≥20 mm2 at day 90 on the right and left sides, respectively, decreasing to 33 per cent for both sides at one year. The proportion of subjects with ≥0.5 mm eyebrow lift was 31 to 38 per cent on the right and left sides, respectively, 55 to 35 per cent at day 180 and 44 to 33 per cent at one year. | |||
| Lu et al. [14] | 25 | Brow lift. The mean brow height was calculated as the average vertical distance of the medial canthus, medial limbus, lateral limbus and lateral canthus to the highest point of brow. The midcheek angle was the angle between a horizontal line drawn from alae nasi and a line drawn from alae nasi to the malar prominence. The calculations were made using the 3-dimensional imaging system. Submental lift was calculated according to Oni et al. [13] | There was a mean 0.47 mm brow lift at 90 days (p = 0.0165), but there was a 0.12 mm decrease in brow height compared to baseline at 180 days (p = 0.6494). At 90 days, a mean 26.44 mm2 submental lift was noted (p = 0.0217). In addition, at 180 days, a mean 13.76 mm2 submental lift was noted (p = 0.243). | |||
| Alam et al. [17] | 30 | Brow lift. In the 0-degree views for each eye, 5 measurements of distance in millimetres were obtained from the line connecting both medial canthi to the top edge of the eyebrow by moving from the medial canthus laterally in 8 mm increments along the line horizontally bisecting the medial canthi. The maximum height and the average eyebrow height thus obtained were recorded. | The mean value of average change in eyebrow height as assessed by measurement of the photographs at 90 days was 1.7 mm, and the mean value of maximum change in eyebrow height was 1.9 mm | |||
| Sasaki et al. [18] Pilot study 1 | 27 | Brow lift/marionette lift. An average of three vertical displacements of each brow (midpupil, lateral canthus and lateral tail of brow) from the intercanthal horizontal axis or the average of three superolateral displacements of each marionette line along a fixed reference line (extending from inferior tragal notch to midpoint of marionette line) was used to compare measurements for each subject and between each group. Treatment of opposing brows and marionette folds by varying treatment protocols (vector directions and single/dual tissue treatment depths). Group 1–5 brows, group 6–9 marionette folds. | Group 1, 5.7 ± 1.2% vs. 1.0 ± 0.3%; Group 2, 6.6 ± 0.5% vs. 3.6 ± 0.7%; Group 3, 5.6 ± 1.3% vs. 2.4 ± 0.8%; Group 6, 3.8 ± 0.7% vs. 2.0 ± 0.5%; Group 7, 3.8 ± 0.7% vs. 1.8 ± 0.2% Group 4, 7.2 ± 1.4% vs. 3.7 ± 0.7%, Group 5, 6.0 ± 1.4% vs. 3.1 ± 0.9%, Group 7, 3.8 ± 0.7% vs. 1.8 ± 0.2%; Group 8, 2.4 ± 0.2%; vs. 1.1 ± 0.3%; Group 9, 2.7 ± 0.2% vs. 1.4 ± 0.2% | |||
| Wanitphakdeedecha et al. [22] | 27 | Brow lift. The average eyebrow height was measured using ImageJ software by calculating the average vertical distance from the highest point of the eyebrow to the level of both midpupils in five positions per side (a; medial canthus, b; medial limbus, c; mid pupil, d; lateral limbus and e; lateral canthus to the highest point of the eyebrow) | The average mean difference in eyebrow height was significantly increased in all follow-ups when compared to the baseline (p = 0.000). The average eyebrow height elevation was 1.51 mm at 1-month, 1.25 at 3-month and 1.22 mm at 6-month follow-ups | |||
| Mean ± SD Mean Difference | p-value | |||||
| (cm) | (cm) | |||||
| Baseline | 2.95 ± 0.45 | |||||
| 1 wk follow-up | 3.05 ± 0.50 | 0.095 ± 0.015 | 0.000 | |||
| 1 mo follow-up | 3.10 ± 0.48 | 0.151 ± 0.016 | 0.000 | |||
| 3 mo follow-up | 3.08 ± 0.45 | 0.125 ± 0.016 | 0.000 | |||
| 6 mo follow-up | 3.07 ± 0.46 | 0.122 ± 0.017 | 0.000 | |||
Disclaimer/Publisher’s Note: The statements, opinions and data contained in all publications are solely those of the individual author(s) and contributor(s) and not of MDPI and/or the editor(s). MDPI and/or the editor(s) disclaim responsibility for any injury to people or property resulting from any ideas, methods, instructions or products referred to in the content. |
© 2023 by the authors. Licensee MDPI, Basel, Switzerland. This article is an open access article distributed under the terms and conditions of the Creative Commons Attribution (CC BY) license (https://creativecommons.org/licenses/by/4.0/).
Share and Cite
Contini, M.; Hollander, M.H.J.; Vissink, A.; Schepers, R.H.; Jansma, J.; Schortinghuis, J. A Systematic Review of the Efficacy of Microfocused Ultrasound for Facial Skin Tightening. Int. J. Environ. Res. Public Health 2023, 20, 1522. https://doi.org/10.3390/ijerph20021522
Contini M, Hollander MHJ, Vissink A, Schepers RH, Jansma J, Schortinghuis J. A Systematic Review of the Efficacy of Microfocused Ultrasound for Facial Skin Tightening. International Journal of Environmental Research and Public Health. 2023; 20(2):1522. https://doi.org/10.3390/ijerph20021522
Chicago/Turabian StyleContini, Mark, Marijke H. J. Hollander, Arjan Vissink, Rutger H. Schepers, Johan Jansma, and Jurjen Schortinghuis. 2023. "A Systematic Review of the Efficacy of Microfocused Ultrasound for Facial Skin Tightening" International Journal of Environmental Research and Public Health 20, no. 2: 1522. https://doi.org/10.3390/ijerph20021522
APA StyleContini, M., Hollander, M. H. J., Vissink, A., Schepers, R. H., Jansma, J., & Schortinghuis, J. (2023). A Systematic Review of the Efficacy of Microfocused Ultrasound for Facial Skin Tightening. International Journal of Environmental Research and Public Health, 20(2), 1522. https://doi.org/10.3390/ijerph20021522