Abstract
We aimed to investigate the association between frailty status and all-cause mortality in middle-aged and older people. We included 2661 individuals aged ≥ 35 from the Chilean National Health Survey 2009–2010. Mortality was determined through linkage with the Chilean Civil Registry and Identification. A 36-item frailty index (FI) was used to assess the frailty status. Associations between frailty status and all-cause mortality were assessed using Kaplan–Meier and Cox proportional hazard models adjusted for sociodemographic and lifestyle factors. A non-linear association was investigated using penalized cubic splines fitted in the Cox models. During an 8.9 median follow-up (interquartile range of 8.6–9.0), 308 individuals died (11.5%). Lower survival rates were observed in frail individuals compared to pre-frail and robust people (log-rank < 0.001). Compared with robust individuals, frail people had a higher mortality risk (HR: 2.35 [95% CI: 1.57 to 3.51]). Frail middle-aged individuals had a higher risk of dying independently of major risk factors.
1. Introduction
Frailty is a clinical-stage of increased vulnerability to developing adverse health outcomes, including falls, delirium, disability, cognitive decline, and mortality [1,2]. Its multifactorial etiology involves disorders of multiple interconnected physiological systems [3].
Two of the most utilized instruments to assess frailty are the frailty index (FI) [4] and the frailty phenotype (FP) developed by Fried et al. in 2001 [5]. The FI states that frailty is caused by the accumulation of health deficits during the life course and that the more deficits a person has, the more likely this person is to be frail [4]. The FI is calculated as a ratio of the number of deficits present to the number of total deficits, and can be utilized as a continuous or categorical variable [6]. Symptoms, signs, diseases, disabilities, laboratory, and from different domains (functional, cognitive, and social characteristics) are the types of deficits that can be included in the FI [4]. On the other hand, the FP identifies specific parameters that translate into a clinically relevant reduced physiological function. One remarkable weakness of the FP is that cognitive impairment—associated with functional decline and disability—is not included as a component of the FP.
The FI has been described as a well-known predictor of all-cause mortality in previous studies using different populations, independent of other major risk factors, such as age, education level, tobacco smoking, alcohol intake, among others [7,8,9,10]. Yet, its association with mortality in middle-aged adults has been less investigated; the results available suggest that younger people may have stronger associations [7,11]. However, it is unknown to what extent these findings apply to the Chilean population.
In Chile, a cohort study (ALEXANDROS) [12], during 15 years of follow-up, reported a higher risk of death in frail individuals (hazard ratio: 1.45 [95%CI 1.04–1.90]) compared to robust people. Nonetheless, this study used the frailty phenotype instead of the FI, and the population studied were adults aged 60 years and above. To date, there is no evidence regarding the Chilean population on whether frailty is associated with a higher risk of mortality in middle-aged adults. Considering the aforementioned gaps, we aimed to investigate the association between frailty status, using a FI, and all-cause mortality in middle-aged and older Chilean adults.
2. Material and Methods
2.1. Study Design
This longitudinal study used data from the Chilean National Health Survey (CNHS) conducted between 2009 and 2010 [13]. The CNHS 2009–2010 is one of Chile’s largest, nationally representative population-based surveys of health conditions, lifestyles, health risk factors, and morbidity, in a stratified multistage probability sample of 5416 participants. For the current study, we included 2661 individuals aged ≥ 35 years and older with complete data for all the variables. Of the 5416 surveyed people, 1732 of them were younger than 35 years old. The other 1023 individuals ≥ 35 years old did not have complete data to construct the frailty index. Even if these participants were not included due to the aforementioned reasons, no differences in terms of sex, age, level of education and comorbidities were found in those who did not enter the study. All participants provided written consent before participation. The CNHS 2009–2010 was funded by Chilean Ministry of Health, and approved by the Ethics Research Committee of School of Medicine at the Pontificia Universidad Católica de Chile (No. 16–019).
2.2. Assessment of the FI
A 36-item FI was developed based on self-reported data following the standard procedures described by Searle et al. [14]. Briefly, to be considered a deficit, a variable must satisfy the following criteria: (i) their prevalence should increase with age; (ii) be associated with health status; (iii) not saturate too early or have a very low prevalence [14]. All the variables and cut-off points included in the 36-item FI are available in the Supplementary Material. Briefly, the variables included—taken from the CNHS questionaries—are self-reported cognition (concentration and capacity of learning new skills); chronic conditions, such as acute myocardial infarction, angina, stroke, peripheral venous disease, cataracts, glaucoma, high blood pressure, diabetes, high cholesterol, chronic bronchitis/asthma, arthritis, knee osteoarthritis, hip osteoarthritis, gallbladder cancer, gastric cancer, and colon cancer; functional limitations (seven items related to difficulty performing activities of daily living); self-report of mental health (feeling down, depressed, or hopeless, suspected depression, trouble sleeping, and anxiety), self-report of health and status (three questions related to self-rated health, and perception of self-health), physical activity (assessed by the Global Physical Activity Questionnaire), anthropometry (body mass index, as measured by trained nurses), and number of falls in the last year.
All deficits were scored between 0 and 1, where 0 indicates the absence of the deficit, while 1 indicates the presence of the deficit. In addition, when an intermediate category was identified, this was categorized as 0.5.
A final frailty score was calculated for each participant by dividing the sum of the health deficit scores by the total number of health deficits assessed. Descriptive statistics using the FI score as a continuous variable were calculated for the total population. From the continuous score, three categories were created following the cut-off points proposed by Rockwood et al. [15]. These were as follows: (i) <0.12 points, robust; (ii) >0.12 to 0.24 points, pre-frail; and (iii) >0.24 frail. More information about all the variables and cut-off points included is available in Supplementary Material Table S1.
2.3. All-Cause Mortality
Long-term follow-up for all-cause mortality data, including dates of death, were obtained from linkages of the CNHS to the Chilean Civil Registry and Identification. Mortality data were available until 26 December 2018. Therefore, mortality was based on this date or the date of death.
2.4. Covariates
Self-reported data for sociodemographic characteristics, including age, sex, years of education, place of residency, smoking status, and alcohol consumption, were collected from all participants using questionnaires previously validated for the CNHS 2009–10. The following categories were derived for the sociodemographic variables: age (<60 or ≥60), sex (men or women), years of education (≤8 years, 9–12 years, or >12 years), place of residence (urban or rural), and smoking status (never, previous, or current). Alcohol consumption was derived using the Alcohol Use Disorders Identification Test (AUDIT) [16], and categorized as low, moderate, high, and dependence risk.
2.5. Statistical Analyses
Baseline characteristics were presented according to the frailty status (robust, pre-frail, and frail) as mean and standard deviation (SD) for continuous variables, and percentages with their 95% confidence intervals (CI) for categorical variables.
Crude Kaplan–Meier curves were constructed to estimate the 9-year survival for categories of the FI for the general population and stratified by sex and age group.
A test of proportional hazards assumption was conducted (p = 0.374), and Cox proportional regression for the overall population and stratified by sex and age group were performed to investigate the association between frailty status and mortality. Results are reported as hazard ratio (HR) with their respective 95% CI. For the analyses, robust people were used as the reference group.
Three models with an incremental number of covariates were conducted; model 1 was unadjusted, model 2 was adjusted for age, sex, years of education, and place of residence, and model 3 was additionally adjusted for smoking status and AUDIT score.
A non-linear association between the continuous FI and all-cause mortality was also investigated using penalized cubic splines fitted in Cox proportional hazard models. The penalized spline is a variation of the basis spline, which is less sensitive to known numbers and placements than restricted cubic splines [17]. For this spline, values were truncated to less than 1% of the values for FI. After truncation, the minimum value of the FI was 0.1. In addition, the mean value of the FI was used as the reference group. All statistical analyses were conducted using STATA V17 software (StataCorp; College Station, TX, USA) and R 3.6.1 (using the packages ‘survival’, and ‘spline’). A p-value below 0.05 was considered statistically significant.
3. Results
Figure 1 shows the distribution of the data, which skewed to the right. From the continuous scale, the mean FI score was 0.20 (SD = 0.12), with a median of 0.18, ranging from 0 to 0.72, and a 99% upper limit of 0.56. The characteristics of the study population by frailty status are shown in Table 1. Of the 2661 participants included in this analysis, 39.2% and 29.3% were classified as pre-frail and frail, respectively. Briefly, compared with robust individuals, pre-frail and frail people were older, more likely to be women, tended to have ≤8 years of education, and were more likely to have a higher alcohol intake.
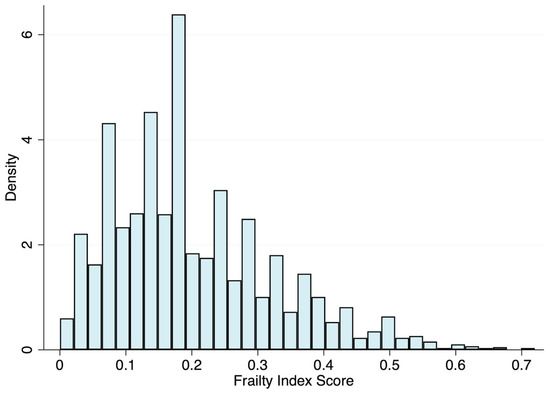
Figure 1.
Distribution of the 36-item frailty index.

Table 1.
Baseline characteristics of the study participants by frailty status (N = 2661).
During an 8.9-year median follow-up (interquartile range: 8.6–9.0), 308 individuals died (11.5%). Kaplan–Meier failure estimates by frailty status for the general population and stratified by sex and age group are shown in Figure 2. Briefly, for all the groups, lower survival rates in frail and pre-frail individuals compared to robust were observed (log-rank < 0.001).
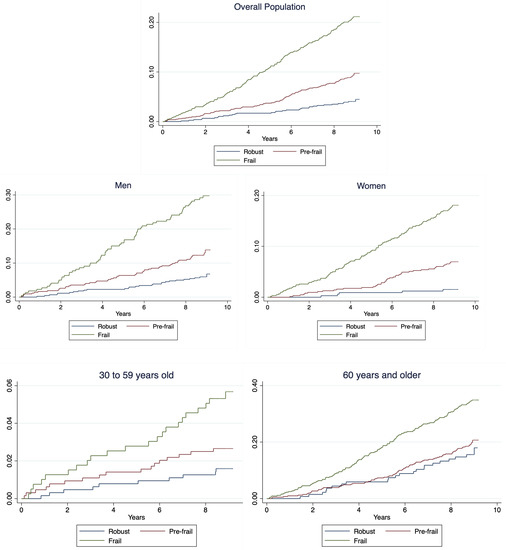
Figure 2.
Kaplan–Meier failure estimates for general population and stratified by sex.
Associations between the frailty status and all-cause mortality, stratified by sex and age group, are shown in Table 2. In the unadjusted model, and compared with robust participants, frail individuals had a 5.51-times higher risk of death (HR model 1: 5.51 [95%CI 3.78 to 8.04]). The association was attenuated after adjusting for the covariates included in models 2 (sociodemographic) and 3 (lifestyle); however, it remained statistically significant (HR model 3: 2.35 [95%CI 1.57 to 3.51]). The mortality risk in pre-frail individuals was 2.34-times higher than in robust participants for the unadjusted model. However, this association was fully attenuated after further adjustment (HR:1.28 [95%CI 0.85 to 1.92]). In sex-stratified models, the risk of dying was higher in frail women than frail men (HR women model 3: 3.59 [95% CI: 1.44 to 8.93] vs. HRmen model 3: 2.06 (95% CI: 1.28 to 3.30). Furthermore, for people <60 and ≥60, the risk of dying was higher for frail than robust individuals after adjustment for all confounders (HRmodel 3: 3.54 [95% CI: 1.58 to 7.90]; 2.62 [95% CI: 1.65 to 4.14], respectively).
Table 2.
Association between frailty status and risk of all-cause mortality by sex and age categories.
The non-linear association between the continuous FI score and all-cause mortality is shown in Figure 3. Overall, a higher FI score was associated with a higher risk of mortality (overall p < 0.001). No evidence of non-linearity was observed in the spline.
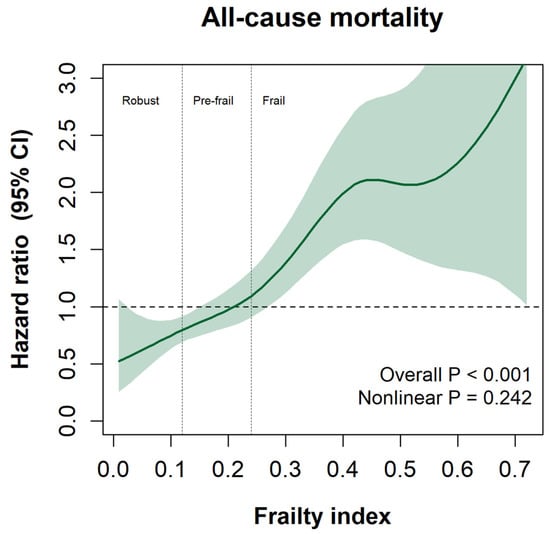
Figure 3.
Spline graph is presented as HR and their 95% CI. Frailty index is presented as a continuous variable. All analyses were adjusted for age, sex, zone of residence, smoking status, and AUDIT score.
4. Discussion
Using a 36-item FI, frail middle-aged Chileans had a higher risk of dying than robust people, even after adjusting for a wide range of confounder variables. To our knowledge, this is the first study to explore the association between frailty status and mortality risk using the middle-aged and older Chilean population. In this study, the observed risk was higher in women and in middle-aged people (<60 years), which is consistent with the literature that reports higher mortality rates in frail younger populations. Our results suggest that earlier detection of pre-frail and frail individuals may represent an opportunity to introduce effective management strategies to improve outcomes—including reducing mortality—in middle-aged and older people.
The association between frailty status and all-cause mortality has been extensively studied in older populations [18]. These studies have been conclusive, stating that frail people aged 65 and older have a higher mortality risk than the general population [18]. Yet, even if frailty is usually associated with older people (because it is a condition that comprises age-related changes due to the lifelong accumulation and exposition of cellular and molecular damage [19,20]) previous studies have highlighted that frailty is a process that starts earlier and may also be present in middle-aged individuals [21,22].
In this line, few studies have shown that a higher FI is associated with a greater risk of all-cause mortality in individuals younger than 60 years. For instance, Junning Fan et al. [23], after following 512,273 Chinese participants aged 30 and older for 10.8 years, identified that the association between a 28-item FI and all-cause mortality, was stronger in middle-aged individuals (<50 years) than in older participants (HR<50: 1. 95 [95% CI: 1.87 to 2.03]; HR 50–64: 1.80 [95% CI: 1.76 to 1.83]; and HR>65: 1.56 [95% CI: 1.53 to 1.59]) [23]. Similarly, Jiang et al. [24], when following 1477 individuals older than 29 years old, reported that, after adjustment for covariates, a 42-item FI was independently associated with increased risk for all-cause mortality in women and men aged < 65 years (HR 1.11 [95% CI: 1.07 to 1.17]; 1.05 [95% CI: 1.01 to 1.10], respectively). On the other hand, for women and men aged ≥ 65 years, the HRs were HRmen 1.07 [95%CI 1.04–1.10]; and HRwomen 1.03 [0.99 to 1.07]. Likewise, Williams et al. [25], when using a 49-item FI, showed that the HRs for mortality were stronger in younger participants than in older participants (HR<50 1.87 [95% CI: 1.74 to 2.00], and HR>65 1.59 [95% CI: 1.54 to 1.64]) after adjustment for sociodemographic characteristics [25]. Explanations for these findings might respond to an accelerated and well-documented [23] aging process in younger individuals, but could also be due to the presence of more comorbidities or chronic conditions related to unhealthy lifestyle behaviors. We cannot exclude the survivors’ effect in older people, which can result from better medical treatments that increase the expectancy of life and quality of life.
In terms of sex differences, our study showed that the risk of all-cause mortality was higher in frail women than frail men. These findings agree with those published by Jiang et al. [24], where frail women were at higher risk of mortality than men (HRmen 1.08 [95% CI: 1.06 to 1.11]: HRwomen 1.04 [95% CI: 1.01 to 1.07]). Conversely, our results differ from those published by Gordon et al. [26] and Williams et al. [25], in which the risk of mortality was higher in frail men than women, even when a higher prevalence of frail status in women was reported.
The higher mortality risk of participants younger than 60 compared with older individuals observed in this report might be partially explained by Chilean disease burden and life expectancy. The FI is characterized by the accumulation of deficits [15]. These deficits generally increase with age; however, over the last years, the prevalence of non-communicable diseases, unhealthy behaviors and habits, as well as other disabilities, have increased in people younger than 60 years old [27], which may explain the higher risk of mortality compared with older individuals observed in this report. Moreover, in Chile, women tend to live longer than men (82.2 vs. 76 years) [28], but with a higher burden of disabilities—the male–female health–survival paradox [29]. Therefore, a greater deficit in women than in men could have triggered a higher mortality rate in this group.
Strengths and Limitations
This is the first study investigating the association between frailty and all-cause mortality in middle-aged and older Chileans. Moreover, we used representative data from the Chilean population and included an extensive number of people from different geographic zones of Chile. Frailty status was assessed using a FI that included questionaries and scales validated in the country, covering a wide range of health domains, and following standard procedures previously described, ensuring the validity and replicability of these findings.
However, this study has limitations. First, some variables, such as comorbidities, functional limitations, and mental health status, were self-reported, which might be subject to recall bias and underestimate the prevalence of frailty status. Second, frailty status and confounders were assessed only at baseline; therefore, bias for adjusting for potential mediators may be present, and we could not account for potential changes in those variables’ status over the follow-up. Third, the observational nature of the data does not allow infer causality from the results. Finally, even when we adjust for important confounders, the effect of unmeasured confounders, such as a comprehensive cognitive assessment and muscular measurements, cannot be ruled out.
5. Conclusions
Using the CHNS 2009–2010, frailty was associated with all-cause mortality even after adjustment for confounders. Moreover, the associations appear to be stronger in younger rather than older participants, and in women rather than men. This is the first paper investigating the relationship between a frailty index and mortality in both middle-aged and older people in Chile and in Latin America.
Early detection of frailty, using multiple variables, could be useful as an indicator to consider in developing public health policies focused on health promotion in middle-aged Chilean people. Further research is needed to explore the association between the FI and specific causes of mortality, and to examine whether interventions may impact the development of future outcomes.
Supplementary Materials
The following supporting information can be downloaded at: https://www.mdpi.com/article/10.3390/ijerph20021195/s1, Table S1. Type of deficits included for the frailty index.
Author Contributions
F.D.-T. generated the research question; F.D.-T., F.P.-R. and C.C.-M. planned the analyses; F.D.-T. performed the literature search; F.D.-T. performed the analyses with support from F.P.-R. and C.C.-M.; F.D.-T. wrote the first draft of the manuscript. All authors critically reviewed this and previous drafts. All authors approved the final draft for submission; X.D.-M. is the guarantor. All authors have read and agreed to the published version of the manuscript.
Funding
The Chilean National Health Survey (CNHS) 2009–2010 was funded by the Chilean Ministry of Health and led by the Department of Public Health, the Pontificia Universidad Católica de Chile. This research did not receive any funding from agencies in the public, commercial, or not-for-profit sectors.
Institutional Review Board Statement
Not applicable.
Informed Consent Statement
Informed consent was obtained from all subjects involved in the study.
Data Availability Statement
These data were derived from the following resources available in the public domain: website of the Epidemiology Department of the Ministry of Health, Chile: http//epi.minsal.cl/encuesta-ens/ (accessed on 1 October 2022).
Acknowledgments
The authors thank all participants for their cooperation and the Chilean Health Ministry and Department of Public Health, the Pontificia Universidad Católica de Chile, for commissioning, designing, and conducting the second National Health Survey 2016–2017.
Conflicts of Interest
The authors declare no conflict of interest.
References
- Walston, J.; Buta, B.; Xue, Q.-L. Frailty Screening and Interventions. Clin. Geriatr. Med. 2018, 34, 25–38. [Google Scholar] [CrossRef] [PubMed]
- Walston, J.; Hadley, E.C.; Ferrucci, L.; Guralnik, J.M.; Newman, A.B.; Studenski, S.A.; Ershler, W.B.; Harris, T.; Fried, L.P. Research Agenda for Frailty in Older Adults: Toward a Better Understanding of Physiology and Etiology: Summary from the American Geriatrics Society/National Institute on Aging Research Conference on Frailty in Older Adults. J. Am. Geriatr. Soc. 2006, 54, 991–1001. [Google Scholar] [CrossRef] [PubMed]
- Whitson, H.E.; Duan-Porter, W.; Schmader, K.E.; Morey, M.C.; Cohen, H.J.; Colón-Emeric, C.S. Physical Resilience in Older Adults: Systematic Review and Development of an Emerging Construct. J. Gerontol. Ser. A 2016, 71, 489–495. [Google Scholar] [CrossRef] [PubMed]
- Mitnitski, A.B.; Mogilner, A.J.; Rockwood, K. Accumulation of Deficits as a Proxy Measure of Aging. Sci. World J. 2001, 1, 323–336. [Google Scholar] [CrossRef] [PubMed]
- Fried, L.P.; Tangen, C.M.; Walston, J.; Newman, A.B.; Hirsch, C.; Gottdiener, J.; Seeman, T.; Tracy, R.; Kop, W.J.; Burke, G.; et al. Frailty in Older Adults: Evidence for a Phenotype. J. Gerontol. Ser. A Biol. Sci. Med. Sci. 2001, 56, M146–M157. [Google Scholar] [CrossRef] [PubMed]
- Rockwood, K.; Andrew, M.; Mitnitski, A. A Comparison of Two Approaches to Measuring Frailty in Elderly People. J. Gerontol. Ser. A Biol. Sci. Med. Sci. 2007, 62, 738–743. [Google Scholar] [CrossRef]
- Fang, X.; Shi, J.; Song, X.; Mitnitski, A.; Tang, Z.; Wang, C.; Yu, P.; Rockwood, K. And mortality in older Chinese adults: Results from the Beijing longitudinal study of aging. J. Nutr. Health Aging 2012, 16, 903–907. [Google Scholar] [CrossRef]
- Hyde, Z.; Flicker, L.; Smith, K.; Atkinson, D.; Fenner, S.; Skeaf, L.; Malay, R.; Giudice, D.L. Prevalence and incidence of frailty in Aboriginal Australians, and associations with mortality and disability. Maturitas 2016, 87, 89–94. [Google Scholar] [CrossRef]
- Shi, J.; Song, X.; Yu, P.; Tang, Z.; Mitnitski, A.; Fang, X.; Rockwood, K. Analysis of frailty and survival from late middle age in the Beijing Longitudinal Study of Aging. BMC Geriatr. 2011, 11, 17. [Google Scholar] [CrossRef]
- Song, X.; Mitnitski, A.; Rockwood, K. Prevalence and 10-Year Outcomes of Frailty in Older Adults in Relation to Deficit Accumulation. J. Am. Geriatr. Soc. 2010, 58, 681–687. [Google Scholar] [CrossRef]
- Petermann-Rocha, F.; Gray, S.R.; Pell, J.P.; Ho, F.K.; Celis-Morales, C. The joint association of sarcopenia and frailty with incidence and mortality health outcomes: A prospective study. Clin. Nutr. 2021, 40, 2427–2434. [Google Scholar] [CrossRef]
- Albala, C.; Lera, L.; Sanchez, H.; Angel, B.; Márquez, C.; Arroyo, P.; Fuentes, P. Frequency of frailty and its association with cognitive status and survival in older Chileans. CIA 2017, 12, 995–1001. [Google Scholar] [CrossRef]
- Ministerio de Salud de Chile. Encuesta Nacional de Salud (2009–2010). Available online: www.minsal.cl (accessed on 1 October 2022).
- Searle, S.D.; Mitnitski, A.; Gahbauer, E.A.; Gill, T.M.; Rockwood, K. A standard procedure for creating a frailty index. BMC Geriatr. 2008, 8, 24. [Google Scholar] [CrossRef]
- Rockwood, K. A global clinical measure of fitness and frailty in elderly people. Can. Med. Assoc. J. 2005, 173, 489–495. [Google Scholar] [CrossRef]
- Alvarado, M.E.; Garmendia, M.L.; Acuña, G.; Santis, R.; Arteaga, O. Validez y confiabilidad de la versión chilena del Alcohol Use Disorders Identification Test (AUDIT). Rev. Méd. Chile 2009, 137, 1463–1468. [Google Scholar] [CrossRef]
- Govindarajulu, U.S.; Malloy, E.J.; Ganguli, B.; Spiegelman, D.; Eisen, E.A. The Comparison of Alternative Smoothing Methods for Fitting Non-Linear Exposure-Response Relationships with Cox Models in a Simulation Study. Int. J. Biostat. 2009, 5, 2. [Google Scholar] [CrossRef]
- Kojima, G.; Iliffe, S.; Walters, K. Frailty index as a predictor of mortality: A systematic review and meta-analysis. Age Ageing 2018, 47, 193–200. [Google Scholar] [CrossRef]
- Kirkwood, T.B.L. Understanding the Odd Science of Aging. Cell 2005, 120, 437–447. [Google Scholar] [CrossRef]
- Wilson, D.; Jackson, T.; Sapey, E.; Lord, J.M. Frailty and sarcopenia: The potential role of an aged immune system. Ageing Res. Rev. 2017, 36, 1–10. [Google Scholar] [CrossRef]
- Hanlon, P.; Nicholl, B.I.; Jani, B.D.; Lee, D.; McQueenie, R.; Mair, F.S. Frailty and pre-frailty in middle-aged and older adults and its association with multimorbidity and mortality: A prospective analysis of 493 737 UK Biobank participants. Lancet Public Health 2018, 3, e323–e332. [Google Scholar] [CrossRef]
- Sezgin, D.; Liew, A.; O’Donovan, M.R.; O’Caoimh, R. Pre-frailty as a multi-dimensional construct: A systematic review of definitions in the scientific literature. Geriatr. Nurs. 2020, 41, 139–146. [Google Scholar] [CrossRef] [PubMed]
- Fan, J.; Yu, C.; Guo, Y.; Bian, Z.; Sun, Z.; Yang, L.; Chen, Y.; Du, H.; Li, Z.; Lei, Y.; et al. Frailty index and all-cause and cause-specific mortality in Chinese adults: A prospective cohort study. Lancet Public Health 2020, 5, e650–e660. [Google Scholar] [CrossRef] [PubMed]
- Jiang, M.; Foebel, A.D.; Kuja, R.; Karlsson, I.; Pedersen, N.L.; Hägg, S.; Jylhävä, J. Frailty index as a predictor of all-cause and cause-specific mortality in a Swedish population-based cohort. Aging 2017, 9, 2629–2646. [Google Scholar] [CrossRef] [PubMed]
- Williams, D.M.; Jylhävä, J.; Pedersen, N.L.; Hägg, S. A Frailty Index for UK Biobank Participants. J. Gerontol. Ser. A 2019, 74, 582–587. [Google Scholar] [CrossRef]
- Gordon, E.H.; Peel, N.M.; Samanta, M.; Theou, O.; Howlett, S.E.; Hubbard, R.E. Sex differences in frailty: A systematic review and meta-analysis. Exp. Gerontol. 2017, 89, 30–40. [Google Scholar] [CrossRef]
- Petermann-Rocha, F.; Martínez-Sanguinetti, M.A.; Leiva-Ordoñez, A.M.; Celis-Morales, C. Carga global de morbilidad y mortalidad atribuible a factores de riesgo entre los años 1990 y 2019: ¿Cuál es la realidad chilena? Rev. Méd. Chile 2021, 149, 484–486. [Google Scholar] [CrossRef]
- UN Economic Commission for Latin America and the Caribbean. Latin America and the Caribbean Demographic Observatory 2019: Population Projections; United Nations: Mexico City, Mexico, 2022; ISBN 9789211220339. [Google Scholar]
- Oksuzyan, A.; Petersen, I.; Stovring, H.; Bingley, P.; Vaupel, J.W.; Christensen, K. The Male–Female Health–Survival Paradox: A Survey and Register Study of the Impact of Sex-Specific Selection and Information Bias. Ann. Epidemiol. 2009, 19, 504–511. [Google Scholar] [CrossRef]
Disclaimer/Publisher’s Note: The statements, opinions and data contained in all publications are solely those of the individual author(s) and contributor(s) and not of MDPI and/or the editor(s). MDPI and/or the editor(s) disclaim responsibility for any injury to people or property resulting from any ideas, methods, instructions or products referred to in the content. |
© 2023 by the authors. Licensee MDPI, Basel, Switzerland. This article is an open access article distributed under the terms and conditions of the Creative Commons Attribution (CC BY) license (https://creativecommons.org/licenses/by/4.0/).