

How Do Ecological and Recreational Features of Waterfront Space Affect Its Vitality? Developing Coupling Coordination and Enhancing Waterfront Vitality

Abstract
1. Introduction
2. Materials and Methods
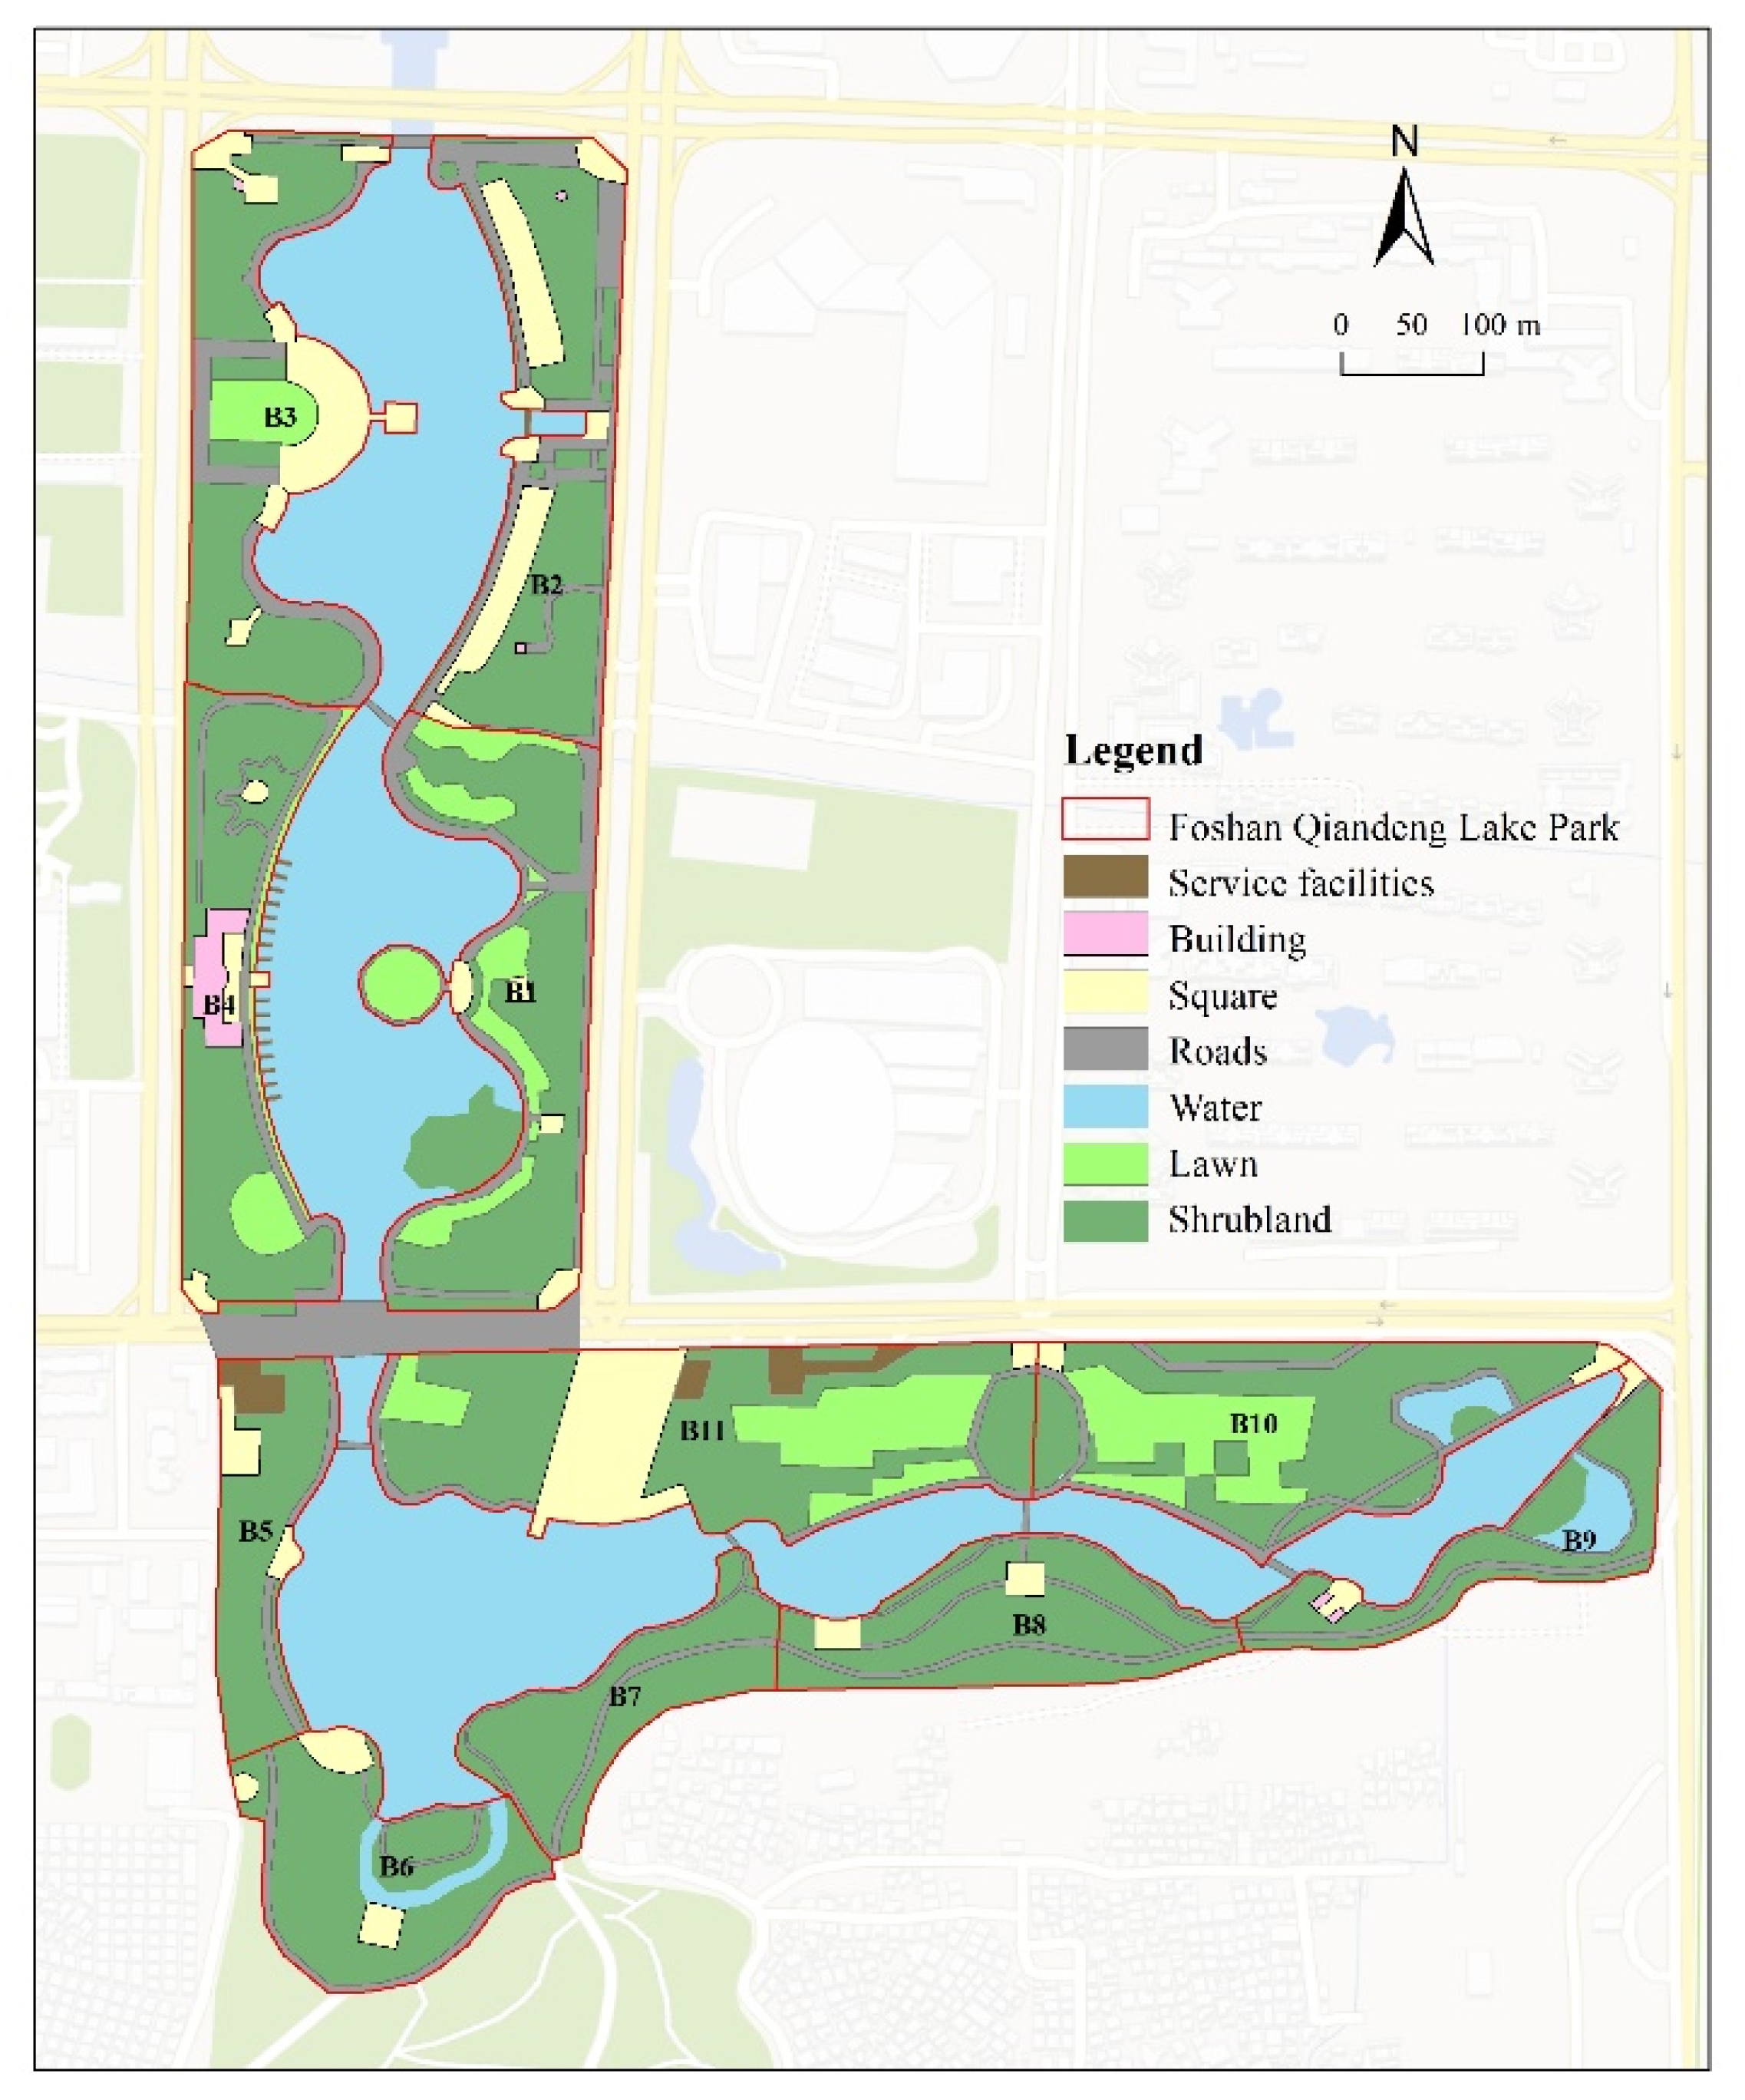
2.1. Study Area
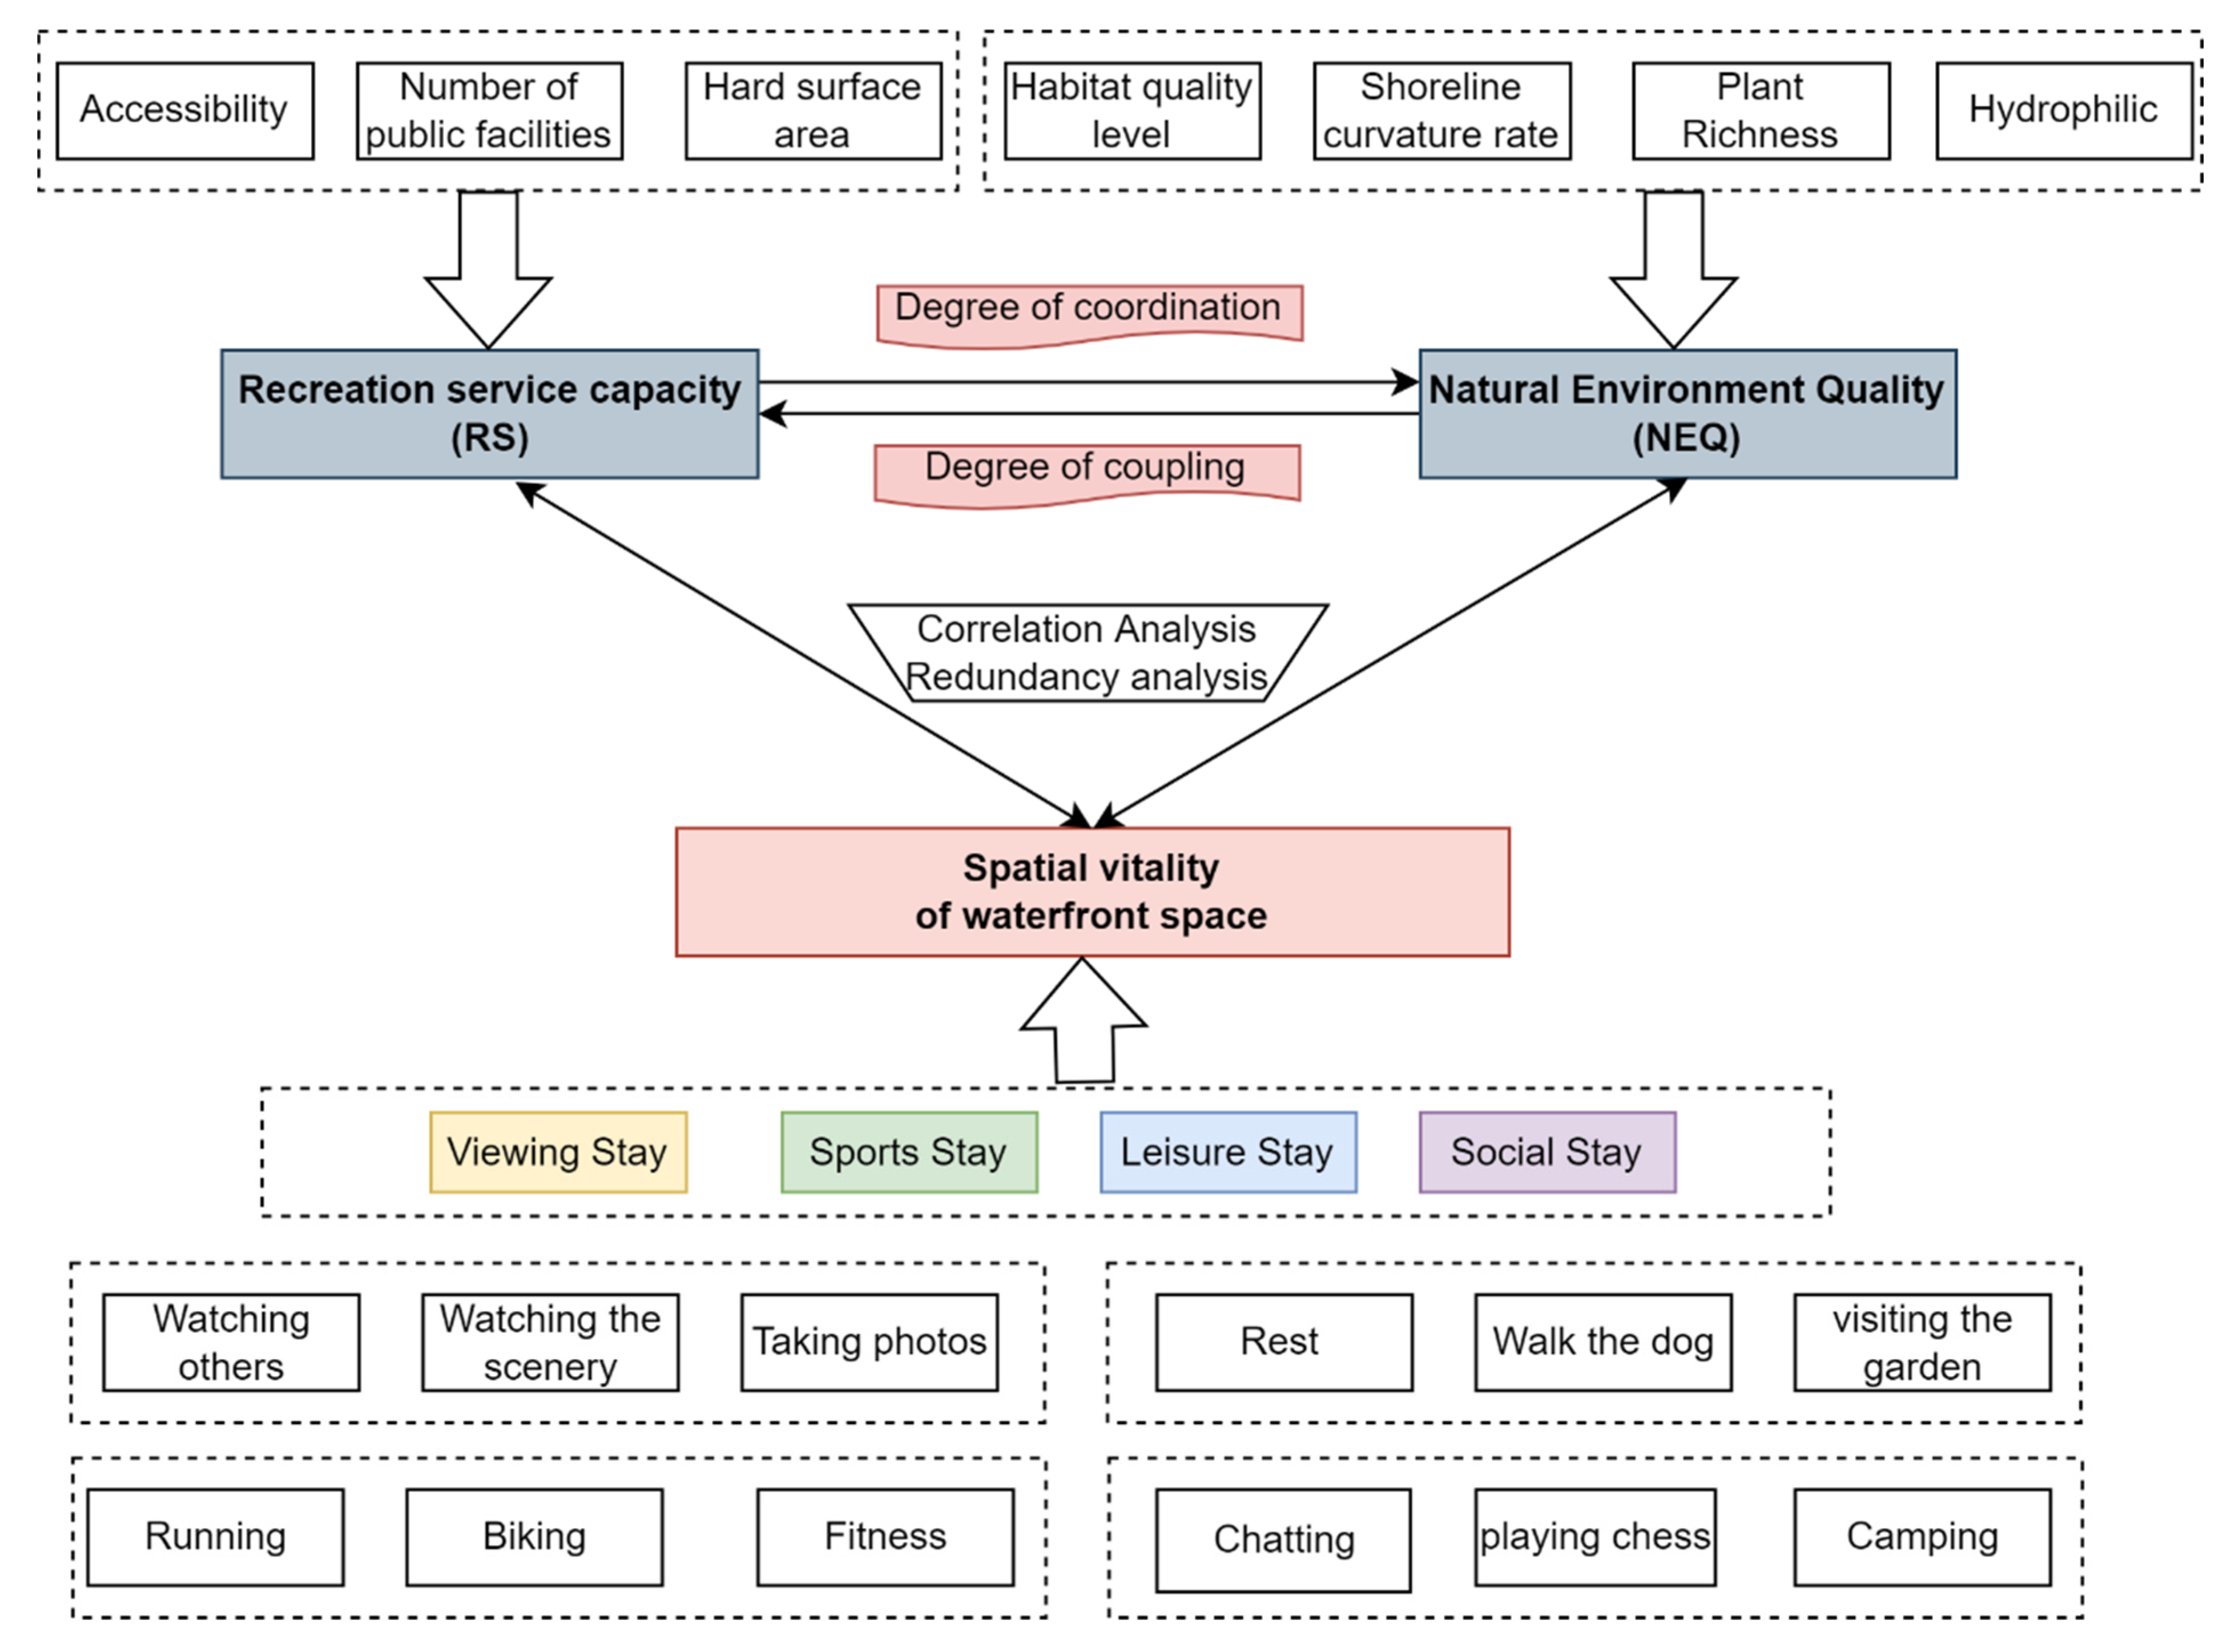
2.2. Study Contents
2.3. Data and Methods
3. Results
3.1. Natural Environment Quality and Recreation Service of Waterfront Space
3.1.1. Correlation Analysis of Natural Environment Quality and Recreation Service
3.1.2. Analysis of Coupling Coordination Degree of Waterfront Space’s Spatial Characteristics
3.2. Resident Activities and Waterfront’s Spatial Vitality
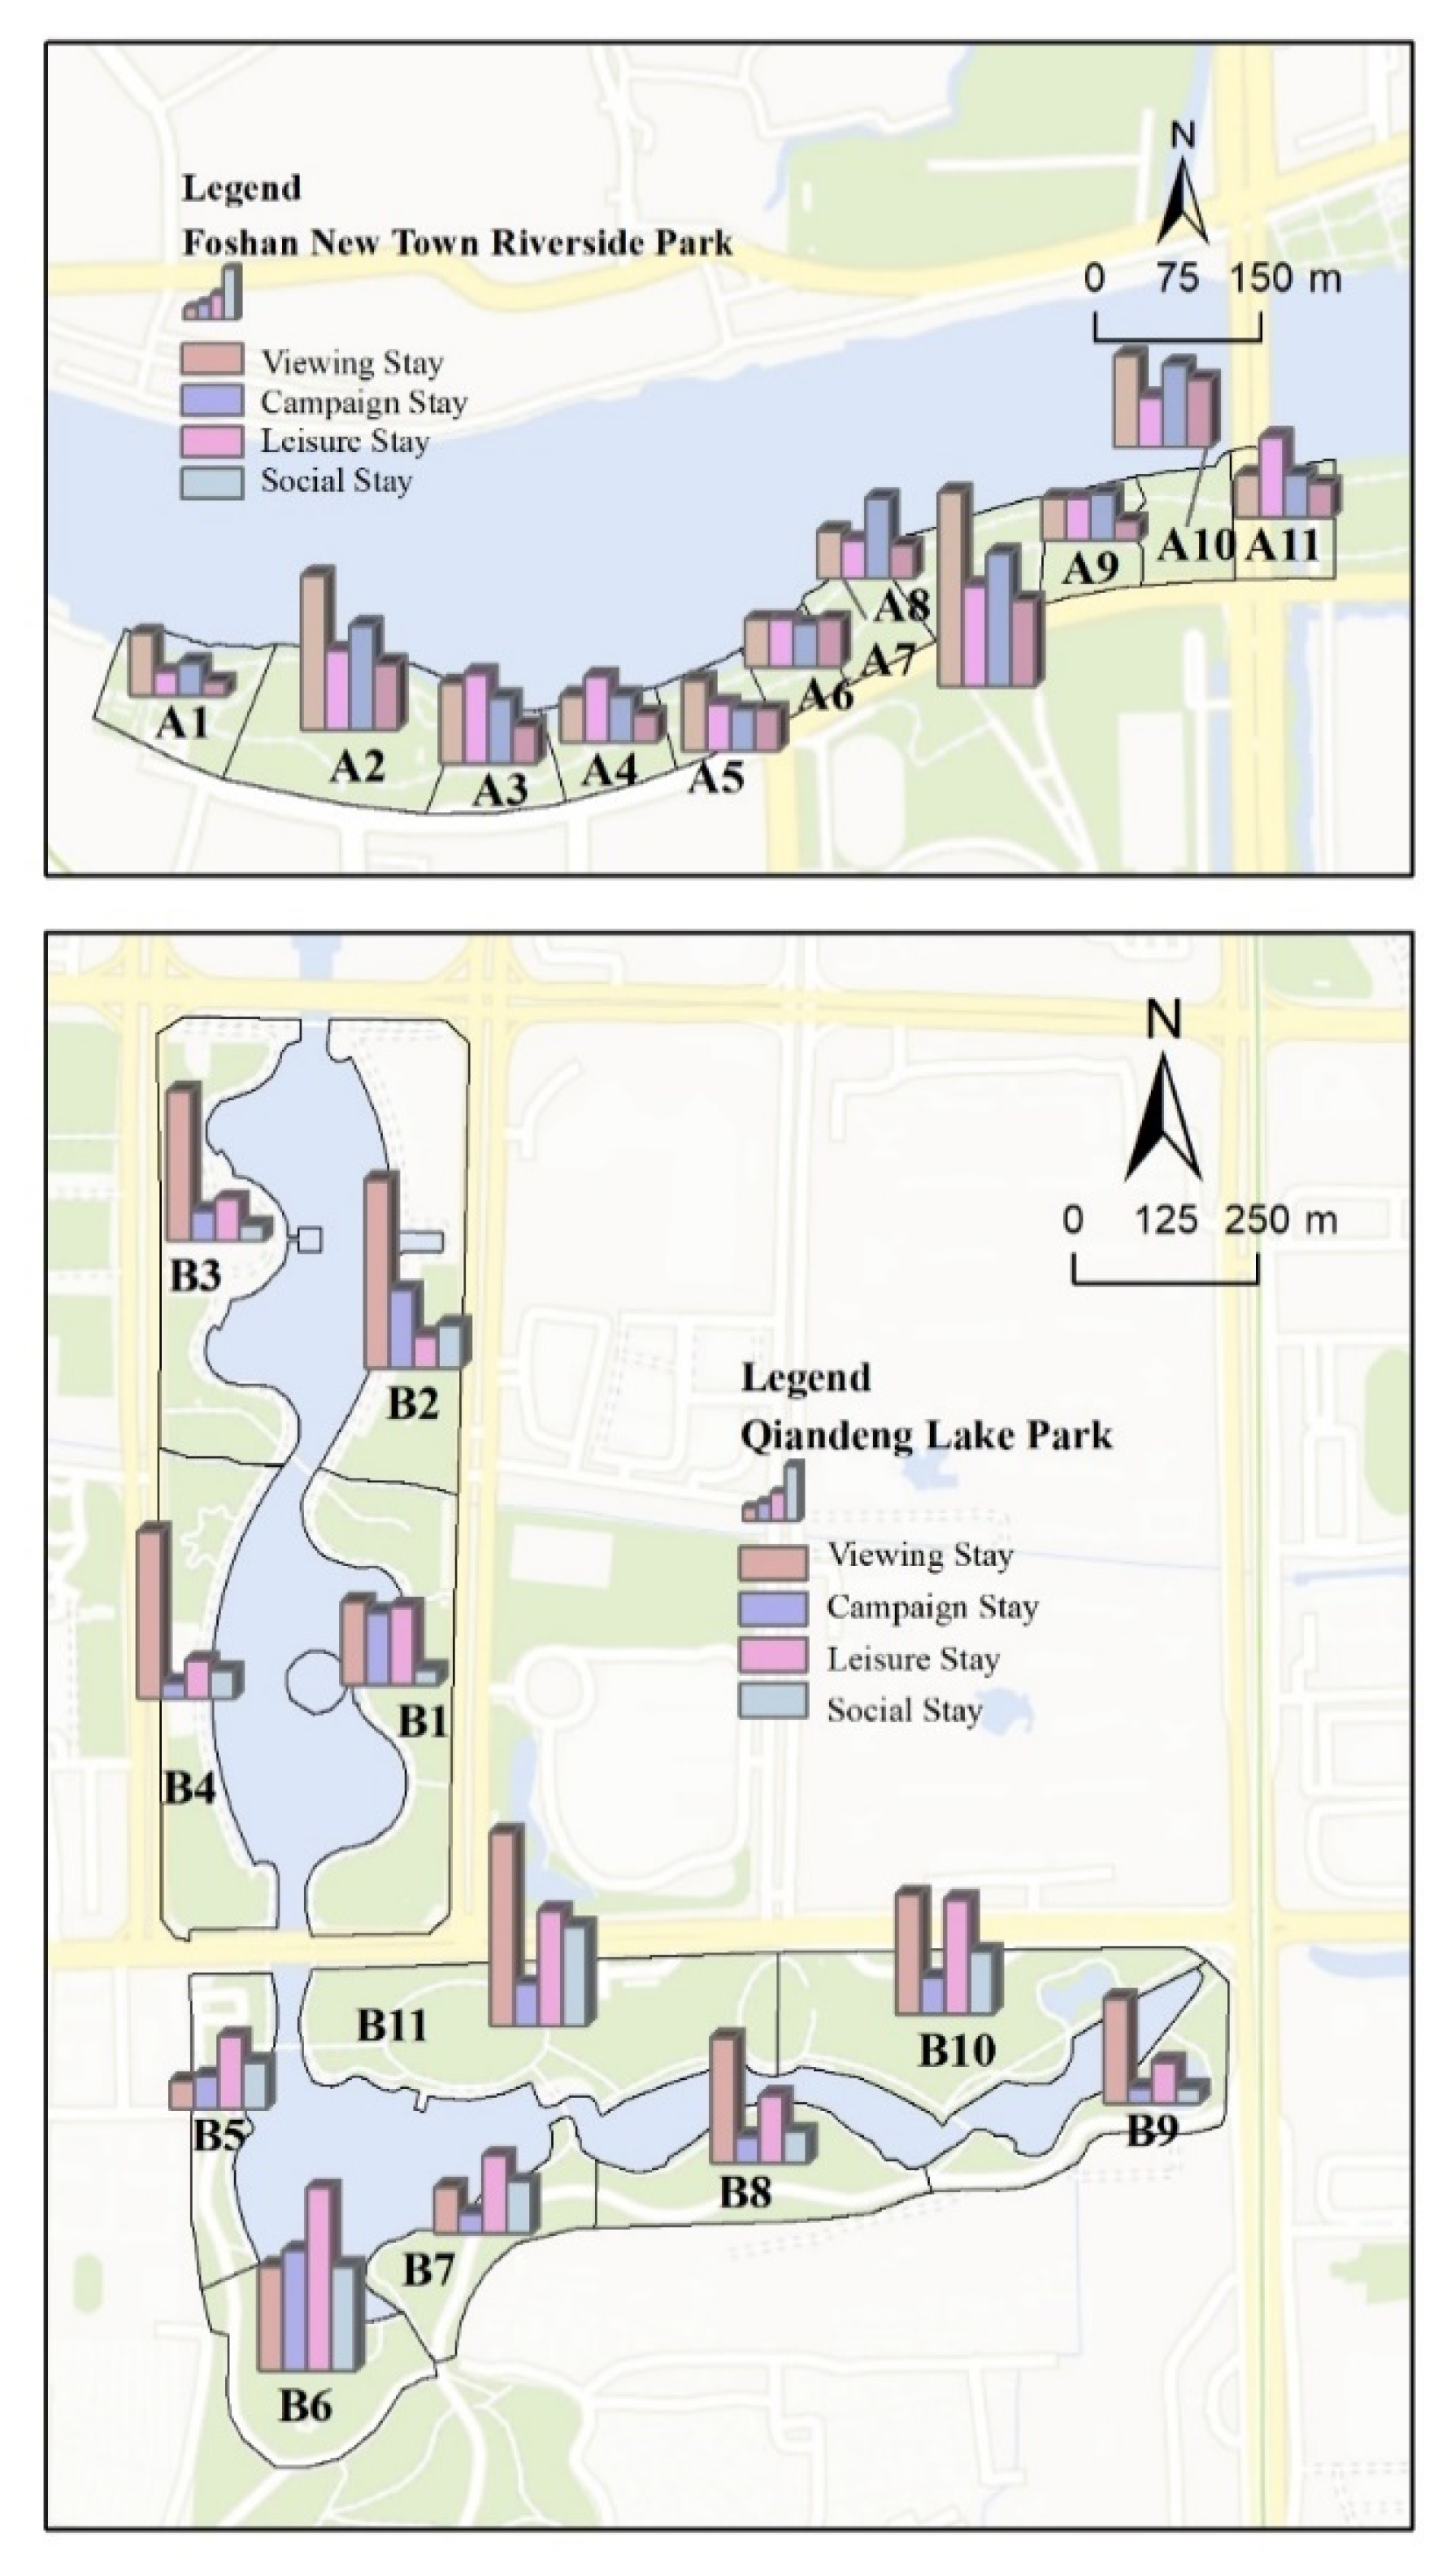
3.2.1. Resident Activity Analysis
3.2.2. The Relationship between Waterfront Spatial Characteristics and Stay Activities
3.3. Model Results
3.3.1. Multiple Linear Regression
3.3.2. Linear Fitting
3.3.3. Redundancy Analysis
4. Conclusions and Discussion
4.1. Conclusions
4.2. Strategies to Enhance Resident Attraction
4.2.1. Enhance Recreation Service Facilities and Accessibility in Order to Expand Recreation Service Capacity
4.2.2. Enhance the Natural Environment, Optimize NEQ, and Increase Residence Attraction
4.2.3. Promote the Ecological–Recreational Coupling of Waterfront Space
4.3. Limitations and Future Directions
Author Contributions
Funding
Institutional Review Board Statement
Informed Consent Statement
Data Availability Statement
Conflicts of Interest
References
- Xie, P.F.; Gu, K. The changing urban morphology: Waterfront redevelopment and event tourism in New Zealand. Tour. Manag. Perspect. 2015, 15, 105–114. [Google Scholar] [CrossRef]
- Durán Vian, F.; Pons Izquierdo, J.J.; Serrano Martínez, M. River-city recreational interaction: A classification of urban riverfront parks and walks. Urban For. Urban Green. 2021, 59, 127042. [Google Scholar] [CrossRef]
- Ye, Y.; Qiu, H. Environmental and social benefits, and their coupling coordination in urban wetland parks. Urban For. Urban Green. 2021, 60, 127043. [Google Scholar] [CrossRef]
- Pan, J.; Bardhan, R. Evaluating the risk of accessing green spaces in COVID-19 pandemic: A model for public urban green spaces (PUGS) in London. Urban For. Urban Green. 2022, 74, 127648. [Google Scholar] [CrossRef]
- Fagerholm, N.; Eilola, S.; Arki, V. Outdoor recreation and nature’s contribution to well-being in a pandemic situation—Case Turku, Finland. Urban For. Urban Green. 2021, 64, 127257. [Google Scholar] [CrossRef]
- Jiang, Y.; Huang, J.; Shi, T.; Wang, H. Interaction of Urban Rivers and Green Space Morphology to Mitigate the Urban Heat Island Effect: Case-Based Comparative Analysis. Int. J. Environ. Res. Public Health 2021, 18, 11404. [Google Scholar] [CrossRef]
- Cheung, P.K.; Jim, C.Y. Differential cooling effects of landscape parameters in humid-subtropical urban parks. Landsc. Urban Plan. 2019, 192, 103651. [Google Scholar] [CrossRef]
- Meenar, M.; Heckert, M.; Adlakha, D. “Green Enough Ain’t Good Enough”: Public Perceptions and Emotions Related to Green Infrastructure in Environmental Justice Communities. Int. J. Environ. Res. Public Health 2022, 19, 1448. [Google Scholar] [CrossRef]
- Heery, E.C.; Lian, K.Y.; Loke LH, L.; Tan HT, W.; Todd, P.A. Evaluating seaweed farming as an eco-engineering strategy for ‘blue’ shoreline infrastructure. Ecol. Eng. 2020, 152, 105857. [Google Scholar] [CrossRef]
- Chuang, T.; Chang, Y. The ecological waterfront design for Bufo bankorensis by using artificial neural network methods. Ecol. Eng. 2021, 170, 106335. [Google Scholar] [CrossRef]
- Zarin, S.Z.; Niroomand, M.; Heidari, A.A. Physical and Social Aspects of Vitality Case Study: Traditional Street and Modern Street in Tehran. Procedia-Soc. Behav. Sci. 2015, 170, 659–668. [Google Scholar] [CrossRef]
- Hu, S.; Yue, H.; Zhou, Z. Preferences for urban stream landscapes: Opportunities to promote unmanaged riparian vegetation. Urban For. Urban Green. 2019, 38, 114–123. [Google Scholar] [CrossRef]
- Wang, Y.; Shi, X.; Cheng, K.; Zhang, J.; Chang, Q. How do urban park features affect cultural ecosystem services: Quantified evidence for design practices. Urban For. Urban Green. 2022, 76, 127713. [Google Scholar] [CrossRef]
- Medeiros, E.; Brandão, A.; Pinto, P.T.; Lopes, S.S. Urban Planning Policies to the Renewal of Riverfront Areas: The Lisbon Metropolis Case. Sustainability 2021, 13, 5665. [Google Scholar] [CrossRef]
- Jansson, M.; Herbert, E.; Zalar, A.; Johansson, M. Child-Friendly Environments—What, How and by Whom? Sustainability 2022, 14, 4852. [Google Scholar] [CrossRef]
- Lau, K.K.; Yung, C.C.; Tan, Z. Usage and perception of urban green space of older adults in the high-density city of Hong Kong. Urban For. Urban Green. 2021, 64, 127251. [Google Scholar] [CrossRef]
- Shi, S.; Kondolf, G.; Li, D. Urban River Transformation and the Landscape Garden City Movement in China. Sustainability 2018, 10, 4103. [Google Scholar] [CrossRef]
- Che, Y.; Yang, K.; Chen, T.; Xu, Q. Assessing a riverfront rehabilitation project using the comprehensive index of public accessibility. Ecol. Eng. 2012, 40, 80–87. [Google Scholar] [CrossRef]
- Li, W.; Wang, Y.; Xie, S.; Cheng, X. Coupling coordination analysis and spatiotemporal heterogeneity between urbanization and ecosystem health in Chongqing municipality, China. Sci. Total Environ. 2021, 121, 107014. [Google Scholar] [CrossRef]
- Tang, F.; Wang, L.; Guo, Y.; Fu, M.; Huang, N.; Duan, W.; Luo, M.; Zhang, J.; Li, W.; Song, W. Spatio-temporal variation and coupling coordination relationship between urbanisation and habitat quality in the Grand Canal, China. Land Use Policy 2022, 117, 106119. [Google Scholar] [CrossRef]
- Liu, S.; Lai, S.; Liu, C.; Jiang, L. What influenced the vitality of the waterfront open space? A case study of Huangpu River in Shanghai, China. Cities 2021, 114, 103197. [Google Scholar] [CrossRef]
- Wang, Y.; Dewancker, B.J.; Qi, Q. Citizens’ preferences and attitudes towards urban waterfront spaces: A case study of Qiantang riverside development. Environ. Sci. Pollut. Res. 2020, 27, 45787–45801. [Google Scholar] [CrossRef] [PubMed]
- Niu, Y.; Mi, X.; Wang, Z. Vitality evaluation of the waterfront space in the ancient city of Suzhou. Front. Archit. Res. 2021, 10, 729–740. [Google Scholar] [CrossRef]
- Liu, Y.; Xiao, T.; Liu, Y.; Yao, Y.; Wang, R. Natural outdoor environments and subjective well-being in Guangzhou, China: Comparing different measures of access. Urban For. Urban Green. 2021, 59, 127027. [Google Scholar] [CrossRef]
- Mechner, F. A notation system for the description of behavioral procedures. J. Exp. Anal. Behav. 1959, 2, 133–150. [Google Scholar] [CrossRef]
- Zhou, Y.; Zhang, Q.; Singh, V.P.; Xiao, M. General correlation analysis: A new algorithm and application. Stoch. Environ. Res. Risk Assess. 2015, 29, 665–677. [Google Scholar] [CrossRef]
- Braak, C.J.F.; Šmilauer, P. Topics in constrained and unconstrained ordination. Plant Ecol. 2015, 216, 683–696. [Google Scholar] [CrossRef]
- Yohannes, H.; Soromessa, T.; Argaw, M.; Dewan, A. Spatio-temporal changes in habitat quality and linkage with landscape characteristics in the Beressa watershed, Blue Nile basin of Ethiopian highlands. J. Environ. Manag. 2021, 281, 111885. [Google Scholar] [CrossRef] [PubMed]
- Fumo, N.; Rafe Biswas, M.A. Regression analysis for prediction of residential energy consumption. Renew. Sustain. Energy Rev. 2015, 47, 332–343. [Google Scholar] [CrossRef]
- Ding, F. Coupled-least-squares identification for multivariable systems. IET Control Theory Appl. 2013, 7, 68–79. [Google Scholar] [CrossRef]
- Martin-Lopez, B.; Iniesta-Arandia, I.; Garcia-Llorente, M.; Palomo, I.; Casado-Arzuaga, I.; Amo, D.G.; Gomez-Baggethun, E.; Oteros-Rozas, E.; Palacios-Agundez, I.; Willaarts, B.; et al. Uncovering ecosystem service bundles through social preferences. PLoS ONE 2012, 7, e38970. [Google Scholar] [CrossRef] [PubMed]
- Wang, S.; Chen, W.; Xie, S.M.; Azzari, G.; Lobell, D.B. Weakly Supervised Deep Learning for Segmentation of Remote Sensing Imagery. Remote Sens. 2020, 12, 207. [Google Scholar] [CrossRef]
- Zhou, S.; Chen, F.; Xu, Z. Evaluating the accessibility of urban parks and waterfronts through online map services: A case study of Shaoxing, China. Urban For. Urban Green. 2022, 77, 127731. [Google Scholar] [CrossRef]
- Dal Cin, F.; Hooimeijer, F.; Matos Silva, M. Planning the Urban Waterfront Transformation, from Infrastructures to Public Space Design in a Sea-Level Rise Scenario: The European Union Prize for Contemporary Architecture Case. Water 2021, 13, 218. [Google Scholar] [CrossRef]
- Wang, M.; Chen, M.X.; Song, H.Y. Effects of coupled coordination of habitat quality and recreation services on the vitality of waterfront spaces. China Urban For. 2022, 20, 7–13. [Google Scholar]
- Yang, C.X.; Shao, B. Influence of waterfront public space elements on residency vitality and countermeasures—An example of two typical waterfront areas in Shanghai Huangpu River. Urban Archit. 2018, 5, 40–47. [Google Scholar]
- White, J.T. Pursuing design excellence: Urban design governance on Toronto’s waterfront. Prog. Plan. 2016, 110, 1–41. [Google Scholar] [CrossRef]


| Spatial Variable Characteristics | Indicator Layer | Calculation Formula | Acquisition Method |
|---|---|---|---|
| Recreation service capacity (RS) R = (RS a + RS f + RS h)/3 | Accessibility (RS a) | RSa = length of sample entrance/sample circumference | Remote sensing data, Baidu map, field research |
| Number of public facilities (RS f) | RSf = number of public recreation, service, and management facilities | Field research | |
| Percentage of hard surface area (RS h) | RSh = hard surface/sample area | Remote sensing data | |
| Natural environmental quality (NEQ) E = (NEQ h + NEQ c + NEQ p + NEQ d)/4 | Habitat quality level (NEQ h) | InVEST model habitat quality and ArcGIS calculation | Park landscape (land use) type classification |
| Shoreline curvature (NEQ c) | NEQ c = L/L’ shoreline/total shoreline | Field research, ArcGIS calculation | |
| Plant richness (NEQ p) | NEQ p = number of plant species | Site research | |
| Hydrophilicity (height difference/distance) (NEQ d) | NEQ d = distance from water | Field research measurement | |
| Coupling coordination degree (D) D = | Coupling degree (C) | - | |
| Coordination degree (T) | T = a × RS + b × NEQ (a = 0.5, b = 0.5) | - |
| Indicator Layer | Numbers | Minimum | Maximum | Average | Standard Deviation | |
|---|---|---|---|---|---|---|
| RS | RS a | 22 | 0.03 | 1.00 | 0.45 | 0.24 |
| RS f | 22 | 0.00 | 1.00 | 0.33 | 0.30 | |
| RS h | 22 | 0.00 | 1.00 | 0.36 | 0.30 | |
| NEQ | NEQ h | 22 | 0.00 | 1.00 | 0.27 | 0.24 |
| NEQ c | 22 | 0.00 | 1.00 | 0.40 | 0.31 | |
| NEQ p | 22 | 0.00 | 1.00 | 0.39 | 0.28 | |
| NEQ d | 22 | 0.00 | 1.00 | 0.40 | 0.33 | |
| Criteria Layer | RS | NEQ | ||||||
|---|---|---|---|---|---|---|---|---|
| Indicator Layer | RS a | RS f | RS h | NEQ h | NEQ c | NEQ p | NEQ d | |
| RS | RS a | 1 | ||||||
| RS f | 0.769 ** | 1 | ||||||
| RS h | 0.825 ** | 0.567 ** | 1 | |||||
| NEQ | NEQ h | 0.452 * | 0.571 ** | 0.294 | 1 | |||
| NEQ c | 0.527 * | 0.394 | 0.474 * | 0.729 ** | 1 | |||
| NEQ p | 0.790 ** | 0.823 ** | 0.581 ** | 0.585 ** | 0.569 ** | 1 | ||
| NEQ d | 0.391 | 0.338 | 0.298 | −0.116 | 0.021 | 0.381 | 1 | |
| D-Value Range | Coherence Level | Coupling Coordination Degree | Sample |
|---|---|---|---|
| [0.0–0.2) | Levels 1–2 | Extreme disorder | A1, A5, A6, A7, A9, B6, B8 |
| [0.2–0.3) | Level 3 | Moderate disorder | A4, A11, B1, B4, B7 |
| [0.3–0.4) | Level 4 | Mild disorder | A3, B3, B11 |
| [0.4–0.5) | Level 5 | Nearly coordinated | A10, B2, B9 |
| [0.5–0.6) | Level 6 | Mild coordination | - |
| [0.6–0.7) | Level 7 | Moderately coordinated | A2 |
| [0.7–1.0) | Levels 8–10 | Excellent coordination | A8, B5, B10 |
| Guideline Level | Viewing Stay | Sports Stay | Leisure Stay | Social Stay | |||||||||
|---|---|---|---|---|---|---|---|---|---|---|---|---|---|
| Indicator Layer | Watching people | Viewing | Taking photos | Running | Biking | Fitness | Rest | Dog walking | Garden | Chatting | Chess | Camping | |
| Viewing Stay | Watching people | 1 | |||||||||||
| Viewing | 0.769 ** | 1 | |||||||||||
| Taking photos | 0.710 ** | 0.884 ** | 1 | ||||||||||
| Sports Stay | Running | −0.056 | 0.075 | 0.052 | 1 | ||||||||
| Biking | 0.100 | −0.100 | −0.027 | 0.519 * | 1 | ||||||||
| Fitness | 0.218 | 0.370 | 0.329 | 0.483 * | 0.276 | 1 | |||||||
| Leisure Stay | Rest | 0.132 | 0.171 | −0.019 | 0.657 ** | 0.056 | 0.411 | 1 | |||||
| Dog walking | 0.472 * | 0.284 | 0.294 | 0.463 * | 0.640 ** | 0.348 | 0.361 | 1 | |||||
| Garden | 0.246 | 0.468 * | 0.276 | 0.544 ** | −0.213 | 0.335 | 0.786 ** | 0.210 | 1 | ||||
| Social Stay | Chatting | 0.499 * | 0.432 * | 0.261 | 0.389 | −0.033 | 0.538 ** | 0.673 ** | 0.376 | 0.617 ** | 1 | ||
| Chess | 0.060 | 0.326 | 0.147 | 0.314 | −0.444 * | 0.341 | 0.700 ** | −0.077 | 0.717 ** | 0.591 ** | 1 | ||
| Camping | 0.388 | 0.124 | 0.164 | 0.408 | 0.702 ** | 0.002 | 0.244 | 0.649 ** | −0.009 | 0.139 | −0.343 | 1 | |
| Criteria Layer | RS | NEQ | ||||||
|---|---|---|---|---|---|---|---|---|
| Indicator Layer | RS a | RS f | RS h | NEQ h | NEQ c | NEQ p | NEQ d | |
| Viewing Stay | Watching people | 0.578 ** | 0.671 ** | 0.643 ** | 0.523 * | 0.493 * | 0.444 * | 0.153 |
| Viewing | 0.692 ** | 0.685 ** | 0.589 ** | 0.621 ** | 0.609 ** | 0.581 ** | 0.109 | |
| Taking photos | 0.574 ** | 0.529 * | 0.509 * | 0.605 ** | 0.732 ** | 0.437 * | 0.147 | |
| Sports Stay | Running | 0.492 * | 0.450 * | 0.214 | 0.049 | 0.157 | 0.613 ** | 0.728 ** |
| Biking | −0.035 | 0.204 | −0.075 | −0.015 | 0.040 | 0.158 | 0.400 | |
| Fitness | 0.671 ** | 0.509 * | 0.578 ** | 0.279 | 0.484 * | 0.537 ** | 0.286 | |
| Leisure Stay | Rest | 0.621 ** | 0.633 ** | 0.442 * | 0.141 | 0.101 | 0.749 ** | 0.407 |
| Dog walking | 0.369 | 0.613 ** | 0.345 | 0.534 * | 0.413 | 0.645 ** | 0.320 | |
| Garden | 0.762 ** | 0.612 ** | 0.508 * | 0.296 | 0.293 | 0.745 ** | 0.287 | |
| Social Stay | Chatting | 0.836 ** | 0.714 ** | 0.814 ** | 0.166 | 0.193 | 0.677 ** | 0.419 |
| Chess | 0.621 ** | 0.491 * | 0.409 | 0.280 | 0.130 | 0.546 ** | 0.208 | |
| Camping | 0.104 | 0.403 | 0.104 | 0.071 | 0.133 | 0.355 | 0.300 | |
| Total Stay Vitality | - | 0.905 ** | 0.895 ** | 0.729 ** | 0.522 * | 0.566 ** | 0.889 ** | 0.473 * |
| Variables | Viewing Stay | Sports Stay | Leisure Stay | Social Stay | Total Stay Vitality |
|---|---|---|---|---|---|
| RS | 0.711 ** | 0.520 * | 0.749 ** | 0.861 ** | 0.935 ** |
| NEQ | 0.675 ** | 0.600 ** | 0.658 ** | 0.627 ** | 0.853 ** |
| RS and NEQ Coupling Coordination Degree | 0.736 ** | 0.595 ** | 0.766 ** | 0.818 ** | 0.963 ** |
| Independent Variables | Total Stay Vitality | |||||
|---|---|---|---|---|---|---|
| Non-Standardized b | Standardized b’ | t | Significance | VIF | ||
| (Constant) | 20.165 | - | 1.569 | 0.139 | - | |
| RS | RS a | 0.286 | 0.289 | 2.069 | 0.057 | 6.500 |
| RS f | 4.806 | 0.460 | 3.851 | 0.002 | 4.741 | |
| RS h | 25.440 | 0.370 | 0.359 | 0.725 | 3.524 | |
| NEQ | NEQ h | −0.001 | −0.114 | −1.086 | 0.296 | 3.685 |
| NEQ c | 421.322 | 0.197 | 1.999 | 0.065 | 3.224 | |
| NEQ p | 0.763 | 0.174 | 1.450 | 0.169 | 4.767 | |
| NEQ d | 22.488 | 0.110 | 1.620 | 0.128 | 1.536 | |
Disclaimer/Publisher’s Note: The statements, opinions and data contained in all publications are solely those of the individual author(s) and contributor(s) and not of MDPI and/or the editor(s). MDPI and/or the editor(s) disclaim responsibility for any injury to people or property resulting from any ideas, methods, instructions or products referred to in the content. |
© 2023 by the authors. Licensee MDPI, Basel, Switzerland. This article is an open access article distributed under the terms and conditions of the Creative Commons Attribution (CC BY) license (https://creativecommons.org/licenses/by/4.0/).
Share and Cite
Chen, L.; Ma, Y. How Do Ecological and Recreational Features of Waterfront Space Affect Its Vitality? Developing Coupling Coordination and Enhancing Waterfront Vitality. Int. J. Environ. Res. Public Health 2023, 20, 1196. https://doi.org/10.3390/ijerph20021196
Chen L, Ma Y. How Do Ecological and Recreational Features of Waterfront Space Affect Its Vitality? Developing Coupling Coordination and Enhancing Waterfront Vitality. International Journal of Environmental Research and Public Health. 2023; 20(2):1196. https://doi.org/10.3390/ijerph20021196
Chicago/Turabian StyleChen, Lihua, and Yuan Ma. 2023. "How Do Ecological and Recreational Features of Waterfront Space Affect Its Vitality? Developing Coupling Coordination and Enhancing Waterfront Vitality" International Journal of Environmental Research and Public Health 20, no. 2: 1196. https://doi.org/10.3390/ijerph20021196
APA StyleChen, L., & Ma, Y. (2023). How Do Ecological and Recreational Features of Waterfront Space Affect Its Vitality? Developing Coupling Coordination and Enhancing Waterfront Vitality. International Journal of Environmental Research and Public Health, 20(2), 1196. https://doi.org/10.3390/ijerph20021196