Article

Concentration Characteristics and Correlations with Other Pollutants of Atmospheric Particulate Matter as Affected by Relevant Policies

1
School of Management, Xi’an University of Architecture and Technology, Xi’an 710055, China
2
School of Resources Engineering, Xi’an University of Architecture and Technology, Xi’an 710055, China
3
School of Environmental and Municipal Engineering, Xi’an University of Architecture and Technology, Xi’an 710055, China
4
School of Building Services Science and Engineering, Xi’an University of Architecture and Technology, Xi’an 710055, China
*
Authors to whom correspondence should be addressed.
Int. J. Environ. Res. Public Health 2023, 20(2), 1051; https://doi.org/10.3390/ijerph20021051
Submission received: 30 November 2022 / Revised: 21 December 2022 / Accepted: 5 January 2023 / Published: 6 January 2023

Abstract

:
With the increase in global environmental pollution, it is important to understand the concentration characteristics and correlations with other pollutants of atmospheric particulate matter as affected by relevant policies. The data presented in this paper were obtained at monitoring stations in Xi’an, China, in the years from 2016 to 2020, and the spatial distribution characteristics of the mass and quantity concentrations of particulate matter in the atmosphere, as well as its correlation with other pollutants, were analyzed in depth. The results showed that the annual average concentrations of PM10 and PM2.5 decreased year by year from 2016 to 2020. The annual concentrations of PM2.5 decreased by 20.3 μg/m3, and the annual concentrations of PM10 decreased by 47.3 μg/m3. The days with concentrations of PM10 exceeding the standards decreased by 82 days, with a decrease of 66.7%. The days with concentrations of PM2.5 exceeding the standards decreased by 40 days, with a decrease of 35.4%. The concentration values of PM10 and PM2.5 were roughly consistent with the monthly and daily trends. The change in monthly concentrations was U-shaped, and the change in daily concentrations showed a double-peak behavior. The highest concentrations of particulate matter appeared at about 8:00~9:00 am and 11:00 pm, and they were greatly affected by human activity. The proportion of particles of 0~1.0 μm decreased by 1.94%, and the proportion of particles of 0~2.5 μm decreased by 2.00% from 2016 to 2020. A multivariate linear regression model to calculate the concentrations of the pollutants was established. This study provides a reference for the comprehensive analysis and control of air pollutants in Xi’an and even worldwide.

1. Introduction

With the continuous worsening of complex and intersecting air pollution problems in recent years, people have been paying more attention to a series of problems caused by air pollution [1]. The serious excess of particulate matter and other gaseous pollutants in the atmosphere not only leads to the decline in atmospheric visibility but also seriously affects routine travel and transportation [2] and even causes harm to the human body to various extents [3,4]. The relevant literature shows that particles of different sizes can cause respiratory diseases, infectious diseases, etc. [5]. The large-scale spread of COVID-19 (corona virus disease 2019) has brought unprecedented catastrophic effects on the life and health of people all over the world [6] and has caused numerous deaths. In addition, toxic and harmful gases, viruses, and bacteria attach to the surface of particulate matter [7], which allows them to enter the human body and causes a chain reaction whose effects can be life threatening. Therefore, how to create an appropriate and healthy living environment has unanimously become the priority of nations worldwide.
Therefore, many countries around the world have issued a series of relevant policies and standards to limit the concentration of the emissions of various pollutants in the atmosphere [8,9,10]. The determination of concentration distribution characteristics and the source analysis of pollutants in the atmosphere have gradually become the focus of scholars at home and abroad at the same time [11,12,13,14,15]. Research mainly focuses on the composition of particulate matter [11], human health effects [12], correlation studies on different pollutants [13,14], and the control of particulate matter pollution [15]. In addition, how pollutants are measured, which are the most polluted areas, which activities are the most polluting, and what is the impact of external factors on the accuracy of measurement techniques are also hot points [16,17,18], with an example being the performance of low-cost sensors for air quality monitoring [16]. However, there have been relatively few studies on the changes in the concentration distribution of particulate matter and its correlation with other major pollutants in recent years. Current research on air pollutants in China is also limited to certain areas, such as Nanjing [19], Yunnan [20], Beijing [21], and other places; meanwhile, there have been relatively few recent studies on northwest inland cities. In addition, there is a significant difference between the north and the south in China, and the particle concentration distributions in different regions show even greater differences [22]. Many different countries and regions around the world have introduced stricter control measures and control methods for monitoring pollutants in the atmosphere and have also strengthened energy adjustment measures and increased implementation efforts in recent years. All of these factors will likely lead to changes in the concentration distribution characteristics of pollutants in the atmosphere and the correlations among pollutants; there might even be unexpected results. However, there are still relatively few relevant studies, and the overall research effort is slightly insufficient. In particular, there is a serious lack of research on the concentration distribution of pollutants in typical northwest cities in China under the relevant control measures employed in recent years.
The spatio-temporal distribution of the quantity and mass concentrations of particulate matter in the atmosphere in Xi’an, as well as the correlations with other pollutants, were analyzed in this paper using monitoring data and recorded data from 2016 to 2020. This study could help stakeholders to clearly understand the change characteristics of atmospheric concentration distributions in the five years considered as affected by relevant policies; furthermore, it could also provide a reference for the comprehensive management of and improvement in the atmospheric environment across the country and the world.

2. Methods

Xi’an, with located longitude 107.40°~109.49° E and latitude 33.42°~34.45° N, was selected as the research area [23]. It is a long-established, old-civilization city with more than 5000 years of civilization history [23], and it has a large population. However, the atmospheric environmental conditions in Xi’an have become increasingly serious in recent years, and this has deeply affected people’s lives. To solve this problem effectively and rapidly, the government took a series of measures to protect the atmosphere in 2017, and these were rapidly implemented. Examples include urban development without coal, and coal-to-electricity and coal-to-gas transitions [24], and certain results were initially achieved. Therefore, we decided to select the atmospheric data of Xi’an of a recent five-year period (2016–2020) for in-depth research.
The data in this paper covered the period from 31 January 2016 to 31 December 2020 (provided by the tianqihoubao network (http://www.tianqihoubao.com/aqi/xian, accessed on 6 June 2021)) and included the daily average concentration values of SO2, NO2, PM10, PM2.5, O3, and CO. The hourly concentration values of six pollutants as recorded at monitoring stations in Xi’an were provided by Weather Network (http://www.tianqi.com/air/xian.html, accessed on 6 June 2021). GRIMM1.109 portable aerosol spectrometers (GRIMM Aerosol, Ainring, Germany) were used to measure the concentration of particles in the atmosphere. The particles ranging from 0.25 to 32 μm in diameter could be separated into 31 channels. Repeatability was 5%. The average concentration over 20 min was recorded, and the data were analyzed using mean values to reduce the experimental error. To ensure the validity of data statistics, we report the Chinese standards for reference [25,26,27], as this allows one to analyze data more efficiently. The Chinese standards establish daily average concentrations of 35~75 μg/m3 PM2.5, 50~150 μg/m3 PM10, 50~150 μg/m3 SO2, 80 μg/m3 NO2, 4 mg/m3 CO, and 160~200 μg/m3 O3 (1-h values in the case of O3) [25].

3. Results and Discussion

3.1. Annual Concentrations of Particulate Matter

Figure 1 shows that the changes in the proportions of PM2.5 and PM10 concentrations per year followed the same trend. The proportions of PM2.5 concentrations lower than 35 μg/m3 and of PM10 concentrations lower than 50 μg/m3 were relatively low, and the proportions increased gradually over time. The proportions of PM2.5 concentrations between 35 and 75 μg/m3 and of PM2.5 concentrations higher than 75 μg/m3 gradually decreased. On the other hand, the proportions of PM10 concentrations between 50 and 150 μg/m3 showed a gradually increasing trend, with a fluctuating and dominant position. The proportions of PM10 concentrations higher than 150 μg/m3 gradually decreased, and the trend was the same as that of PM2.5 concentrations. It can be clearly seen from the graphs that the proportion of days with low concentrations increased and that the proportion of days with concentrations exceeding the standards decreased, which indicates that the air quality in Xi’an gradually improved and the concentrations of particulate matter in the atmosphere gradually decreased. More specifically, the concentrations of particulate matter changed significantly from 2017 to 2018. The proportions of PM2.5 concentrations lower than 35 μg/m3 increased by 8.42%. The main reasons were that a series of measures were taken for controlling air pollution and that relevant energy production methods were adjusted, which had an obvious effect on the concentration of particulate matter emissions. The specific parameters are shown in Table 1.
It can be seen from the table that the annual average concentrations of PM2.5 and PM10 gradually decreased from 2016 to 2020. The annual concentrations of PM2.5 decreased by 20.3 μg/m3, and the annual concentrations of PM10 decreased by 47.3 μg/m3. The annual average concentrations of PM10 were 1.96 times, 1.86 times, 1.70 times, 1.46 times, and 1.29 times that of the secondary standard from 2016 to 2020, and 3.43 times, 3.26 times, 2.97 times, 2.56 times, and 2.25 times that of the primary standard [25]. The annual average concentrations of PM2.5 were 2.02 times, 2.06 times, 1.73 times, 1.65 times, and 1.44 times that of the secondary standard and 4.71 times, 4.81 times, 4.04 times, 3.85 times, and 3.36 times that of the primary standard [25]. The number of days with concentrations exceeding the standards showed a downward trend. The average number of days with concentrations of PM10 exceeding the standards was 84 days from 2016 to 2020, and the days with concentrations of PM10 exceeding the standards decreased by 82 days, with a decrease of 66.7%. The average number of days with concentrations of PM2.5 exceeding the standards was 94 days, and the days with concentrations of PM2.5 exceeding the standards decreased by 40 days, with a decrease of 35.4%. Therefore, the concentrations of particulate matter in the atmosphere in Xi’an in the five years considered were effectively controlled, and certain results also were achieved, but further in-depth management is still required.

3.2. Seasonal Concentrations of Particulate Matter

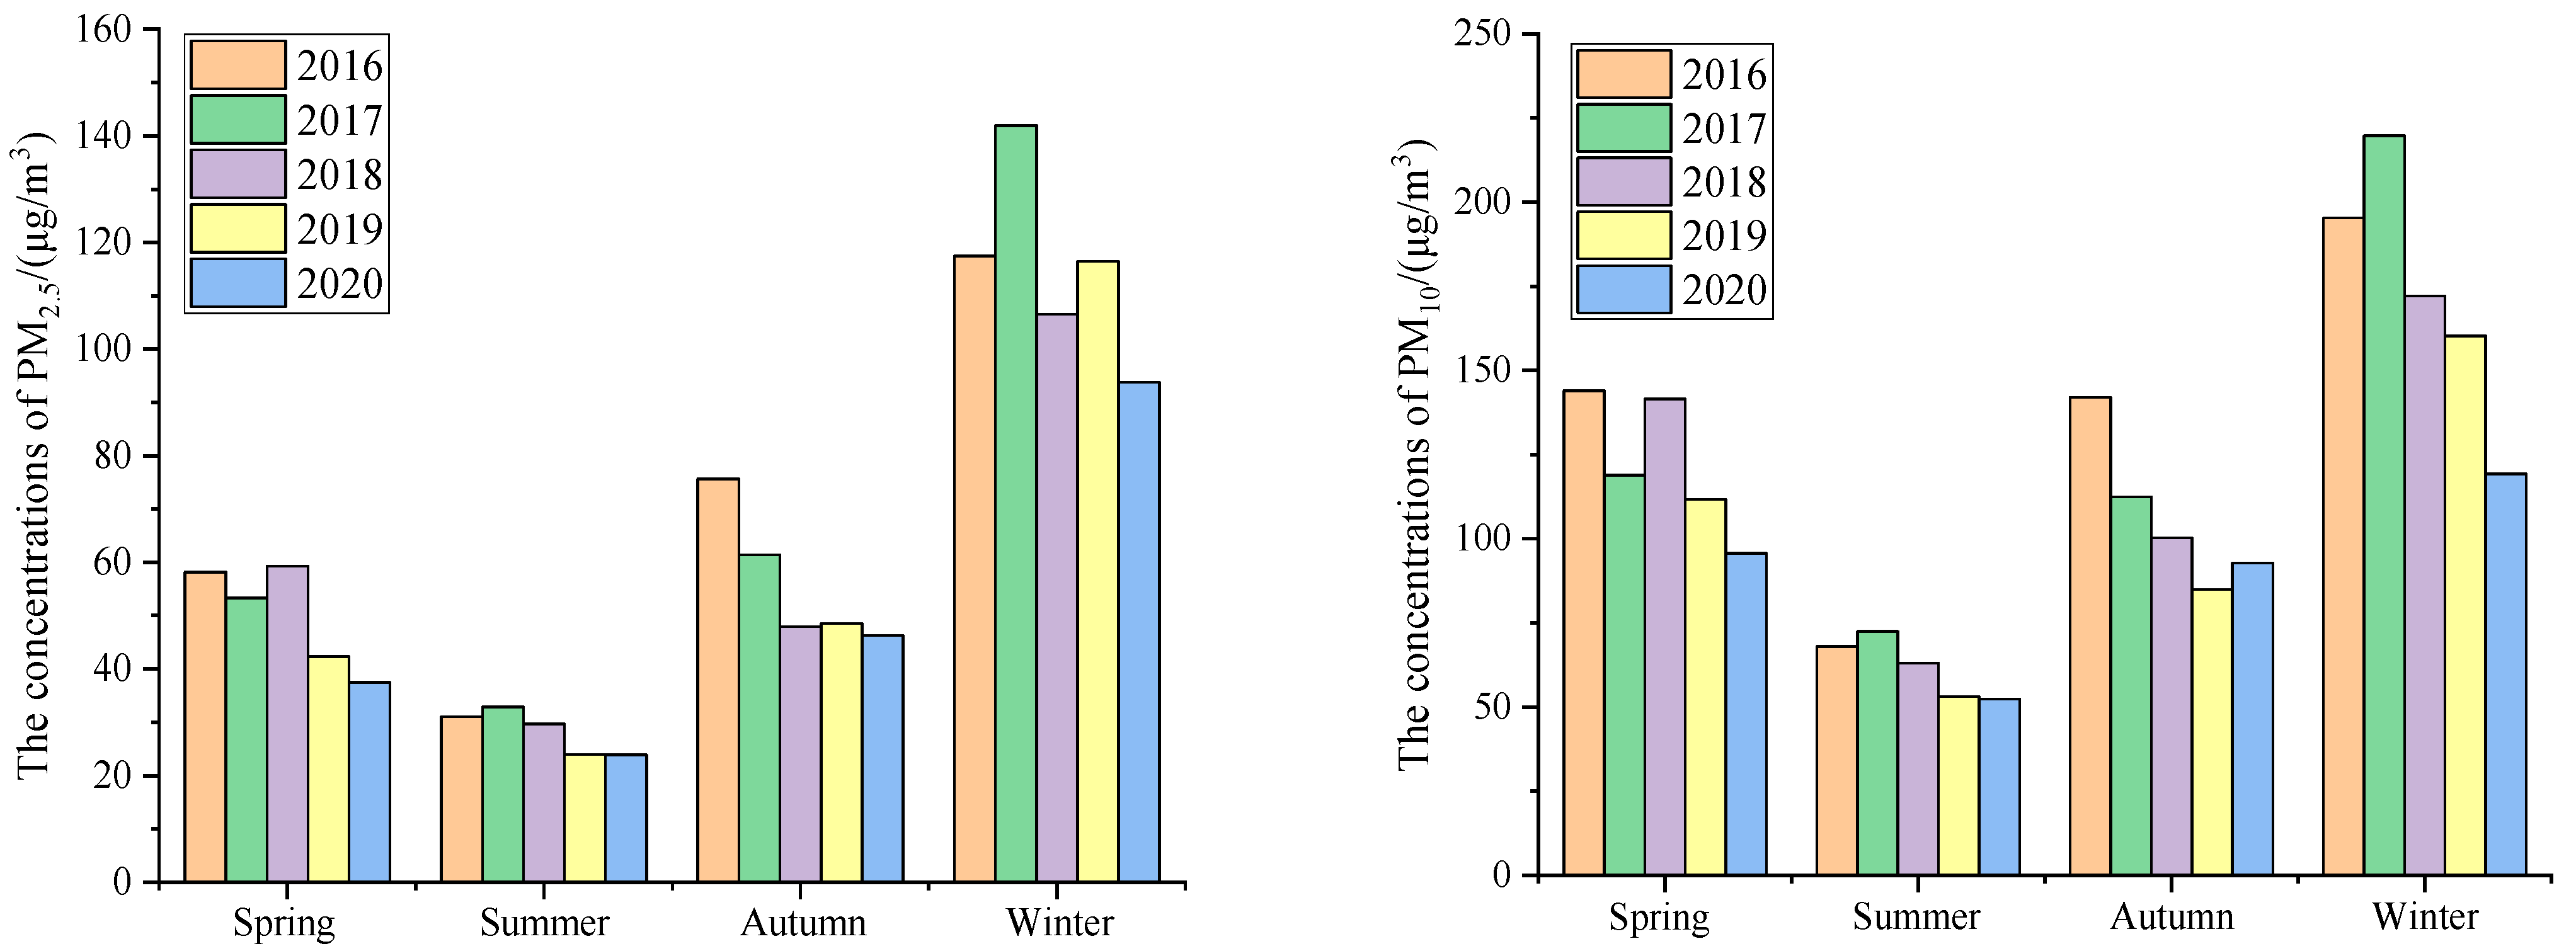
The seasonal average statistics according to the climatic conditions of the Chinese region were defined for spring (March to May), summer (June to August), autumn (September to November), and winter (December to February) [13,28,29]. The average concentrations of particulate matter in different seasons are shown in Figure 2.
Figure 2 shows that the seasonal average concentrations of different particles in the five years considered presented good similarity, but there were still certain differences in different seasons. The concentrations of PM2.5 followed the order of winter > autumn > spring > summer, with the five-year average concentrations being 115.2 μg/m3, 56.0 μg/m3, 50.1 μg/m3, and 28.3 μg/m3, respectively. The concentrations in winter were 2.06 times higher than those in autumn, 2.30 times higher than those in spring, and 4.07 times higher than those in summer. The concentrations of PM10 followed the order of winter > spring > autumn > summer, with the five-year average concentrations being 173.3 μg/m3, 122.4 μg/m3, 106.5 μg/m3, and 61.8 μg/m3, respectively. The concentrations in winter were 1.42 times higher than those in spring, 1.63 times higher than those in autumn, and 2.81 times higher than those in summer. Overall, it was observed that the concentrations of particulate matter were the highest in winter and the lowest in summer, which is consistent with the literature [22].

3.3. Monthly Concentrations of Particulate Matter

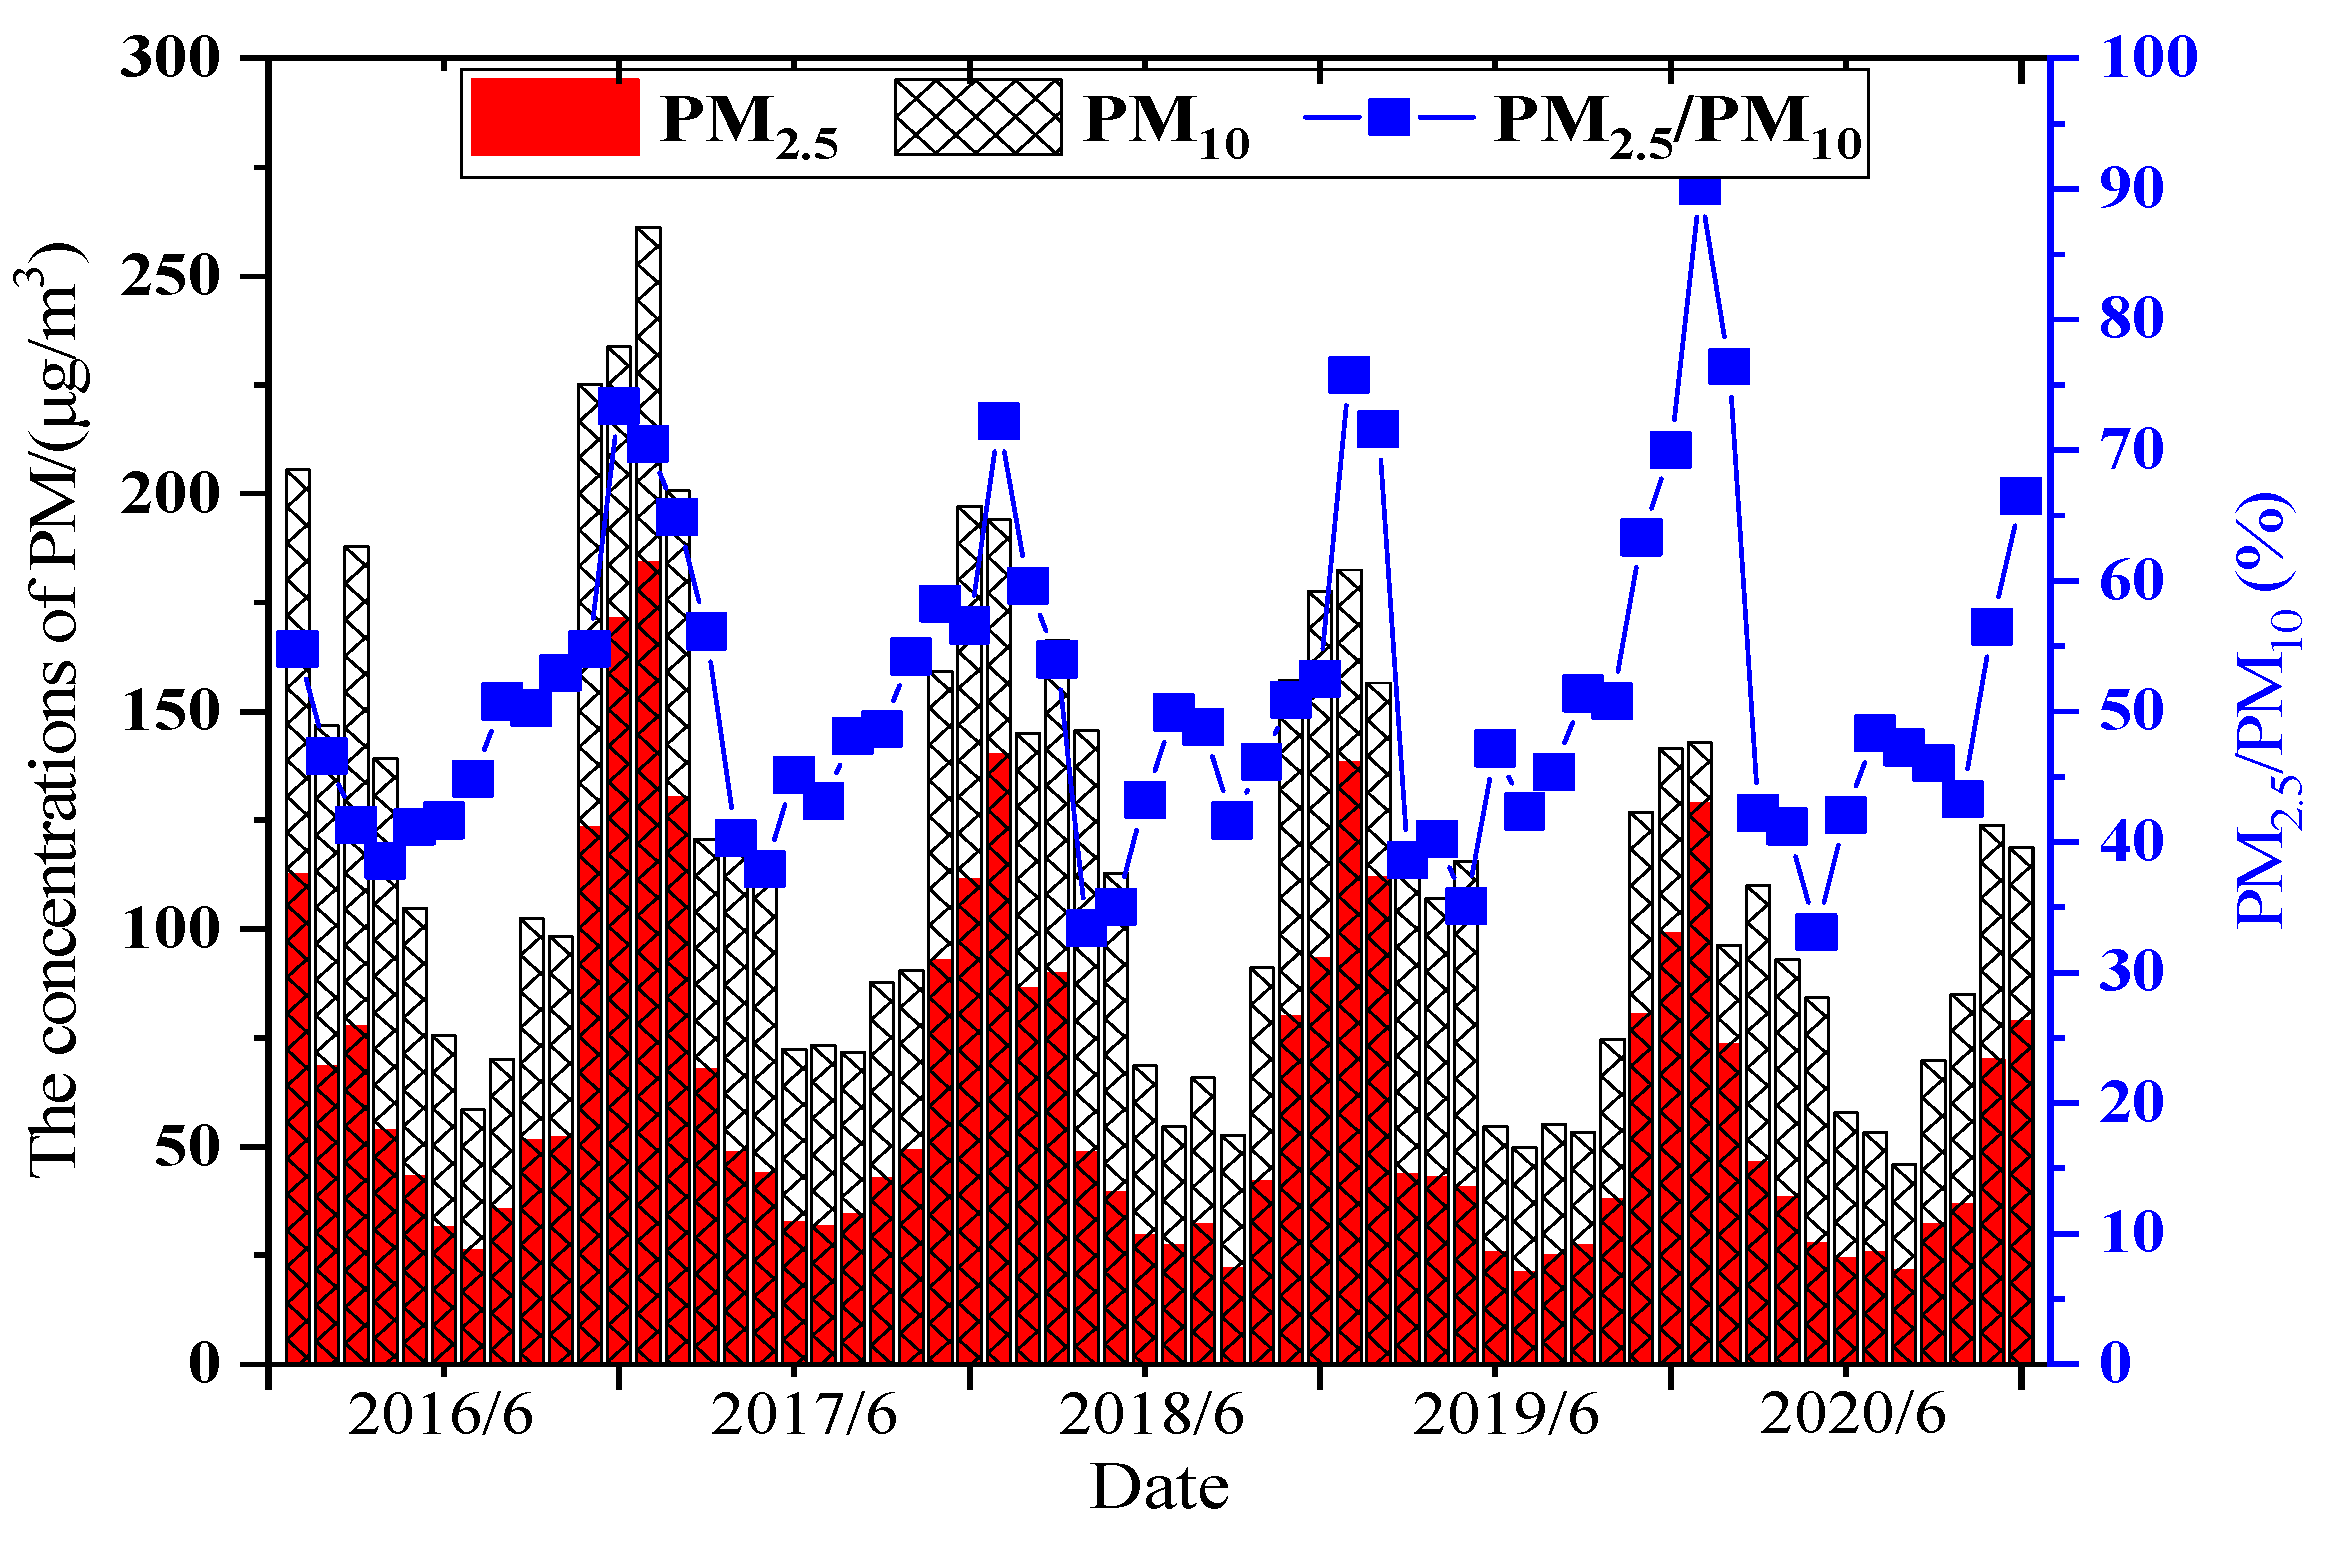
The average concentrations of particulate matter in different months are shown in Figure 3.
Figure 3 shows that the monthly average concentrations of PM2.5 and PM10 all showed a U-shaped trend. The average monthly concentrations of PM2.5 and PM10 were the lowest in July and October, while the average monthly concentration of PM2.5 and PM10 were the highest in December and January. It could also be seen that the concentrations of particulate matter in the same months from 2016 to 2020 showed a gradually decreasing trend. The concentrations of PM2.5 rose rapidly from the lowest value in July to December and then began to decrease in spring. The concentrations of PM10 still had a high value in spring, which might have been related to the frequent occurrence of dusty weather in spring [23]. The average annual proportions of PM2.5/PM10 from 2016 to 2020 were 49.2%, 52.0%, 48.9%, 52.6%, and 52.8%, respectively. The atmospheric particles in Xi’an are mainly fine particles, and it is still necessary to further study the source of fine particulate matter.

3.4. Daily Concentrations of Particulate Matter

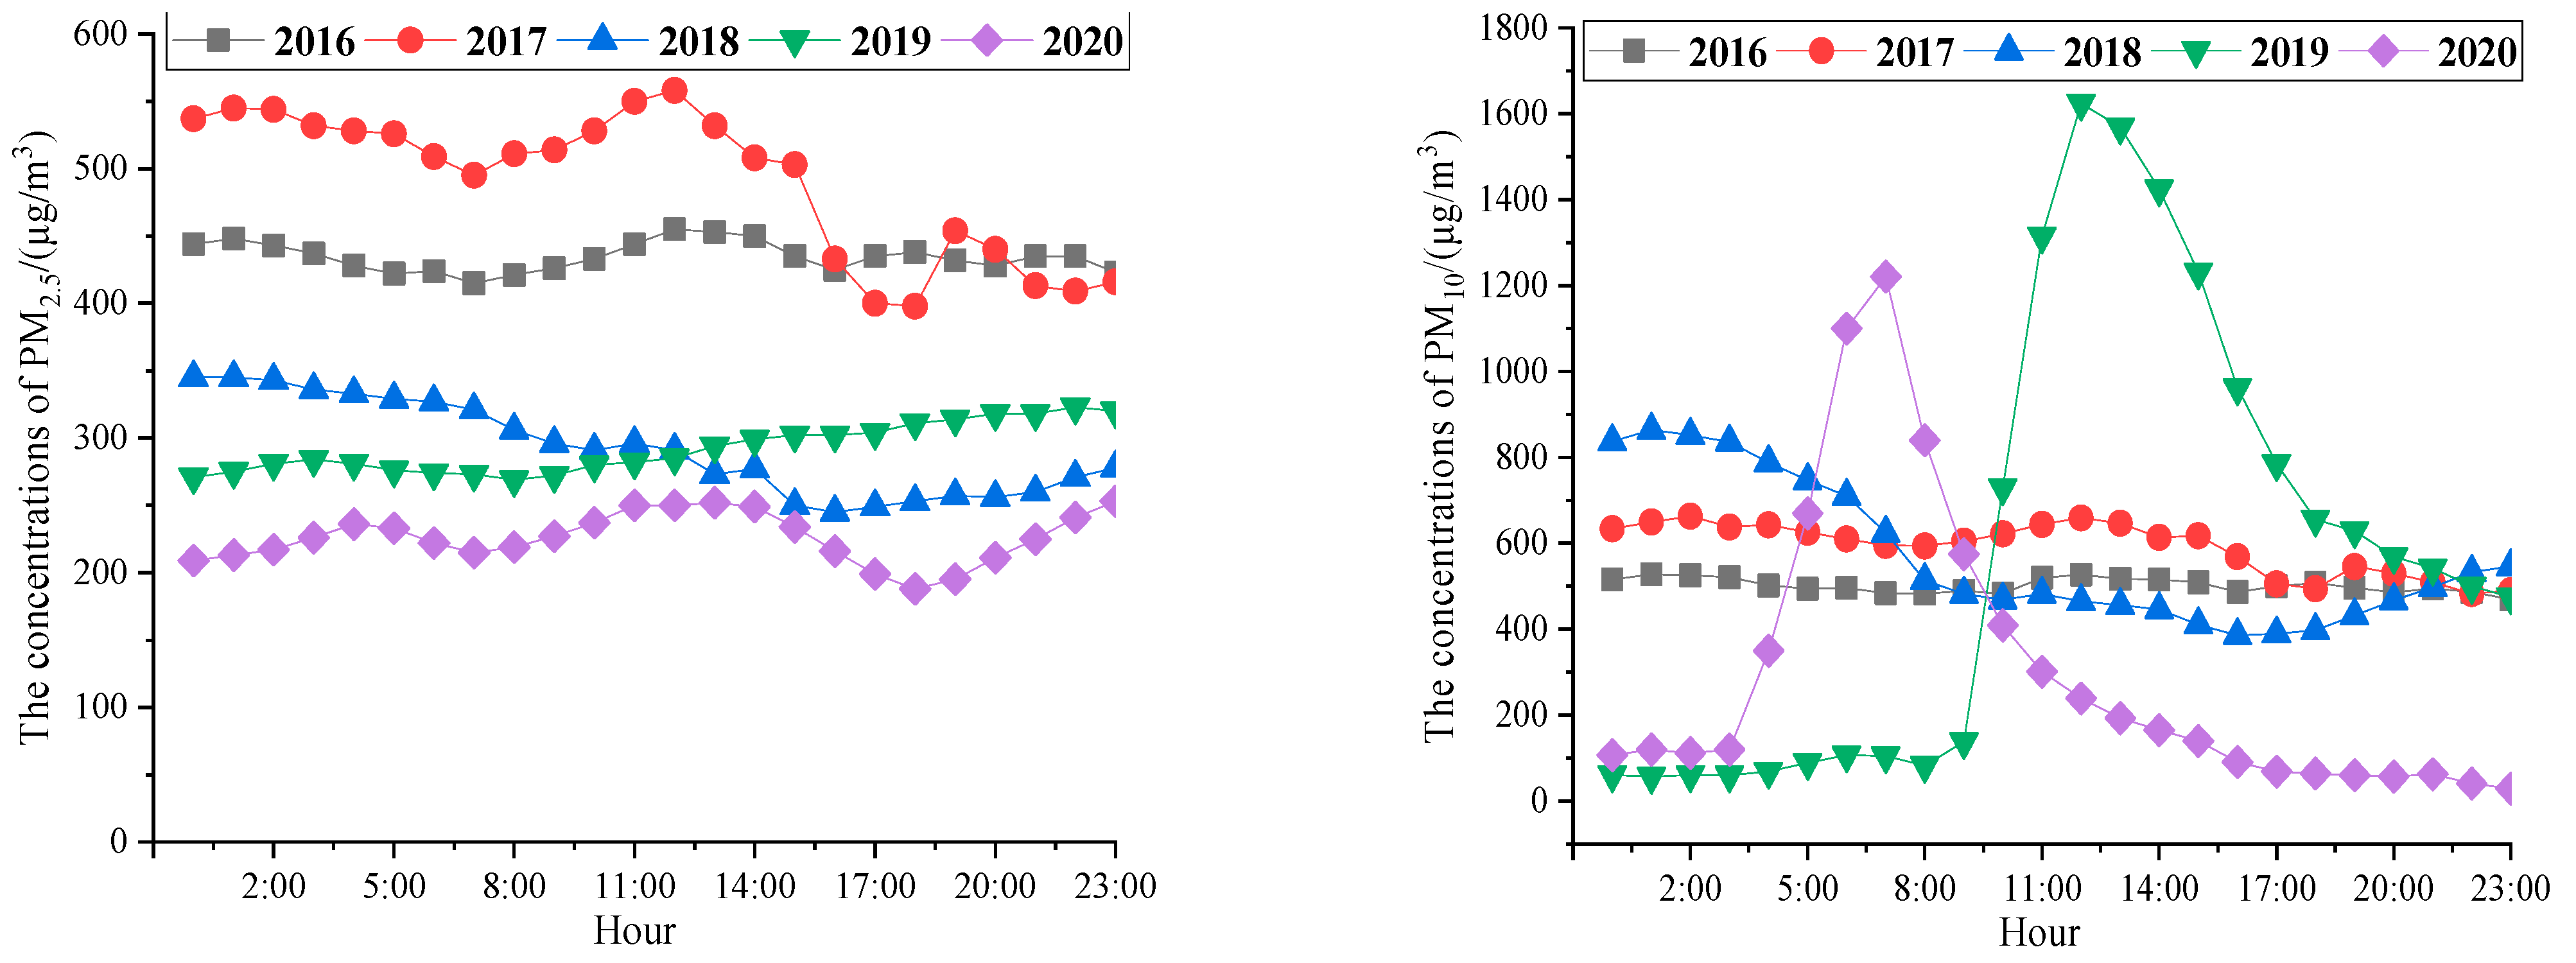
The five days with the largest concentrations of PM2.5 were adopted in this paper, namely, 20 December 2016; 5 January 2017; 15 January 2018; 6 January 2019; and 25 January 2020. For PM10, these were 20 December 2016; 5 January 2017; 3 December 2018; 12 May 2019; and 26 March 2020. The time period was from 0:00 to 24:00. The average distributions of different daily concentrations of particulate matter are shown in Figure 4.
Figure 4 shows that the hourly average distribution trends of PM2.5 and PM10 were consistent with a bimodal distribution. In addition, it can be seen that the maximum concentrations in 2018, 2019, and 2020, after the adoption of relevant measures, were much lower than the maximum concentrations in 2016 and 2017, before the adoption of measures. The concentrations of PM2.5 and PM10 in 2020 were relatively low, which indirectly showed that the phenomenon of high concentrations of particulate matter was controlled after the adoption of relevant measures. The concentrations at night were higher than those in the daytime. The main reason was the demand for heating in winter, which leads to an increase in the concentrations of particulate matter. Another reason was the influence of vertical movement in the atmosphere, which is not conducive to the spread of particles [22,23]. As a result, the concentrations of particulate matter reached the maximum at around 11 o’clock at night. The concentrations of particulate matter gradually increased from about 8:00 in the morning, which corresponds to the commuting peak, when pollutant emissions also reach the peak of the day. The concentrations of particulate matter gradually decreased in the afternoon. The main reasons were that solar radiation is stronger and the temperature of the environment is higher, which make turbulent exchange and diffusion of gases stronger. The atmosphere near the ground in the evening is more unstable, and the lowest concentrations of particulate matter appeared around 17:00. Human activity had a significant impact on the concentrations of particulate matter, and this conclusion is consistent with the conclusion given by Zhu Changlin [28], which verifies the validity of the results of this paper. However, the concentrations of PM10 on 12 May 2019 and 26 March 2020 changed significantly, which might have been related to local meteorological parameters or the environment on those days [30]. The specific parameters of typical days in Xi’an are shown in Table 2.

3.5. Quantity Concentrations of Atmospheric Particles

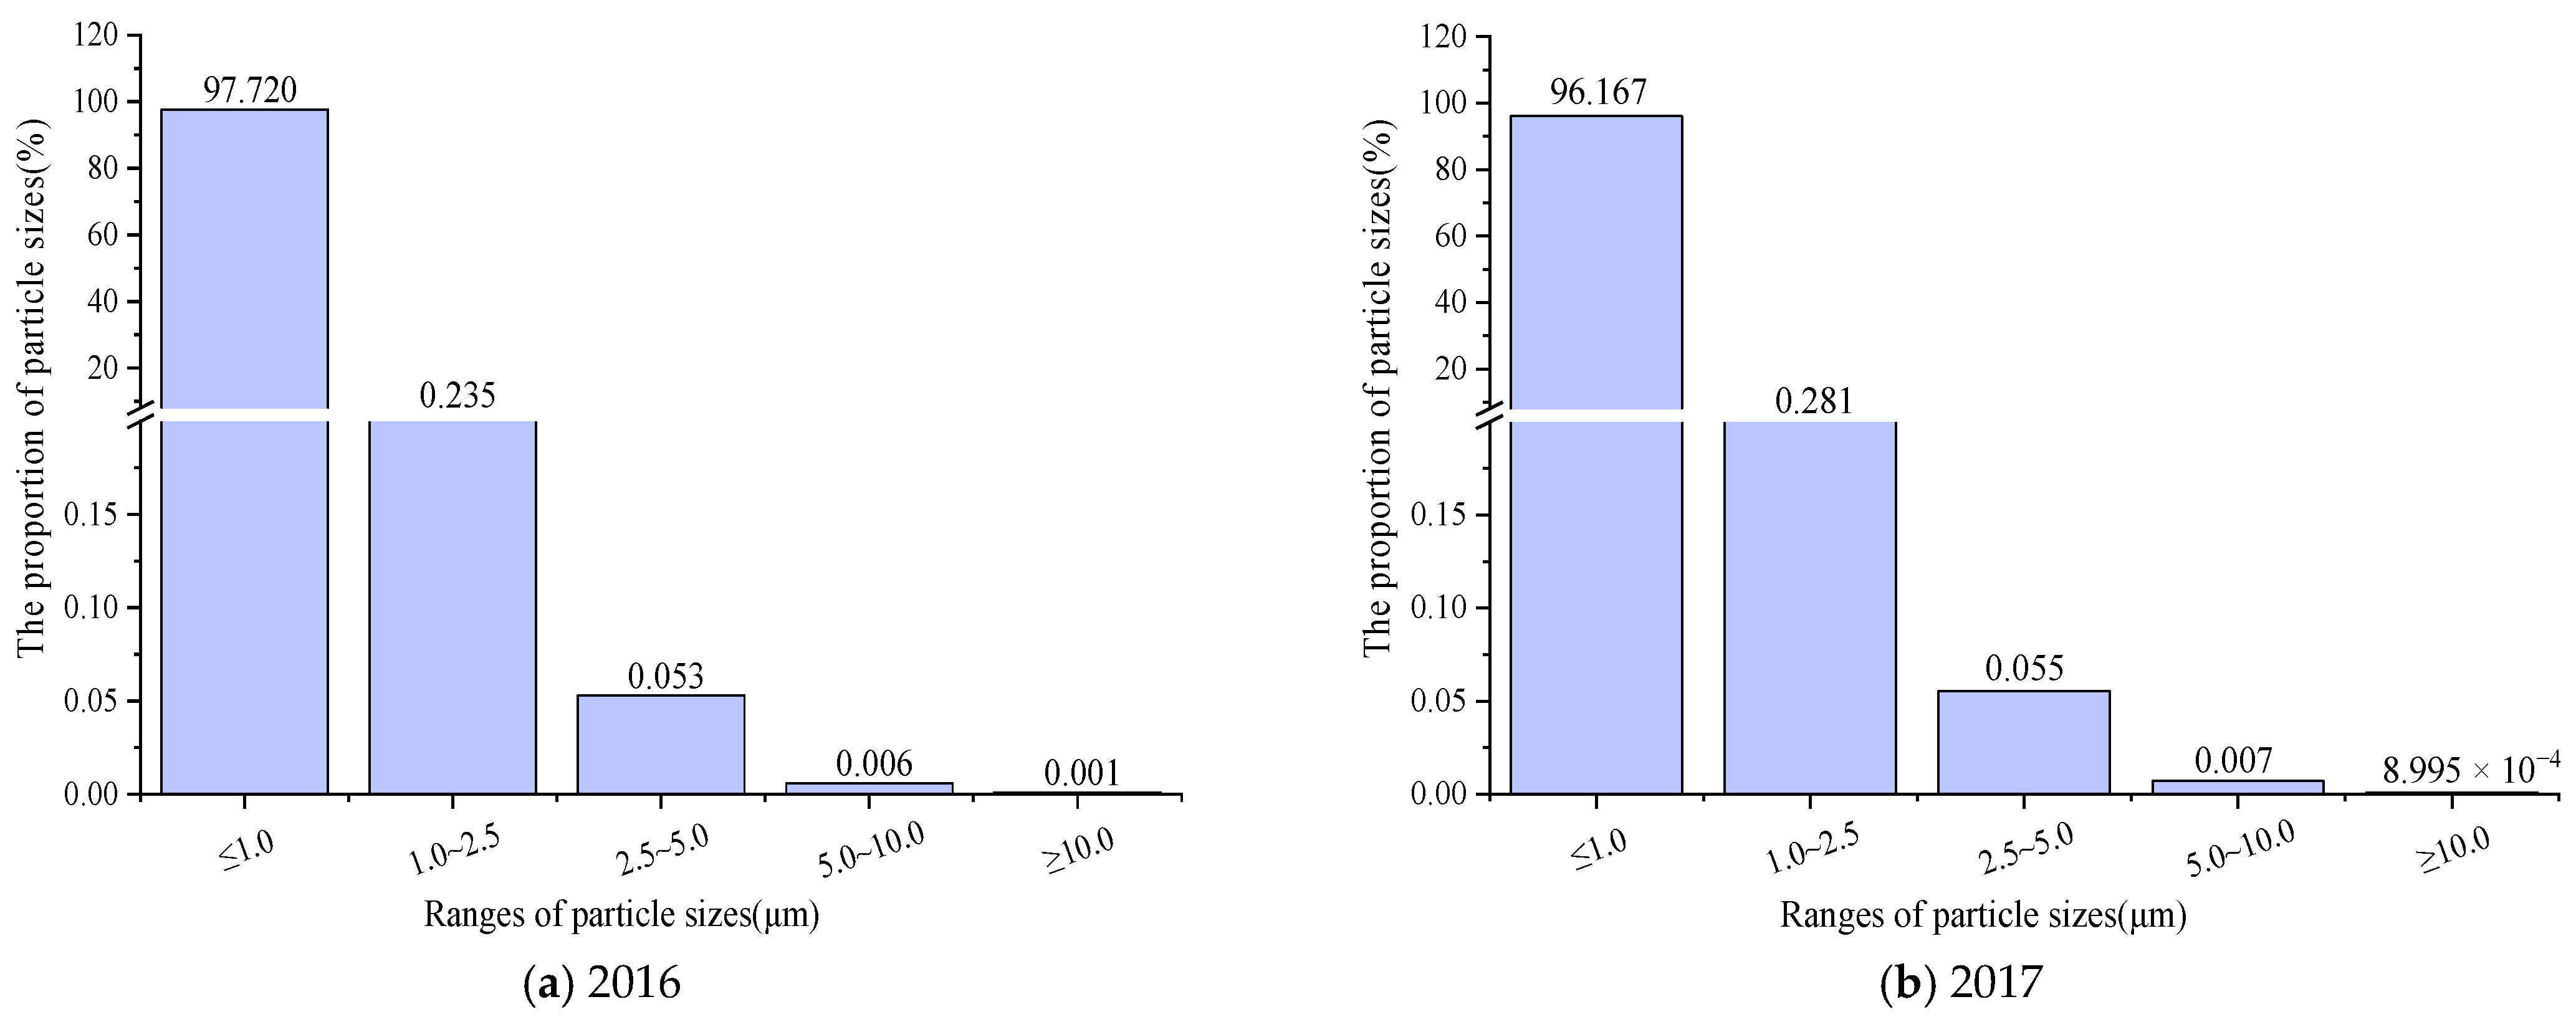
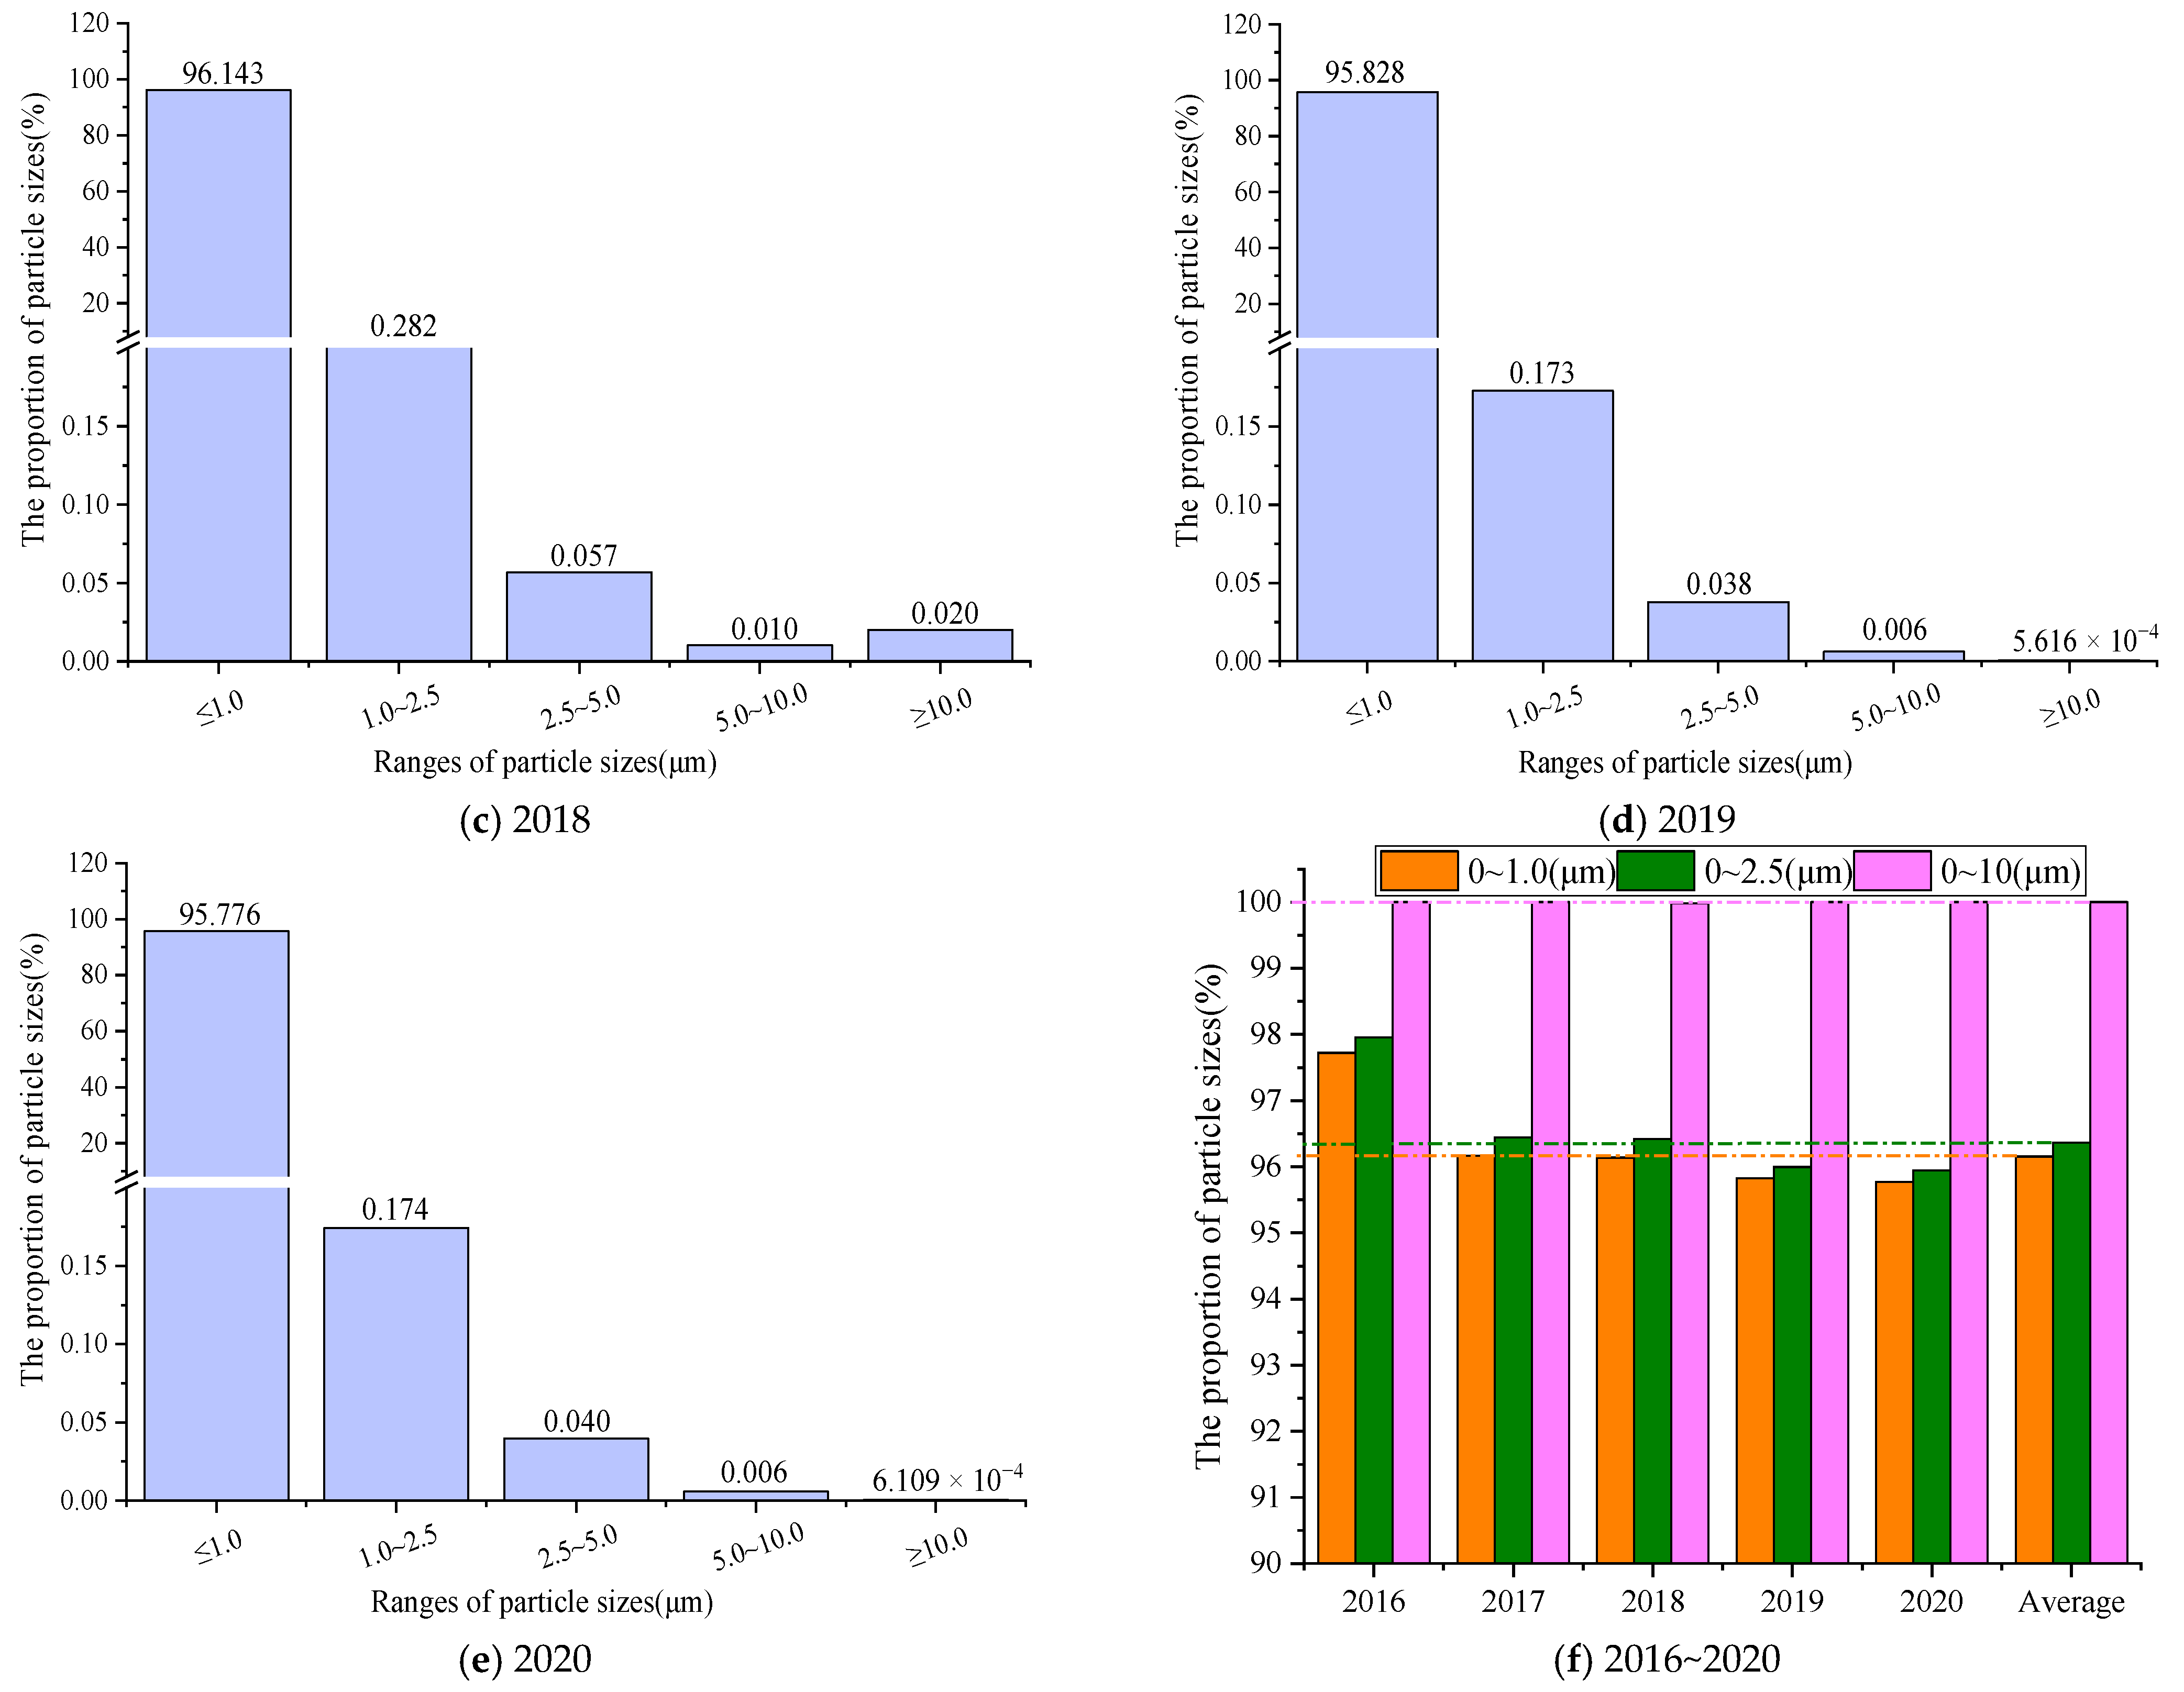
Outdoor atmospheric dust was used as the test dust source [31]. The atmospheric particle size distributions during the test period are shown in Figure 5.
Figure 5a–e shows the quantity distributions of particle sizes in the outdoor atmosphere during the test period. It can be seen that particles of sizes of 0~1.0 μm accounted for the vast majority from 2016 to 2020, i.e., about 97.72%, 96.17%, 96.14%, 95.83%, and 95.78%, respectively, with the proportion decreasing by 1.94%. Particles of sizes of 1.0~2.5 μm accounted for about 0.235%, 0.281%, 0.282%, 0.173%, and 0.174%, respectively, with the proportion decreasing by 0.061%. However, the proportion of particles of sizes above 2.5 μm was relatively small; this is consistent with the conclusions given in the literature, which verifies the validity of the results of this paper [22,23]. The changes in the 5 years considered were relatively insignificant for particles of sizes larger than 2.5 μm, but there was still a trend of decreasing concentrations.
Figure 5f shows that particles of an average particle size between 0 and 1.0 μm accounted for 96.16% of the total in the five years considered, while particles of sizes between 0 and 2.5 μm accounted for 96.37%, and particles of sizes between 0 and 10 μm accounted for about 100%. It is clear that in Xi’an, particles are mainly composed of fine particles; such particles can easily enter the respiratory tract and lungs of the human body, leading to diseases and death [32]. With the rapid implementation of measures for the control of atmospheric particulate matter concentrations, the proportion of particles of 0~1.0 μm decreased by 1.94%, and the proportion of particles of 0~2.5 μm decreased by 2.00%. The implementation of relevant measures and governance policies has achieved certain results, but it is still necessary to increase the purification effect on fine particles in the future to achieve the creation of a healthy environment.

3.6. Correlations between Particulate Matter and Other Major Pollutants

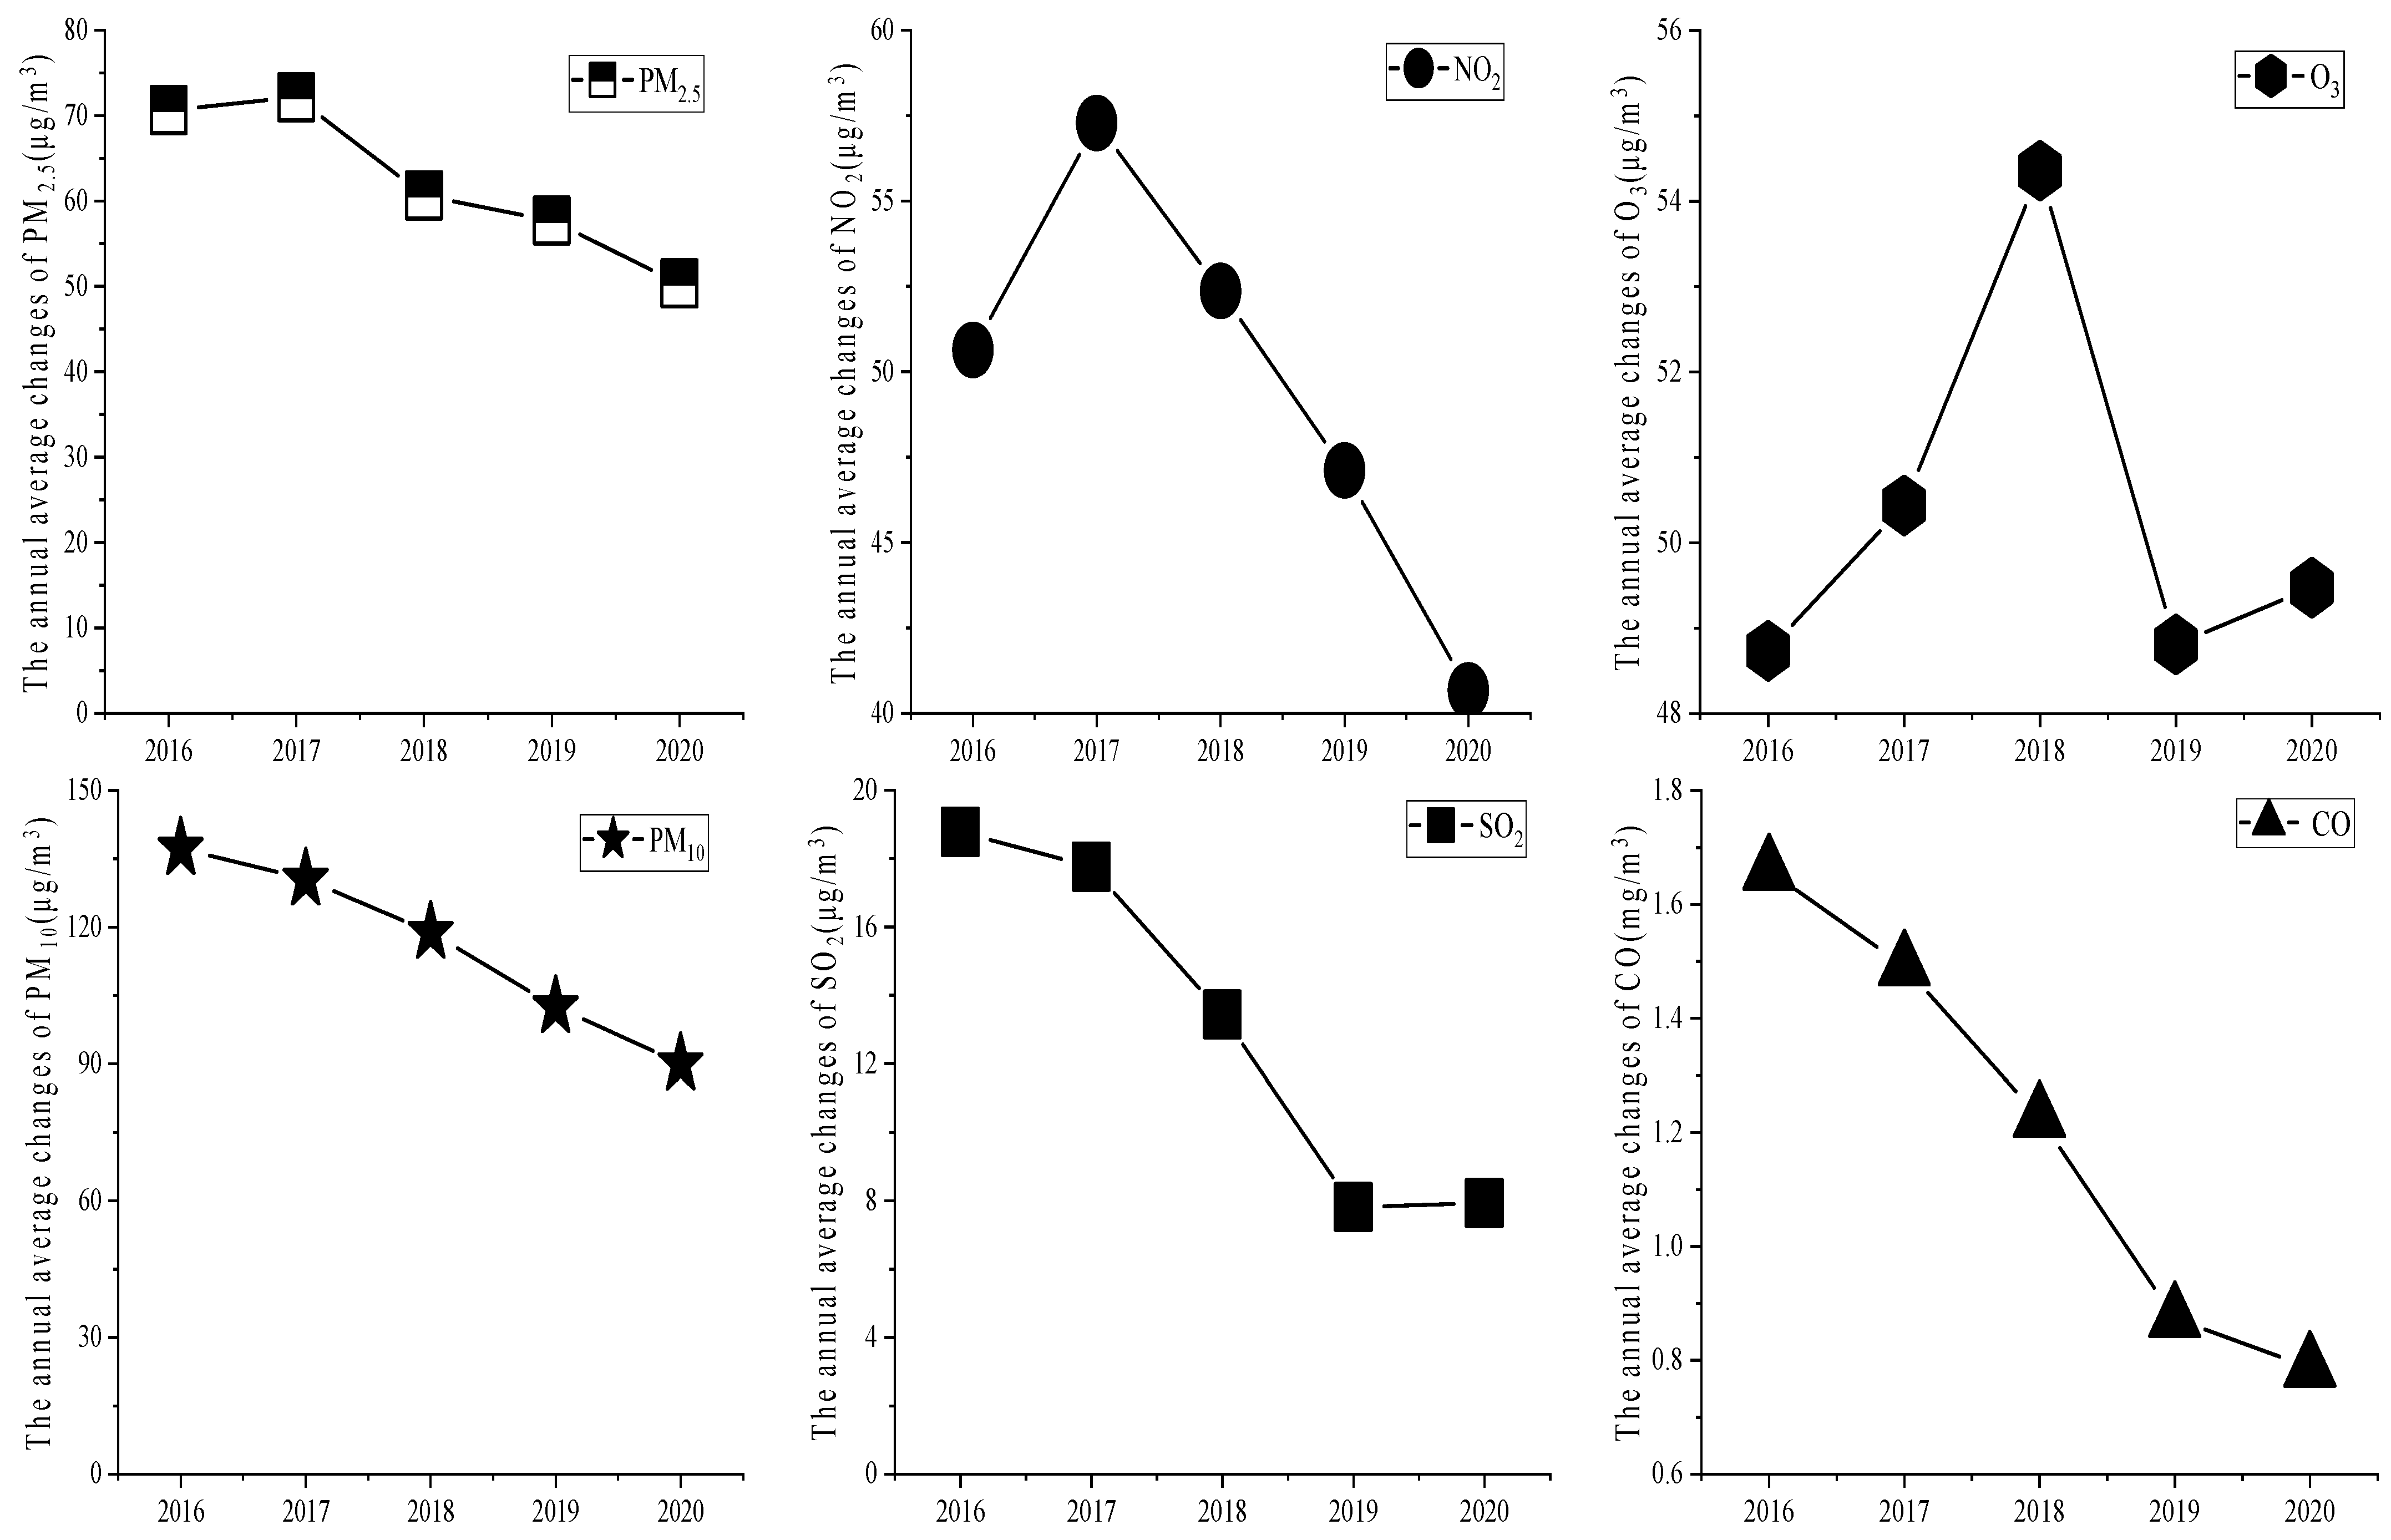
Various gaseous pollutants in the atmosphere are important sources of secondary pollution of particulate matter [33]. Therefore, it is of great significance to study the correlations between the concentrations of particulate matter and other major gas pollutants to effectively control the concentrations of each pollutant. The annual average changes in PM2.5, PM10, CO, SO2, NO2, and O3 in Xi’an from 2016 to 2020 are shown in Figure 6.
Figure 6 shows that all the considered pollutants showed a downward trend in the five years under analysis. The annual average concentrations of NO2 were similar to those of PM2.5, which first increased and then decreased. The annual average concentrations of SO2 and CO showed a trend similar to that of PM10, and both showed a decreasing trend. In contrast, the annual average concentrations of O3 showed a different trend: they first increased, then decreased, and then increased again over time. The annual average concentrations of NO2 decreased by 16.6 μg/m3 from 2016 to 2020; those of SO2 decreased by 11.0 μg/m3; and those of CO decreased by 0.873 mg/m3. Furthermore, the overall annual concentrations of O3 decreased by 5.6 μg/m3. The correlations among pollutants are shown in Table 3.
It can be seen from the table that the average correlation between PM10 and PM2.5 in the five years considered was 0.740, which means that they were highly correlated [22,34]. The average correlation between SO2 and PM2.5 was 0.545, and the average correlation between SO2 and PM10 was 0.464, with both being moderate correlations. The average correlation values between NO2, and PM2.5, PM10, and SO2 were 0.481, 0.448, and 0.512, respectively, which were also moderate correlations. The average correlation values between CO, and PM2.5, PM10, SO2, and NO2 were 0.831, 0.526, 0.600, and 0.456, respectively, indicating that CO was highly correlated with PM2.5 and moderately correlated with the other pollutants. The average correlation values between O3, and PM2.5, PM10, SO2, NO2, and CO were 0.288, 0.204, 0.305, 0.317, and 0.351, respectively, all of which were weak correlations. It can be seen that the concentrations of all pollutants decreased from 2016 to 2020 after the implementation of relevant measures and that the correlations among pollutants also decreased. The results show that the atmospheric environment in Xi’an demonstrated great improvements after the implementation of relevant measures; however, long-term governance management is still needed.
It is practical to establish a multiple linear regression model for estimation. Here, it was calculated according to Formula (1).
Y i = β 0 + β 1 X 1 + β 2 X 2 + + β k X k
where X 1 , X 2 , X k are the average daily concentration values of pollutants, and β 0 , β 1 , β k are the coefficients.
The average data of the daily average concentrations of various pollutants from 2016 to 2020 were used for the analyses, and the collated concentrations of pollutants such as CO, SO2, NO2, and PM10 were substituted into Formula (1) for the calculation. The multiple regression formula of PM2.5 is presented in Formula (2).
Y = 0.265 X 1 + 0.078 X 2 0.078 X 3 + 63.9 X 4 42.7
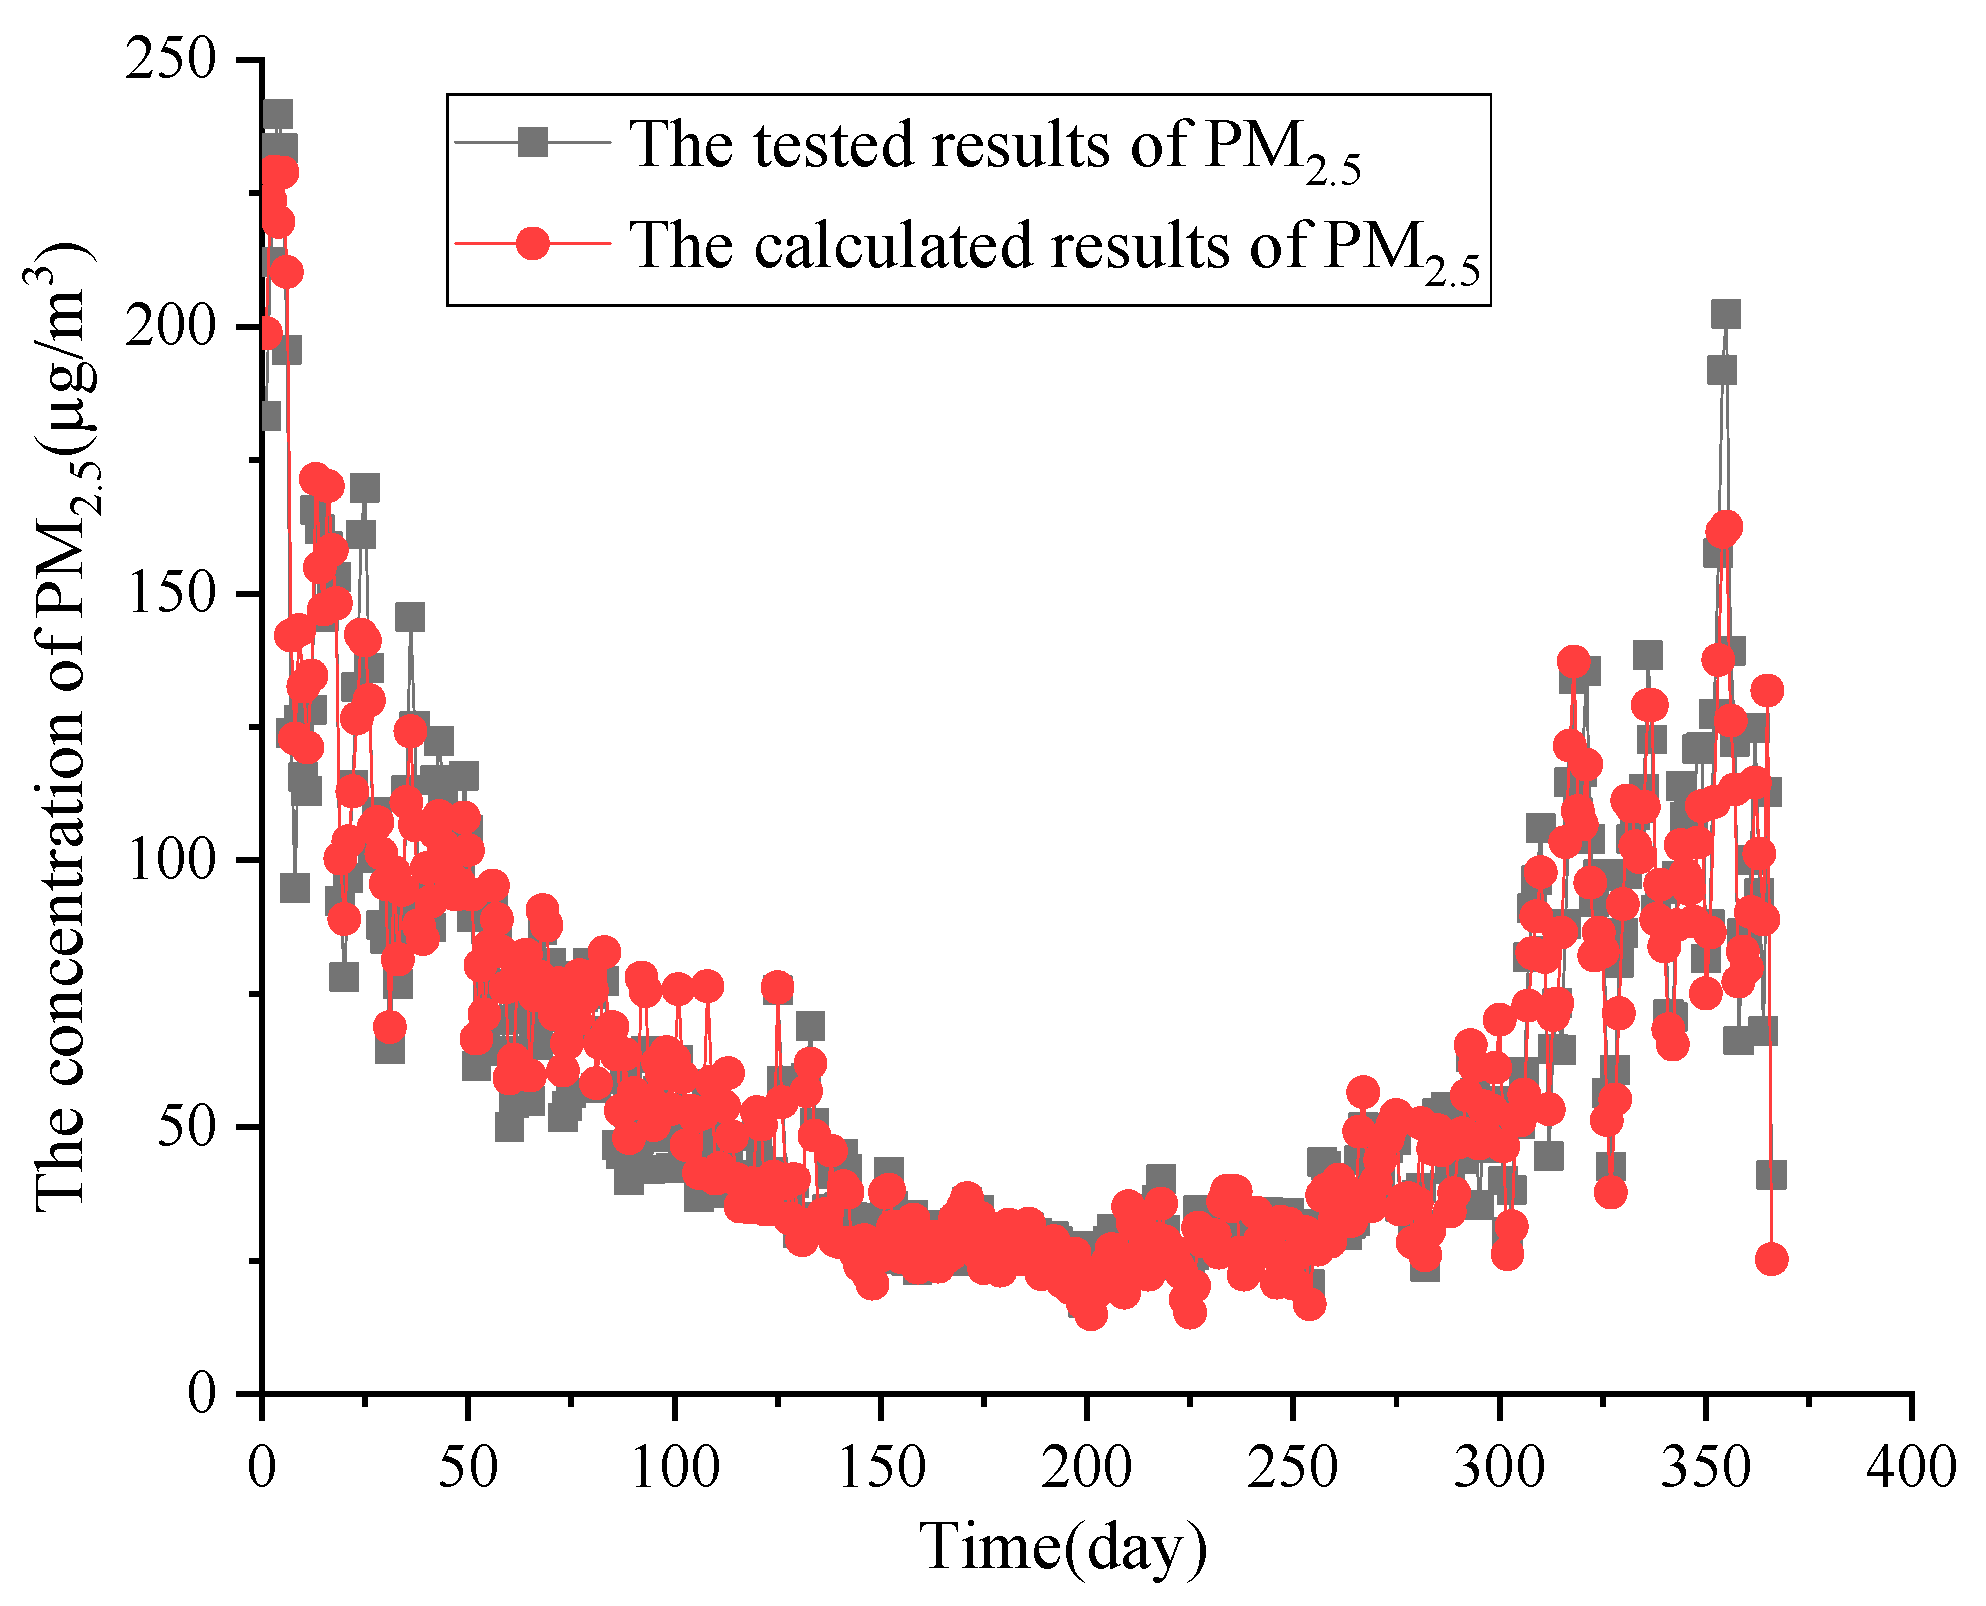
The correlation coefficient (R) was 0.961, and the decision coefficient (R2) was 0.961; the regression equation had an obvious effect. The daily average concentrations of CO, SO2, NO2, and PM10 were substituted into Formula (2). The comparison of the actual PM2.5 data and the calculated results are shown in Figure 7.
The results show that the calculated results and actual data of the daily average concentrations of various pollutants from 2016 to 2020 were in good agreement, with the model showing a good prediction effect. However, there was a large fluctuation between PM2.5 results and data in spring and winter, while the relative consistency between them in summer and autumn was higher. There was a certain deviation in the prediction effect, but overall, it still showed good agreement [23]. Therefore, it was concluded that the daily average concentrations of pollutants in the atmosphere could be effectively predicted and monitored using the multiple linear regression model (Equation (2)). This model is of great significance to understand and analyze the spatio-temporal concentration distribution characteristics and correlations with other pollutants of atmospheric particulate matter as affected by relevant policies employed recently [35].

4. Conclusions

In this paper, the spatial distribution characteristics of the mass and quantity concentrations of particulate matter in the atmosphere, as well as its correlations with other pollutants as affected by relevant policies, were analyzed in depth. As a typical northwest city, Xi’an, China, was selected as the research area; the period considered in this study comprised the years from 2016 to 2020. We drew the following conclusions:
  • The annual average concentrations of PM10 and PM2.5 decreased year by year from 2016 to 2020. The annual concentrations of PM2.5 decreased by 20.3 μg/m3, and the annual concentrations of PM10 decreased by 47.3 μg/m3. The decrease in PM10 concentrations was greater than that in PM2.5. The days with concentrations of PM10 exceeding the standards decreased by 82 days, with a decrease of 66.7%. The days with concentrations of PM2.5 exceeding the standards decreased by 40 days, with a decrease of 35.4%.
  • The concentration values of PM10 and PM2.5 were roughly consistent with the monthly and daily trends. The distribution of PM10 was higher in winter and lower in summer. The distribution of PM2.5 was higher in winter and lower in autumn. The change in monthly concentration was U-shaped, with the lowest being in July and the highest being in December. The changes in daily concentrations showed a double-peak behavior. The highest concentrations of particulate matter appeared at about 8:00~9:00 am and 11:00 pm, and they were greatly affected by human activity.
  • The atmospheric particles in Xi’an were mainly fine particles. The proportion of particles of 0~1.0 μm decreased by 1.94%, and the proportion of particles of 0~2.5 μm decreased by 2.00% from 2016 to 2020. This study shows that the atmospheric environment in Xi’an demonstrated great improvements after relevant measures were implemented. A multivariate linear regression model to calculate the concentrations of pollutants was also established in this paper. This study provides a reference for the comprehensive analysis and control of air pollutants in Xi’an and even worldwide.

Author Contributions

Conceptualization, H.S. and X.Z.; methodology, X.Z. and X.N.; investigation, Y.D., X.N.; data curation, Y.D., J.Y.; writing—original draft preparation, H.S. and X.Z.; writing—review and editing, X.Z. and Y.F. All authors have read and agreed to the published version of the manuscript.

Funding

This research was supported by the National Key R&D Program of China (No. 2016YFC0700503) and the National Natural Science Foundation of China (No. 51808430; No. 51904220) and was supported by the Special Research Project of Shaanxi Provincial Department of Education (17JK0467).

Institutional Review Board Statement

The study did not require ethical approval.

Informed Consent Statement

Not applicable.

Data Availability Statement

The study did not report any data.

Conflicts of Interest

The authors declare no conflict of interest.

References

  1. Tian, Y.L.; Li, X.Y.; Sun, H.T.; Xue, W.H.; Song, J.X. Characteristics of atmospheric pollution and the impacts of environmental management over a megacity, northwestern China. Urban Clim. 2022, 42, 101114. [Google Scholar] [CrossRef]
  2. Chen, Q.; Luo, X.S.; Chen, Y.; Zhao, Z.; Hong, Y.W.; Pang, Y.T.; Huang, W.J.; Wang, Y.; Jin, L. Seasonally varied cytotoxicity of organic components in PM2.5 from urban and industrial areas of a Chinese megacity. Chemosphere 2019, 230, 424–431. [Google Scholar] [CrossRef] [PubMed]
  3. Pozzer, A.; Bacer, S.; De Zolt Sappadina, S.; Predicatori, F.; Caleffi, A. Long-term concentrations of fine particulate matter and impact on human health in Verona, Italy. Atmos. Pollut. Res. 2019, 10, 731–738. [Google Scholar] [CrossRef]
  4. Fan, X.Y.; Gao, J.F.; Pan, K.L.; Li, D.C.; Dai, H.H.; Li, X. More obvious air pollution impacts on variations in bacteria than fungi and their co-occurrences with ammonia-oxidizing microorganisms in PM2.5. Environ Pollut. 2019, 251, 668–680. [Google Scholar] [CrossRef] [PubMed]
  5. Hu, Y.J. Environmental Behavior and Human Inhalation Exposure of Particles and Typical Organic Contaminants in Indoor and Outdoor Air. Ph.D. Thesis, University of Chinese Academy of Sciences, Guangzhou, China, 2018. (In Chinese). [Google Scholar]
  6. Awada, M.; Becerik-Gerber, B.; White, E.; Hoque, S.; O’Neill, Z.; Pedrielli, G.; Wen, J.; Wu, T. Occupant health in buildings: Impact of the COVID-19 pandemic on the opinions of building professionals and implications on research. Built Environ. 2022, 207, 108440. [Google Scholar] [CrossRef] [PubMed]
  7. Zoran, M.A.; Savastru, R.S.; Savastru, D.M.; Tautan, M.N. Assessing the relationship between surface levels of PM2.5 and PM10 particulate matter impact on COVID-19 in Milan, Italy. Sci. Total Environ. 2020, 738, 139825. [Google Scholar] [CrossRef] [PubMed]
  8. IARC. Outdoor Air Pollution a Leading Environmental Cause of Cancer Deaths; Technical Report; International Agency for Research on Cancer: Lyon, France, 2013. [Google Scholar]
  9. Kuklinska, K.; Wolska, L.; Namiesnik, J. Air quality policy in the U.S. and the EU—A review. Atmos Pollut Res. 2015, 6, 129–137. [Google Scholar] [CrossRef]
  10. Xie, H.; Zhao, S.; Cao, G.Q. Comparison on PM2.5 Control Standards at Home and Abroad. Build. Sci. 2014, 30, 37–43. (In Chinese) [Google Scholar]
  11. Ahn, H.; Lee, J.; Hong, A. Urban form and air pollution: Clustering patterns of urban form factors related to particulate matter in Seoul, Korea. Sustain. Cities Soc. 2022, 81, 103859. [Google Scholar] [CrossRef]
  12. Zaib, S.; Lu, J.J.; Bilal, M. Spatio-Temporal Characteristics of Air Quality Index (AQI) over Northwest China. Atmosphere 2022, 13, 375. [Google Scholar] [CrossRef]
  13. Filonchyk, M.; Yan, H.W.; Li, X.J. Temporal and spatial variation of particulate matter and its correlation with other criteria of air pollutants in Lanzhou, China, in spring-summer periods. Atmos. Pollut. Res. 2018, 9, 1100–1110. [Google Scholar] [CrossRef]
  14. Mi, K.; Zhuang, R.L.; Zhang, Z.H.; Gao, J.; Pei, Q. Spatiotemporal characteristics of PM2.5 and its associated gas pollutants, a case in China. Sustain. Cities Soc. 2019, 45, 287–295. [Google Scholar] [CrossRef]
  15. Wang, J.; Li, T.N.; Li, Z.Q.; Fang, C.S. Study on the Spatial and Temporal Distribution Characteristics and Influencing Factors of Particulate Matter Pollution in Coal Production Cities in China. Int. J. Environ. Res. Public Health 2022, 19, 3228. [Google Scholar] [CrossRef] [PubMed]
  16. Karagulian, F.; Barbiere, M.; Kotsev, A.; Spinelle, L.; Gerboles, M.; Lagler, F.; Redon, N.; Crunaire, S.; Borowiak, A. Review of the performance of low-cost sensors for air quality monitoring. Atmosphere 2019, 10, 506. [Google Scholar] [CrossRef] [Green Version]
  17. Baldelli, A. Evaluation of a low-cost multi-channel monitor for indoor air quality through a novel, low-cost, and reproducible platform. Meas. Sens. 2021, 17, 100059. [Google Scholar] [CrossRef]
  18. Liu, J.H.; Chen, Y.F.; Lin, T.S.; Lai, D.W.; Wen, T.H.; Sun, C.H.; Juang, J.Y.; Jiang, J.A. Developed Urban Air Quality Monitoring System Based on Wireless Sensor Networks. In Proceedings of the 2011 Fifth International Conference on Sensing Technology, Palmerston North, New Zealand, 28 November–1 December 2011. [Google Scholar]
  19. Li, Z.Y.; Wang, Y.; Xu, Z.L.; Cao, Y. Characteristics and sources of atmospheric pollutants in typical inland cities in arid regions of central Asia: A case study of Urumqi city. PLoS ONE 2021, 16, e0249563. [Google Scholar] [CrossRef]
  20. Zhou, F.R.; Yang, J.R.; Wen, G.; Ma, Y.; Pan, H.; Geng, H.; Cao, J.; Zhao, M.; Xu, C. Estimating spatio-temporal variability of aerosol pollution in Yunnan Province, China. Atmos. Pollut. Res. 2022, 13, 101450. [Google Scholar] [CrossRef]
  21. Zhang, L.C.; An, J.; Liu, M.Y.; Li, Z.W.; Liu, Y.; Tiao, L.X.; Liu, X.T.; Zhang, F.; Zheng, D.Q.; Gao, Q.; et al. Spatiotemporal variations and influencing factors of PM2.5 concentrations in Beijing, China. Environ. Pollut. 2020, 262, 114276. [Google Scholar] [CrossRef]
  22. Zhang, X.; Fan, Y.S.; Yu, W.Q.; Wang, H.; Zhang, X.L. Variation of Particulate Matter and Its Correlation with Other Air Pollutants in Xi`an, China. Pol. J. Environ. Stud. 2021, 30, 3357–3364. [Google Scholar] [CrossRef]
  23. Zhang, X.; Fan, Y.S.; Wei, S.X.; Wang, H.; Zhang, J.X. Spatiotemporal Distribution of PM2.5 and Its Correlation with Other Air Pollutants in Winter During 2016~2018 in Xi’an, China. Pol. J. Environ. Stud. 2021, 30, 1457–1464. [Google Scholar] [CrossRef]
  24. Zhang, H.L.; Hao, Q.L.; Li, G.L. Analysis of Pollution Concentration of Particulate Matter after Adjusting Heating Measures in Xi’an. Build. Energy Environ. 2020, 39, 54–57. (In Chinese) [Google Scholar]
  25. GB 3095-2012; Ambient Air Quality Standards. China Environmental Science Press: Beijing, China, 2012.
  26. HJ633-2012; Technical Regulation on Ambient Air Quality Index (on Trial). China Environmental Science Press: Beijing, China, 2012.
  27. HJ633-2013; Technical Regulation for Ambient Air Quality assessment (on Trial). China Environmental Science Press: Beijing, China, 2013.
  28. Zhu, C.L.; Li, X.Q.; Li, F.Y. Analysis on variation trends and related features of concentration of main air pollution in Xi’an. Environ. Eng. 2017, 35, 104–109. (In Chinese) [Google Scholar]
  29. Dai, H.B.; Huang, G.Q.; Wang, J.J.; Zeng, H.B.; Zhou, F.Y. Spatio-Temporal Characteristics of PM2.5 Concentrations in China Based on Multiple Sources of Data and LUR-GBM during 2016–2021. Int. J. Environ. Res. Public Health 2022, 19, 6292. [Google Scholar] [CrossRef] [PubMed]
  30. Zhang, X.; Fan, Y.S.; Tian, G.J.; Wang, H.; Zhang, H.L.; Xie, W. Influence of Fiber Diameter on Filtration Performance of Polyester Fibers. Therm Sci. 2019, 23, 2291–2296. [Google Scholar] [CrossRef]
  31. Azimi, P.; Zhao, D.; Stephens, B. Estimates of HVAC filtration efficiency for fine and ultrafine particles of outdoor origin. Atmos. Environ. 2014, 98, 337–346. [Google Scholar] [CrossRef]
  32. Liu, L.; Liu, Y.S.; Wen, W.; Liang, L.L.; Ma, X.; Jiao, J.; Guo, K. Source Identification of Trace Elements in PM2.5 at a Rural Site in the North China Plain. Atmosphere 2020, 11, 179. [Google Scholar] [CrossRef] [Green Version]
  33. Adams, S.; Acheampong, A.O. Reducing carbon emissions: The role of renewable energy and democracy. J. Clean. Prod. 2019, 240, 118245. [Google Scholar] [CrossRef]
  34. Bujang, M.A.; Baharum, N. A simplified guide to determination of sample size requirements for estimating the value of intraclass correlation coefficient: A review. Arch. Orofac. Sci. 2017, 12, 1–11. [Google Scholar]
  35. Fontes, T.; Li, P.; Barros, N.; Zhao, P. Trends of PM2.5 concentrations in China: A long term approach. J. Environ. Manag. 2017, 196, 719–732. [Google Scholar] [CrossRef]
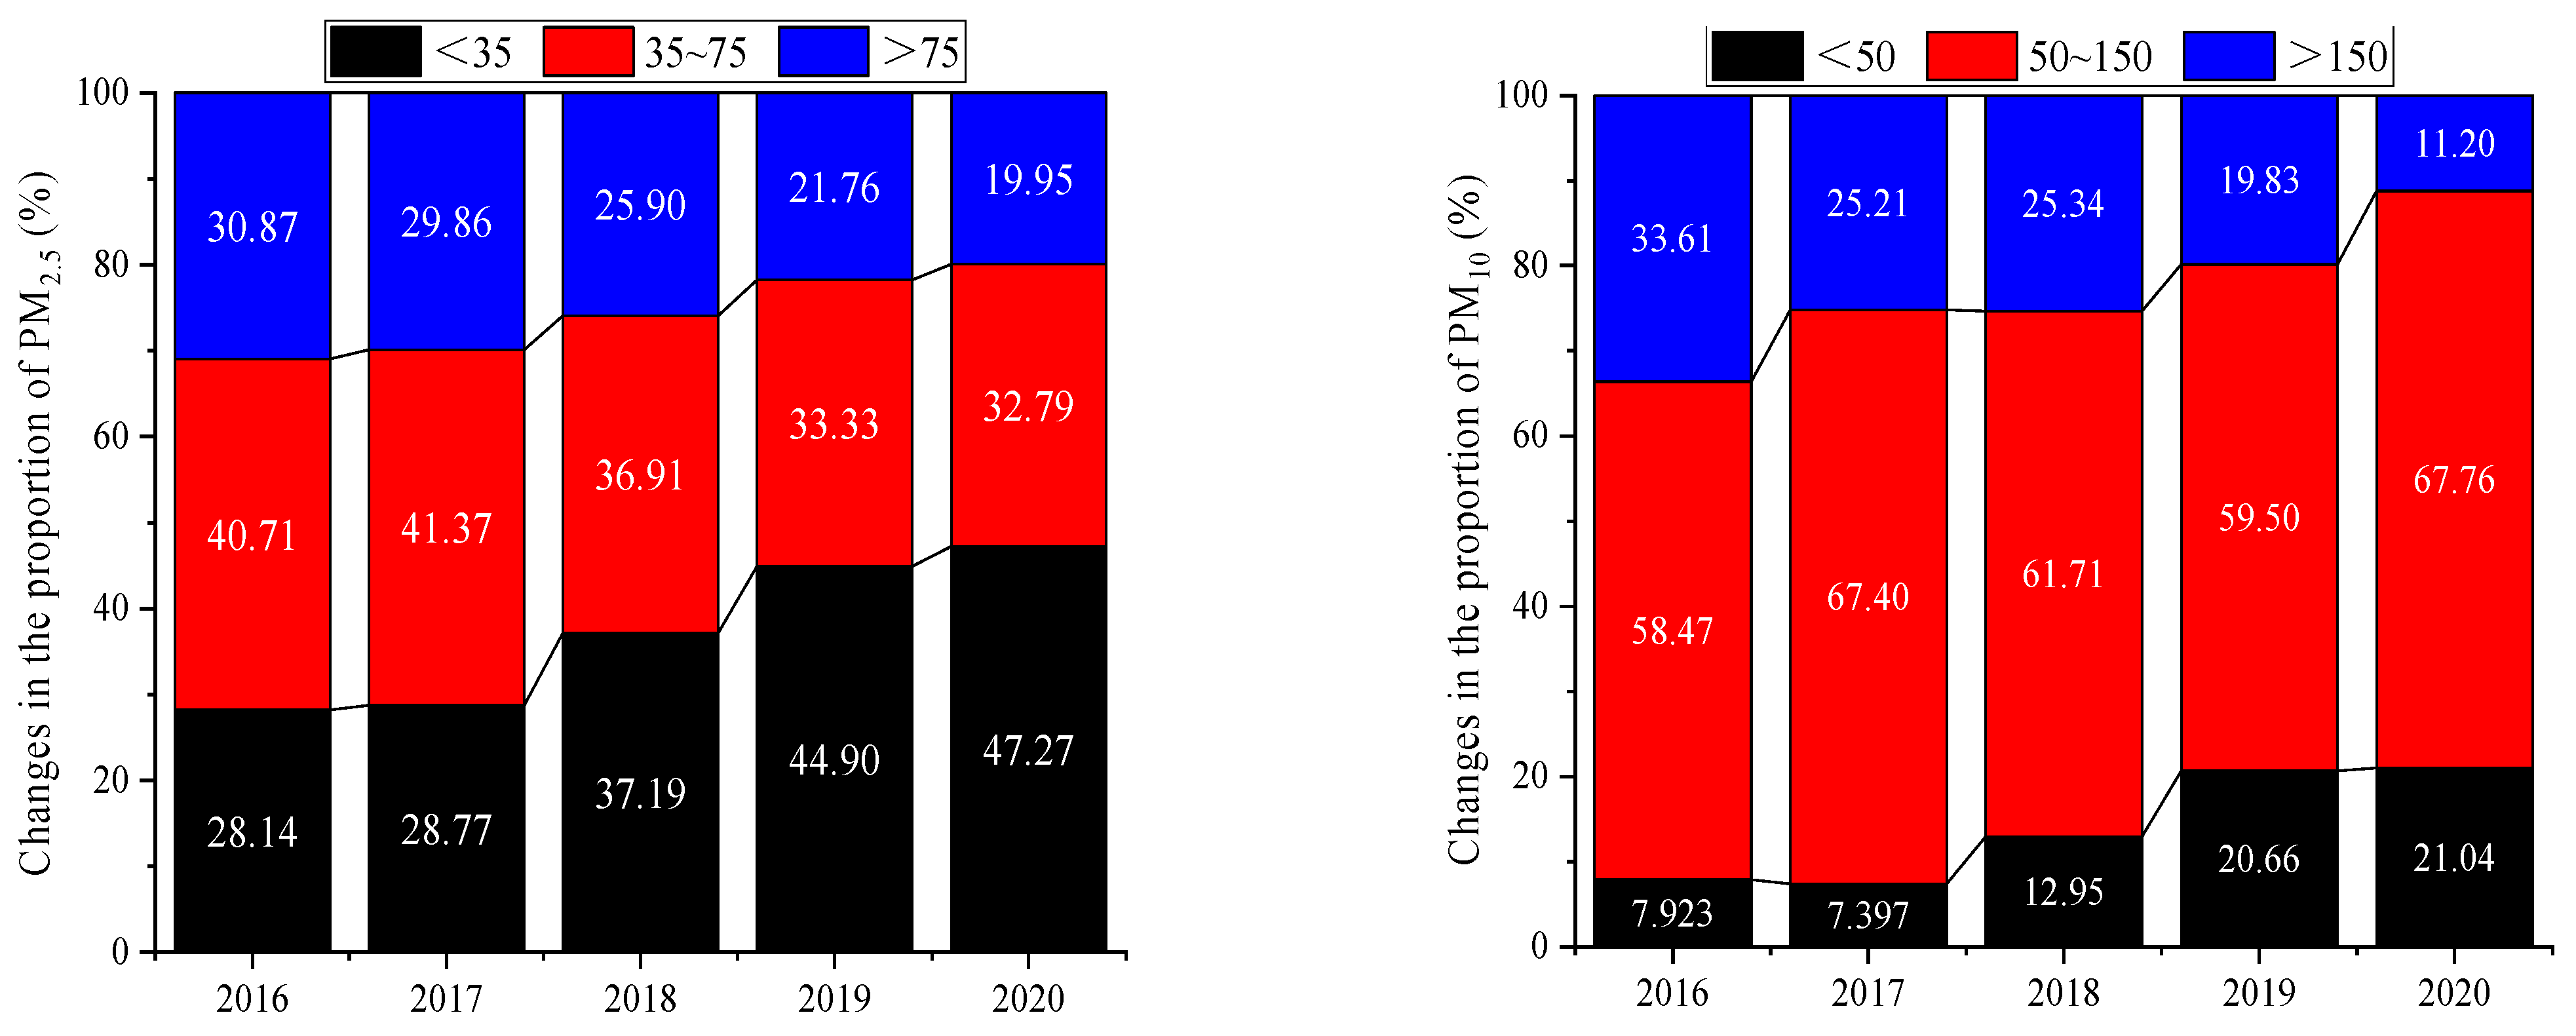
Figure 1. Changes in PM2.5 and PM10 concentrations from 2016 to 2020.
Ijerph 20 01051 g001
Figure 2. Seasonal changes in PM2.5 and PM10 concentrations from 2016 to 2020.
Ijerph 20 01051 g002
Figure 3. Monthly changes in PM2.5 and PM10 concentrations from 2016 to 2020.
Ijerph 20 01051 g003
Figure 4. Daily changes in PM2.5 and PM10 concentrations from 2016 to 2020.
Ijerph 20 01051 g004
Figure 5. Distributions of outdoor atmospheric particle sizes (average temperature of 19.9 °C~25.5 °C; average humidity of 38.9~50.9%).
Ijerph 20 01051 g005aIjerph 20 01051 g005b
Figure 6. Trends of annual average changes in quantities of various pollutants.
Ijerph 20 01051 g006
Figure 7. Comparison of calculated results and actual data of PM2.5.
Ijerph 20 01051 g007
Table 1. Parameter statistics of PM10 and PM2.5 from 2016 to 2020.
ContentYearAverage (μg/m3)Max (μg/m3)Min (μg/m3)Number of Samples (Days)Days with Concentrations Exceeding the Standards (Days)Average Exceeding Concentration (μg/m3)Percentage of Days with Concentrations Exceeding the Standards (%)
PM10
(μg/m3)
2016137.350124366123238.833.6
2017130.55911736592255.425.2
2018118.95682036392229.525.3
2019102.55761036372212.519.8
202090.0 2971636641190.0 11.2
PM2.5
(μg/m3)
201670.643411366113139.330.9
201772.14908365109147.429.9
201860.7292936394129.125.9
201957.7292536379141.221.8
202050.3225636673118.119.9
Table 2. Statistics of PM10 and PM2.5 on typical days from 2016 to 2020.
ContentDateQuality LevelDaily Concentration (μg/m3)Concentration Range (μg/m3)WeatherWind DirectionWind Level
PM2.5
(μg/m3)
20 December 2016Heavily polluted434415–455HazyNortheasterly1–2
5 January 2017Heavily polluted490398–558DrizzlyEast wind1–2
15 January 2018Heavily polluted292245–345FoggySouthwesterly2
6 January 2019Heavily polluted292271–320HazyNorth wind1–2
25 January 2020Heavily polluted225188–253DrizzlyEast wind3–4
PM10
(μg/m3)
20 December 2016Heavily polluted501470–528HazyNortheasterly1–2
5 January 2017Heavily polluted591483–663DrizzlyEast wind1–2
3 December 2018Heavily polluted568386–864HazySouthwesterly1–2
12 May 2019Heavily polluted57657–1624GloomyNorthwesterly3–4
26 March 2020Moderately polluted29729–1221CloudyNorthwesterly3–4
Table 3. Correlations among air pollutants in the atmosphere from 2016 to 2020.
YearPollutantPollutant
PM2.5PM10SO2NO2COO3
2016PM2.51
PM100.7991
SO20.5090.5471
NO20.5620.5520.4611
CO0.7090.6770.7460.541
O30.390.3270.4140.3080.5041
2017PM2.51
PM100.8111
SO20.6220.511
NO20.5780.4370.6151
CO0.9030.6460.6920.5561
O30.2610.20.320.3260.371
2018PM2.51
PM100.6941
SO20.6640.4331
NO20.5740.3940.571
CO0.8540.4320.7020.571
O30.2680.1670.2210.3420.2711
2019PM2.51
PM100.7741
SO20.420.3461
NO20.4250.3860.5231
CO0.8420.4810.4590.3991
O30.3110.1960.4040.3730.3371
2020PM2.51
PM100.6221
SO20.5090.4861
NO20.2650.470.3951
CO0.8470.3960.4010.2151
O30.210 0.1290.1680.2350.2741
Disclaimer/Publisher’s Note: The statements, opinions and data contained in all publications are solely those of the individual author(s) and contributor(s) and not of MDPI and/or the editor(s). MDPI and/or the editor(s) disclaim responsibility for any injury to people or property resulting from any ideas, methods, instructions or products referred to in the content.