
Effects of the COVID-19 Pandemic on Legionella Water Management Program Performance across a United States Lodging Organization

 , , , , and
Abstract
:1. Introduction
2. Materials and Methods
3. Results
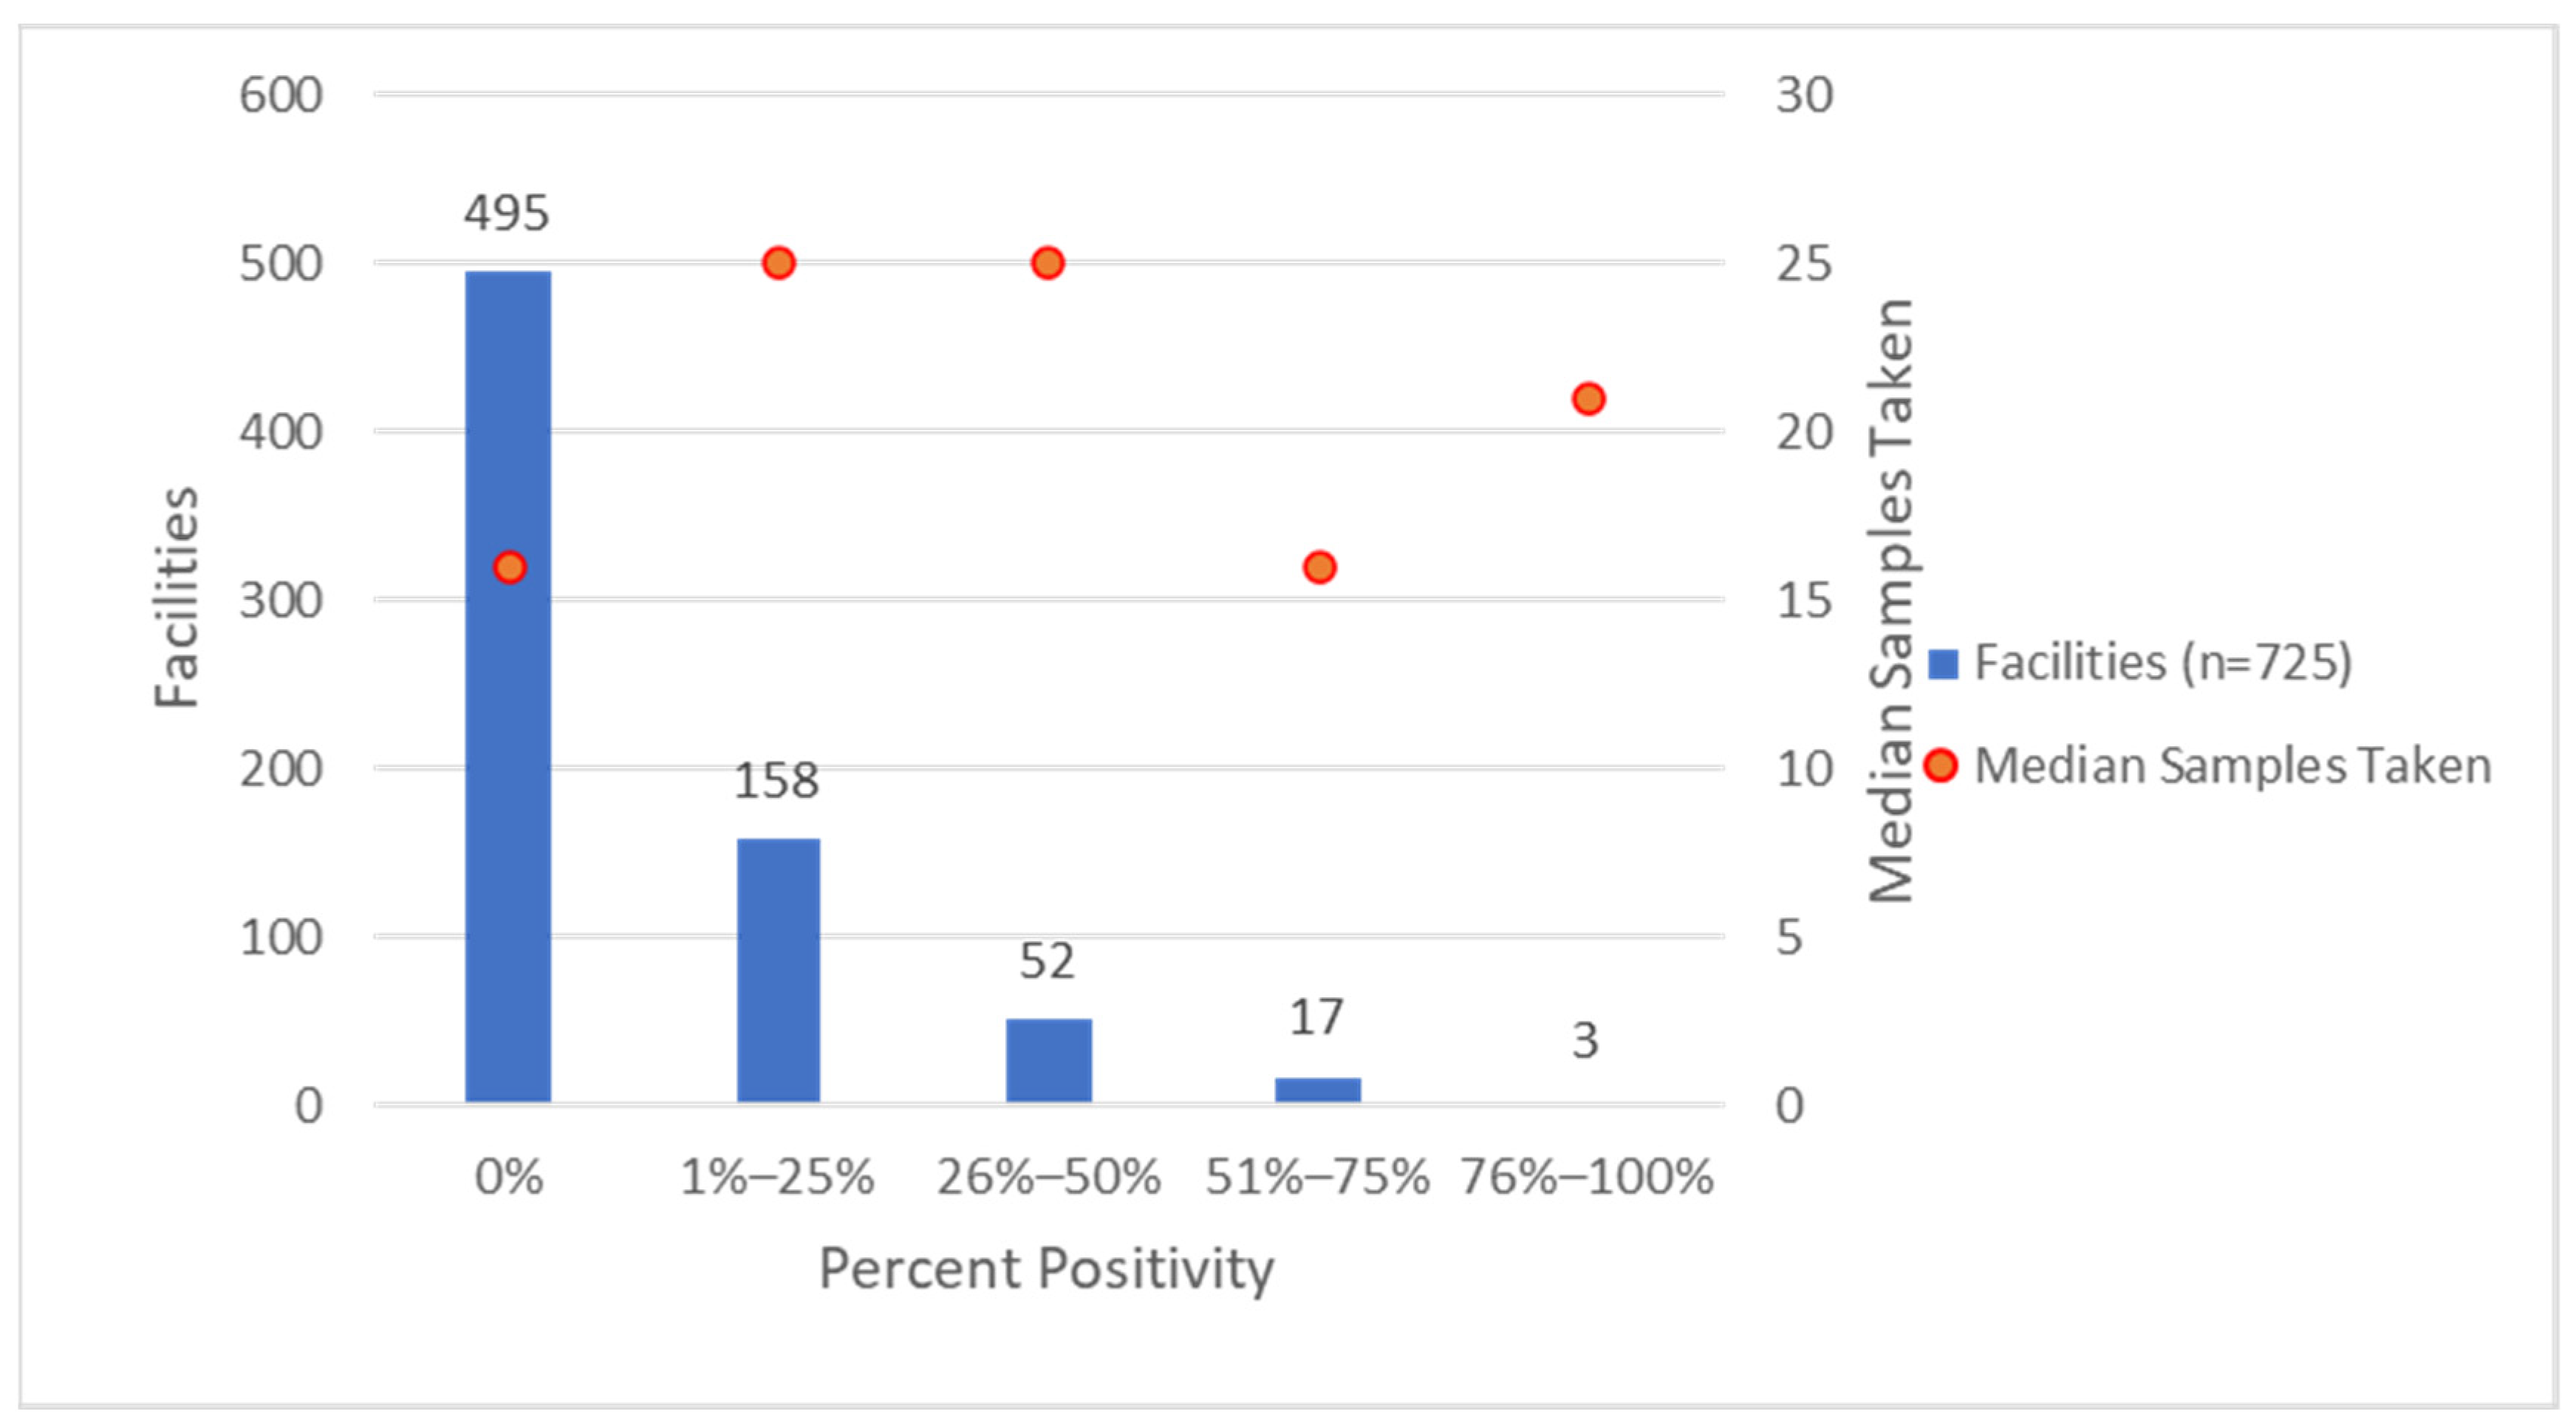
3.1. Environmental Sampling for Legionella
3.2. Pandemic Association with Environmental Sampling for Legionella and Positivity
3.3. Facilities with Persistent Legionella Detections
3.4. Seasonal Environmental Sample Legionella Positivity Patterns
3.5. Chlorine Levels in the Facilities’ Water Systems and Temperature of Facilities’ Hot-Water Systems
4. Discussion
4.1. Pandemic Impacts on Sample Positivity and Flushing Effectiveness
4.2. Water Management Program Considerations
5. Conclusions
Supplementary Materials
Author Contributions
Funding
Institutional Review Board Statement
Informed Consent Statement
Data Availability Statement
Acknowledgments
Conflicts of Interest
References
- Fields, B.S.; Benson, R.F.; Besser, R.E. Legionella and Legionnaires’ disease: 25 years of investigation. Clin. Microbiol. Rev. 2002, 15, 506–526. [Google Scholar] [CrossRef] [PubMed]
- Dooling, K.L.; Toews, K.A.; Hicks, L.A.; Garrison, L.E.; Bachaus, B.; Zansky, S.; Carpenter, L.R.; Schaffner, B.; Parker, E.; Petit, S.; et al. Active Bacterial Core Surveillance for Legionellosis—United States, 2011–2013. MMWR Morb. Mortal. Wkly. Rep. 2015, 64, 1190–1193. [Google Scholar] [CrossRef] [PubMed]
- Centers for Disease Control and Prevention. Legionnaires’ Disease Surveillance Summary Report, 2018–2019; National Center for Immunization and Respiratory Diseases: Atlanta, GA, USA, 2022. Available online: https://www.cdc.gov/legionella/health-depts/surv-reporting/surveillance-reports.html (accessed on 6 September 2023).
- Centers for Disease Control and Prevention. National Notifiable Infectious Diseases and Conditions Data Tables, National Notifiable Diseases Surveillance System, 2019 Annual Tables of Infectious Disease Data; CDC Division of Health Informatics and Surveillance: Atlanta, GA, USA, 2019. Available online: https://wonder.cdc.gov/nndss/static/2019/annual/2019-table2i.html (accessed on 1 November 2021).
- Collier, S.A.; Deng, L.; Adam, E.A.; Benedict, K.M.; Beshearse, E.M.; Blackstock, A.J.; Bruce, B.B.; Derado, G.; Edens, C.; Fullerton, K.E.; et al. Estimate of Burden and Direct Healthcare Cost of Infectious Waterborne Disease in the United States. Emerg. Infect. Dis. 2021, 27, 140–149. [Google Scholar] [CrossRef] [PubMed]
- Mudali, G.; Kilgore, P.E.; Salim, A.; McElmurry, S.P.; Zervos, M. Trends in Legionnaires’ Disease-Associated Hospitalizations, United States, 2006-2010. Open Forum Infect. Dis. 2020, 7, ofaa296. [Google Scholar] [CrossRef] [PubMed]
- Garrison, L.E.; Kunz, J.M.; Cooley, L.A.; Moore, M.R.; Lucas, C.; Schrag, S.; Sarisky, J.; Whitney, C.G. Vital Signs: Deficiencies in Environmental Control Identified in Outbreaks of Legionnaires’ Disease—North America, 2000–2014. MMWR Morb. Mortal. Wkly. Rep. 2016, 65, 576–584. [Google Scholar] [CrossRef] [PubMed]
- Mercante, J.W.; Winchell, J.M. Current and emerging Legionella diagnostics for laboratory and outbreak investigations. Clin. Microbiol. Rev. 2015, 28, 95–133. [Google Scholar] [CrossRef] [PubMed]
- Centers for Disease Control and Prevention. Developing a Water Management Program to Reduce Legionella Growth & Spread in Buildings: A Practical Guide to Implementing Industry Standards; National Center for Environmental Health: Atlanta, GA, USA, 2017. Available online: https://www.cdc.gov/legionella/downloads/toolkit.pdf (accessed on 1 November 2021).
- ASHRAE. Legionellosis: Risk Management for Building Water Systems, ANSI/ASHRAE Standard 188-2018; ASHRAE: Atlanta, GA, USA, 2018; Available online: https://www.ashrae.org/File%20Library/Technical%20Resources/Bookstore/86611_188-2018preview.pdf (accessed on 1 November 2021).
- Molina, J.J.; Bennassar, M.; Palacio, E.; Crespi, S. Impact of prolonged hotel closures during the COVID-19 pandemic on Legionella infection risks. Front Microbiol. 2023, 14, 1136668. [Google Scholar] [CrossRef] [PubMed]
- STR. STR: 2020 Officially the Worst Year on Record for U.S. Hotels; STR: Hendersonville, TN, USA, 2021; Available online: https://str.com/press-release/str-2020-officially-worst-year-on-record-for-us-hotels (accessed on 1 November 2021).
- American Water Works Association. The Financial Impact on U.S. Drinking Water Utilities; American Water Works Association: Denver, CO, USA, 2020; Available online: https://www.awwa.org/Portals/0/AWWA/Communications/AWWA-AMWA-COVID-Report_2020-04.pdf (accessed on 1 November 2021).
- Aw, T.G.; Scott, L.; Jordan, K.; Kyungyeon, R.; Ley, C.; Whelton, A.J. Prevalence of opportunistic pathogens in a school building plumbing during periods of low water use and a transition to normal use. Int. J. Hyg. Environ. Health 2022, 241, 113945. [Google Scholar] [CrossRef] [PubMed]
- Nisar, M.A.; Ross, K.E.; Brown, M.H.; Bentham, R.; Whiley, H. Water Stagnation and Flow Obstruction Reduces the Quality of Potable Water and Increases the Risk of Legionelloses. Front. Environ. Sci. 2020, 8, 611611. [Google Scholar] [CrossRef]
- Environmental Protection Agency. Maintaining or Restoring Water Quality in Buildings with Low or No Use; Environmental Protection Agency: Washington, DC, USA, 2020. Available online: https://www.epa.gov/sites/default/files/2020-05/documents/final_maintaining_building_water_quality_5.6.20-v2.pdf (accessed on 1 November 2021).
- Vosloo, S.; Huo, L.; Chauhan, U.; Cotto, I.; Gincley, B.; Vilardi, K.J.; Yoon, B.; Bian, K.; Gabrielli, M.; Pieper, K.J.; et al. Gradual Recovery of Building Plumbing-Associated Microbial Communities after Extended Periods of Altered Water Demand during the COVID-19 Pandemic. Environ. Sci. Technol. 2023, 57, 3248–3259. [Google Scholar] [CrossRef] [PubMed]
- Centers for Disease Control and Prevention. Guidance for Reopening Buildings After Prolonged Shutdown or Reduced Operation; National Center for Environmental Health: Atlanta, GA, USA, 2020. Available online: https://www.cdc.gov/nceh/ehs/water/legionella/building-water-system.html (accessed on 1 November 2021).
- American Water Works Association. Responding to Water Stagnation in Buildings with Reduced or No Water Use; American Water Works Association: Denver, CO, USA, 2020; Available online: https://www.awwa.org/Portals/0/AWWA/Government/20201001FrameworkforBuildingManagersFINALDistCopy.pdf (accessed on 1 November 2021).
- Proctor, C.R.; Rhoads, W.J.; Keane, T.; Salehi, M.; Hamilton, K.; Pieper, K.J.; Cwiertny, D.M.; Prévost, M.; Whelton, A.J. Considerations for Large Building Water Quality after Extended Stagnation. AWWA Water Sci. 2020, 2, e1186. [Google Scholar] [CrossRef] [PubMed]
- Lucas, C.E.; Taylor, T.H., Jr.; Fields, B.S. Accuracy and precision of Legionella isolation by US laboratories in the ELITE program pilot study. Water Res. 2011, 45, 4428–4436. [Google Scholar] [CrossRef] [PubMed]
- National Academy of Science Engineering and Medicine. Management of Legionella in Water Systems; The National Academies Press: Washington, DC, USA, 2020; Available online: https://www.nap.edu/catalog/25474/management-of-legionella-in-water-systems (accessed on 1 November 2021).
- Centers for Disease Control and Prevention. Toolkit for Controlling Legionella in Common Sources of Exposure (Legionella Control Toolkit); National Center for Environmental Health: Atlanta, GA, USA, 2021. Available online: https://www.cdc.gov/legionella/downloads/Control-Toolkit-All-Modules.pdf (accessed on 1 November 2021).
- Gamage, S.D.; Jinadatha, C.; Coppin, J.D.; Kralovic, S.M.; Bender, A.; Ambrose, M.; Decker, B.K.; DeVries, A.S.; Goto, M.; Kowalskyj, O.; et al. Factors That Affect Legionella Positivity in Healthcare Building Water Systems from a Large, National Environmental Surveillance Initiative. Environ. Sci. Technol. 2022, 56, 11363–11373. [Google Scholar] [CrossRef] [PubMed]
- ASHRAE. Managing the Risk of Legionellosis Associated with Building Water Systems; ANSI/ASHRAE Guideline 12-2020; ASHRAE: Atlanta, GA, USA, 2020. [Google Scholar]

| Facilities with | Hot Water (n = 722) | Cold Water (n = 715) | Both (n = 725) |
|---|---|---|---|
| Any SG1 or non-SG1 detections 1 | 201 (28%) | 143 (20%) | 230 (32%) |
| Any SG1 detections | 65 (9%) | 45 (6%) | 85 (12%) |
| Any non-SG1 detections | 178 (25%) | 122 (17%) | 209 (29%) |
| Any SG1 and non-SG1 detections | 42 (6%) | 24 (3%) | 64 (9%) |
| Average Number of Samples Tested by Facility | 24.45 | Median Number of Samples Tested by Facility | 18 |
| Standard Error | 0.79 | Range of samples tested by facility | 3–254 |
| Standard Deviation | 21.38 | Sum of samples tested | 17729 |
| Effects | Risk Ratio (95% CI) | p-Value | Risk Ratio (95% adj.1 CI) | adj.1 p-Value |
|---|---|---|---|---|
| COVID (p < 0.001) | ||||
| Before COVID (3 January 2018–30 January 2020) | ref | -- | ||
| During COVID (1 February 2020–17 November 2020) | 2.06 (1.47, 2.89) | <0.001 | ||
| Water pipe (p < 0.001) | ||||
| Hot-water pipe | 1.93 (1.38, 2.68) | <0.001 | ||
| Cold-water pipe | ref | -- | ||
| Season (p = 0.481) | ||||
| Cold seasons (11/1–4/30) | 1.21 (0.71, 2.05) | 0.481 | ||
| Warm seasons (5/1–10/31) | ref | -- | ||
| COVID × Water pipe (p = 0.014) | ||||
| During-pandemic-hot-water pipe | 3.98 (1.84, 8.61) | <0.001 | ||
| During-pandemic-cold-water pipe | 3.12 (1.38, 7.06) | 0.002 | ||
| Before-pandemic-hot-water pipe | 2.91 (1.36, 6.23) | 0.002 | ||
| Before-pandemic-cold-water pipe | ref | -- | ||
| During-pandemic-hot-water pipe | 1.36 (0.17, 2.23) | 0.365 | ||
| During-pandemic-cold-water pipe | 1.07 (0.61, 1.88) | 0.990 | ||
| Before-pandemic-hot-water pipe | ref | -- | ||
| During-pandemic-hot-water pipe | 1.27 (0.73, 2.22) | 0.682 | ||
| During-pandemic-cold-water pipe | ref | -- |
| Effects | Risk Ratio (95% CI) | p-Value | Risk Ratio (95% adj.1 CI) | adj.1 p-Value |
|---|---|---|---|---|
| COVID (p < 0.001) | ||||
| Before COVID (3 January 2018–30 January 2020) | ref | -- | ||
| During COVID (1 February 2020–17 November 2020) | 2.12 (1.74, 2.59) | <0.001 | ||
| Water pipe (p < 0.001) | ||||
| Hot-water pipe | 1.59 (1.31, 1.93) | <0.001 | ||
| Cold-water pipe | ref | -- | ||
| Season (p = 0.373) | ||||
| Cold seasons (11/1–4/30) | 1.17 (0.83, 1.65) | 0.373 | ||
| Warm seasons (5/1–10/31) | ref | -- | ||
| COVID × Water pipe (p = 0.013) | ||||
| During-pandemic-hot-water pipe | 3.38 (2.19, 5.21) | <0.001 | ||
| During-pandemic-cold-water pipe | 2.72 (1.72, 4.29) | <0.001 | ||
| Before-pandemic-hot-water pipe | 2.04 (1.33, 3.13) | <0.001 | ||
| Before-pandemic-cold-water pipe | ref | -- | ||
| During-pandemic-hot-water pipe | 1.66 (1.20, 2.30) | <0.001 | ||
| During-pandemic-cold-water pipe | 1.33 (0.93, 1.91) | 0.169 | ||
| Before-pandemic-hot-water pipe | ref | -- | ||
| During-pandemic-hot-water pipe | 1.24 (0.87, 1.77) | 0.391 | ||
| During-pandemic-cold-water pipe | ref | -- |
| Water System 2 | Measurement Type | Control Limit | Total Measurements | Average Measurements per Month 3 | Measurements Below Control Limit | |||
|---|---|---|---|---|---|---|---|---|
| Before Pandemic | During Pandemic | Before Pandemic | During Pandemic | Before Pandemic | During Pandemic | |||
| Hot Water | Free Chlorine | <0.4 mg/L | 17,539 | 6050 | 702 | 550 | 8269 (47%) | 2908 (48%) |
| Total Chlorine | <1.0 mg/L | 17,393 | 6054 | 696 | 550 | 10,658 (61%) | 3887 (64%) | |
| Cold Water | Free Chlorine | <0.5 mg/L | 17,047 | 5964 | 682 | 542 | 7211 (42%) | 2508 (42%) |
| Total Chlorine | <1.0 mg/L | 16,923 | 5911 | 677 | 537 | 4814 (28%) | 1599 (27%) | |
| Sample Location | Measurement Type | Lower Control Limit | Total Measurements | Average Measurements Per Month | Measurements Below Control Limit | |||
|---|---|---|---|---|---|---|---|---|
| Before Pandemic | During Pandemic | Before Pandemic | During Pandemic | Before Pandemic | During Pandemic | |||
| Supply | TMV | <124°F | 9827 | 1926 | 393 | 175 | 344 (4%) | 64 (3%) |
| No TMV | <124°F | 32,066 | 5189 | 1283 | 471 | 1389 (4%) | 237 (5%) | |
| Return | TMV | <118°F | 10,099 | 1940 | 404 | 176 | 409 (4%) | 64 (3%) |
| No TMV | <118°F | 32,247 | 5242 | 1290 | 477 | 2077 (6%) | 231 (4%) | |
Disclaimer/Publisher’s Note: The statements, opinions and data contained in all publications are solely those of the individual author(s) and contributor(s) and not of MDPI and/or the editor(s). MDPI and/or the editor(s) disclaim responsibility for any injury to people or property resulting from any ideas, methods, instructions or products referred to in the content. |
© 2023 by the authors. Licensee MDPI, Basel, Switzerland. This article is an open access article distributed under the terms and conditions of the Creative Commons Attribution (CC BY) license (https://creativecommons.org/licenses/by/4.0/).
Share and Cite
Kunz, J.M.; Hannapel, E.; Vander Kelen, P.; Hils, J.; Hoover, E.R.; Edens, C. Effects of the COVID-19 Pandemic on Legionella Water Management Program Performance across a United States Lodging Organization. Int. J. Environ. Res. Public Health 2023, 20, 6885. https://doi.org/10.3390/ijerph20196885
Kunz JM, Hannapel E, Vander Kelen P, Hils J, Hoover ER, Edens C. Effects of the COVID-19 Pandemic on Legionella Water Management Program Performance across a United States Lodging Organization. International Journal of Environmental Research and Public Health. 2023; 20(19):6885. https://doi.org/10.3390/ijerph20196885
Chicago/Turabian StyleKunz, Jasen M., Elizabeth Hannapel, Patrick Vander Kelen, Janie Hils, Edward Rickamer Hoover, and Chris Edens. 2023. "Effects of the COVID-19 Pandemic on Legionella Water Management Program Performance across a United States Lodging Organization" International Journal of Environmental Research and Public Health 20, no. 19: 6885. https://doi.org/10.3390/ijerph20196885
APA StyleKunz, J. M., Hannapel, E., Vander Kelen, P., Hils, J., Hoover, E. R., & Edens, C. (2023). Effects of the COVID-19 Pandemic on Legionella Water Management Program Performance across a United States Lodging Organization. International Journal of Environmental Research and Public Health, 20(19), 6885. https://doi.org/10.3390/ijerph20196885