
Physiological Effects of Visual Stimulation by a Japanese Low Wooden Table: A Crossover Field Experiment


Abstract
1. Introduction
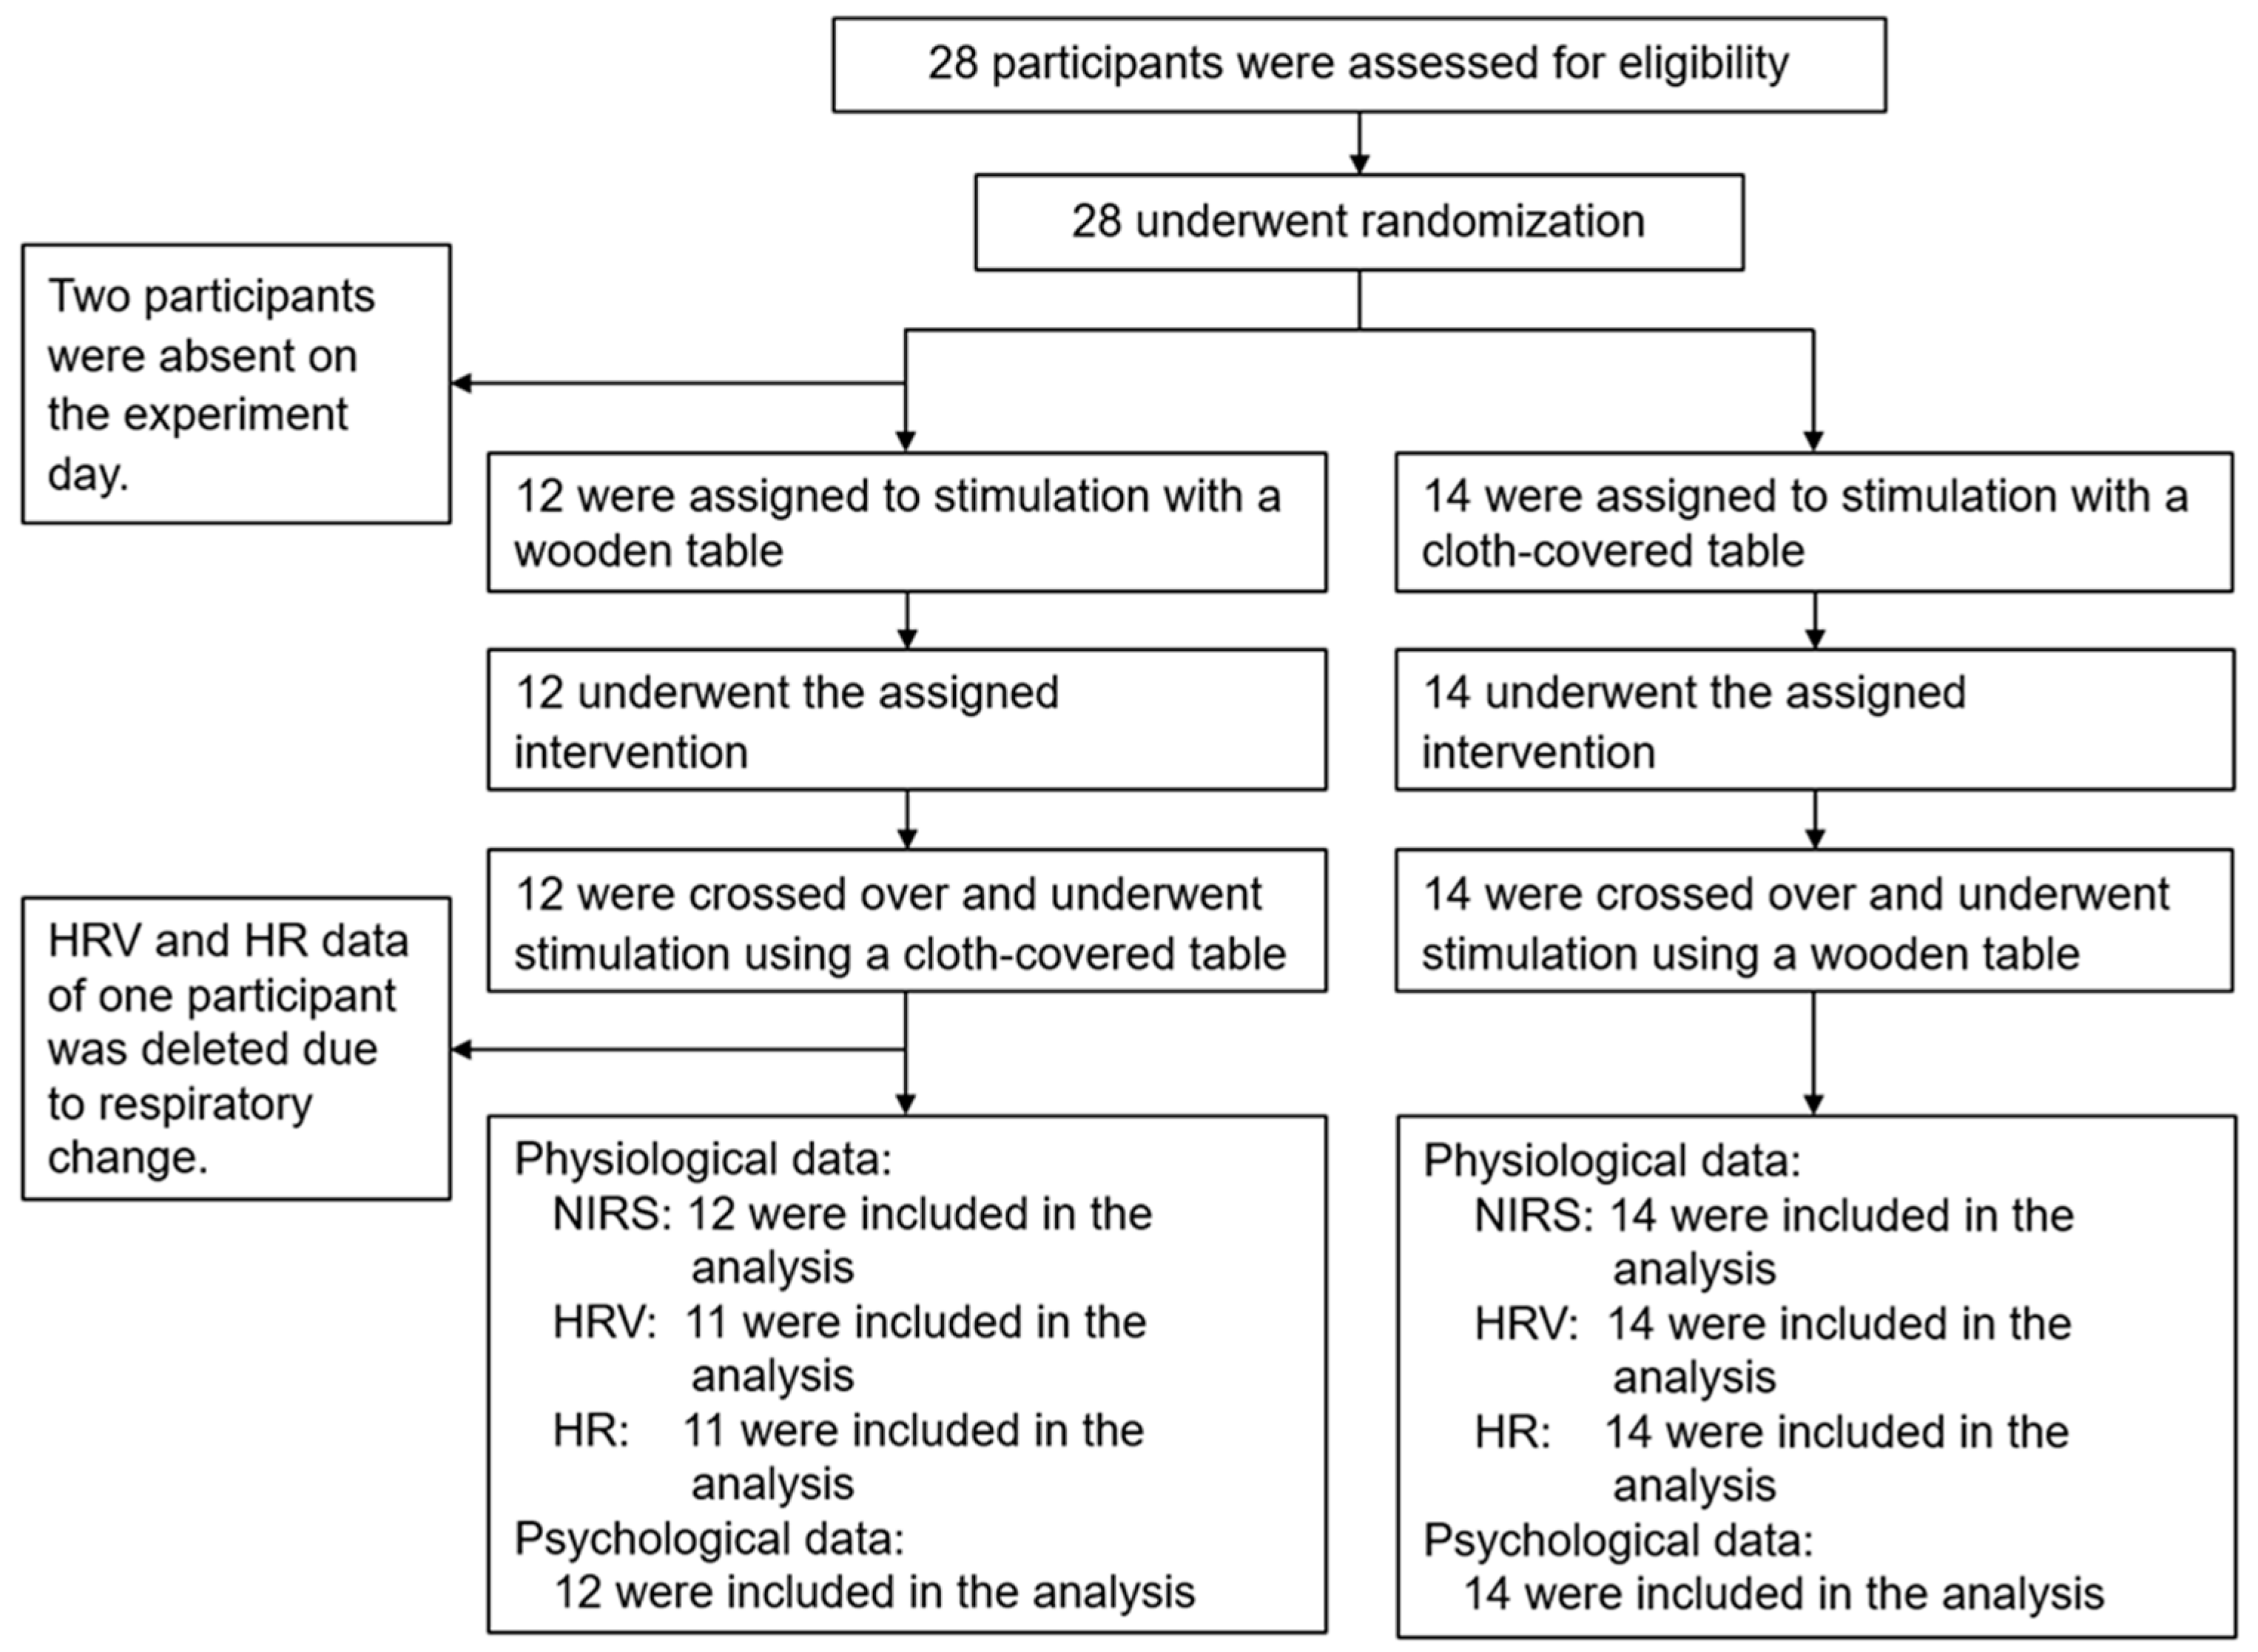
2. Materials and Methods
2.1. Participants
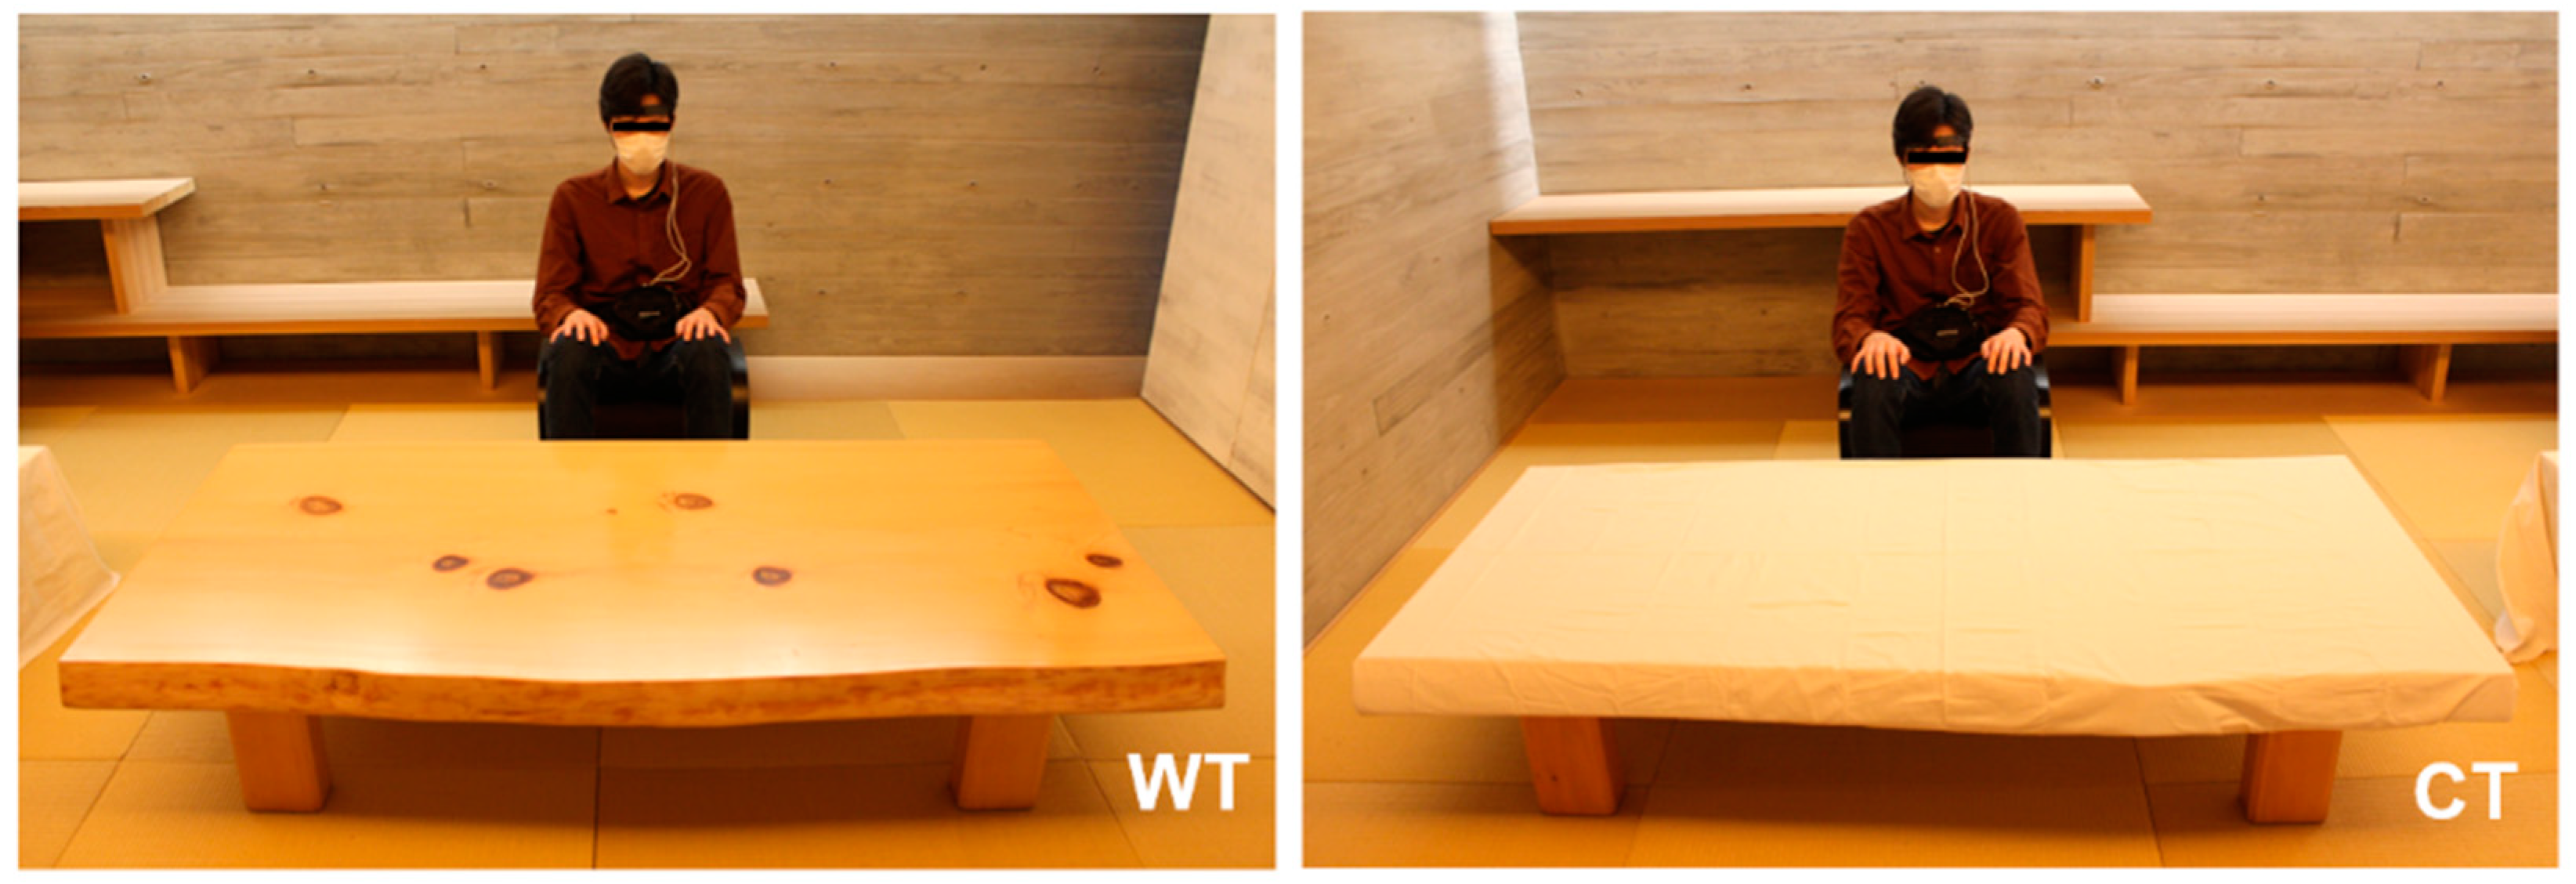
2.2. Visual Stimulation
2.3. Physiological Measurement
2.3.1. Near-Infrared Spectroscopy (NIRS)
2.3.2. Heart Rate Variability (HRV) and Heart Rate (HR)
2.4. Psychological Measurement
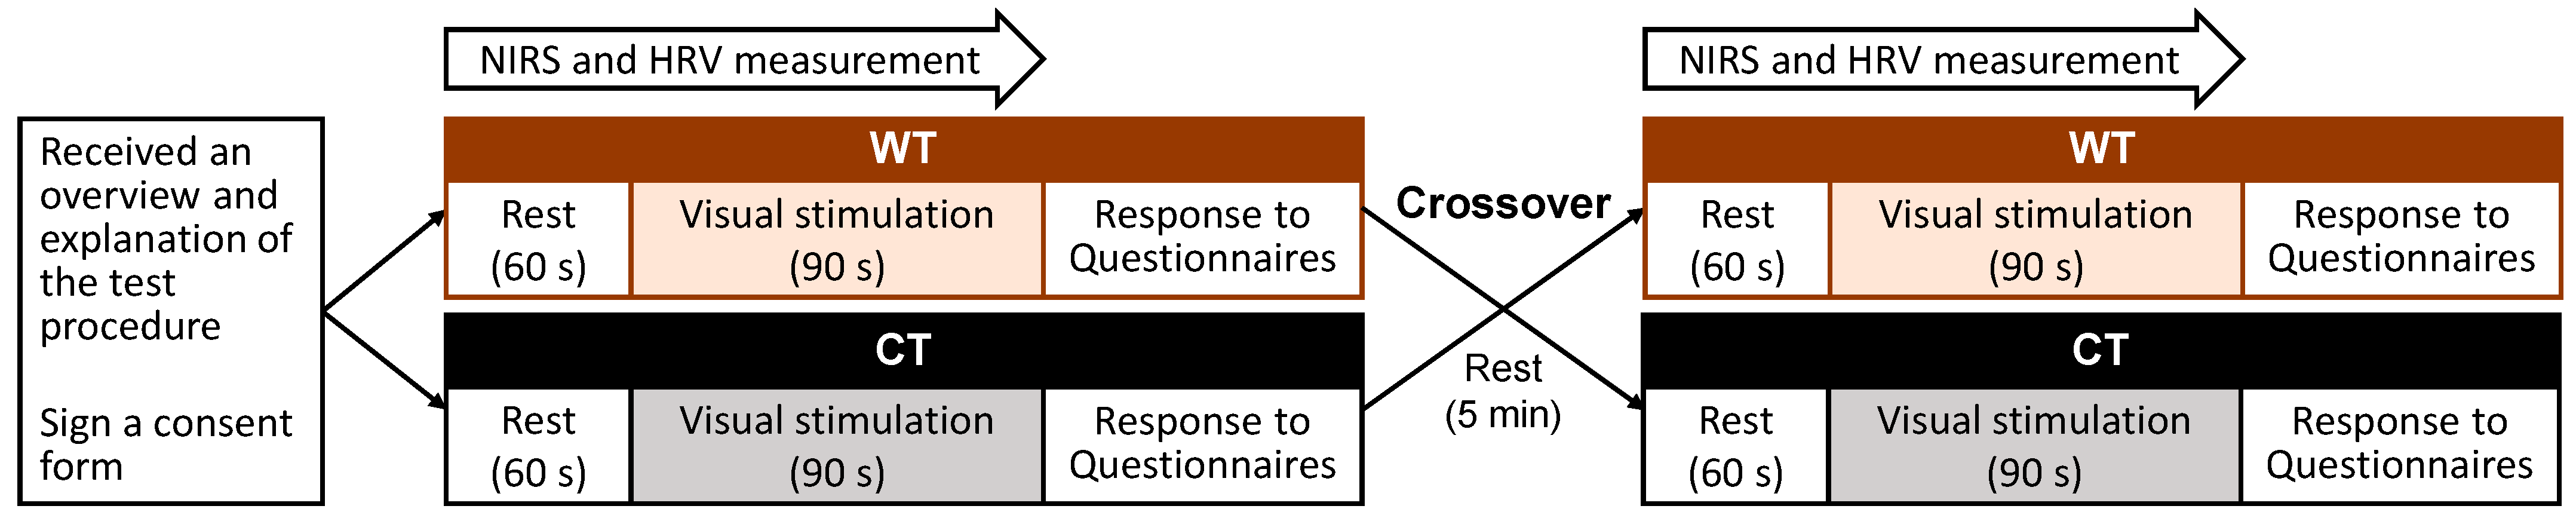
2.5. Study Protocol
2.6. Statistical Analysis
3. Results
3.1. Physiological Effects
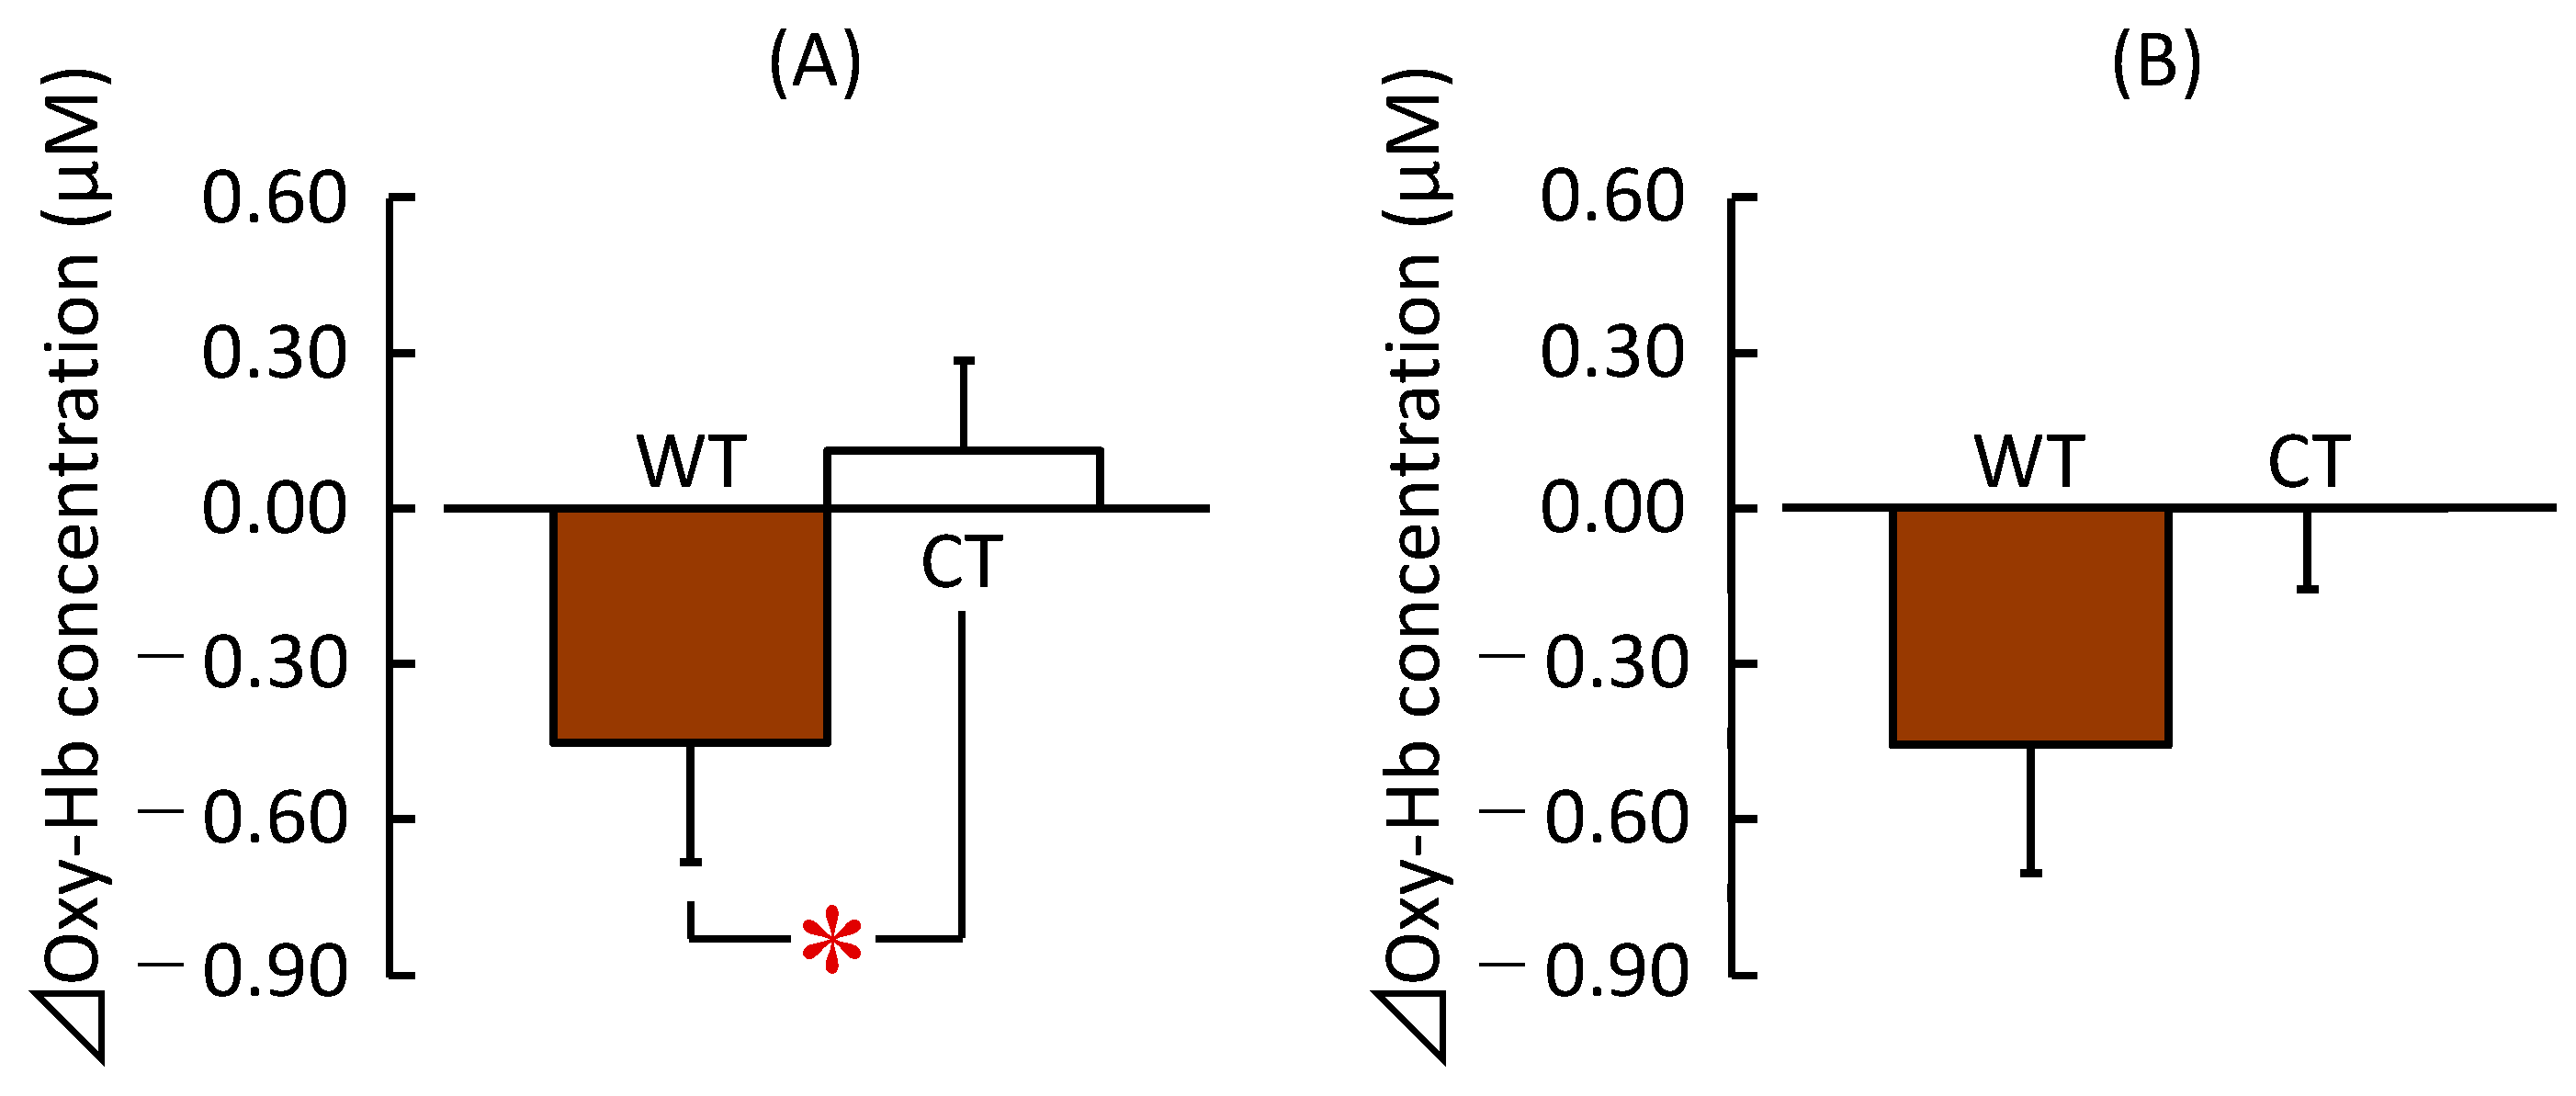
3.1.1. NIRS
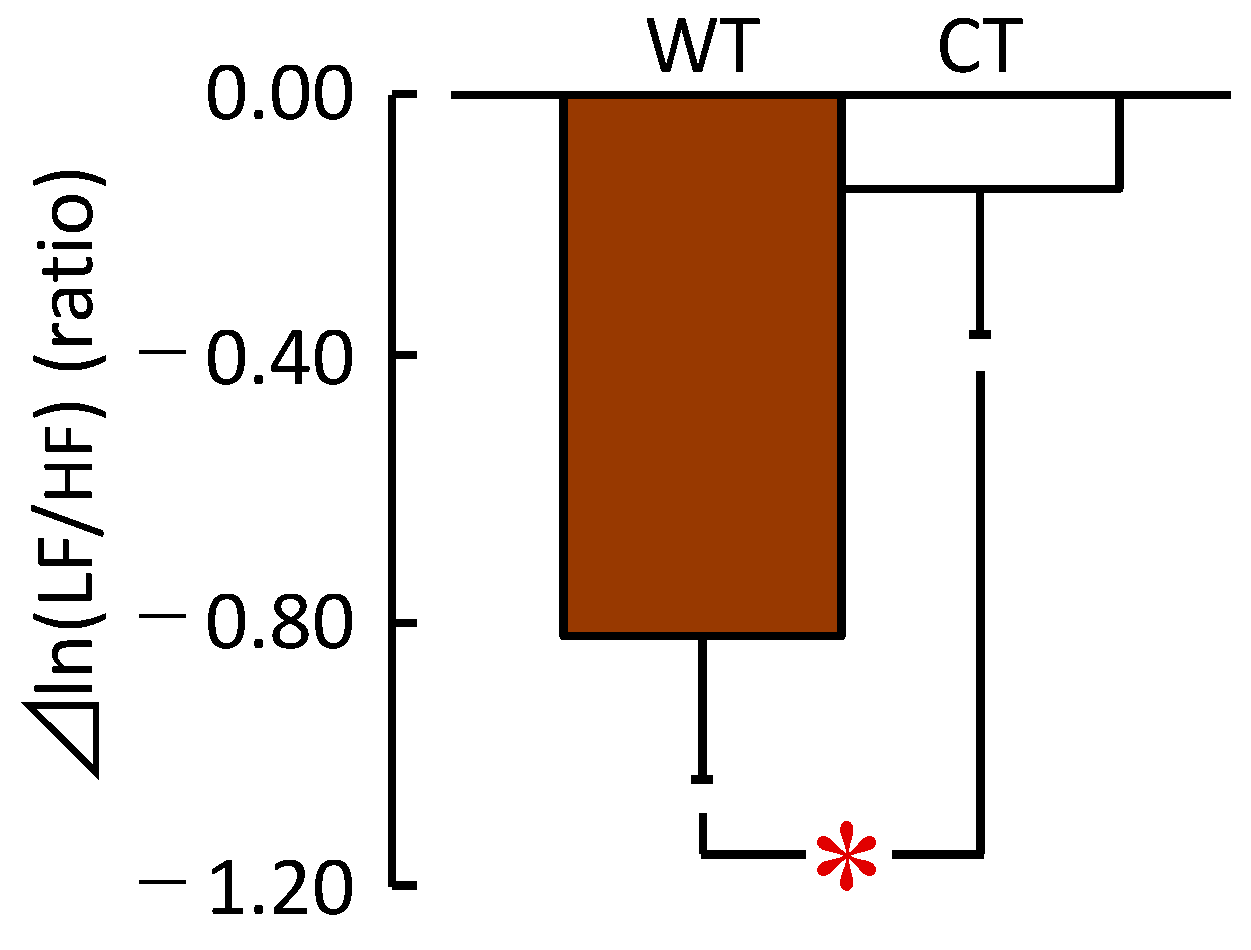
3.1.2. HRV and HR
3.2. Psychological Effects
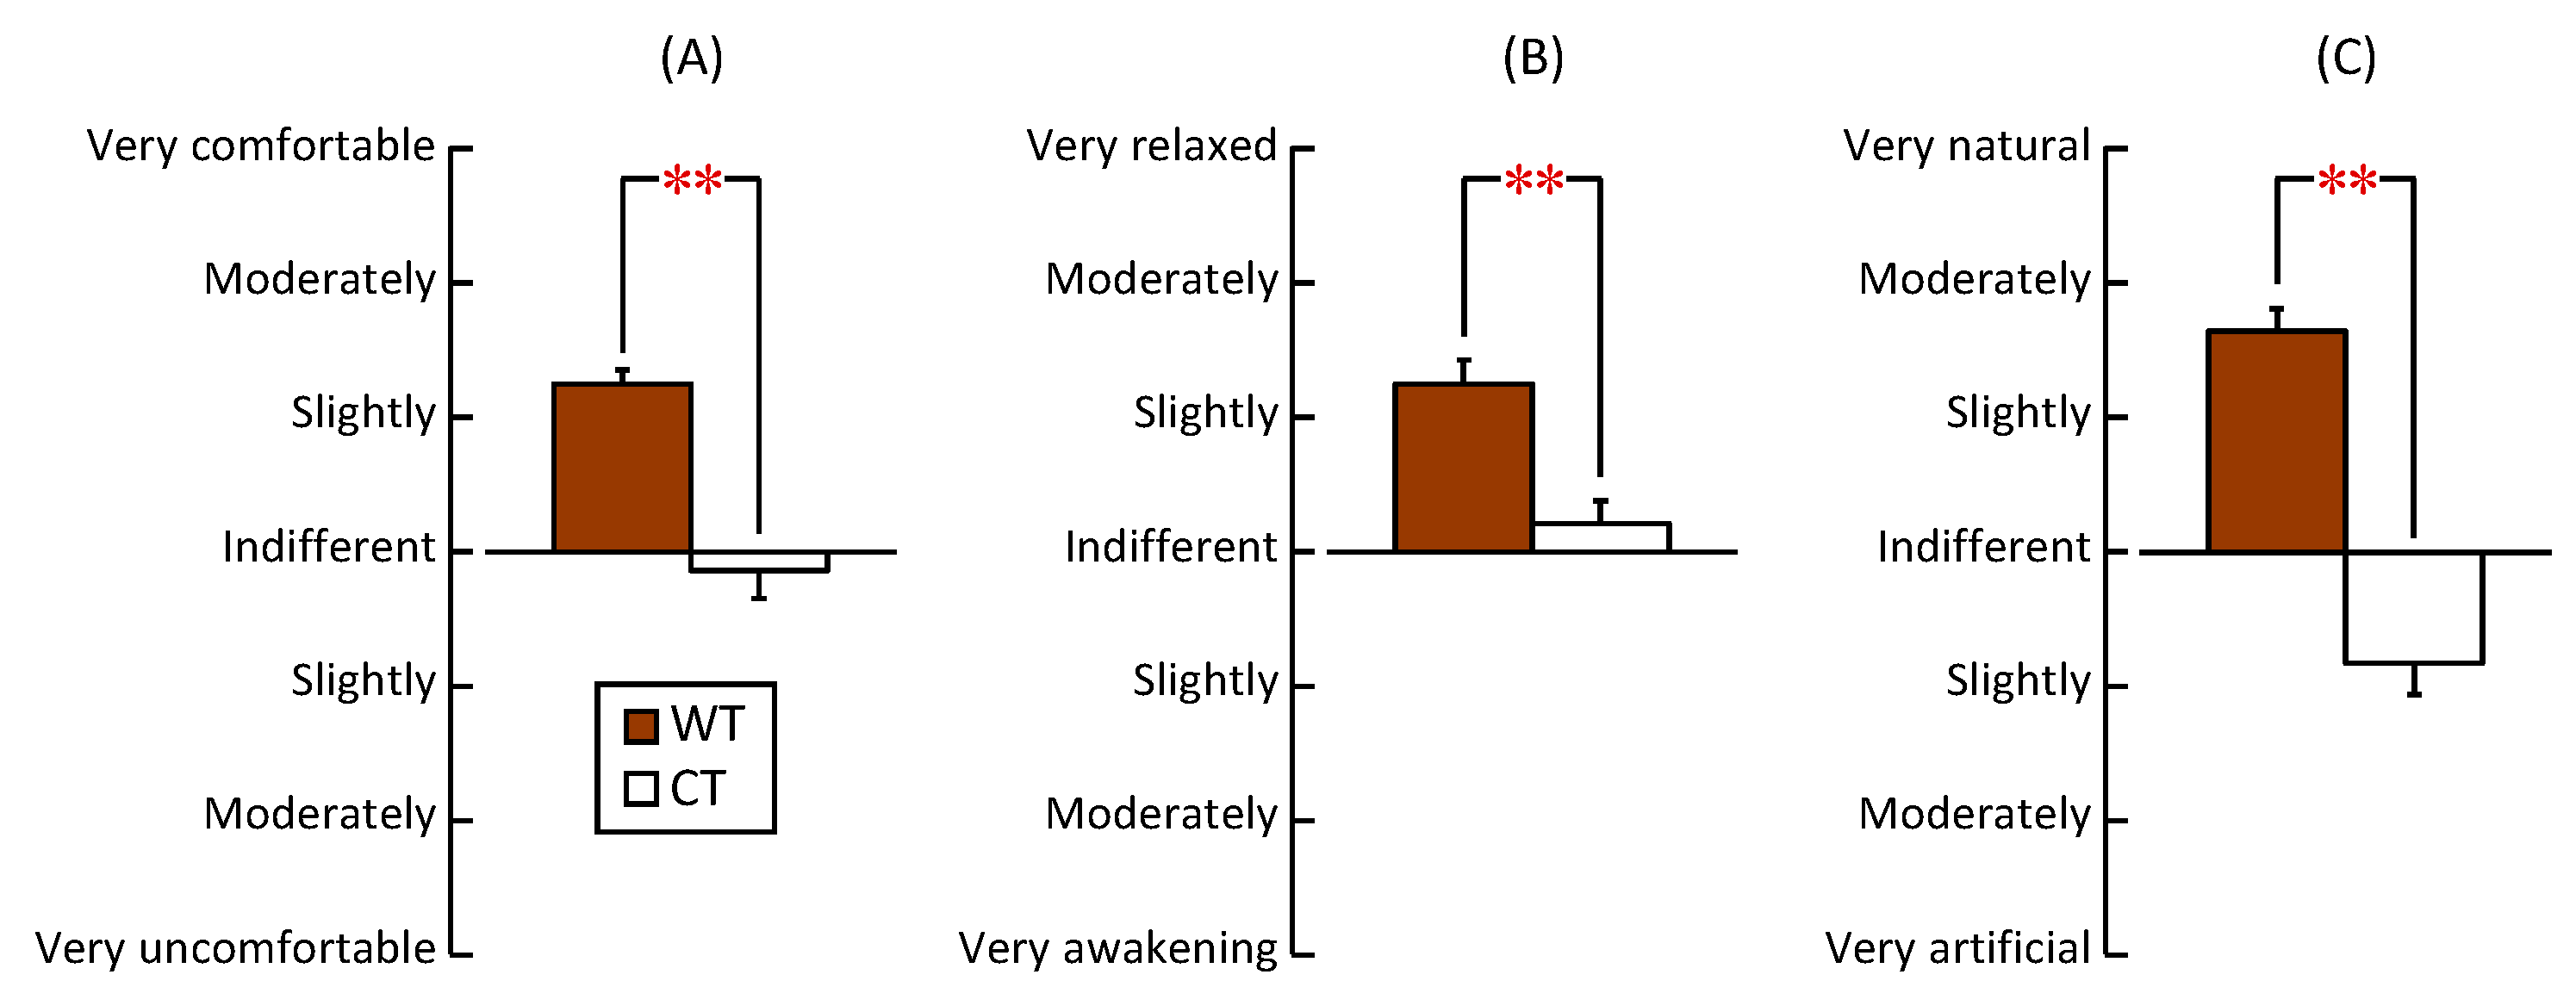
3.2.1. Modified SD Method
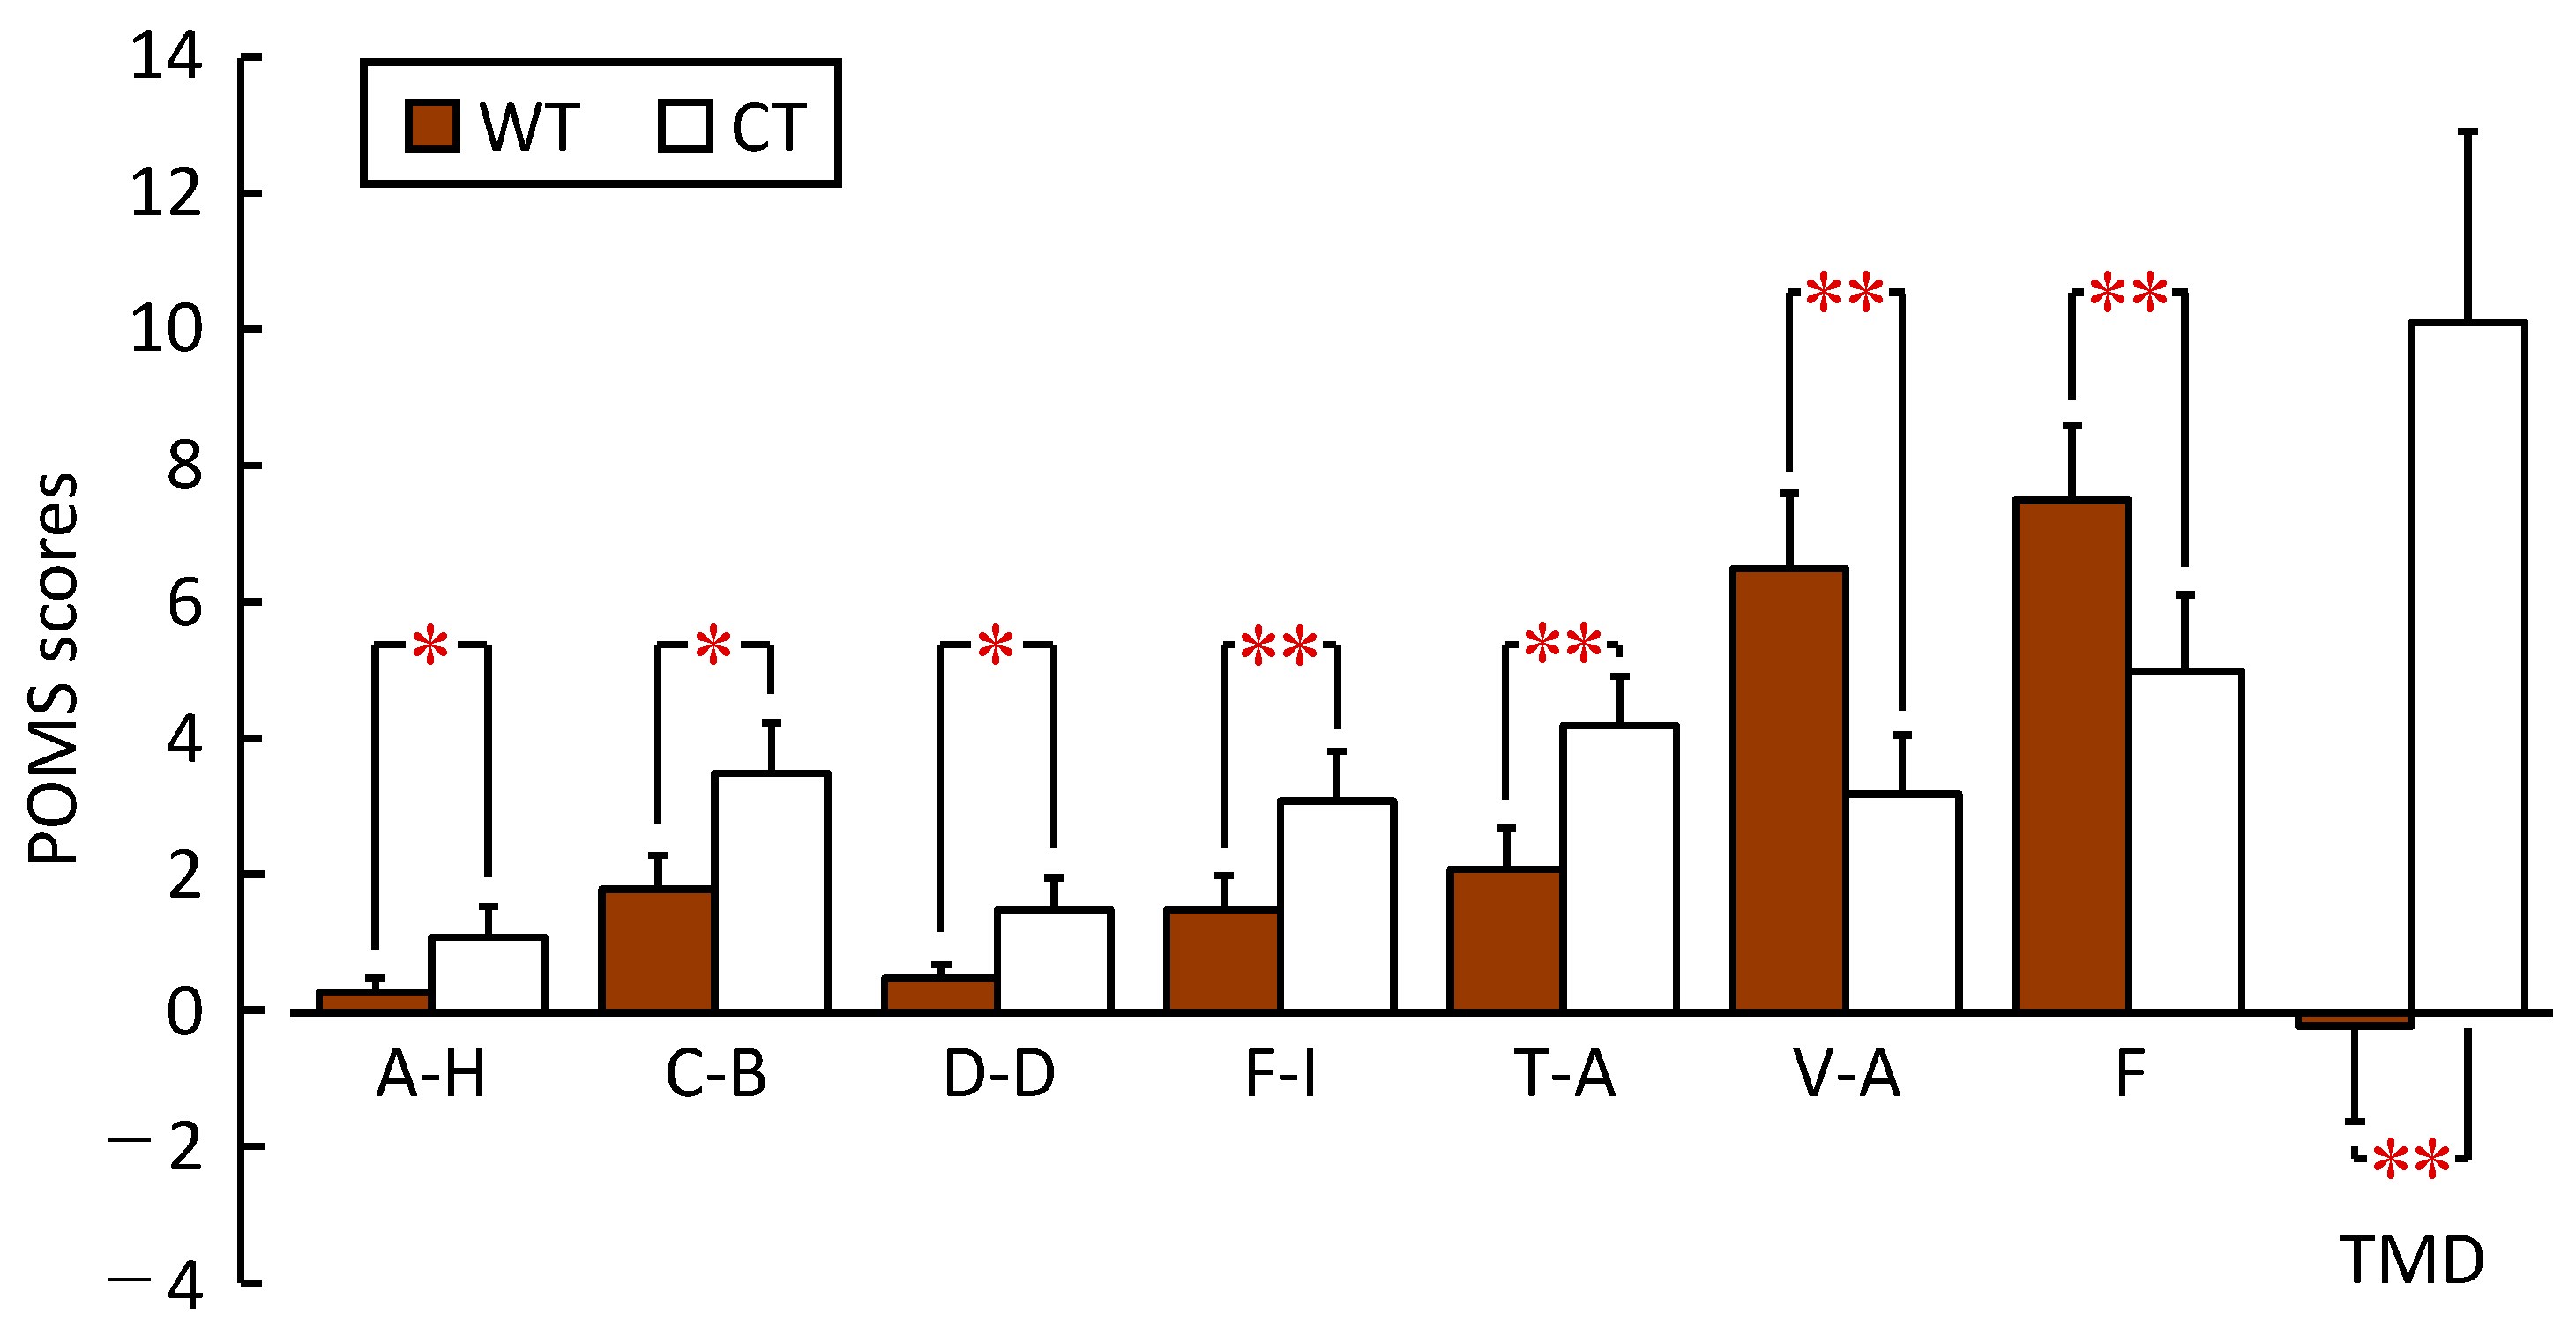
3.2.2. Profile of Mood State 2nd Edition (POMS 2)
4. Discussion
5. Conclusions
Author Contributions
Funding
Institutional Review Board Statement
Informed Consent Statement
Data Availability Statement
Acknowledgments
Conflicts of Interest
References
- Djongyang, N.; Tchinda, R.; Njomo, D. Thermal comfort: A review paper. Renew. Sustain. Energy Rev. 2010, 14, 2626–2640. [Google Scholar] [CrossRef]
- Tham, K.W. Indoor air quality and its effects on humans—A review of challenges and developments in the last 30 years. Energy Build. 2016, 130, 637–650. [Google Scholar] [CrossRef]
- Andargie, M.S.; Touchie, M.; O’Brien, W. A review of factors affecting occupant comfort in multi-unit residential buildings. Build. Environ. 2019, 160, 106182. [Google Scholar] [CrossRef]
- McArthur, J.J.; Powell, C. Health and wellness in commercial buildings: Systematic review of sustainable building rating systems and alignment with contemporary research. Build. Environ. 2020, 171, 106635. [Google Scholar] [CrossRef]
- Alapieti, T.; Mikkola, R.; Pasanen, P.; Salonen, H. The influence of wooden interior materials on indoor environment: A review. Eur. J. Wood Prod. 2020, 78, 617–634. [Google Scholar] [CrossRef]
- Lipovac, D.; Burnard, M.D. Effects of visual exposure to wood on human affective states, physiological arousal and cognitive performance: A systematic review of randomized trials. Indoor Built Environ. 2021, 30, 1021–1041. [Google Scholar] [CrossRef]
- Tsunetsugu, Y.; Miyazaki, Y.; Sato, H. The visual effects of wooden interiors in actual-size living rooms on the autonomic nervous activities. J. Physiol. Anthropol. Appl. Hum. Sci. 2002, 21, 297–300. [Google Scholar] [CrossRef] [PubMed]
- Tsunetsugu, Y.; Miyazaki, Y.; Sato, H. Visual effects of interior design in actual-size living rooms on physiological responses. Build. Environ. 2005, 40, 1341–1346. [Google Scholar] [CrossRef]
- Tsunetsugu, Y.; Miyazaki, Y.; Sato, H. Physiological effects in humans induced by the visual stimulation of room interiors with different wood quantities. J. Wood Sci. 2007, 53, 11–16. [Google Scholar] [CrossRef]
- Ikei, H.; Song, C.; Miyazaki, Y. Physiological effects of wood on humans: A review. J. Wood Sci. 2017, 63, 1–23. [Google Scholar] [CrossRef]
- Nakamura, M.; Ikei, H.; Miyazaki, Y. Physiological effects of visual stimulation with full-scale wall images composed of vertically and horizontally arranged wooden elements. J. Wood Sci. 2019, 65, 55. [Google Scholar] [CrossRef]
- Ikei, H.; Nakamura, M.; Miyazaki, Y. Physiological effects of visual stimulation using knotty and clear wood images among young women. Sustainability 2020, 12, 9898. [Google Scholar] [CrossRef]
- Joung, D.; Song, C.; Ikei, H.; Okuda, T.; Igarashi, M.; Koizumi, H.; Park, B.J.; Yamaguchi, T.; Takagaki, M.; Miyazaki, Y. Physiological and psychological effects of olfactory stimulation with D-limonene. Adv. Hortic. Sci. 2014, 28, 90–94. [Google Scholar]
- Ikei, H.; Song, C.; Lee, J.; Miyazaki, Y. Comparison of the effects of olfactory stimulation by air-dried and high-temperature-dried wood chips of hinoki cypress (Chamaecyparis obtusa) on prefrontal cortex activity. J. Wood Sci. 2015, 61, 537–540. [Google Scholar] [CrossRef]
- Ikei, H.; Song, C.; Miyazaki, Y. Physiological effect of olfactory stimulation by Hinoki cypress (Chamaecyparis obtusa) leaf oil. J. Physiol. Anthropol. 2015, 34, 44. [Google Scholar] [CrossRef]
- Ikei, H.; Song, C.; Miyazaki, Y. Effects of olfactory stimulation by α-pinene on autonomic nervous activity. J. Wood Sci. 2016, 62, 568–572. [Google Scholar] [CrossRef]
- Ikei, H.; Song, C.; Miyazaki, Y. Physiological effects of touching wood. Int. J. Environ. Res. Public. Health 2017, 14, 801. [Google Scholar] [CrossRef]
- Ikei, H.; Song, C.; Miyazaki, Y. Physiological effects of touching coated wood. Int. J. Environ. Res. Public. Health 2017, 14, 773. [Google Scholar] [CrossRef]
- Ikei, H.; Song, C.; Miyazaki, Y. Physiological effects of touching hinoki cypress (Chamaecyparis obtusa). J. Wood Sci. 2018, 64, 226–236. [Google Scholar] [CrossRef]
- Ikei, H.; Song, C.; Miyazaki, Y. Physiological effects of touching sugi (Cryptomeria japonica) with the palm of the hand. J. Wood Sci. 2019, 65, 48. [Google Scholar] [CrossRef]
- Ikei, H.; Song, C.; Miyazaki, Y. Physiological effects of touching the wood of hinoki cypress (Chamaecyparis obtusa) with the soles of the feet. Int. J. Environ. Res. Public. Health 2018, 15, 2135. [Google Scholar] [CrossRef] [PubMed]
- Ikei, H.; Miyazaki, Y. Positive physiological effects of touching sugi (Cryptomeria japonica) with the sole of the feet. J. Wood Sci. 2020, 66, 29. [Google Scholar] [CrossRef]
- United Nations Sustainable Development Goals. Available online: https://sdgs.un.org/goals (accessed on 15 March 2023).
- Viholainen, N.; Kylkilahti, E.; Autio, M.; Pöyhönen, J.; Toppinen, A. Bringing ecosystem thinking to sustainability-driven wooden construction business. J. Clean. Prod. 2021, 292, 126029. [Google Scholar] [CrossRef]
- Geng, A.; Yang, H.; Chen, J.; Hong, Y. Review of carbon storage function of harvested wood products and the potential of wood substitution in greenhouse gas mitigation. For. Policy Econ. 2017, 85, 192–200. [Google Scholar] [CrossRef]
- Amiri, A.; Ottelin, J.; Sorvari, J.; Junnila, S. Cities as carbon sinks—Classification of wooden buildings. Environ. Res. Lett. 2020, 15, 094076. [Google Scholar] [CrossRef]
- Forestry Agency. Ministry of Agriculture, Forestry and Fisheries of Japans. Annual Report on Forest and Forestry in Japan, Fiscal Year 2021. Japan. Available online: https://www.rinya.maff.go.jp/j/kikaku/hakusyo/r3hakusyo/attach/pdf/index-2.pdf (accessed on 15 March 2023).
- Anagnostou, G. The Influence of Traditional Japanese Timber Design and Construction Techniques on Contemporary Architecture and Its Relevance to Modern Timber Construction. In Gottstein Fellowship Report; Gottstein Trust: Sydney, NSW, Australia, 2018; Available online: https://gottsteintrust.org/upload/documents/projects-reports/210609023723_GAnagnostou_Gottstein-Report10181.pdf (accessed on 15 March 2023).
- Patchell, J.; Hayter, R. Japanese precious wood and the paradoxes of added value. Geogr. Rev. 1997, 87, 375–395. [Google Scholar] [CrossRef]
- Omote, M. “Home circle with having family meal together” in the woman’s magazine and the general magazine in the Meiji era. J. Home Econ. Jpn. 2006, 57, 369–378, (In Japanese with English abstract). [Google Scholar] [CrossRef]
- EnviroLife Research Institute Co., Ltd. Report of “Fact-Finding Survey on Floor Plans for Households in Their 20 s to 40 s.”; EnviroLife Research Institute Co., Ltd.: Tokyo, Japan, 2019. (In Japanese) [Google Scholar]
- ISO 8596:2017; Ophthalmic Optics—Visual Acuity Testing—Standard and Clinical Optotypes and Their Presentation, 3rd ed. The International Organization for Standardization (ISO): Geneva, Switzerland, 2017.
- Fox, P.T.; Raichle, M.E. Focal physiological uncoupling of cerebral blood flow and oxidative metabolism during somatosensory stimulation in human subjects. Proc. Natl. Acad. Sci. USA 1986, 83, 1140–1144. [Google Scholar] [CrossRef]
- Pinti, P.; Tachtsidis, I.; Hamilton, A.; Hirsch, J.; Aichelburg, C.; Gilbert, S.; Burgess, P.W. The present and future use of functional near-infrared spectroscopy (fNIRS) for cognitive neuroscience. Ann. N. Y. Acad. Sci. 2020, 1464, 5–29. [Google Scholar] [CrossRef]
- Quaresima, V.; Ferrari, M. Functional near-infrared spectroscopy (fNIRS) for assessing cerebral cortex function during human behavior in natural/social situations: A concise review. Organ. Res. Methods 2019, 22, 46–68. [Google Scholar] [CrossRef]
- Watanabe, T.; Mizuno, T.; Shikayama, T.; Miwa, M. Development of a wireless near-infrared tissue oxygen monitor system with high sampling rate. In Digital Holography and Three-Dimensional Imaging; Optical Society of America: Miami, FL, USA, 2012. [Google Scholar]
- Task Force of the European Society of Cardiology; The North American Society of Pacing and Electrophysiology. Heart rate variability: Standards of measurement, physiological interpretation and clinical use. Task force of the European Society of Cardiology and the North American society of pacing and electrophysiology. Circulation 1996, 93, 1043–1065. [Google Scholar] [CrossRef]
- Kobayashi, H.; Ishibashi, K.; Noguchi, H. Heart rate variability; an index for monitoring and analyzing human autonomic activities. Appl. Human. Sci. 1999, 18, 53–59. [Google Scholar] [CrossRef]
- Kanaya, N.; Hirata, N.; Kurosawa, S.; Nakayama, M.; Namiki, A. Differential effects of propofol and sevoflurane on heart rate variability. Anesthesiology 2003, 98, 34–40. [Google Scholar] [CrossRef] [PubMed]
- Sawada, Y.; Ohtomo, N.; Tanaka, Y.; Tanaka, G.; Yamakoshi, K.; Terachi, S.; Shimamoto, K.; Nakagawa, M.; Satoh, S.; Kuroda, S.; et al. New technique for time series analysis combining the maximum entropy method and non-linear least squares method: Its value in heart rate variability analysis. Med. Biol. Eng. Comput. 1997, 35, 318–322. [Google Scholar] [CrossRef] [PubMed]
- Kobayashi, H.; Park, B.J.; Miyazaki, Y. Normative references of heart rate variability and salivary alpha amylase in a healthy young male population. J. Physiol. Anthropol. 2012, 31, 9. [Google Scholar] [CrossRef]
- Schäfer, A.; Kratky, K.W. Estimation of breathing rate from respiratory sinus arrhythmia: Comparison of various methods. Ann. Biomed. Eng. 2008, 36, 476–485. [Google Scholar] [CrossRef] [PubMed]
- McCrady, J.D.; Vallbona, C.; Hoff, H.E. Neural origin of the respiratory–heart rate response. Am. J. Physiol. 1966, 211, 323–328. [Google Scholar] [CrossRef] [PubMed]
- Kobayashi, H. Normalization of respiratory sinus arrhythmia by factoring in tidal volume. Appl. Human. Sci. 1998, 17, 207–213. [Google Scholar] [CrossRef]
- Osgood, C.E.; Suci, G.J.; Tannenbaum, P. The Measurement of Meaning; University of Illinois Press: Urbana, IL, USA, 1957. [Google Scholar]
- Heuchert, J.P.; McNair, D.M. POMS 2, Profile of Mood States, 2nd ed.; Multi-Health Systems Inc.: New York, NY, USA, 2012. [Google Scholar]
- Heuchert, J.P.; McNair, D.M. Japanese Translation of POMS2: Profile of Mood States; Yokoyama, K., Watanabe, K., Eds.; Kaneko Shobo: Tokyo, Japan, 2015; pp. 1–156. [Google Scholar]
- Cohen, J. Statistical Power for the Behavioral Sciences, 2nd ed.; Erlbaum: Hillsdale, NJ, USA, 1988; pp. 1–579. ISBN 0-8058-0283-5. [Google Scholar]
- Grissom, R.J.; Kim, J.J. Effect Sizes for Research: Univariate and Multivariate Applications, 2nd ed.; Routledge: New York, NY, USA, 2012; pp. 1–456. [Google Scholar]
- Nakamura, M.; Ikei, H.; Miyazaki, Y. Effects of visual stimulation using wooden-wall images with different amounts of knots on psychological and physiological responses. Wood Sci. Technol. 2022, 56, 1869–1886. [Google Scholar] [CrossRef]
- Broman, N.O. Aesthetic properties in knotty wood surfaces and their connection with people’s preferences. J. Wood Sci. 2001, 47, 192–198. [Google Scholar] [CrossRef]
- Nyrud, A.Q.; Roos, A.; Rødbotten, M. Product attributes affecting consumer preference for residential deck materials. Can. J. For. Res. 2008, 38, 1385–1396. [Google Scholar] [CrossRef]
- Høibø, O.; Nyrud, A.Q. Consumer perception of wood surfaces: The relationship between stated preferences and visual homogeneity. J. Wood Sci. 2010, 56, 276–283. [Google Scholar] [CrossRef]
- Manuel, A.; Leonhart, R.; Broman, O.; Becker, G. How do consumers express their appreciation of wood surfaces? Norway spruce floors in Germany as an example. Ann. For. Sci. 2016, 73, 703–712. [Google Scholar] [CrossRef]
- O’ Grady, M.A.; Meinecke, L. Silence: Because what’s missing is too absent to ignore. J. Soc. Cult. Res. 2015, 1, 1–25. [Google Scholar]
- Miyazaki, Y. Shinrin-Yoku: The Japanese Way of Forest Bathing for Health and Relaxation; Octopus Publishing Group: London, UK, 2018. [Google Scholar]
- Hansen, M.M.; Jones, R.; Tocchini, K. Shinrin-Yoku (Forest Bathing) and Nature Therapy: A State-of-the-Art Review. Int. J. Environ. Res. Public. Health 2017, 14, 851. [Google Scholar] [CrossRef] [PubMed]
- Song, C.; Ikei, H.; Miyazaki, Y. Physiological effects of nature therapy: A review of the research in Japan. Int. J. Environ. Res. Public. Health 2016, 13, 781. [Google Scholar] [CrossRef]
- Churkina, G.; Organschi, A.; Reyer, C.P.O.; Ruff, A.; Vinke, K.; Liu, Z.; Reck, B.K.; Graedel, T.E.; Schellnhuber, H.J. Buildings as a global carbon sink. Nat. Sustain. 2020, 3, 269–276. [Google Scholar] [CrossRef]
- Himes, A.; Busby, G. Wood buildings as a climate solution. Dev. Built Environ. 2020, 4, 100030. [Google Scholar] [CrossRef]
- Pauliuk, S.; Heeren, N.; Berrill, P.; Fishman, T.; Nistad, A.; Tu, Q.; Wolfram, P.; Hertwich, E.G. Global scenarios of resource and emission savings from material efficiency in residential buildings and cars. Nat. Commun. 2021, 12, 5097. [Google Scholar] [CrossRef]


| Parameter (Unit) | Mean ± Standard Deviation |
|---|---|
| Age (years old) | 22.3 ± 0.4 |
| Height (cm) | 172.8 ± 6.3 |
| Weight (kg) | 62.0 ± 2.1 |
| Body mass index (kg/m2) | 20.7 ± 0.5 |
| Eyesight | Left: 0.9 ± 0.3; right: 0.9 ± 0.3 |
Disclaimer/Publisher’s Note: The statements, opinions and data contained in all publications are solely those of the individual author(s) and contributor(s) and not of MDPI and/or the editor(s). MDPI and/or the editor(s) disclaim responsibility for any injury to people or property resulting from any ideas, methods, instructions or products referred to in the content. |
© 2023 by the authors. Licensee MDPI, Basel, Switzerland. This article is an open access article distributed under the terms and conditions of the Creative Commons Attribution (CC BY) license (https://creativecommons.org/licenses/by/4.0/).
Share and Cite
Ikei, H.; Jo, H.; Miyazaki, Y. Physiological Effects of Visual Stimulation by a Japanese Low Wooden Table: A Crossover Field Experiment. Int. J. Environ. Res. Public Health 2023, 20, 6351. https://doi.org/10.3390/ijerph20146351
Ikei H, Jo H, Miyazaki Y. Physiological Effects of Visual Stimulation by a Japanese Low Wooden Table: A Crossover Field Experiment. International Journal of Environmental Research and Public Health. 2023; 20(14):6351. https://doi.org/10.3390/ijerph20146351
Chicago/Turabian StyleIkei, Harumi, Hyunju Jo, and Yoshifumi Miyazaki. 2023. "Physiological Effects of Visual Stimulation by a Japanese Low Wooden Table: A Crossover Field Experiment" International Journal of Environmental Research and Public Health 20, no. 14: 6351. https://doi.org/10.3390/ijerph20146351
APA StyleIkei, H., Jo, H., & Miyazaki, Y. (2023). Physiological Effects of Visual Stimulation by a Japanese Low Wooden Table: A Crossover Field Experiment. International Journal of Environmental Research and Public Health, 20(14), 6351. https://doi.org/10.3390/ijerph20146351