
Community Resilience and COVID-19: A Fuzzy-Set Qualitative Comparative Analysis of Resilience Attributes in 16 Countries


Abstract
1. Introduction
2. Literature Review
2.1. Resilience and Policy Design
2.2. Public Service Delivery and Slack
3. Research Design and Framework
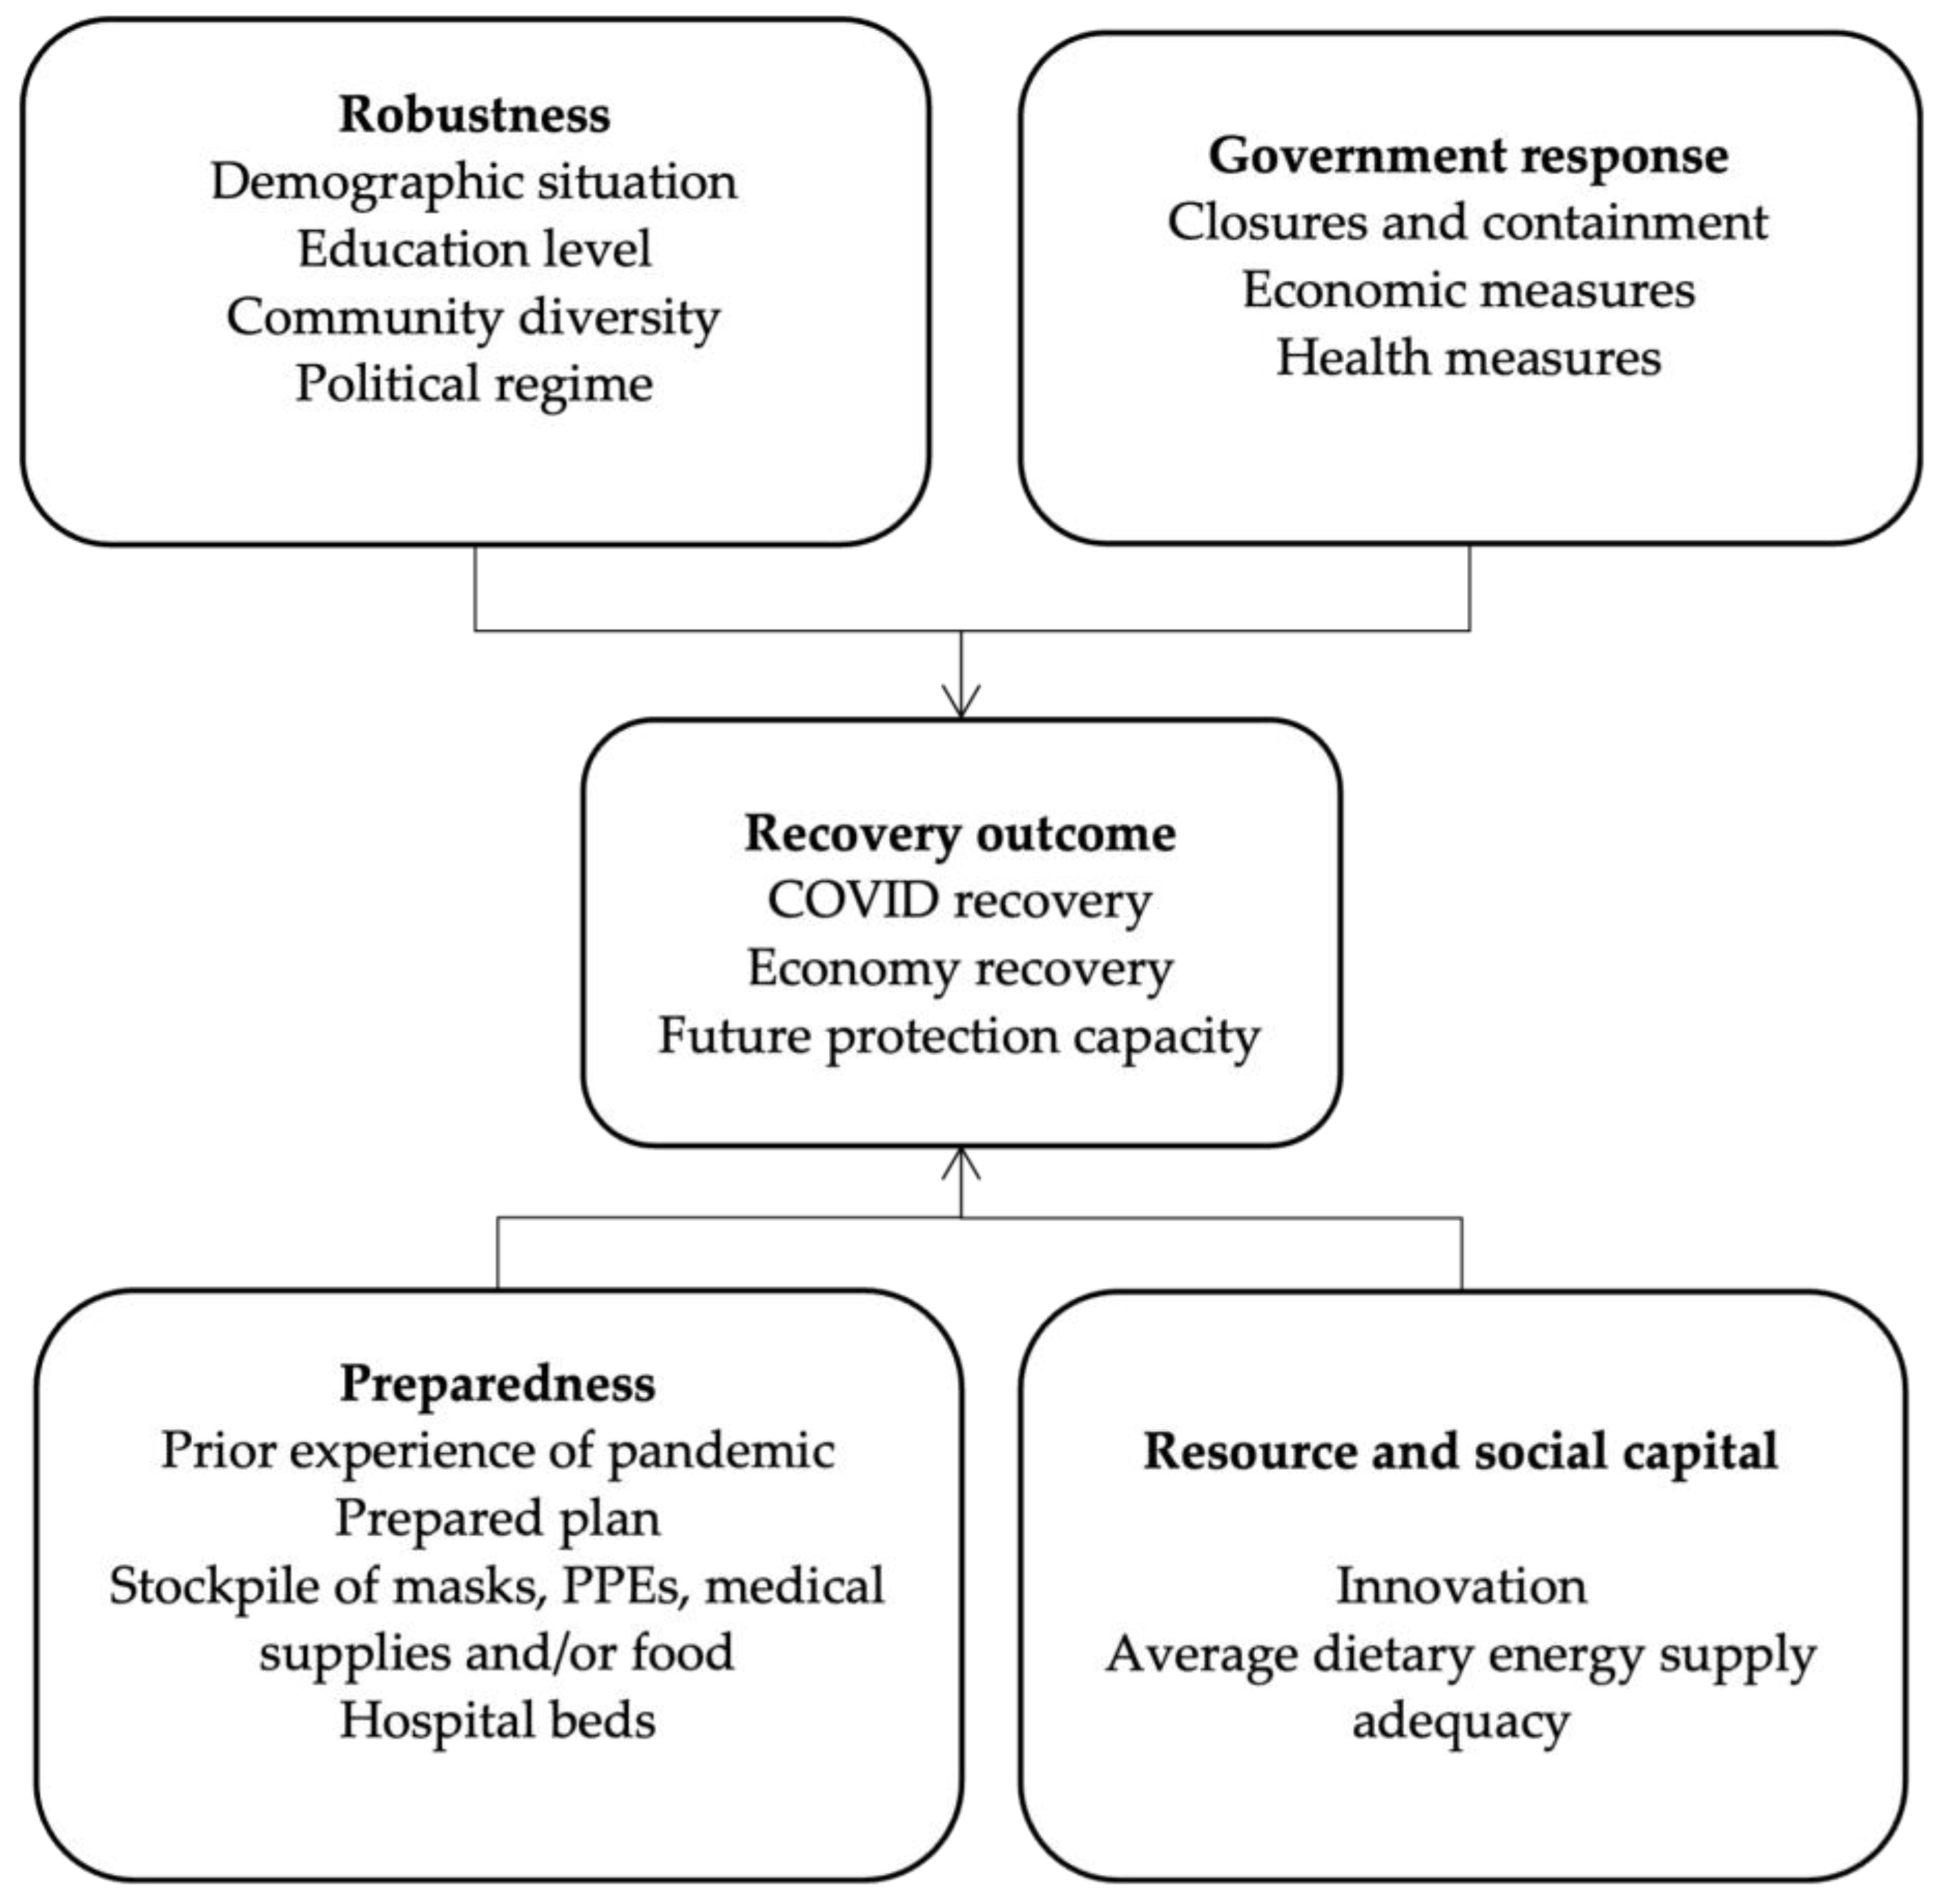
3.1. Analytical Framework
3.2. Fuzzy-Set Qualitative Comparative Analysis (fsQCA) Methodology
4. Research Methodology
4.1. Selection of Cases
4.2. Recovery Outcome and Calibrations
4.3. Contributing Factors and Calibrations
4.4. Research Outcomes
5. Discussions and Conclusions
Author Contributions
Funding
Institutional Review Board Statement
Informed Consent Statement
Data Availability Statement
Acknowledgments
Conflicts of Interest
References
- Bryce, C.; Ring, P.; Ashby, S.; Wardman, J.K. Resilience in the face of uncertainty: Early lessons from the COVID-19 pandemic. J. Risk Res. 2020, 23, 880–887. [Google Scholar] [CrossRef]
- DeWit, A.; Shaw, R.; Djalante, R. An integrated approach to sustainable development, National Resilience, and COVID-19 responses: The case of Japan. Int. J. Disaster Risk Reduct. 2020, 51, 101808. [Google Scholar] [CrossRef] [PubMed]
- Aristodemou, K.; Buchhass, L.; Claringbould, D. The COVID-19 crisis in the EU: The resilience of healthcare systems, government responses and their socio-economic effects. Eurasian Econ. Rev. 2021, 11, 251–281. [Google Scholar] [CrossRef]
- McCartney, G.; Pinto, J.; Liu, M. City resilience and recovery from COVID-19: The case of Macao. Cities 2021, 112, 103130. [Google Scholar] [CrossRef]
- Walker, W.E.; Rahman, S.A.; Cave, J. Adaptive policies, policy analysis, and policy-making. Eur. J. Oper. Res. 2001, 128, 282–289. [Google Scholar] [CrossRef]
- Haasnoot, M.; Kwakkel, J.H.; Walker, W.E.; ter Maat, J. Dynamic adaptive policy pathways: A method for crafting robust decisions for a deeply uncertain world. Glob. Environ. Chang. 2013, 23, 485–498. [Google Scholar] [CrossRef]
- Howlett, M. From the ‘old’ to the ‘new’ policy design: Design thinking beyond markets and collaborative governance. Policy Sci. 2014, 47, 187–207. [Google Scholar] [CrossRef]
- Chmutina, K.; Lizarralde, G.; Dainty, A.; Bosher, L. Unpacking resilience policy discourse. Cities 2016, 58, 70–79. [Google Scholar] [CrossRef]
- Holling, C.S. Resilience and Stability of Ecological Systems. Annu. Rev. Ecol. Syst. 1973, 4, 1–23. [Google Scholar] [CrossRef]
- Manyena, B.; O’Brien, G.; O’Keefe, P.; Rose, J. Disaster resilience: A bounce back or bounce forward ability? Local Environ. 2011, 16, 417–424. [Google Scholar]
- Davoudi, S.; Shaw, K.; Haider, L.J.; Quinlan, A.E.; Peterson, G.D.; Wilkinson, C.; Fünfgeld, H.; McEvoy, D.; Porter, L.; Davoudi, S. Resilience: A bridging concept or a dead end?“Reframing” resilience: Challenges for planning theory and practice interacting traps: Resilience assessment of a pasture management system in Northern Afghanistan urban resilience: What does it mean in planning practice? Resilience as a useful concept for climate change adaptation? The politics of resilience for planning: A cautionary note: Edited by Simin Davoudi and Libby Porter. Plan. Theory Pract. 2012, 13, 299–333. [Google Scholar]
- Bond, A.; Morrison-Saunders, A.; Gunn, J.A.E.; Pope, J.; Retief, F. Managing uncertainty, ambiguity and ignorance in impact assessment by embedding evolutionary resilience, participatory modelling and adaptive management. J. Environ. Manag. 2015, 151, 97–104. [Google Scholar] [CrossRef] [PubMed]
- Folke, C.; Carpenter, S.; Elmqvist, T.; Gunderson, L.; Holling, C.S.; Walker, B. Resilience and sustainable development: Building adaptive capacity in a world of transformations. AMBIO 2002, 31, 437–440. [Google Scholar] [CrossRef]
- Lebel, L.; Anderies, J.M.; Campbell, B.; Folke, C.; Hatfield-Dodds, S.; Hughes, T.P.; Wilson, J. Governance and the capacity to manage resilience in regional social-ecological systems. Ecol. Soc. 2006, 11, 19. [Google Scholar] [CrossRef]
- Adger, W.N.; Brown, K.; Nelson, D.R.; Berkes, F.; Eakin, H.; Folke, C.; Galvin, K.; Gunderson, L.; Goulden, M.; O’Brien, K.; et al. Resilience implications of policy responses to climate change. Wiley Interdiscip. Rev. Clim. Change 2011, 2, 757–766. [Google Scholar] [CrossRef]
- MacKinnon, D.; Derickson, K.D. From resilience to resourcefulness: A critique of resilience policy and activism. Prog. Hum. Geogr. 2013, 37, 253–270. [Google Scholar] [CrossRef]
- Capano, G.; Woo, J.J. Resilience and robustness in policy design: A critical appraisal. Policy Sci. 2017, 50, 399–426. [Google Scholar] [CrossRef]
- Capano, G.; Woo, J.J. Designing policy robustness: Outputs and processes. Policy Soc. 2018, 37, 422–440. [Google Scholar] [CrossRef]
- Jen, E. Stable or robust? What’s the difference. In Robust Design: A Repertoire of Biological, Ecological, and Engineering Case Studies; SFI Studies in the Sciences of Complexity: Santa Fe, NM, USA, 2005; pp. 7–20. [Google Scholar]
- Bankes, S.C. Robustness, adaptivity, and resiliency analysis. In Proceedings of the 2010 AAAI Fall Symposium Series, Arlington, VA, USA, 11–13 November 2010. [Google Scholar]
- Dryzek, J.S. Don’t toss coins in garbage cans: A prologue to policy design. J. Public Policy 1983, 3, 345–367. [Google Scholar] [CrossRef]
- BBC. Coronavirus: Will Our Day-To-Day Ever Be the Same? Available online: https://www.bbc.com/worklife/article/20201109-coronavirus-how-cities-travel-and-family-life-will-change (accessed on 12 July 2021).
- Moore, R.; Sodha, S.; McKie, R.; Hinsliff, G.; Adams, T.; Bell, T. Life after Covid: Will our world ever be the same? Guardian 2020, 29. Available online: https://www.theguardian.com/world/2020/nov/29/life-after-covid-will-our-world-ever-be-the-same (accessed on 10 November 2022).
- Jones, L.; Palumbo, D.; Brown, D. Coronavirus: How the pandemic has changed the world economy. BBC News 2021, 24. Available online: https://www.bbc.com/news/business-51706225 (accessed on 10 November 2022).
- Capano, G.; Howlett, M.; Jarvis, D.S.L.; Ramesh, M.; Goyal, N. Mobilizing Policy (In)Capacity to Fight COVID-19: Understanding Variations in State Responses. Policy Soc. 2020, 39, 285–308. [Google Scholar] [CrossRef] [PubMed]
- Linkov, I.; Trump, B.D.; Golan, M.; Keisler, J.M. Enhancing Resilience in Post-COVID Societies: By Design or By Intervention? Environ. Sci. Technol. 2021, 55, 4202–4204. [Google Scholar] [CrossRef] [PubMed]
- Kauzya, J.-M.; Niland, E. The Role of Public Service and Public Servants during the COVID-19 Pandemic; UN Department of Economic and Social Affairs (DESA): New York, NY, USA, 2020. [Google Scholar]
- Hartley, K.; Jarvis, D.S.L. Policymaking in a low-trust state: Legitimacy, state capacity, and responses to COVID-19 in Hong Kong. Policy Soc. 2020, 39, 403–423. [Google Scholar] [CrossRef] [PubMed]
- Kavanagh, M.M.; Singh, R. Democracy, Capacity, and Coercion in Pandemic Response: COVID-19 in Comparative Political Perspective. J. Health Politics Policy Law 2020, 45, 997–1012. [Google Scholar] [CrossRef] [PubMed]
- Woo, J.J. Policy capacity and Singapore’s response to the COVID-19 pandemic. Policy Soc. 2020, 39, 345–362. [Google Scholar] [CrossRef] [PubMed]
- Woo, J.J. Capacity-Building and Pandemics: Singapore’s Response to COVID-19; Palgrave Macmillan: London, UK, 2020. [Google Scholar]
- Woo, J.J. Pandemic, politics and pandemonium: Political capacity and Singapore’s response to the COVID-19 crisis. Policy Des. Pract. 2021, 4, 77–93. [Google Scholar] [CrossRef]
- Howlett, M. Procedural policy tools and the temporal dimensions of policy design. Resilience, robustness and the sequencing of policy mixes. Int. Rev. Public Policy 2019, 1, 27–45. [Google Scholar] [CrossRef]
- Béland, D. Ideas and institutional change in social security: Conversion, layering, and policy drift. Soc. Sci. Q. 2007, 88, 20–38. [Google Scholar] [CrossRef]
- Howlett, M.; Rayner, J. Design principles for policy mixes: Cohesion and coherence in ‘new governance arrangements’. Policy Soc. 2007, 26, 1–18. [Google Scholar] [CrossRef]
- Howlett, M.; Rayner, J. Patching vs packaging in policy formulation: Complementary effects, goodness of fit, degrees of freedom, and feasibility in policy portfolio design. Annu. Rev. Policy Des. 2013, 1, 1–19. [Google Scholar]
- Van der Heijden, J. Institutional layering: A review of the use of the concept. Politics 2011, 31, 9–18. [Google Scholar] [CrossRef]
- Aucoin, P. Administrative reform in public management: Paradigms, principles, paradoxes and pendulums. Gov. Int. J. Policy Adm. 1990, 3, 115–137. [Google Scholar] [CrossRef]
- Gaebler, T. Reinventing Government: How the Entrepreneurial Spirit is Transforming the Public Sector; Plume: Palo Alto, CA, USA, 1993. [Google Scholar]
- Dunleavy, P.; Hood, C. From Old Public-Administration to New Public Management. Public Money Manag. 1994, 14, 9–16. [Google Scholar] [CrossRef]
- Hood, C. The “new public management” in the 1980s: Variations on a theme. Account. Organ. Soc. 1995, 20, 93–109. [Google Scholar] [CrossRef]
- Lapuente, V.; Van de Walle, S. The effects of new public management on the quality of public services. Governance 2020, 33, 461–475. [Google Scholar] [CrossRef]
- Dunleavy, P.; Margetts, H.; Bastow, S.; Tinkler, J. New public management is dead—Long live digital-era governance. J. Publ. Adm. Res. 2006, 16, 467–494. [Google Scholar] [CrossRef]
- Caffrey, L.; Ferlie, E.; McKevitt, C. The strange resilience of new public management: The case of medical research in the UK’s national health service. Public Manag. Rev. 2019, 21, 537–558. [Google Scholar] [CrossRef]
- Simonet, D. New public management and the reform of French public hospitals. J. Public Aff. 2013, 13, 260–271. [Google Scholar] [CrossRef]
- Alonso, J.M.; Clifton, J.; Diaz-Fuentes, D. The impact of New Public Management on efficiency: An analysis of Madrid’s hospitals. Health Policy 2015, 119, 333–340. [Google Scholar] [CrossRef]
- Andrews, R.; Beynon, M.J.; McDermott, A. Configurations of New Public Management reforms and the efficiency, effectiveness and equity of public healthcare systems: A fuzzy-set Qualitative Comparative Analysis. Public Manag. Rev. 2019, 21, 1236–1260. [Google Scholar] [CrossRef]
- Cairney, P. New public management and the Thatcher healthcare legacy: Enough of the theory, what about the implementation? Br. J. Politics Int. Relat. 2002, 4, 375–398. [Google Scholar] [CrossRef]
- Cheung, A.B. Modernizing public healthcare governance in Hong Kong: A case study of professional power in the New Public Management. Public Manag. Rev. 2002, 4, 343–365. [Google Scholar] [CrossRef]
- Agartan, T.I.; Kuhlmann, E. New public management, physicians and populism: Turkey’s experience with health reforms. Sociol. Health Illn. 2019, 41, 1410–1425. [Google Scholar] [CrossRef] [PubMed]
- Anderson, C.; Libell, H.P. Finland, ‘Prepper Nation of the Nordics,’ Isn’t Worried About Masks. New York Times 2020, 5. Available online: https://www.nytimes.com/2020/04/05/world/europe/coronavirus-finland-masks.html (accessed on 18 September 2020).
- Dellanna, A. Finland is stockpiling paracetamol over fears of a second wave. Euronews 2020. Available online: https://www.euronews.com/2020/08/18/coronavirus-finland-is-stockpiling-paracetamol-over-fears-of-a-second-wave (accessed on 18 September 2020).
- Lam, L. Singapore has months’ worth of stockpiles, planned for disruption of supplies from Malaysia for years: Chan Chun Sing. CNA 2020. Available online: https://www.channelnewsasia.com/news/singapore/coronavirus-covid-19-chan-chun-sing-food-supply-12545326 (accessed on 20 July 2020).
- Meah, N. Singapore is building up mask stockpile, but people should not take availability of masks for granted: Chan Chun Sing. TODAYonline 2020. Available online: https://www.todayonline.com/singapore/singapore-building-mask-stockpile-people-should-not-take-availability-masks-granted-chan-chun (accessed on 20 July 2020).
- Tan, T.M. Private lab in S’pore mistakenly disposes of 233 COVID-19 swab samples following lapses in protocol. The Straits Times 2020. Available online: https://www.straitstimes.com/singapore/private-lab-mistakenly-disposes-of-233-covid-19-patient-samples-following-lapses-in (accessed on 14 October 2020).
- Lim, K.; Kok, X. Singapore’s cramped migrant worker dorms a ‘perfect storm’ for rising coronavirus infections. South China Morning Post 2020. Available online: https://www.scmp.com/week-asia/health-environment/article/3078684/singapores-cramped-migrant-worker-dorms-perfect-storm (accessed on 14 October 2020).
- Sim, D.; Kok, X. How did migrant worker dorms become Singapore’s biggest COVID-19 cluster? South China Morning Post 2020. Available online: https://www.scmp.com/week-asia/explained/article/3080466/how-did-migrant-worker-dormitories-become-singapores-biggest (accessed on 22 May 2020).
- Yeung, J.; Yee, I. Tens of thousands of Singapore’s migrant workers are infected. The rest are stuck in their dorms as the country opens up. CNN 2020. Available online: https://www.cnn.com/2020/05/14/asia/singapore-migrant-worker-coronavirus-intl-hnk/index.html (accessed on 22 May 2020).
- Yi, F.; Deng, D.; Zhang, Y. Collaboration of top-down and bottom-up approaches in the post-disaster housing reconstruction: Evaluating the cases in Yushu Qinghai-Tibet Plateau of China from resilience perspective. Land Use Policy 2020, 99, 104932. [Google Scholar] [CrossRef]
- Khailani, D.K.; Perera, R. Mainstreaming disaster resilience attributes in local development plans for the adaptation to climate change induced flooding: A study based on the local plan of Shah Alam City, Malaysia. Land Use Policy 2013, 30, 615–627. [Google Scholar] [CrossRef]
- Chang, S.E.; Rose, A.Z. Towards a Theory of Economic Recovery from Disasters. Int. J. Mass Emergencies Disasters 2012, 30, 171–181. [Google Scholar]
- Beniya, S. The Evaluation of the Status of Disaster Areas by using Recovery Indicators—In the case of the Great Hanshin-Awaji Earthquake. In Proceedings of the 2nd International Conference on Urban Disaster Reduction, Taipei, Taiwan, 27–29 November 2007. [Google Scholar]
- Alesch, D.J.; Siembieda, W. The Role of the Built Environment in the Recovery of Cities and Communities from Extreme Events. Int. J. Mass Emergencies Disasters 2012, 30, 197–211. [Google Scholar]
- Olshansky, R.B.; Etienne, H.F. Setting the stage for long-term recovery in Haiti. Earthq. Spectra 2011, 27, 463–486. [Google Scholar] [CrossRef]
- Hettige, S.; Haigh, R.; Amaratunga, D. Community level indicators of long term disaster recovery. Procedia Eng. 2018, 212, 1287–1294. [Google Scholar] [CrossRef]
- Tierney, K.; Oliver-Smith, A. Social dimensions of disaster recovery. Int. J. Mass Emergencies Disasters 2012, 30, 123–146. [Google Scholar]
- Smith, G.; Birkland, T. Building a Theory of Recovery: Institutional Dimensions. Int. J. Mass Emergencies Disasters 2012, 30, 147–170. [Google Scholar]
- Cutter, S.L.; Burton, C.G.; Emrich, C.T. Disaster Resilience Indicators for Benchmarking Baseline Conditions. J. Homel. Secur. Emerg. Manag. 2010, 7. [Google Scholar] [CrossRef]
- Cutter, S.L.; Barnes, L.; Berry, M.; Burton, C.; Evans, E.; Tate, E.; Webb, J. A place-based model for understanding community resilience to natural disasters. Glob. Environ. Chang. 2008, 18, 598–606. [Google Scholar] [CrossRef]
- Norris, F.H.; Stevens, S.P.; Pfefferbaum, B.; Wyche, K.F.; Pfefferbaum, R.L. Community resilience as a metaphor, theory, set of capacities, and strategy for disaster readiness. Am. J. Commun. Psychol. 2008, 41, 127–150. [Google Scholar] [CrossRef] [PubMed]
- Aldrich, D.P. Building Resilience: Social Capital in Post-Disaster Recovery; University of Chicago Press: Chicago, IL, USA, 2012. [Google Scholar]
- Aldrich, D.P. It’s who you know: Factors driving recovery from Japan’s 11 march 2011 disaster. Public Admin. 2016, 94, 399–413. [Google Scholar] [CrossRef]
- Aldrich, D.P.; Sawada, Y. The physical and social determinants of mortality in the 3.11 tsunami. Soc. Sci. Med. 2015, 124, 66–75. [Google Scholar] [CrossRef] [PubMed]
- Reddy, S.D. Factors influencing the incorporation of hazard mitigation during recovery from disaster. Nat. Hazards 2000, 22, 185–201. [Google Scholar] [CrossRef]
- Green, R.; Bates, L.K.; Smyth, A. Impediments to recovery in New Orleans’ upper and lower ninth ward: One year after Hurricane Katrina. Disasters 2007, 31, 311–335. [Google Scholar] [CrossRef]
- Song, Y.; Li, C.; Olshansky, R.; Zhang, Y.; Xiao, Y. Are we planning for sustainable disaster recovery? Evaluating recovery plans after the Wenchuan earthquake. J. Environ. Plan. Manag. 2017, 60, 2192–2216. [Google Scholar] [CrossRef]
- Yi, F.X.; Tu, Y. An Evaluation of the Paired Assistance to Disaster-Affected Areas Program in Disaster Recovery: The Case of the Wenchuan Earthquake. Sustainability 2018, 10, 4483. [Google Scholar] [CrossRef]
- Ragin, C.C. The Comparative Method: Moving beyond Qualitative and Quantitative Methods; University of California: Berkeley, CA, USA, 1987. [Google Scholar]
- Rihoux, B.; Ragin, C.C. Configurational Comparative Methods: Qualitative Comparative Analysis (QCA) and Related Techniques; Sage Publications: New York, NY, USA, 2008. [Google Scholar]
- Schneider, C.Q.; Wagemann, C. Set-Theoretic Methods for the Social Sciences: A Guide to Qualitative Comparative Analysis; Cambridge University Press: Cambridge, UK, 2012. [Google Scholar]
- Rihoux, B.; Ragin, C.C. Qualitative Comparative Analysis (QCA) as an Approach. In Configurational Comparative Methods: Qualitative Comparative Analysis (QCA) and Related Techniques; SAGE Publications, Inc.: Thousand Oaks, CA, USA, 2009; pp. 1–19. [Google Scholar]
- Berkes, F.; Ross, H. Community Resilience: Toward an Integrated Approach. Soc. Nat. Resour. 2013, 26, 5–20. [Google Scholar] [CrossRef]
- Toriello, P.J.; Benshoff, J.J. Substance abuse counselors and ethical dilemmas: The influence of recovery and education level. J. Addict. Offender Couns. 2003, 23, 83–98. [Google Scholar] [CrossRef]
- Stone, D. Global public policy, transnational policy communities, and their networks. Policy Stud. J. 2008, 36, 19–38. [Google Scholar] [CrossRef]
- Chu, Z.; Cheng, M.; Song, M. What determines urban resilience against COVID-19: City size or governance capacity? Sustain. Cities Soc. 2021, 75, 103304. [Google Scholar] [CrossRef] [PubMed]
- Ma, C.; Rogers, J.H.; Zhou, S. Global economic and financial effects of 21st century pandemics and epidemics. Covid Econ. 2020, 5, 56–78. [Google Scholar] [CrossRef]
- Christensen, T.; Painter, M. The Politics of SARS—Rational Responses or Ambiguity, Symbols and Chaos? Policy Soc. 2004, 23, 18–48. [Google Scholar] [CrossRef]
- Batty, M. The COVID years: Predictable unpredictability. Environ. Plan B-Urban 2022, 49, 3–6. [Google Scholar] [CrossRef]
- Bereitschaft, B.; Scheller, D. How Might the COVID-19 Pandemic Affect 21st Century Urban Design, Planning, and Development? Urban Sci. 2020, 4, 56. [Google Scholar] [CrossRef]
- Sharifi, A.; Khavarian-Garmsir, A.R. The COVID-19 pandemic: Impacts on cities and major lessons for urban planning, design, and management. Sci. Total Environ. 2020, 749, 142391. [Google Scholar] [CrossRef] [PubMed]
- Howlett, M. Managing the “hollow state”: Procedural policy instruments and modern governance. Can. Public Adm. 2000, 43, 412–431. [Google Scholar] [CrossRef]


| No | ISO | Continent | Type | Country | City |
|---|---|---|---|---|---|
| 1 | ZWE | Africa | Developing | Zimbabwe | Harare |
| 2 | USA | North America | Developed | United States | Cincinnati, Ohio |
| 3 | FRA | Europe | Developed | France | Paris |
| 4 | KHM | Asia | Developing | Cambodia | Phnom Penh |
| 5 | MWI | Africa | Developing | Malawi | Lilongwe |
| 6 | MMR | Asia | Developing | Myanmar | Mandalay |
| 7 | GBR | Europe | Developed | United Kingdom | London |
| 8 | NZL | Oceania | Developed | New Zealand | Auckland |
| 9 | RUS | Europe | Developed | Russian Federation | Moscow |
| 10 | TZA | Africa | Developing | Tanzania | Dar Es Salaam |
| 11 | IND | Asia | Developing | India | Delhi |
| 12 | JPN | Asia | Developed | Japan | Tokyo |
| 13 | KOR | Asia | Developed | Korea, Rep. | Seoul |
| 14 | SGP | Asia | Developed | Singapore | Singapore |
| 15 | CHN | Asia | Developing | China | Hangzhou |
| 16 | PAK | Asia | Developing | Pakistan | Islamabad |
| Recovery Outcome | Indicators | Explanation | Source |
|---|---|---|---|
| COVID recovery | Infection recovery | The proportion of the number of infections in the city on 30 June 2021, to the city’s historical peak data. | Ministry of Health of each country or city, JHU, and other databases |
| Death recovery | The proportion of the number of deaths in the city on 30 June 2021, to the city’s historical peak data. | ||
| Economy recovery | GDP recovery | GDP growth in 2021 compared to 2019 | IMF (2021, predicted); World Bank (2020) |
| Unemployment recovery | The unemployment rate growth in 2020 compared to 2019. | World Bank | |
| Future protection capacity | Vaccinations per hundred | This research applies the national data to the city level. | OWID database |
| City | COVID Recovery | Economy Recovery | Future Protection Capacity | ||
|---|---|---|---|---|---|
| Infection Recovery | Death Recovery | GDP Growth | Unemployment Rate | Vaccine Coverage | |
| Harare | 0.00 | 0.05 | 0.62 | 0.88 | 0.06 |
| Cincinnati | 0.98 | 1.00 | 0.69 | 0.00 | 0.65 |
| Paris | 1.00 | 0.98 | 0.51 | 1.00 | 0.53 |
| Phnom Penh | 0.00 | 0.00 | 0.54 | 1.00 | 0.28 |
| Lilongwe | 0.00 | 0.56 | 0.71 | 0.94 | 0.01 |
| Mandalay | 0.00 | 0.23 | 0.00 | 0.75 | 0.04 |
| London | 0.69 | 0.98 | 0.45 | 0.91 | 0.74 |
| Auckland | 0.97 | 1.00 | 0.71 | 0.93 | 0.15 |
| Moscow | 1.00 | 0.00 | 0.65 | 0.79 | 0.18 |
| Dar es Salaam | 1.00 | 1.00 | 0.94 | 1.00 | 0.00 |
| Delhi | 0.99 | 0.96 | 0.65 | 0.63 | 0.15 |
| Tokyo | 0.69 | 0.99 | 0.50 | 0.91 | 0.26 |
| Seoul | 0.00 | 0.87 | 0.72 | 0.97 | 0.25 |
| Singapore | 0.99 | 1.00 | 0.60 | 0.57 | 0.39 |
| Hangzhou | 1.00 | 1.00 | 1.00 | 0.95 | 0.56 |
| Islamabad | 0.17 | 0.00 | 0.72 | 0.89 | 0.04 |
| Contributing Factors | Indicators | Explanation | Source |
|---|---|---|---|
| Robustness | demographic situation | Demographic situation contains two aspects, life expectancy and age dependency ratio. The age dependency ratio means that the non-working population is divided by the working population. National data are used to represent the city level. | World Bank |
| education level | School enrollment (primary) is used to measure the education level of the city. National data are used to represent the city level. | World Bank | |
| community diversity | We use the community diversity index, which consists of ethnicity, languages, and the size of the migrant community, to measure the city’s diversity. | Questionnaire | |
| political regime | The research uses two indicators to measure the political situations of the cities. One is the polity score, and the other is Corruption Perception Index. These two indicators are also for the national level, and we believe it is reasonable to apply them to the cities. | Center for Systemic Peace 2017 (polity score); World Bank (Corruption Perception Index) | |
| Preparedness | prior experience of pandemic | This indicator measures whether the country has experience in dealing with pandemics such as SARS and Ebola in the past. National data are applied to the city level. | Ma, Rogers, and Zhou (2020) [83] |
| prepared plan | We searched public government data, asked local residents for information, and gave each location a score on a five-point scale, with higher scores indicating the better reserves. | Questionnaire | |
| stockpile of masks, PPEs, medical supplies, and/or food | Questionnaire | ||
| hospital beds per 1000 people | National-level data applied to the city level. | WHO Global Health Observatory | |
| Resources and social capital | innovation | This indicator is measured by five grades from 1 to 5 in city level. | Questionnaire |
| average dietary energy supply adequacy | This research uses the data of 2018–2020 3-year average to reflect the basic food supply capacity of the city. | FAO Food Security Index | |
| Government response | closures and containment | Seven indicators are used to measure the policy of closures and containment of a city. They are school closing, workplace closing, cancel public events, restrictions on gatherings, close public transport, stay-at-home requirements, restrictions on internal movement, international travel controls. | OxCGRT database |
| economic measures | Three indicators are selected to measure economic policy implication. Income support records if the government is covering the salaries or providing direct cash payments, universal basic income, or similar, of people who lose their jobs or cannot work. Debt/contract relief judges if government is freezing financial obligations. Fiscal measures figure out what economic stimulus policies are adopted. | ||
| health measures | Testing policy finds out who can get tested. Contact tracing records whether governments are doing contact tracing. Emergency investment in health care measures short-term spending. Investment in vaccines announces public spending on vaccine development. Vaccination policy records policies for vaccine delivery for different groups. Protection of elderly people records policies for protecting elderly people in long term care facilities and/or the community and home setting. |
| City | Y-Recovery Outcome | X-Robustness | X-Preparedness | X-Resource and Social Capital | X-Government Response |
|---|---|---|---|---|---|
| Harare | 0.2780 | 0.5224 | 0.3759 | 0.3914 | 0.4745 |
| Cincinnati, Ohio | 0.6609 | 0.5634 | 0.5990 | 0.7648 | 0.7722 |
| Paris | 0.7567 | 0.4839 | 0.6090 | 0.6336 | 0.6453 |
| Phnom Penh | 0.3498 | 0.5232 | 0.5101 | 0.8516 | 0.5818 |
| Lilongwe | 0.3747 | 0.5438 | 0.3680 | 0.6516 | 0.4218 |
| Mandalay | 0.1776 | 0.5333 | 0.5128 | 0.4633 | 0.6174 |
| London | 0.7514 | 0.5852 | 0.7409 | 0.9023 | 0.7286 |
| Auckland | 0.6501 | 0.5351 | 0.5930 | 0.6867 | 0.4966 |
| Moscow | 0.4659 | 0.6332 | 0.3329 | 0.5219 | 0.6166 |
| Dar es Salaam | 0.6563 | 0.3846 | 0.4061 | 0.5164 | 0.2606 |
| Delhi | 0.5898 | 0.5175 | 0.4528 | 0.3203 | 0.6736 |
| Tokyo | 0.6036 | 0.6158 | 0.6486 | 0.7242 | 0.7224 |
| Seoul | 0.5088 | 0.7424 | 0.7878 | 0.8336 | 0.5444 |
| Singapore | 0.6573 | 0.5670 | 0.6415 | 0.9102 | 0.8246 |
| Hangzhou | 0.8451 | 0.5273 | 0.6274 | 0.8180 | 0.7485 |
| Islamabad | 0.3096 | 0.4001 | 0.4547 | 0.6164 | 0.6432 |
| Contributing Factors | Consistency | Coverage |
|---|---|---|
| X-robustness | 0.84 | 0.83 |
| ~X-robustness | 0.73 | 0.87 |
| X-preparedness | 0.88 | 0.88 |
| ~X-preparedness | 0.68 | 0.80 |
| X-resources and social capital | 0.94 | 0.76 |
| ~X-resources and social capital | 0.52 | 0.84 |
| X-government response | 0.91 | 0.80 |
| ~X-government response | 0.62 | 0.86 |
| X-Robustness | X-Preparedness | X-Resources and Social Capital | X-Government Response | Number of Cases | Raw Consist. |
|---|---|---|---|---|---|
| 1 | 1 | 1 | 1 | 7 | 0.908005 |
| 1 | 0 | 0 | 0 | 1 | 0.891111 |
| 0 | 0 | 1 | 0 | 1 | 0.904079 |
| 1 | 0 | 1 | 0 | 1 | 0.887203 |
| 1 | 1 | 1 | 0 | 1 | 0.923312 |
| 1 | 0 | 0 | 1 | 1 | 0.87725 |
| 1 | 1 | 0 | 1 | 1 | 0.88835 |
| 0 | 0 | 1 | 1 | 1 | 0.865182 |
| 1 | 0 | 1 | 1 | 1 | 0.878325 |
| 0 | 1 | 1 | 1 | 1 | 0.898076 |
| Combination of Contributing Factors | Raw Coverage | Unique Coverage | Consistency | Cities |
|---|---|---|---|---|
| X-robustness*~X-preparedness | 0.6497 | 0 | 0.833491 | Moscow (RUS) Lilongwe (MWI) Harare (ZWE) Delhi (IND) |
| ~X-preparedness*X-resources and social capital | 0.642135 | 0.0152655 | 0.835962 | Lilongwe (MWI) Islamabad (PAK) Moscow (RUS) Dar es Salaam (TZA) |
| X-robustness*X-resources and social capital | 0.814622 | 0.00445706 | 0.861196 | Seoul (KOR) Tokyo (JPN) London (GBR) Singapore (SGP) Cincinnati, Ohio (USA) Lilongwe (MWI) Auckland (NZL) Hangzhou (CHN) Phnom Penh (KHM) Moscow (RUS) |
| X-robustness*X-government response | 0.818636 | 0 | 0.869426 | Moscow (RUS) Tokyo (JPN) London (GBR) Singapore (SGP) Cincinnati, Ohio (USA) Seoul (KOR) Mandalay (MMR) Hangzhou (CHN) Phnom Penh (KHM) Delhi (IND) |
| X-resources and social capital*X-government response | 0.877113 | 0.0813074 | 0.83779 | Singapore (SGP) Cincinnati, Ohio (USA) Hangzhou (CHN) London (GBR) Tokyo (JPN) Paris (FRA) Islamabad (PAK) Phnom Penh (KHM) Seoul (KOR) Moscow (RUS) |
| solution coverage: 0.934025 | ||||
| solution consistency: 0.786694 | ||||
Disclaimer/Publisher’s Note: The statements, opinions and data contained in all publications are solely those of the individual author(s) and contributor(s) and not of MDPI and/or the editor(s). MDPI and/or the editor(s) disclaim responsibility for any injury to people or property resulting from any ideas, methods, instructions or products referred to in the content. |
© 2022 by the authors. Licensee MDPI, Basel, Switzerland. This article is an open access article distributed under the terms and conditions of the Creative Commons Attribution (CC BY) license (https://creativecommons.org/licenses/by/4.0/).
Share and Cite
Yi, F.; Woo, J.J.; Zhang, Q. Community Resilience and COVID-19: A Fuzzy-Set Qualitative Comparative Analysis of Resilience Attributes in 16 Countries. Int. J. Environ. Res. Public Health 2023, 20, 474. https://doi.org/10.3390/ijerph20010474
Yi F, Woo JJ, Zhang Q. Community Resilience and COVID-19: A Fuzzy-Set Qualitative Comparative Analysis of Resilience Attributes in 16 Countries. International Journal of Environmental Research and Public Health. 2023; 20(1):474. https://doi.org/10.3390/ijerph20010474
Chicago/Turabian StyleYi, Fangxin, Jun Jie Woo, and Qiang Zhang. 2023. "Community Resilience and COVID-19: A Fuzzy-Set Qualitative Comparative Analysis of Resilience Attributes in 16 Countries" International Journal of Environmental Research and Public Health 20, no. 1: 474. https://doi.org/10.3390/ijerph20010474
APA StyleYi, F., Woo, J. J., & Zhang, Q. (2023). Community Resilience and COVID-19: A Fuzzy-Set Qualitative Comparative Analysis of Resilience Attributes in 16 Countries. International Journal of Environmental Research and Public Health, 20(1), 474. https://doi.org/10.3390/ijerph20010474