Abstract
China’s food security has attracted global attention as the various drivers of its instability and uncertainty have intensified. This study developed a new framework for food security evaluation in China by analyzing its availability, distribution, utilization, vulnerability, sustainability, and regulation. The entropy weight method (EWM) and the matter–element extension model (MEEM) were combined to examine China’s food security status between 2001 and 2020. Additionally, an obstacle degree model (ODM) was used to investigate the key factors functioning as obstacles to food security. The results show that China’s overall food security improved greatly but experienced a slight downward trend in 2003. The main obstacles initially entailed grain distribution but then spread to vulnerability- and sustainability-related issues. Ultimately, the key factors restricting China’s food security were the amount of fertilizer application per unit sown area (AFA) and the grain self-sufficiency rate (GSR). The next 40 years could be the most critical period for ensuring China’s food security, which incorporates demographic, climate change, and resource shortage factors. China appears to be implementing its national strategies through sustainable farmland use and agricultural technology innovation to facilitate the high-quality development of its grain industries and strengthen its food security. This study provides an overall picture of China’s food security and can serve as a reference for those concerned with China’s future national security.
1. Introduction
As food is a key determinant of national prosperity and human wellbeing, its security represents a major prerequisite for national security [1]. In recent years, food security has been a concern in both developing and developed regions of the world [2], but the situation is particularly alarming in Asia and Africa, where the number of people experiencing hunger reached 418 million and 282 million in 2020, respectively [3,4]. China, home to one-fifth of the world’s population, faces different degrees of food production pressures. To maintain food security and to meet the demand of a large population, more grain needs to be produced on the 9% of global arable land and using 6% of global water resources, which suggests that future environmental and resource challenges will increase [5]. Further complicating this situation is that climate change, urbanization, and a shift in food habits from cereals to more meat products have caused or will cause great changes in food security in China [6]. Hence, a multidimensional measurement of China’s food security situation will support a more comprehensive and objective assessment of China’s food security situation; quantitative and qualitative evaluations of the obstacles affecting China’s food security status play a crucial role in determining the central goals of China’s food security strategy and agricultural policy.
Food security has emerged as a concern for governments and academia over the past few decades. At the World Food Conference of 1974 in Rome, Italy, food security was defined for the first time as ‘ensuring that all people at all times have access to enough food for survival and health’ [7]. The concept of food security was refined in the 1996 World Food Summit Plan of Action, and ‘when all people, at all times, have physical and economic access to sufficient, safe and nutritious food to meet their dietary needs and food preferences for an active and healthy life’ was the most widely accepted. Since its proposal, the concept of food security has been researched abroad [8]. Some studies have concluded that it focuses on food availability, utilization, and sustainability, while others have characterized it as the eradication of poverty, malnutrition, and hunger [9,10]. Currently, most studies do not adequately consider the potential tension between food sustainability and the other dimensions of food security. In addition, little related research has addressed the application of policies. Thus, in this study, food security is described as a ‘state in which a region or nation can meet the sustainable and ecological standards, and provide people with sufficient nutrition and healthy food that conforms to certain cultural habits and preferences under the government’s macrocontrol and market regulation mechanism’.
Much effort has been made to understand food security in China. In 1995, Lester R. Brown published the book Who Will Feed China?: Wake-Up Call for a Small Planet [11], which sparked worldwide concern about China’s food security. However, Brown seems to have sounded a false alarm. Over recent years, China has been self-reliant in securing its own food supply, and its people have not only enough to eat but also a greater range of choices than previously. Notably, we realize that large populations coupled with an increasing intensity of extreme environmental events, i.e., floods, droughts, and extreme variability in temperature and rainfall, undoubtedly pose a grim challenge to the current food security in China [12,13]. Cultivated land is an essential resource and condition for grain production and the material basis for ensuring the effective supply of grain and other important agricultural products [14]. We should never ignore that due to unsustainable agricultural practices or agricultural land becoming urbanized or lost through, for example, desertification, salinization, or erosion [15]. Therefore, determining how to secure the supply of agricultural products and improve the sustainability of agricultural development under the constraints of limited resources and the need for environmental sustainability is the most important food security challenge that must be overcome [16,17,18]. Moreover, human factors, such as agricultural technology innovation, policy mechanism guarantees, and increases in farmland water-conservation-construction investment, can somewhat mitigate all types of negative impacts [19].
To identify the obstacles restricting food security, much effort has been made to evaluate food security. Several scholars have tried to use a single index, such as the proportion of undernourished individuals in a population [20], average dietary energy supply [21], food self-sufficiency rate [22], and prediction of grain supply and demand [23,24], to describe and evaluate it. Notably, these methods are not appropriate for conducting a specific and comprehensive evaluation. With the continuous enrichment and systematization of the concept of food security, many scholars have applied the comprehensive management evaluation method to describe it. Examples include gray relation analysis (GRA) [25], fuzzy comprehensive evaluation (FCE) [26], artificial neural networks (ANNs) [27], and data envelopment analysis (DEA) [28,29]. Through statistical analysis and calculation, GRA can deal with gray systems with partly clear and partly unclear information based on the correlation degree of factors; however, due to the lack of systematic analyses on the causal relationships between different factors, an objective portrayal of the real food security situation using the conventional tendency method is difficult to achieve. FCE solves the problem of the decision-making objective being fuzzy and difficult to quantify, by introducing the membership degree, but it cannot solve the problem of information duplication caused by the correlation between evaluation indicators. As a deep learning method, ANNs have an adaptive ability and fault tolerance in terms of nonlinear complex systems, but their accuracy is not high due to fewer training samples in practical applications when utilizing this technique. The DEA method evaluates the relative effectiveness of the same type of units according to multi-index input and output based on relative efficiency. However, it only shows the relative development indicators of the evaluation unit and cannot show the actual development level.
Among the various methods developed to solve real-world decision problems, matter–element extension analysis has been widely used in research, such as environmental quality assessment [30], land suitability evaluation [31], and risk assessment in urban network planning [32], but its application in evaluating food security is limited. Compared with traditional methods, the matter–element extension model (MEEM) can address contradictions qualitatively and quantitatively [33]. Moreover, He et al. [32] and Ye [34] found that it is more credible and practical. Therefore, to overcome the abovementioned deficiencies, using both entropy theory and MEEM represents a new approach. The entropy weight method (EWM) is used to determine the weight coefficient of each factor in an analysis, preventing subjectivity in the process of weight determination. Matter–element extension theory is introduced in this paper to determine the membership degree between index and grade using the relation function, thus addressing the problem of fuzzy correspondence between the evaluation index and grade.
The overall goals of this paper are to systematically evaluate food security status, explore the dominant obstacle indicators of China’s food security, and provide policy implications for a path forward. The remainder of the paper is organized as follows. Section 2 introduces the data sources, core model, and research methods. Section 3 discusses the results of the empirical study. Section 4 discusses the results and limitations. The final section summarizes the paper’s conclusions.
2. Materials and Methods
2.1. Evaluation Index System
Since we recognize that designing an evaluation index system is key to the evaluation process, our study concentrates on establishing a reasonable and objective food security evaluation index system. Based on a review of previous studies, this paper considers overall planning for grain availability and grain distribution, fully recognizes the important role of the vulnerability and sustainability of grain production and the effective and economical utilization of resources involved in ensuring food security, and closely integrates government regulation with improving food security. Based on the preceding analysis, an evaluation index system composed of a total of 22 evaluation factors for food security in China is established (Table 1); the system is divided into six major components: availability, distribution, utilization, vulnerability, sustainability, and regulation. Additionally, the selected indicators are in accordance with established principles of integrity, comparability, dynamics, and practicability.

Table 1.
Evaluation index system of China’s food security.
2.2. Data Sources
According to China’s statistical information, grain output covers cereals, beans, and tubers by type of crop. The statistics for total grain production (TGP), output of major farm products, grain imports and exports, planting structure of grain crops (PSG), per capita disposable income of residents (pDIR), affected area of grain crops (AAG), per capita level of government expenditure for supporting local production (pSRP), and proportion of government expenditure for supporting agriculture to agricultural output value (PAGE) were sourced from the Statistical Yearbook published by the National Bureau of Statistics of China and the China Rural Statistical Yearbook for various years from 1991 to 2020. The historical annual data used in this paper were collected from the Achievements of New China’s Economic and Social Development in 70 Brilliant Years (1949–2019), which includes the length of highways and railways, the amount of agricultural fertilizer application, the sown area of grain crops and the effective irrigation area.
The poverty incidence was derived from the Poverty Monitoring Report of Rural, China. The grain price volatility index was obtained from the annual data published in the China Urban Life and Price Yearbook. The data on the prevalence of undernourishment (3-year average) and cereal stock variation came from FAOSTAT Data of the FAO (United Nations). Natural disaster statistics were downloaded from the Emergency Events Database (EM-DAT) of the Center for Research on the Epidemiology of Disasters (CRED) (http://www.emdat.be/ accessed on 9 March 2021). Missing data were supplemented through the interpolation method.
2.3. Methods
2.3.1. Matter–Element Extension Model
Cai [33] first proposed the MEEM, which is mainly used to conduct comprehensive multifactor evaluation involving complex contradictions. Based on the definition of each index state evaluation grade, the MEEM can obtain more comprehensive and rich evaluation information by selecting the interval division of the index and analyzing the correlation degree of each influencing factor according to the subordinate relationship of the data, which reflects the change trend of the safety grade among the indexes.
The MEEM assumes that matter, denoted by , has a characteristic represented by and a value for the characteristic denoted by [33]. In this paper, the ordered triad composed of the matter (), characteristic (), and value of the characteristic () can be represented by , which constitutes the basic matter–element of food security evaluation. The matter–element has n-dimensional characteristics, and the matter–element is as follows:
To effectively evaluate China’s food security, the evaluation results of food security are divided into five grades: I (insecurity), II (critical security), III (basic security), IV (comparative security), and V (security). According to the overall value range of the grading standard of the food security evaluation index, the node domain () is determined. The classical domain () of food security evaluation of grades I–V is divided by the equipartition method. Additionally, the evaluation index set consists of 22 specific evaluation indicators.
where = {I, II, III, IV, and V} represents all the assessment grades. is the range of characteristics , denoted as the node domain of , and represent the value range of the grade ( = I, II,…, V) in the matter–element system, that is, the classical domain taken by the evaluation index of each grade on the object, corresponding to the variation range of the value of each single-factor parameter in a certain category.
Based on the node domain and classical domain introduced above, a correlation function can be established to quantify the correlation degree .
Here, and represent the distances between and the classical domain and the node domain , respectively. The variable is the module of the bounded interval of the upper limit and lower limit of grade for parameter . Based on the weights from the EWM, the weighted correlation degree is calculated using formula (7).
In this paper, is the weight of each index obtained by the EWM. expresses the correlation between the evaluation sample and its corresponding grade. According to the maximum recognition principle of the correlation degree, indicates that the evaluation object belongs to grade .
2.3.2. Obstacle Degree Model
The obstacle degree model (ODM) can identify and analyze influencing factors, determine the key factors that have a major impact on the evaluation results, clarify the impact degree of key constraints, and help achieve sustainable development of grain output and better ensure China’s food security [35,36,37]. Therefore, this paper introduces index contribution , indicator deviation , and obstacle degree to identify the obstacle degree of the factors affecting food security. The calculation method is as follows:
where represents the obstacle degree of the th indicator on the safety state, which means the influence degree of each indicator or unit on the overall food security status. is the normalized value of the single index, and refers to the deviation degree of the indicator, which represents the difference between the actual indicator value and the optimal target value.
3. Results
3.1. Change Trend in China’s Food Security
A trend map of food security in China from 2001 to 2020 can be drawn according to the comprehensive correlation degree and evaluation grade (see Table A1 for more details). As shown in Figure 1, except for a state of relative insecurity in 2003, China’s overall food security displayed a substantial upward trend with fluctuations during this period. In 2003, the planting area of grain crops in China was less than 100 million hectares, accounting for 65.2% of the total sown area of crops, a record low level [38]. Another possible explanation for this might be that China’s food security is affected by international grain prices and the affordability of food for its residents. Affected by the significant reduction in food production in 2003, China’s food market prices rose for the first time in six years, and international food prices also increased.
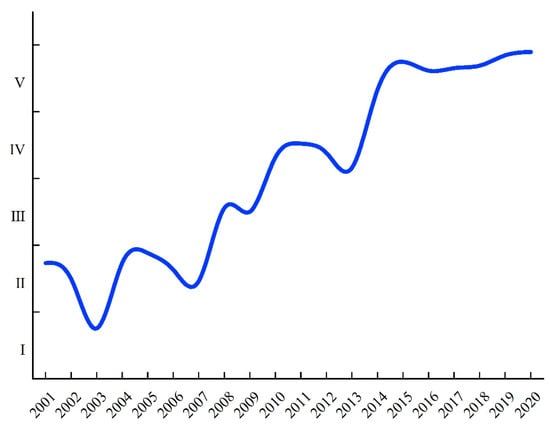
Figure 1.
Trend map of China’s food security grades from 2001 to 2020.
After 2003, China welcomed 17 consecutive large harvests. There were adequate grain supplies and reserves and a stable grain market, which are indicators of increasing food security. However, the fluctuation in the comprehensive correlation degree curve of food security suggests that China’s food security cannot be guaranteed only by an increase in total grain output, as it is based on the joint effect of multiple factors. Therefore, it depends on maintaining the sustainability and stability of agricultural production based on steadily improving food production, prioritizing the protection of resources and the environment, strengthening agricultural infrastructure construction, improving agricultural production capacity and risk response capacity, and ensuring its long-term stability.
3.2. Factors Restricting China’s Food Security
Figure 2 reflects the change trend of the unit obstacle degrees for China’s food security: availability, distribution, utilization, vulnerability, sustainability, and regulation from 2001 to 2020 (see Table A2 for more details). Figure 3 shows the heatmap of each index after normalization of the obstacle degree from 2011 to 2020. Generally, the obstacle degrees of vulnerability and sustainability displayed a slow upward trend, while grain distribution as an obstacle exhibited a downward trend in volatility, and both utilization efficiency and government regulation displayed a small downward trend and then remained at a lower level.
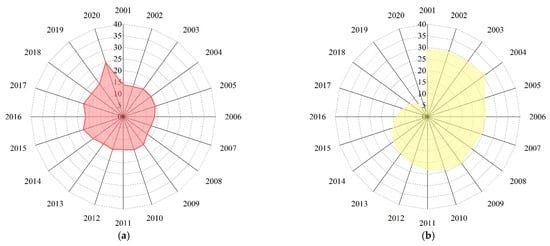
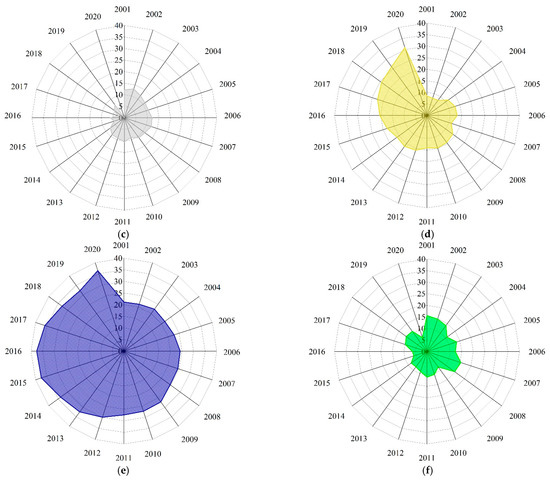
Figure 2.
Radar chart of the obstacle degree of each unit from 2001 to 2020. (a) Availability, (b) distribution, (c) utilization, (d) vulnerability, (e) sustainability and (f) regulation.
Figure 3.
Heatmap of the obstacle degree of each index from 2011 to 2020.
It is generally accepted that adequate food availability is the ‘ballast stone’ of food security and a critical factor for responding effectively to international market shocks. During 2001–2019, overall food availability remained stable, and grain availability as an obstacle was approximately 15%, while the degree to which grain availability was an obstacle increased to 24.6% in 2020 (Figure 2a). As noted, China’s GY and TGP have been increasing, especially since 2003. Grain production has experienced seventeen years of consecutive production increases, and grain availability has generally been stable. However, the obstacle degree of food availability increased in 2020, and the GSR has also gradually emerged as an obstacle, mainly because net grain imports in 2020 were 30.3 million tons more than in 2019, an increase of 1.3% (in 2019, imported wheat, corn, and soybeans totaled 3.5, 4.8, and 88.5 million tons, respectively, compared to 8.4, 11.2, and 100.3 million tons in 2020) [39,40]. At present, China’s GSR exceeds 95% [41], which provides a solid foundation for ensuring China’s food security and promoting economic and social development as well as long-term national stability.
Grain distribution has always been the most important factor affecting China’s food security. Since entering the new century, China has substantially improved its transportation construction and infrastructure, the national economy has developed rapidly and stably, and grain distribution as an obstacle to China’s food security has decreased dramatically, from 28.9% in 2001 to 9.4% in 2020 (Figure 2b). After years of infrastructure construction, China’s transportation conditions have greatly improved, and railway and highway mileage are increasing, which play a positive role in ensuring China’s grain circulation. According to the National Bureau of Statistics of China, by the end of 2000, the first national trunk line of the Beijing and Shanghai Expressway was fully connected, Chinese mainland expressway mileage had reached 16,000 km, railway business mileage was 687,000 km, and the grain freight ton-kilometers was 101.3 billion ton-km. However, by the end of 2020, mainland Chinese highway mileage was 5.2 million kilometers, of which China’s 161,000 km of expressways ranked first in the world. The length of China’s railways in operation reached 146,300 km, also ranked first worldwide, with grain freight traffic at 75.7 million tons and grain freight ton-kilometers at 139.2 billion [40,42]. Meanwhile, China’s achievements in transportation development were the dominant factor effectively promoting rapid economic and social development and providing a solid guarantee that residents could obtain sufficient food for consumption. Since the onset of reform and opening up, China’s economy has developed rapidly. In 2000, China’s GDP exceeded RMB 10 trillion, with China becoming the world’s sixth-largest economy. In 2020, China’s GDP reached RMB 101 trillion, and the per capita gross national income was RMB 71,489, which was higher than the average level of middle-income countries, substantially improving the food availability capacity of urban and rural residents [40,42].
As shown in Figure 2d,e, the vulnerability of China’s food security experienced rapid growth from 8.4% to 31.0%, while the obstacle of sustainability experienced a slow upward trend from 21.2% to 36.4% between 2001 and 2020. With multifaceted changes in the global climate, the frequent occurrence of extreme natural disasters has strengthened the link between food security stability and extreme climate change. Furthermore, whether agriculture can achieve sustainable development depends on the sustainable supply of natural resources, the most important of which are water resources and cultivated land. On the one hand, coincident with the rapid development of contemporary society, the contradiction between agricultural water shortages and increasing demand for domestic water has become more prominent. Another limitation is that China’s rainwater resources are unevenly distributed, and there are large seasonal differences. On the other hand, at present, more than 116 million hectares are sown with grain, an increase of approximately 8.3 million hectares over 2000 [40]. Although the foundations of grain production have been strengthened, it is worth noting that the AFA has become the largest obstacle affecting food security in the past decade. The continuous decline in the quality of cultivated land is destroying farmland ecosystems and endangering human health, which significantly restricts China’s grain production ability.
Figure 2c,f show the obstacle degrees of utilization efficiency and government regulation restricting China’s food security during 2001–2020. It is also found that utilization efficiency and government regulation had little impact on food security, showing a small decline in fluctuations, indicating that the continuous increase in China’s food security is closely related to agricultural and rural support and government financial support. The popularization and application of agricultural science and technology have played a positive role, substantially reducing the grain loss rate at various stages, such as processing, storage, and circulation. Additionally, the Chinese government has instituted a series of national policies to support, benefit, and enrich agriculture and further alleviate poverty, resulting in noticeable improvements to nutrition and health.
Table 2 presents the primary obstacle indicators among the 22 indicators of China’s food security during 2011–2020. The table shows that the top five obstacle factors are mainly reflected in the sustainability and vulnerability of food security. Specifically, during 2011–2020, the largest limiting factor affecting food security was the AFA. This suggests that there are large differences in land quality grades across the country. When there is insufficient fertile cultivated land, soil fertility is improved by increasing the application of chemical fertilizer, which severely restricts sustainable agricultural production. Meanwhile, from 2011 to 2014, the status of grain distribution also affected China’s food security, and pDIR became the second-largest risk factor. However, since 2014, the GSR has gradually become the second-largest risk factor limiting the development of China’s food security. As discussed, this is because of the rapid increase in corn and soybean imports; China’s actual grain self-sufficiency rate has shown an overall downward trend, the structural contradiction of grain varieties in China has intensified, and the development of the agricultural structure has become unbalanced. In addition, the GRL and pSA have declined slowly, which indicates that China’s grain production is insufficiently stable and hinders food security development. In recent years, restricted by natural conditions, climate change, market conditions, and other factors, the stability of food production has also had a crucial impact on China’s food security.
Table 2.
Top five obstacle indicators of China’s food security during 2011–2020.
4. Discussion
4.1. China’s Food Security
In this work, we use a scientific method to comprehensively and effectively evaluate China’s food security, which plays a crucial role in determining the central goals of China’s food security strategy and agricultural policy. China’s food security status increased gradually from 2001 to 2020 but exhibited a slight downward trend in 2003. These results indicate that China’s overall food security has been consistently improving. Our findings are supported by Wu et al. [43] and Yao et al. [44], who found that the grain sowing area decreased and the planting area of cash crops increased amid changes to China’s agricultural structure in 2003, resulting in a significant reduction in China’s total grain output.
Adequate grain availability is the fundamental factor affecting food security. The rapid development of agricultural science and technology does seem to steadily improve China’s comprehensive grain production capacity. However, China is the world’s largest grain importer and imports a large amount of grain every year [45]. Cereal has basically achieved full self-sufficiency, consistent with several populous developing countries, though lower than developed countries, but soybean self-sufficiency has declined significantly [29]. In 2020, 73.0% of China’s imported rice came from Vietnam, Pakistan, Thailand, and Cambodia. In addition to rice, the sources of wheat and corn are mainly concentrated in resource-rich countries or regions such as the United States, Brazil, Argentina, and the European Union [46]. China’s soybean dependence on foreign countries reached a very high level. Specifically, China’s soybean imports enjoyed rapid growth from 13.9 to 100.3 million tons between 2001 and 2020. The main soybean importers are Brazil, the United States, and Argentina, with Brazil accounting for 64% of the total [47,48]. Therefore, changes to agricultural layouts and grain planting structures should be further promoted; grain planting areas should be stabilized; and potatoes, beans, miscellaneous grains, and other crops should be developed according to local conditions.
Agricultural costs are still rising, and resource and environmental carrying capacity is surpassing its limit [49]. We speculate that due to China’s low agricultural production capacity and extensive agricultural management, the ecological environment was extremely fragile, which hindered the improvement in grain production capacity to a large extent. In 2019, the consumption of chemical fertilizers for agriculture exceeded 55 million tons, and the AFA of farm crops remained at 325 kg/ha, far higher than the global average (120 kg/ha). Other data show that in 2019, the amount of pesticide application was 8.7 kg/ha, 3.3 times the global average [50]. The data contribute a clear understanding that China’s agriculture remains extensive and that technical knowledge, economic efficiency, and economies of scale are low. Agricultural producers often adopt excessive and predatory production modes; use large amounts of chemicals, such as pesticides, chemical fertilizers, and herbicides; and discharge livestock and poultry waste and domestic pollutants indiscriminately, resulting in the degradation and desertification of cultivated land resources. Agricultural infrastructure is comparatively weak, and the capacity for disaster prevention and relief must be improved. Moreover, unpredictable weather has led to a sharp decline in grain production and residents’ incomes in vulnerable areas and a sharp increase in the risk of food insecurity [51,52]. China will find itself under considerable pressure to maintain steady grain production, while ensuring green development and sustainable resource use. Thus, agricultural producers should control the application of chemical fertilizers and pesticides according to soil fertility, continue to strengthen the treatment of agricultural nonpoint source pollution, and seek to achieve high-quality agricultural development.
The results demonstrate that the overall situation of China’s food security has been significantly improved but is not balanced in different dimensions. Our findings are in accord with recent studies indicating that large populations, climate change, and reduced resources are the prevailing challenges to current food security in most developing countries [12,13,53]. Pakistan, for example, faces significant future challenges to feed a growing population, given that the area of crop production is limited by the availability of fresh water for irrigation [54,55,56]. The international community has launched a wide range of discussions and cooperation in recent years to control greenhouse gas emissions [57]. To fulfil the international commitments of reducing carbon emissions, the Chinese government pledged to peak its growing carbon emissions by 2030 and a vision of achieving carbon neutrality by 2060 [58]. However, global major crops are sensitive to climate change, including changes in temperature, precipitation, and atmospheric carbon dioxide concentration [59,60,61]. The next 40 years could be the most critical period for ensuring China’s food security, which incorporates demographic, climate change, and resource shortage factors.
In view of severe food security challenges, China has a long way to go to facilitate the high-quality development of its grain industries and strengthen the food security guarantee. China will implement its national strategies for food security through sustainable farmland use and agricultural technology innovation to increase farmland productivity [62]. At present, China has carried out soil testing and formula fertilization; popularized the practice of returning straw to the field, green manure planting, the application of organic fertilizer, soil improvement, and other supporting technologies; and steadily improved the quality of cultivated land. China will continue to innovate in the seed industry, making breakthroughs in core technologies such as germplasm improvement and the creation, efficient cultivation, processing, and circulation of new crop varieties. China will enhance integrated technological innovation, breaking logjams in improving per unit area yield, crop quality, economic benefits, and the environment. At the same time, China intends to strengthen macroeconomic regulation and its support of agriculture, promote mechanization in agriculture, transform and upgrade the agricultural machinery industry, increase the grain supply, and improve grain quality through the application of agronomy and agrotechniques.
4.2. Limitations and Future Research Directions
Although this paper provides a more objective and practical food security evaluation system for China based on current circumstances, it suffers from several limitations and uncertainties. For one, the meaning of food security is far broader than the current index system reflects. In addition, because of data limitations, it was difficult for this study to provide a comprehensive analysis of food security. In future research, we will further analyze China’s food security according to the structural characteristics of grain crops to ensure that our results are more comprehensive.
5. Conclusions
In this study, we developed a new framework using six influencing units of food security (availability, distribution, utilization, vulnerability, sustainability, and regulation) to comprehensively measure China’s food security status in a changing world. We first constructed a more suitable and operational food security evaluation system for China based on current circumstances by adopting the EWM. Second, we examined China’s food security grade between 2001 and 2020 through the MEEM. Finally, the ODM was used to investigate the key obstacles restricting China’s food security. The conclusion of this study is based on the analysis of the influencing factors as a whole, and the results elucidate the steps that China should take to ensure its food security. The main conclusions are as follows.
- (1)
- Except for a slight downward trend in 2003, China’s overall food security displayed a substantial upward trend during 2001–2020. The fluctuation in the comprehensive correlation degree trend map of food security suggests that China’s food security cannot be guaranteed only by an increase in total grain output but involves the joint effect of many factors. The next 40 years could be the most critical period for ensuring China’s food security, which incorporates demographic, climate change, and resource shortage factors. Therefore, to fully modernize China’s agriculture, the food security strategy must be consistent with stable agricultural production and a sustainable development strategy.
- (2)
- According to the change trend of China’s food security, in terms of the obstacle degrees of the indicators between 2001 and 2020, the obstacle degree of grain distribution exhibited a strong downward trend, while vulnerability and sustainability displayed a slow upward trend. China is a country with a large population and few resources; thus, China’s per capita share of various resources is extremely small. With the shortage of cultivated land and water resources available for agriculture, issues related to resources and the environment have become a bottleneck restricting the strength and sustainability of food security in China.
- (3)
- It is worth noting that AFA and GSR have gradually become obstacles to the development of China’s food security. The long-term use of pesticides and chemical fertilizers may have resulted in a shortage of agricultural resources, restricting the potential to expand agricultural reproduction. Moreover, the high degree of dependence on foreign countries for soybeans and the primary grain structural conflicts that such dependence involves represent a potential threat to China’s food security. Thus, China appears to be implementing its national strategies through sustainable farmland use and agricultural technology innovation to facilitate the high-quality development of its grain industries and strengthen food security.
Author Contributions
Conceptualization, Y.Z. and X.L.; methodology, X.L.; software, Y.Z.; data curation, Y.Z.; writing—original draft preparation, Y.Z. and X.L.; writing—review and editing, Y.Z.; supervision, X.L. All authors have read and agreed to the published version of the manuscript.
Funding
This research was funded by the National Social Science Fund of China, grant number 17BGL008; and the Science and Technology Project of the Education Department of Jiangxi Province, grant numbers GJJ207105, GJJ216802, and GJJ216810.
Institutional Review Board Statement
Not applicable.
Informed Consent Statement
Not applicable.
Data Availability Statement
Not applicable.
Conflicts of Interest
The authors declare no conflict of interest.
Appendix A
Appendix A.1. Comprehensive Correlation Degree and Evaluation Grade of China’s Food Security
The comprehensive correlation degree and evaluation grade of China’s food security can be calculated by Formulas (7) and (8), as presented in Table A1.
Table A1.
Comprehensive correlation degrees and grades of China’s food security during 2001–2020.
Table A1.
Comprehensive correlation degrees and grades of China’s food security during 2001–2020.
| I | II | III | IV | V | Grade | ||
|---|---|---|---|---|---|---|---|
| −0.1022 | −0.0538 | −0.3123 | −0.4865 | −0.6292 | −0.0538 | I | |
| −0.1294 | −0.1018 | −0.3081 | −0.5038 | −0.6053 | −0.1018 | II | |
| −0.0492 | −0.2155 | −0.4027 | −0.5267 | −0.6438 | −0.0492 | I | |
| −0.1911 | −0.0528 | −0.3319 | −0.4765 | −0.5636 | −0.0528 | II | |
| −0.2602 | −0.0235 | −0.1852 | −0.3791 | −0.5464 | −0.0235 | II | |
| −0.2624 | −0.0736 | −0.1954 | −0.3573 | −0.5375 | −0.0736 | II | |
| −0.2447 | −0.1076 | −0.1733 | −0.3578 | −0.5293 | −0.1076 | II | |
| −0.3168 | −0.1120 | −0.0883 | −0.2865 | −0.4777 | −0.0883 | III | |
| −0.3801 | −0.2333 | −0.0995 | −0.2558 | −0.4033 | −0.0995 | III | |
| −0.3839 | −0.2974 | −0.1394 | −0.1364 | −0.3817 | −0.1364 | IV | |
| −0.4250 | −0.3730 | −0.2383 | −0.0957 | −0.3350 | −0.0957 | IV | |
| −0.4903 | −0.4135 | −0.2854 | −0.1235 | −0.2369 | −0.1235 | IV | |
| −0.5094 | −0.4833 | −0.3179 | −0.1683 | −0.1892 | −0.1683 | IV | |
| −0.5525 | −0.5361 | −0.4267 | −0.2038 | −0.1336 | −0.1336 | V | |
| −0.6077 | −0.6103 | −0.5360 | −0.3333 | −0.0505 | −0.0505 | V | |
| −0.6048 | −0.5555 | −0.5187 | −0.2709 | −0.0770 | −0.0770 | V | |
| −0.6175 | −0.5869 | −0.5745 | −0.3562 | −0.0696 | −0.0696 | V | |
| −0.6168 | −0.5891 | −0.5578 | −0.3209 | −0.0619 | −0.0619 | V | |
| −0.6655 | −0.5922 | −0.5992 | −0.4118 | −0.0313 | −0.0313 | V | |
| −0.7123 | −0.6720 | −0.7164 | −0.6238 | −0.0209 | −0.0209 | V |
Appendix A.2. Obstacle Degree of Six Units Relating to China’s Food Security
The obstacle degree of each unit restricting the development of China’s food security during 2001–2020 is identified based on the ODM, as presented in Table A2.
Table A2.
Obstacle degree of six units relating to China’s food security during 2001–2020.
Table A2.
Obstacle degree of six units relating to China’s food security during 2001–2020.
| Year | Availability | Distribution | Utilization | Vulnerability | Sustainability | Regulation |
|---|---|---|---|---|---|---|
| 2001 | 13.82 | 28.90 | 12.11 | 8.43 | 21.15 | 15.59 |
| 2002 | 13.69 | 29.26 | 13.15 | 7.87 | 21.25 | 14.78 |
| 2003 | 14.70 | 29.04 | 11.86 | 8.12 | 22.38 | 13.90 |
| 2004 | 14.82 | 30.44 | 11.01 | 11.31 | 21.78 | 10.65 |
| 2005 | 14.54 | 25.70 | 10.86 | 12.74 | 22.73 | 13.43 |
| 2006 | 13.55 | 24.97 | 11.96 | 13.05 | 24.24 | 12.23 |
| 2007 | 12.71 | 24.18 | 12.23 | 11.05 | 24.45 | 15.37 |
| 2008 | 12.76 | 23.09 | 11.00 | 13.79 | 24.63 | 14.73 |
| 2009 | 14.89 | 24.78 | 10.68 | 14.43 | 27.06 | 8.16 |
| 2010 | 15.09 | 23.59 | 8.90 | 14.82 | 27.25 | 10.36 |
| 2011 | 14.22 | 22.83 | 10.42 | 14.01 | 27.49 | 11.03 |
| 2012 | 14.84 | 21.17 | 9.20 | 15.82 | 29.93 | 9.04 |
| 2013 | 14.49 | 19.49 | 9.04 | 16.52 | 32.37 | 8.09 |
| 2014 | 16.13 | 18.21 | 7.51 | 16.01 | 33.74 | 8.40 |
| 2015 | 18.17 | 15.77 | 4.57 | 18.12 | 37.40 | 5.98 |
| 2016 | 16.33 | 13.32 | 6.04 | 20.45 | 37.58 | 6.28 |
| 2017 | 18.06 | 10.98 | 2.89 | 22.46 | 35.77 | 9.83 |
| 2018 | 16.94 | 9.43 | 5.29 | 24.32 | 32.94 | 11.07 |
| 2019 | 17.49 | 6.50 | 6.99 | 26.07 | 32.15 | 10.80 |
| 2020 | 24.63 | 1.69 | 2.53E-03 | 30.95 | 36.42 | 6.32 |
References
- Prosekov, A.Y.; Ivanova, S.A. Food Security: The Challenge of the Present. Geoforum 2018, 91, 73–77. [Google Scholar] [CrossRef]
- Sternberg, T.; McCarthy, C.; Hoshino, B. Does China’s Belt and Road Initiative Threaten Food Security in Central Asia? Water 2020, 12, 2690. [Google Scholar] [CrossRef]
- Usman, M.A.; Callo-Concha, D. Does Market Access Improve Dietary Diversity and Food Security? Evidence from Southwestern Ethiopian Smallholder Coffee Producers. Agric. Food Econ. 2021, 9, 1–21. [Google Scholar] [CrossRef]
- Grote, U.; Fasse, A.; Nguyen, T.; Erenstein, O. Food Security and the Dynamics of Wheat and Maize Value Chains in Africa and Asia. Front. Sustain. Food Syst. 2021, 4, 617009. [Google Scholar] [CrossRef]
- Huang, J.; Yang, G. Understanding Recent Challenges and New Food Policy in China. Glob. Food Secur. 2017, 12, 119–126. [Google Scholar] [CrossRef]
- Chen, L.; Chang, J.X.; Wang, Y.M.; Guo, A.J.; Liu, Y.Y.; Wang, Q.Q.; Zhu, Y.L.; Zhang, Y.; Xie, Z.Y. Disclosing the Future Food Security Risk of China Based on Crop Production and Water Scarcity under Diverse Socioeconomic and Climate Scenarios. Sci. Total Environ. 2021, 790, 148110. [Google Scholar] [CrossRef]
- Report of the World Food Conference, Rome, 5–16 November 1974; UN: New York, NY, USA, 1975.
- Rome Declaration on Food Security and World Food Summit Plan of Action; FAO: Rome, Italy, 1996.
- Coates, J. Build It Back Better: Deconstructing Food Security for Improved Measurement and Action. Glob. Food Secur. 2013, 2, 188–194. [Google Scholar] [CrossRef]
- Berry, E.M.; Dernini, S.; Burlingame, B.; Meybeck, A.; Conforti, P. Food Security and Sustainability: Can One Exist without the Other? Public Health Nutr. 2015, 18, 2293–2302. [Google Scholar] [CrossRef]
- Brown, L.R. Who Will Feed China? Wake-Up Call for a Small Planet; WW Norton & Company: New York, NK, USA, 1995; Volume 6. [Google Scholar]
- Ali, S.; Liu, Y.; Ishaq, M.; Shah, T.; Ilyas, A.; Din, I.U. Climate Change and Its Impact on the Yield of Major Food Crops: Evidence from Pakistan. Foods 2017, 6, 39. [Google Scholar] [CrossRef]
- Esham, M.; Jacobs, B.; Rosairo, H.S.R.; Siddighi, B.B. Climate Change and Food Security: A Sri Lankan Perspective. Environ. Dev. Sustain. 2018, 20, 1017–1036. [Google Scholar] [CrossRef]
- Ramankutty, N.; Mehrabi, Z.; Waha, K.; Jarvis, L.; Kremen, C.; Herrero, M.; Rieseberg, L.H. Trends in Global Agricultural Land Use: Implications for Environmental Health and Food Security. Annu. Rev. Plant Biol. 2018, 69, 789–815. [Google Scholar] [CrossRef] [PubMed]
- Liu, M.; Pan, T.; Allakhverdiev, S.I.; Yu, M.; Shabala, S. Crop Halophytism: An Environmentally Sustainable Solution for Global Food Security. Trends Plant Sci. 2020, 25, 630–634. [Google Scholar] [CrossRef] [PubMed]
- Kang, S.Z.; Hao, X.M.; Du, T.S.; Tong, L.; Su, X.L.; Lu, H.N.; Li, X.L.; Huo, Z.L.; Li, S.; Ding, R.S. Improving Agricultural Water Productivity to Ensure Food Security in China under Changing Environment: From Research to Practice. Agric. Water Manag. 2017, 179, 5–17. [Google Scholar] [CrossRef]
- Ding, Q.; Chen, Y.; Bu, L.; Ye, Y. Multi-scenario Analysis of Habitat Quality in the Yellow River Delta by Coupling FLUS with InVEST Model. Int. J. Environ. Res. Public Health 2021, 18, 2389. [Google Scholar] [CrossRef]
- Lu, S.; Bai, X.; Li, W.; Wang, N. Impacts of Climate Change on Water Resources and Grain Production. Technol. Forecast. Soc. Change 2019, 143, 76–84. [Google Scholar] [CrossRef]
- Lassa, J.A.; Teng, P.; Caballero-Anthony, M.; Shrestha, M. Revisiting Emergency Food Reserve Policy and Practice under Disaster and Extreme Climate Events. Int. J. Disaster Risk Sci. 2019, 10, 1–13. [Google Scholar] [CrossRef]
- Pampori, Z.A. Saga of Hunger in India-Challenges, Chances and Resolutions: A Review. Asian J. Dairy Food Res. 2021, 40, 398–407. [Google Scholar] [CrossRef]
- Li, H.; Zhang, X. A Spatial Explicit Assessment of Food Security in Africa Based on Simulated Crop Production and Distribution. J. Clean. Prod. 2017, 147, 628–636. [Google Scholar] [CrossRef]
- Niu, Y.N.; Xie, G.D.; Xiao, Y.; Liu, J.Y.; Wang, Y.Y.; Luo, Q.; Zou, H.X.; Gan, S.; Qin, K.Y.; Huang, M.D. Spatiotemporal Patterns and Determinants of Grain Self-sufficiency in China. Foods 2021, 10, 747. [Google Scholar] [CrossRef]
- Qi, X.; Vitousek, P.M.; Liu, L. Provincial Food Security in China: A Quantitative Risk Assessment Based on Local Food Supply and Demand Trends. Food Secur. 2015, 7, 621–632. [Google Scholar] [CrossRef]
- van Dijk, M.; Morley, T.; Rau, M.L.; Saghai, Y. A Meta-analysis of Projected Global Food Demand and Population at Risk of Hunger for the Period 2010–2050. Nat. Food 2021, 2, 494–501. [Google Scholar] [CrossRef]
- Kepei, M.; Beijun, W.; Sasa, T.; Liangyu, J. China’s Grain Security Warning Based on the Integration of AHP-GRA. In Proceedings of the 2009 IEEE International Conference on Grey Systems and Intelligent Services (GSIS 2009), Nanjing, China, 10–12 November 2009; IEEE: Piscataway, NJ, USA, 2009; pp. 655–659. [Google Scholar]
- Yang, L.; Hua, D. Study on the Risk Analysis and the Risk Assessment Index System of Grain Security in China. Res. Agric. Mod. 2014, 35, 696–702. (In Chinese) [Google Scholar]
- Barba-Escoto, L.; van Wijk, M.T.; López-Ridaura, S. Non-linear Interactions Driving Food Security of Smallholder Farm Households in the Western Highlands of Guatemala. Front. Sustain. Food Syst. 2020, 4, 51. [Google Scholar] [CrossRef]
- Yin, C.J.; Li, G.C.; Ge, J.F. Food Security, Climate Change and Grain Productivity Growth Based on HP Filter and Sequential DEA Methods. Resour. Sci. 2016, 38, 665–675. (In Chinese) [Google Scholar]
- Lyu, D.; Sun, J. China’s Grain Trade Research Based on DEA Model of National Food Security Perspective: Soybean as an Example. Teh. Vjesn. 2021, 28, 609–615. [Google Scholar]
- Li, P.; Li, X.; Meng, X.; Li, M.; Zhang, Y. Appraising Groundwater Quality and Health Risks from Contamination in a Semiarid Region of Northwest China. Expo. Health 2016, 8, 361–379. [Google Scholar] [CrossRef]
- Han, C.; Chen, S.; Yu, Y.; Xu, Z.; Zhu, B.; Xu, X.; Wang, Z. Evaluation of Agricultural Land Suitability Based on RS, AHP, and MEA: A Case Study in Jilin Province, China. Agriculture 2021, 11, 370. [Google Scholar] [CrossRef]
- He, Y.X.; Dai, A.Y.; Zhu, J.; He, H.Y.; Li, F. Risk Assessment of Urban Network Planning in China Based on the Matter-element Model and Extension Analysis. Int. J. Electr. Power Energy Syst. 2011, 33, 775–782. [Google Scholar] [CrossRef]
- Cai, W. Extension Theory and Its Application. Chin. Sci. Bull. 1999, 44, 1538–1548. [Google Scholar] [CrossRef]
- Sun, X.; Zhou, Z.; Wang, Y. Water Resource Carrying Capacity and Obstacle Factors in the Yellow River Basin Based on the RBF Neural Network Model. Environ. Sci. Pollut. Res. 2022, 1–17. [Google Scholar] [CrossRef]
- Wei, L.; Zhang, Y.; Wang, L.; Cheng, Z.; Wu, X. Obstacle Indicators Diagnosis and Advantage Functions Zoning Optimization Based on “Production-Living-Ecological” Functions of National Territory Space in Jilin Province. Sustainability 2022, 14, 4215. [Google Scholar] [CrossRef]
- Yang, H.; Tan, Y.; Sun, X.; Cheng, X.; Liu, G.; Zhou, G. Comprehensive Evaluation of Water Resources Carrying Capacity and Analysis of Obstacle Factors in Weifang City Based on Hierarchical Cluster Analysis-VIKOR Method. Environ. Sci. Pollut. Res. 2021, 28, 50388–50404. [Google Scholar] [CrossRef] [PubMed]
- Ye, J. Application of Extension Theory in Misfire Fault Diagnosis of Gasoline Engines. Expert Syst. Appl. 2009, 36, 1217–1221. [Google Scholar] [CrossRef]
- China Statistical Yearbook 2003; National Bureau of Statistics: Beijing, China, 2003.
- China Statistical Yearbook 2019; National Bureau of Statistics: Beijing, China, 2019.
- China Statistical Yearbook 2020; National Bureau of Statistics: Beijing, China, 2020.
- World Food and Agriculture-Statistical Yearbook; FAO: Rome, Italy, 2021.
- China Statistical Yearbook 2000; National Bureau of Statistics: Beijing, China, 2000.
- Wu, W.; Yang, P.; Tang, H.; You, L.; Zhou, Q.; Chen, Z.; Shibasaki, R. Global-scale Assessment of Potential Future Risks of Food Insecurity. J. Risk Res. 2011, 14, 1143–1160. [Google Scholar] [CrossRef]
- Yao, C.S.; Huang, L.; Lyu, X. Evaluation on Central China’s Food Security Situation and Its Guarantee Ability to China. Areal Res. Dev. 2015, 34, 149–154. (In Chinese) [Google Scholar]
- Zhao, F.; Sun, P.; Zhang, J. Modeling the Grain Import Trade: A Cointegration Analysis of China’s Panel Data. Discret. Dyn. Nat. Soc. 2021, 2021, 3673282. [Google Scholar] [CrossRef]
- Duan, J.; Xu, Y.; Jiang, H. Trade Vulnerability Assessment in the Grain-importing Countries: A Case Study of China. PLoS ONE 2021, 16, e0257987. [Google Scholar] [CrossRef]
- Lv, M.K.; Zhang, L.J.; Qin, Y.C.; Zhang, M.M.; Yang, J.X.; Yu, Y. Spatiotemporal Pattern of Chinese Food Trade and Structural Security Assessment,1987–2016. Resour. Sci. 2021, 43, 838–848. [Google Scholar]
- Min, F.; Qinghua, X. Study on the Current Status of China’s Food Security Based on Multiple Dimensions Measurement. Int. J. Econ. Financ. Manag. Sci. 2018, 6, 224. [Google Scholar] [CrossRef]
- Béné, C. Resilience of Local Food Systems and Links to Food Security—A Review of Some Important Concepts in the Context of COVID-19 and Other Shocks. Food Secur. 2020, 12, 805–822. [Google Scholar] [CrossRef]
- Wang, X.J.; He, Y.P.; Jiang, H.P. Food Security during the 14th Five-Year Plan Period: Situation, Problems and Countermeasures. Reform 2020, 9, 27–39. (In Chinese) [Google Scholar]
- Abid, M.; Schneider, U.A.; Scheffran, J. Adaptation to Climate Change and Its Impacts on Food Productivity and Crop Income: Perspectives of Farmers in Rural Pakistan. J. Rural Stud. 2016, 47, 254–266. [Google Scholar] [CrossRef]
- Xu, X.; Hu, H.; Tan, Y.; Yang, G.; Zhu, P.; Jiang, B. Quantifying the Impacts of Climate Variability and Human Interventions on Crop Production and Food Security in the Yangtze River Basin, China, 1990–2015. Sci. Total Environ. 2019, 665, 379–389. [Google Scholar] [CrossRef] [PubMed]
- Jain, M.; Singh, B.; Srivastava, A.A.K.; Malik, R.K.; McDonald, A.J.; Lobell, D.B. Using Satellite Data to Identify the Causes of and Potential Solutions for Yield Gaps in India’s Wheat Belt. Environ. Res. Lett. 2017, 12, 094011. [Google Scholar] [CrossRef]
- Qureshi, A.S.; Perry, C. Managing Water and Salt for Sustainable Agriculture in the Indus Basin of Pakistan. Sustainability 2021, 13, 5303. [Google Scholar] [CrossRef]
- Yaqoob, N.; Ali, S.A.; Kannaiah, D.; Khan, N.; Shabbir, M.S.; Bilal, K.; Tabash, M.I. The Effects of Agriculture Productivity, Land Intensification, on Sustainable Economic Growth: A Panel Analysis from Bangladesh, India, and Pakistan Economies. Environ. Sci. Pollut. Res. 2022, 1–9. [Google Scholar] [CrossRef]
- Gaydon, D.S.; Khaliq, T.; Cheema, M.J.M.; Gull, U. Tweaking Pakistani Punjab Rice-wheat Management to Maximize Productivity within Nitrate Leaching Limits. Field Crops Res. 2021, 260, 107964. [Google Scholar] [CrossRef]
- Wen, L.; Li, Z. Driving Forces of National and Regional CO2 Emissions in China Combined IPAT-E and PLS-SEM Model. Sci. Total Environ. 2019, 690, 237–247. [Google Scholar] [CrossRef]
- Bartali, E.H.; Boutfirass, M.; Yigezu, Y.A.; Niane, A.A.; Boughlala, M.; Belmakki, M.; Halila, H. Estimates of Food Losses and Wastes at Each Node of the Wheat Value Chain in Morocco: Implications on Food and Energy Security, Natural Resources, and Greenhouse Gas Emissions. Sustainability 2022, 14, 16561. [Google Scholar] [CrossRef]
- Schlenker, W.; Roberts, M.J. Nonlinear Temperature Effects Indicate Severe Damages to US Crop Yields under Climate Change. Proc. Natl. Acad. Sci. USA 2009, 106, 15594–15598. [Google Scholar] [CrossRef]
- Zhao, C.; Liu, B.; Piao, S.; Wang, X.; Lobell, D.B.; Huang, Y.; Huang, M.T.; Yao, Y.T.; Bassu, S.; Ciais, P.; et al. Temperature Increase Reduces Global Yields of Major Crops in Four Independent Estimates. Proc. Natl. Acad. Sci. USA 2017, 114, 9326–9331. [Google Scholar] [CrossRef] [PubMed]
- Hoffman, A.L.; Kemanian, A.R.; Forest, C.E. The Response of Maize, Sorghum, and Soybean Yield to Growing-phase Climate Revealed with Machine Learning. Environ. Res. Lett. 2020, 15, 094013. [Google Scholar] [CrossRef]
- Food Security in China; The State Council Information Office of the People’s Republic of China: Beijing, China, 2019.


Disclaimer/Publisher’s Note: The statements, opinions and data contained in all publications are solely those of the individual author(s) and contributor(s) and not of MDPI and/or the editor(s). MDPI and/or the editor(s) disclaim responsibility for any injury to people or property resulting from any ideas, methods, instructions or products referred to in the content. |
© 2022 by the authors. Licensee MDPI, Basel, Switzerland. This article is an open access article distributed under the terms and conditions of the Creative Commons Attribution (CC BY) license (https://creativecommons.org/licenses/by/4.0/).