Article

Carbon Emission Accounting and the Carbon Neutralization Model for a Typical Wastewater Treatment Plant in China

1
College of Life and Environmental Sciences, Minzu University of China, Beijing 100081, China
2
Yangtze Ecology and Environment Co., Ltd., Wuhan 430062, China
3
Beijing Urban Construction Design & Development Group Co., Limited, Beijing 100037, China
4
Beijing Enterprises Water Group (China) Investment Limited, Beijing 100102, China
*
Author to whom correspondence should be addressed.
These authors contributed equally to this work.
Int. J. Environ. Res. Public Health 2023, 20(1), 140; https://doi.org/10.3390/ijerph20010140
Submission received: 14 November 2022 / Revised: 10 December 2022 / Accepted: 15 December 2022 / Published: 22 December 2022
(This article belongs to the Special Issue Wastewater Pollution and Control)

Abstract

:
To reduce carbon emissions and achieve carbon neutrality in China, it is pivotal to explore low-carbon wastewater treatment processes and carbon-neutral wastewater treatment plants (WWTPs). This study investigated the Beijing Gaobeidian WWTP to explore the current energy consumption and carbon emission status of representative WWTPs in China. Furthermore, it explored a possible low-carbon operating model. Results show that the current total energy consumption of Gaobeidian WWTP is 280,717 MWh/y, while its energy recovery is 268,788 MWh/y. As a result, the energy neutralization ratio is 95.8%, and the plant is close to reaching energy neutrality. The carbon emission of this plant is 446,468 t/y. However, it reduced its carbon emissions by 252,994 t/y and reached only 56.7% of carbon neutrality. Although the plant almost reached energy neutrality, it has a long way to go before reaching carbon neutrality. It was found that a subsequent increase in the recovery of residual heat from secondary effluent can increase the energy and carbon neutralization ratio to 523.1% and 219.0%, respectively, meaning that the WWTP can become a power production unit and a carbon sink. This study can provide a reference for exploring efficient energy use and reaching carbon neutrality for domestic WWTPs.

Graphical Abstract

1. Introduction

In the context of improved sewage treatment technology and severe climate change, the energy consumption of wastewater treatment plants (WWTPs) in China has become an important topic. Currently, the energy consumption of WWTPs has accounted for more than 2% of the total energy consumption in China [1,2]. In addition, scientists and academics are devoting more attention to carbon emissions from WWTPs [3]. According to statistics, China’s carbon emission from WWTPs is around 187,000 t (CO2)/d, accounting for approximately 2~5% of the total carbon emissions of the whole country [4]. Therefore, it is imperative to reduce both energy consumption and carbon emission in the wastewater treatment industry. Given the low cost of wastewater treatment and its remarkable effect on carbon emission reduction, some developed countries have incorporated wastewater treatment into their carbon emission reduction plans [5,6,7,8]. By optimizing the anaerobic ammonia oxidation process, the Austrian Strass WWTP reached carbon neutrality and 100% energy self-sufficiency. Finland’s Kakolanmäki WWTP attaches importance to the recovery of energy from the effluent so that it recovers energy and operates in a carbon-neutral manner while meeting effluent quality standards [9]. Therefore, attention needs to be directed toward reducing greenhouse gas (GHG) emissions from WWTPs.
GHG emissions from WWTPs are divided into direct and indirect ones. Direct emissions are CO2, N2O, and CH4, directly emitted during the wastewater and sludge treatment process, like CO2 released as a result of the degradation of organic matter during wastewater treatment, often called biogenic carbon, and CO2 from decomposed organic matter contained in petrochemical products, called fossil carbon. Although biogenic carbon is an important component, the Intergovernmental Panel on Climate Change (IPCC) does not include it in GHG emission calculations, given that these are of biogenic origin and not caused by the application of WWTPs [10,11,12]. Indirect emissions represent emissions resulting from the consumption of electricity and chemicals in WWTPs [13]. Electricity is a major component of indirect GHG emissions from WWTPs, and over 99% of it is consumed by aeration equipment, pumps, mixing motors, and other facilities [14,15,16]. Compared to carbon emissions from electricity consumption, carbon emissions from chemical dosing are relatively small [12].
To reduce carbon emissions from WWTPs, researchers proposed several measures for carbon emission reduction. For instance, modifying equipment such as blower aeration systems and optimizing the chemical dosing process are sustainable ways of reducing energy consumption and carbon emissions. In order to increase carbon sinks and achieve low-carbon operation, the chemical energy contained in the sewage needs to be used and converted into a stable energy carrier [17]. This is mainly carried out through sludge treatment, especially through the recovery of electrical and thermal energy from biogas cogeneration [18,19]. Using treated sludge in land application instead of a fertilizer also plays a role in carbon emission reduction. In terms of potential development, carbon emission reduction can also be achieved through the utilization of waste heat from secondary effluent, the development of solar or wind energy for power generation, and electricity recovery from wastewater using bioelectrochemical technologies [12,20,21]. In addition, organic and nitrogen containing pollutants can be largely removed from wastewater by advanced treatment, thus reducing the total amount of pollutants discharged into natural water bodies. Compared with direct discharge of wastewater, this can reduce the amount of GHGs released into the atmosphere since incomplete degradation of pollutants in natural water bodies will produce GHGs like CH4 and N2O. Therefore, water quality improvement has a positive effect on carbon emission reduction.
As a typical secondary WWTP in Beijing, Gaobeidian WWTP made a breakthrough in energy saving and power production through advanced anaerobic digestion technology. This study focused on the current state of Gaobeidian WWTP and investigated whether the plant can be energy neutral by calculating both the energy consumption and energy recovery of the WWTP. On the basis of energy calculations, direct and indirect carbon emissions during the operation of the WWTP were calculated. The carbon emission reductions corresponding to water quality improvement, sludge treatment, and residual heat recovery were also calculated and summarized. The values of carbon emission and carbon emission reduction were then compared to evaluate the total net carbon emission of the WWTP and analyze whether it can achieve carbon neutrality. The model for optimizing carbon neutrality was discussed throughout the process of carbon accounting and a new model of energy saving and carbon emission reduction was proposed to promote carbon neutrality.

2. Materials and Methods

2.1. The Definition of the Carbon Footprint

The carbon footprint in this study is defined as the direct and indirect GHG emissions caused by wastewater and sludge treatment within defined system boundaries. The GHG emissions accounted for include carbon dioxide (CO2), methane (CH4), and nitrous oxide (N2O). All are converted into carbon dioxide equivalents (CO2) based on 100-year global warming potentials (GWPs), namely, 1 for CO2, 21 for CH4, and 298 for N2O [5]. Because most of the organic matter in wastewater is biogenic and generally not accounted for in carbon emission inventories and because the proportion of fossil carbon in wastewater can be overlooked [20], this study only focused on CO2 emission due to external chemical input. As shown in Figure 1, the calculation of direct GHG emissions include direct emissions from the wastewater treatment process (e.g., CO2 emissions from an external carbon source, N2O emissions from the nitrification/denitrification process, and CH4 emissions from the anaerobic zone of A2O process), the sludge treatment process (e.g., CH4 emissions from anaerobic digestion), and the sludge disposal process (e.g., CH4 and N2O emissions from land application of sludge). The calculation of indirect GHG emissions included emissions from electricity and chemical consumptions within the defined system boundary [22].

2.2. The Current State of Gaobeidian WWTP

Gaobeidian WWTP is the largest secondary WWTP in Beijing, with a treatment scale of 100 × 104 m3/d. At present, a modified version of the A2O process is used for wastewater treatment. The secondary effluent is further treated using the denitrification biofilter, ultrafiltration, ozone contact reactor, and ultraviolet disinfection processes. The quality of the effluent from this WWTP meets the Grade B standard of the Beijing local Discharge Standard of Water Pollutants for Municipal Wastewater Treatment Plants (DB11/890-2012) [23]. The average influent and effluent water quality indicators of the Gaobeidian WWTP in 2020 are shown in Table 1. The sludge system adopts the main processes of thermal hydrolysis, advanced anaerobic digestion, plate and frame dewatering, and land application of treated sludge.

2.3. Estimation of Direct GHG Emissions

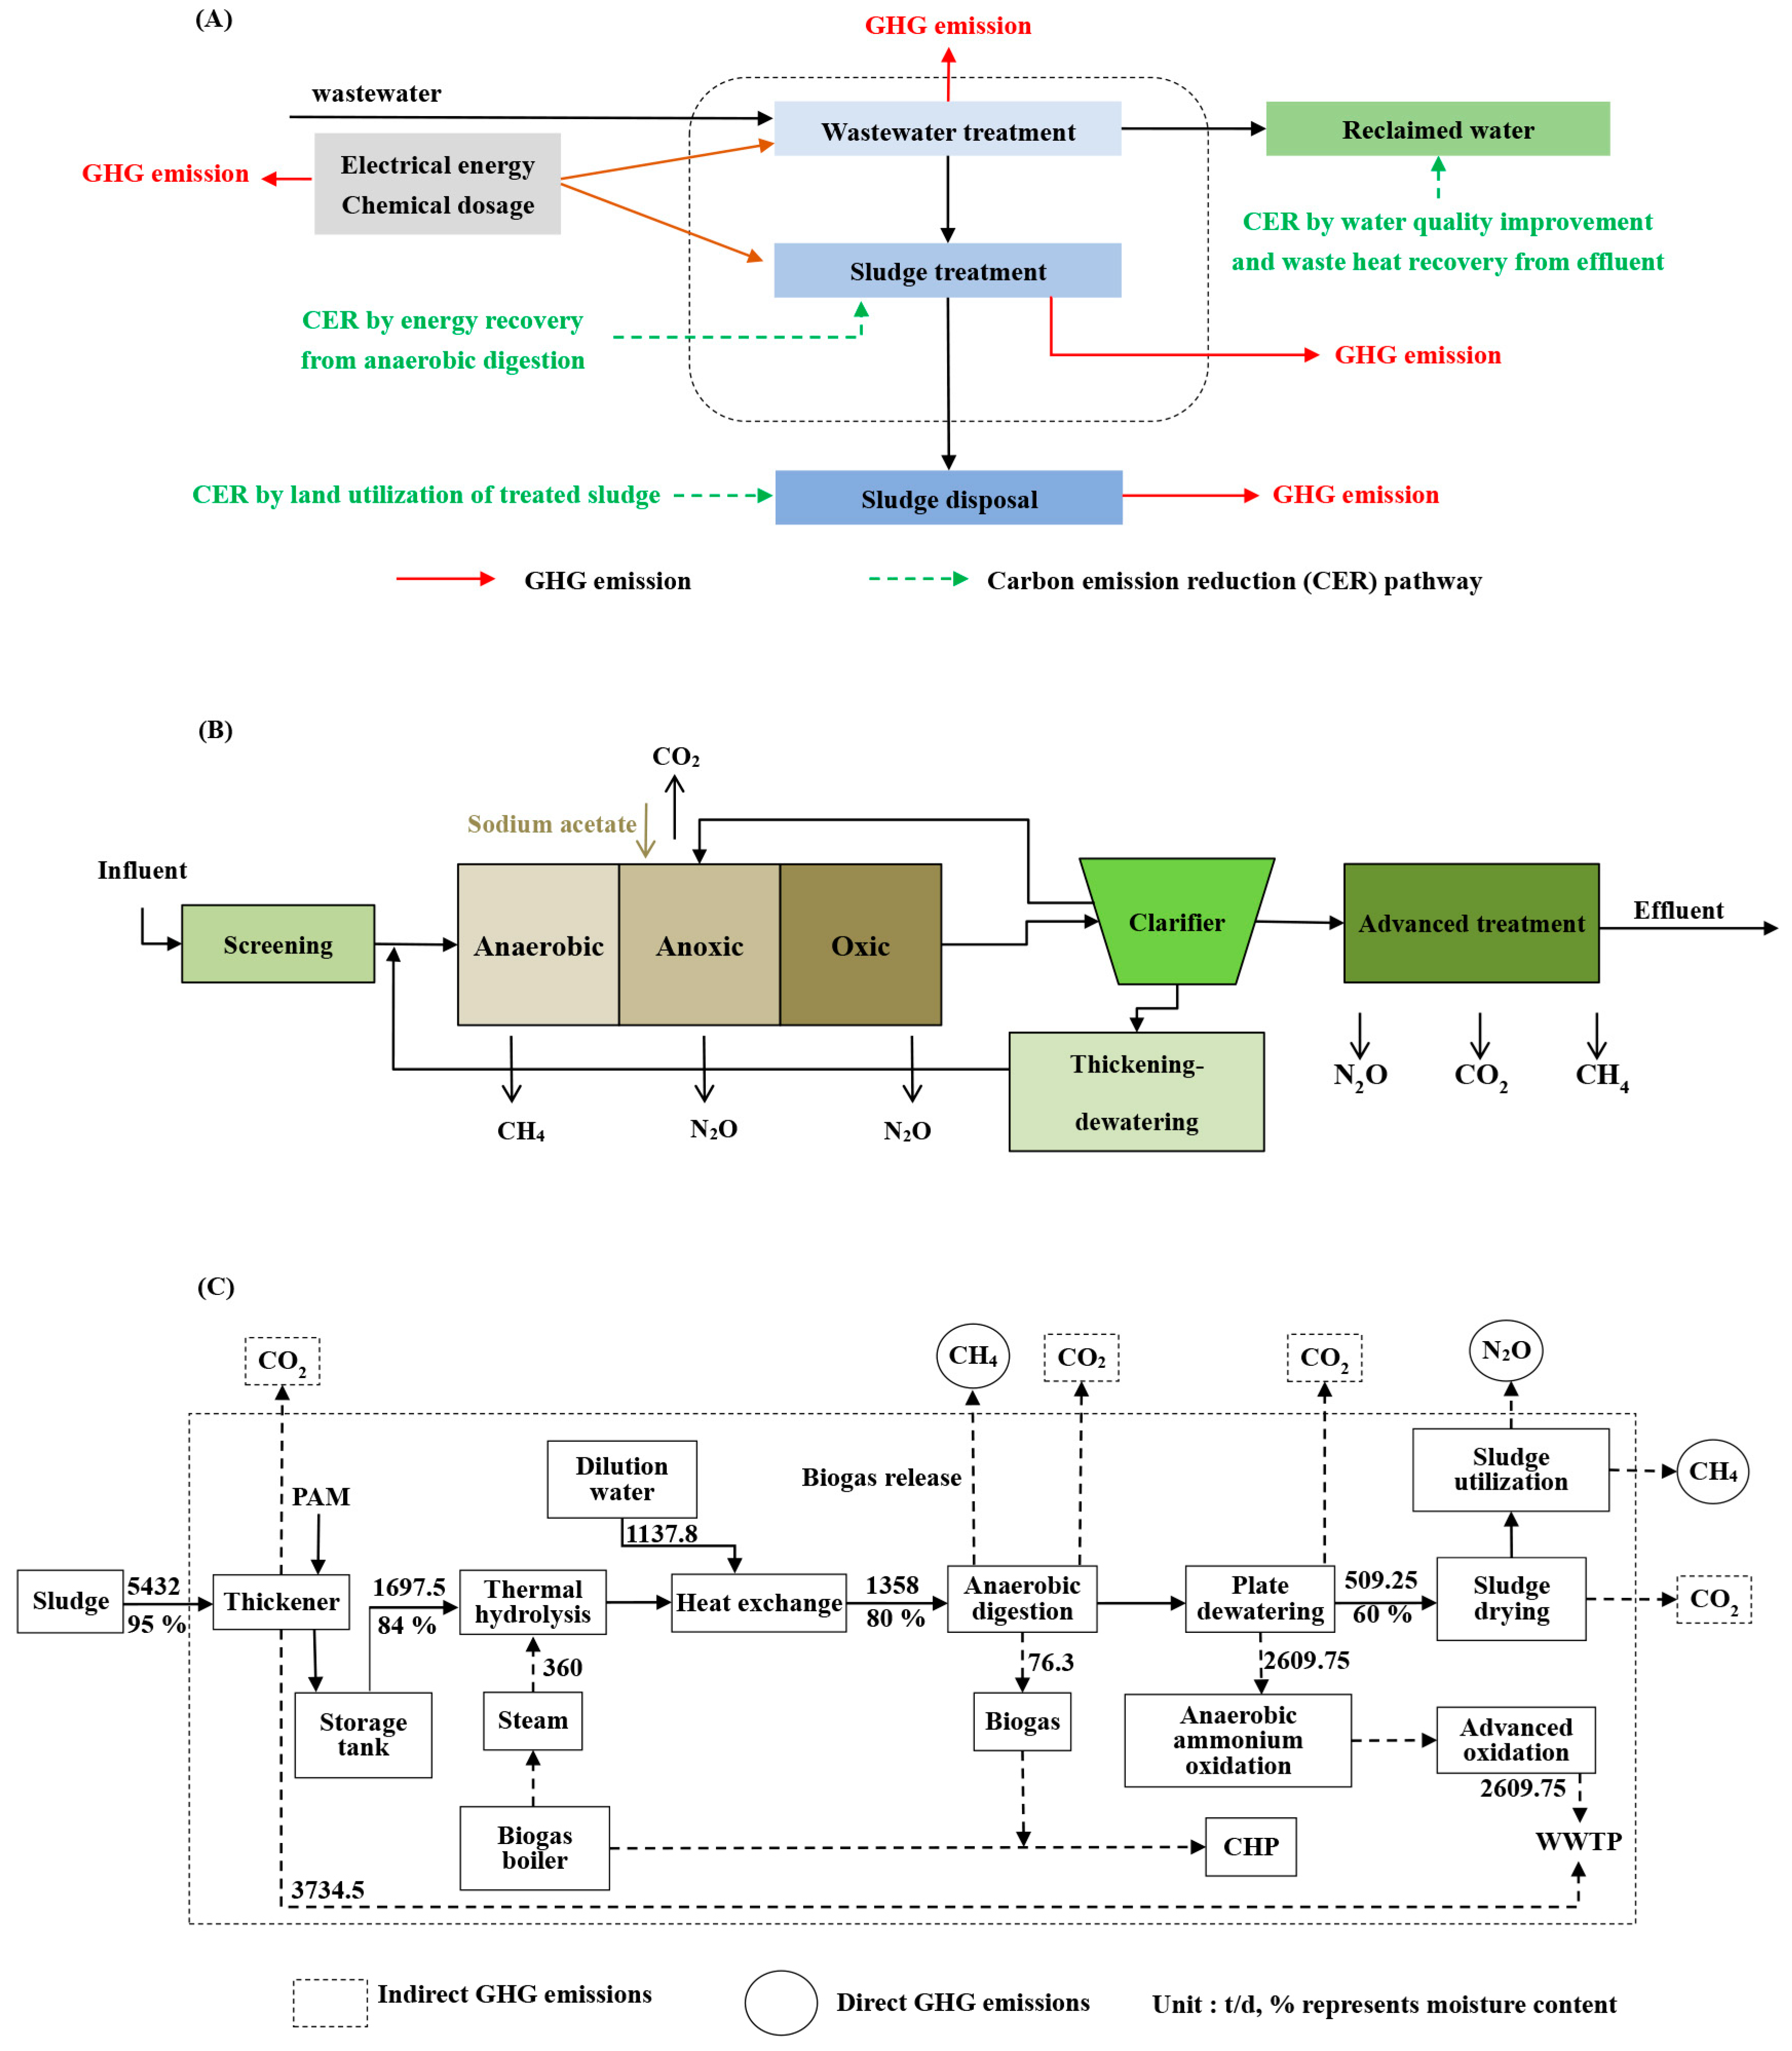
2.3.1. Direct GHG Emissions from the Wastewater Treatment Process

Sodium acetate is currently used as an additional carbon source in Gaobeidian WWTP to promote nitrate and nitrite reduction by denitrifying bacteria. The carbon source itself was oxidized to CO2. The direct CO2 emissions at this stage were calculated using Equation (1) as follows:
m C O 2 , carbon   source = n × M C O 2 M N a A c × m carbon   source
where m C O 2 , carbon   source is the CO2 emission that resulted from the addition of sodium acetate (t/y), m carbon   source is the amount of sodium acetate (t/y), n is the amount of CO2 produced per mol of oxidized sodium acetate (n = 2), and M C O 2 and M N a A c are the relative molecular masses of CO2 and sodium acetate, respectively ( M C O 2 = 44   g / mol ,   M N a A c = 82   g / mol ) .
N2O emissions mainly come from the intermediates of nitrification and denitrification processes. IPCC uses an empirical method to estimate the N2O emission coefficient of WWTPs. The N2O emission coefficient ranges from 0.008 to 0.39 kg N2O/kg TN for WWTPs based on the aerobic process [9]. In this study, an empirical coefficient of 0.035 kg N2O/kg TN was used for traditional nitrification-denitrification techniques in reference to previous studies [25]. The N2O emission from the sewage treatment process was calculated using Equation (2) as follows:
m N 2 O , st = Q × T N inf T N eff × E F N 2 O , st  
where m N 2 O , st is the annual discharge of N2O in the sewage treatment process (t/y), Q is the treated sewage volume (m3/y), T N inf and T N eff are the total nitrogen (TN) concentrations in influent and effluent, respectively (mg/L), and E F N 2 O , st is the empirical coefficient of the discharge of N2O (0.035 kg N2O/kg TN).
CH4 emission from the anaerobic zone of the A2O process can be calculated using Equation (3) as follows:
m C H 4 , st = m C O D × E F C H 4 , st R
where m C H 4 , st is the amount of CH4 released from the anaerobic process during sewage treatment (t/y), m C O D is the total amount of COD in the influent (t/y; mCOD = Q × CODinf, CODinf is the influent concentration of COD), E F C H 4 , st is the CH4 emission coefficient during the sewage treatment process (0.025 kg CH4/kg of COD as recommended by previous studies) [26], and R is the amount of recovered CH4 (it has a 0 value in this study since it is difficult to recover methane during wastewater treatment).

2.3.2. Direct GHG Emissions from the Sludge Treatment and Disposal Process

During the sludge treatment process, approximately 5% of the biogas leaks from pipes and escape into the atmosphere, resulting in direct carbon emissions [27]. This carbon emission can be calculated using Equation (4) as follows:
m a d , C H 4 = η × Q biogas × 65 % × M C H 4 V m = 2.127 × 10 5 × Q biogas
where m a d , C H 4 is the amount of CH4 released into the atmosphere during anaerobic digestion of sludge (t/y), η is the uncontrollable methane leakage ratio during biogas production (5%), Q biogas is the amount of biogas produced by anaerobic digestion of sludge (m3/y, which is 2.555 × 10⁷ m3/y for Gaobeidian WWTP [28]), 65% is the volume fraction of methane in biogas [20], M C H 4 is the relative molecular mass of CH4 (16 g/mol), and Vm is the molar volume of gas (24.451 L/mol at 25 °C and one atmospheric pressure).
The treated sludge from Gaobeidian WWTP Is currently used in forest land application, horticulture and nurseries, and sandy wasteland improvement. GHGs such as CH4 and N2O are produced during land application of treated sludge. The amount of GHGs released from this process can be calculated using Equations (5) and (6) as follows:
m l a n d , N 2 O = 0.011 × W l a n d × ω N × M N 2 O n , × M N
m l a n d , C H 4 = 0.003 · W l a n d
where M l a n d , N 2 O and M l a n d , C H 4 are the amount of N2O and CH4 released from land application of treated sludge (t/y), respectively, W l a n d is the volume of dry sludge used in land application (t/y), ω N is the mass fraction of N in dry sludge (0.12 [29]), M N 2 O and MN are the molecular masses of N2O and N, respectively ( M N 2 O = 44   g / mol ,   M N = 14   g / mol ), n’ is the amount of N needed per mole of the produced N2O (n’ = 2), and 0.011 and 0.003 are the emission factors of N2O and CH4 from land application of treated sludge [29], respectively.

2.4. Calculation of Indirect GHG Emissions

Indirect carbon emissions from WWTPs are byproducts of electricity, heat, and chemical consumption. Electrical energy is consumed during the processes of aeration, sludge transportation, sludge dewatering, etc. Moreover, heat is consumed during sludge pyrolysis, while chemicals are consumed through dosing of additional carbon sources, phosphorus removal chemicals, and disinfectants.
Carbon emissions from electricity, heat, and chemical consumption can be calculated using Equations (7)–(9), respectively.
m e c = E F e c ·   C e c
m h c = E F h c ·   C h c
m c c = i = 1 N C c c , i E F c c , i
where m e c , m h c , and m c c are indirect carbon emissions from electricity, heat, and chemical consumption, respectively (t/y, carbon emissions are calculated in CO2 equivalents), C e c is electricity consumption (MWh/y), C h c is heat consumption (GJ/y), C c c , i is the annual consumption of agent i (t/y), E F e c is the CO2 emission factor of electricity consumption (0.604 t/MWh for the Beijing municipal grid [30]), E F h c is the emission factor of heat consumption (0.11 t/GJ for the heating system in Beijing [30]), and E F c c , i is the corresponding CO2 emission factor of agent i (t/t).

2.5. Calculation of the Carbon Emission Reduction

2.5.1. Carbon Emission Reduction Resulting from Water Quality Improvement

Carbon emission reduction resulting from water quality improvement can be expressed through the emission factors of the receiving water bodies. It is calculated using Equation (10) as follows:
J w q = Q × [ 21 × B O D 5 ,   i n f B O D 5 ,   e f f × 0.06 + 298 × T N i n f T N e f f × 0.008 ]
where J w q is the carbon emission reduction resulting from water quality improvement (t/y), 21 is the CO2 emission coefficient equivalent to CH4, 298 is the CO2 emission coefficient equivalent to N2O, Q is the effluent volume of the WWTP (m3/y), BOD5,inf, BOD5,eff, TNinf, and TNeff are the influent and effluent concentrations of BOD5 and TN, respectively (mg/L), 0.06 kg CH4/kg BOD5 is the CH4 emission factor of surface water, and 0.008 kg N2O/kg TN is the N2O emission factor of surface water [29].

2.5.2. Carbon Emission Reduction Resulting from Sludge Treatment and Disposal

Carbon emission reduction from sludge treatment is achieved by recovering heat and electrical energy from anaerobic digestion. A subsequent treatment of the liquid from sludge digestion also saves energy. Besides, carbon emission reduction from sludge disposal is achieved by using the treated sludge in land application instead of a fertilizer. During land application of sludge, plants absorb 61% of N and 70% of P from sludge. Therefore, sludge offers a sustainable alternative to traditional fertilizers and increases carbon sequestration. Energy consumption during the production of the traditional nitrogen fertilizer, ammonium nitrate (NH4NO3), is 1 GJ/t, while that during the production of the traditional phosphate fertilizer, calcium superphosphate Ca(H2PO4)2, is 1.3 GJ/t [31]. Hence, the carbon sink resulting from land application of sludge can be calculated according to Equation (11) as follows:
S l a n d = W l a n d · 0.604 ( 61 % × M N H 4 N O 3 M N × 1 × ω N + 70 % × M C a ( H 2 P O 4 ) 2 M P × 1.3 × ω P )
where S l a n d is the carbon sink resulting from land application of treated sludge (t/y), W l a n d is the amount of dry sludge in land application (t/y), 0.604 t CO2/MWh is the emission factor of electricity consumption of the Beijing municipal grid [30], M N H 4 N O 3 , M C a ( H 2 P O 4 ) 2 , and MP are the relative molecular masses of NH4NO3, Ca(H2PO4)2, and P ( M N H 4 N O 3 = 80   g / mol , M C a ( H 2 P O 4 ) 2 = 234   g / mol , MP = 31 g/mol), respectively, and ω N and ω P are the mass fractions of N and P in dry sludge (ωN = 0.12, ωP = 0.02), respectively.

2.5.3. Carbon Emission Reduction Resulting from the Recovery of Residual Thermal Energy

To estimate the potential of reducing carbon emission by heat recovery, a thermal energy recovery model developed by Hao et al. was used for Gaobeidian WWTP [32]. The model calculates the energy that can be extracted from the secondary effluent.
The theoretical heating or cooling capacity contained in the effluent can be calculated using Equation (12) as follows:
A = M × Δ T × C
where A denotes the heating or cooling capacity contained in the secondary effluent (kJ), M denotes the mass of the secondary effluent (kg), Δ T denotes the temperature difference between the influent and effluent when using the secondary effluent for cooling or heating (°C), and C denotes the specific heat capacity of the secondary effluent (4.18 kJ/(kg·°C)).
A water-source heat pump system can be used to extract thermal energy from the secondary effluent. Therefore, the heating or cooling capacity released from this system can be calculated using Equation (13) [9] as follows:
A H C = A ± W = A ± A C O P 1
where A H C is the heating or cooling capacity extracted from the secondary effluent and released from the water-source heat pump (kJ, subscripts H and C represent the heating and cooling operation mode, respectively), W is energy consumed by the water-source heat pump, and COP stands for the ratio of heating or cooling capacity to the electricity consumed by the water-source heat pump.

3. Results and Discussion

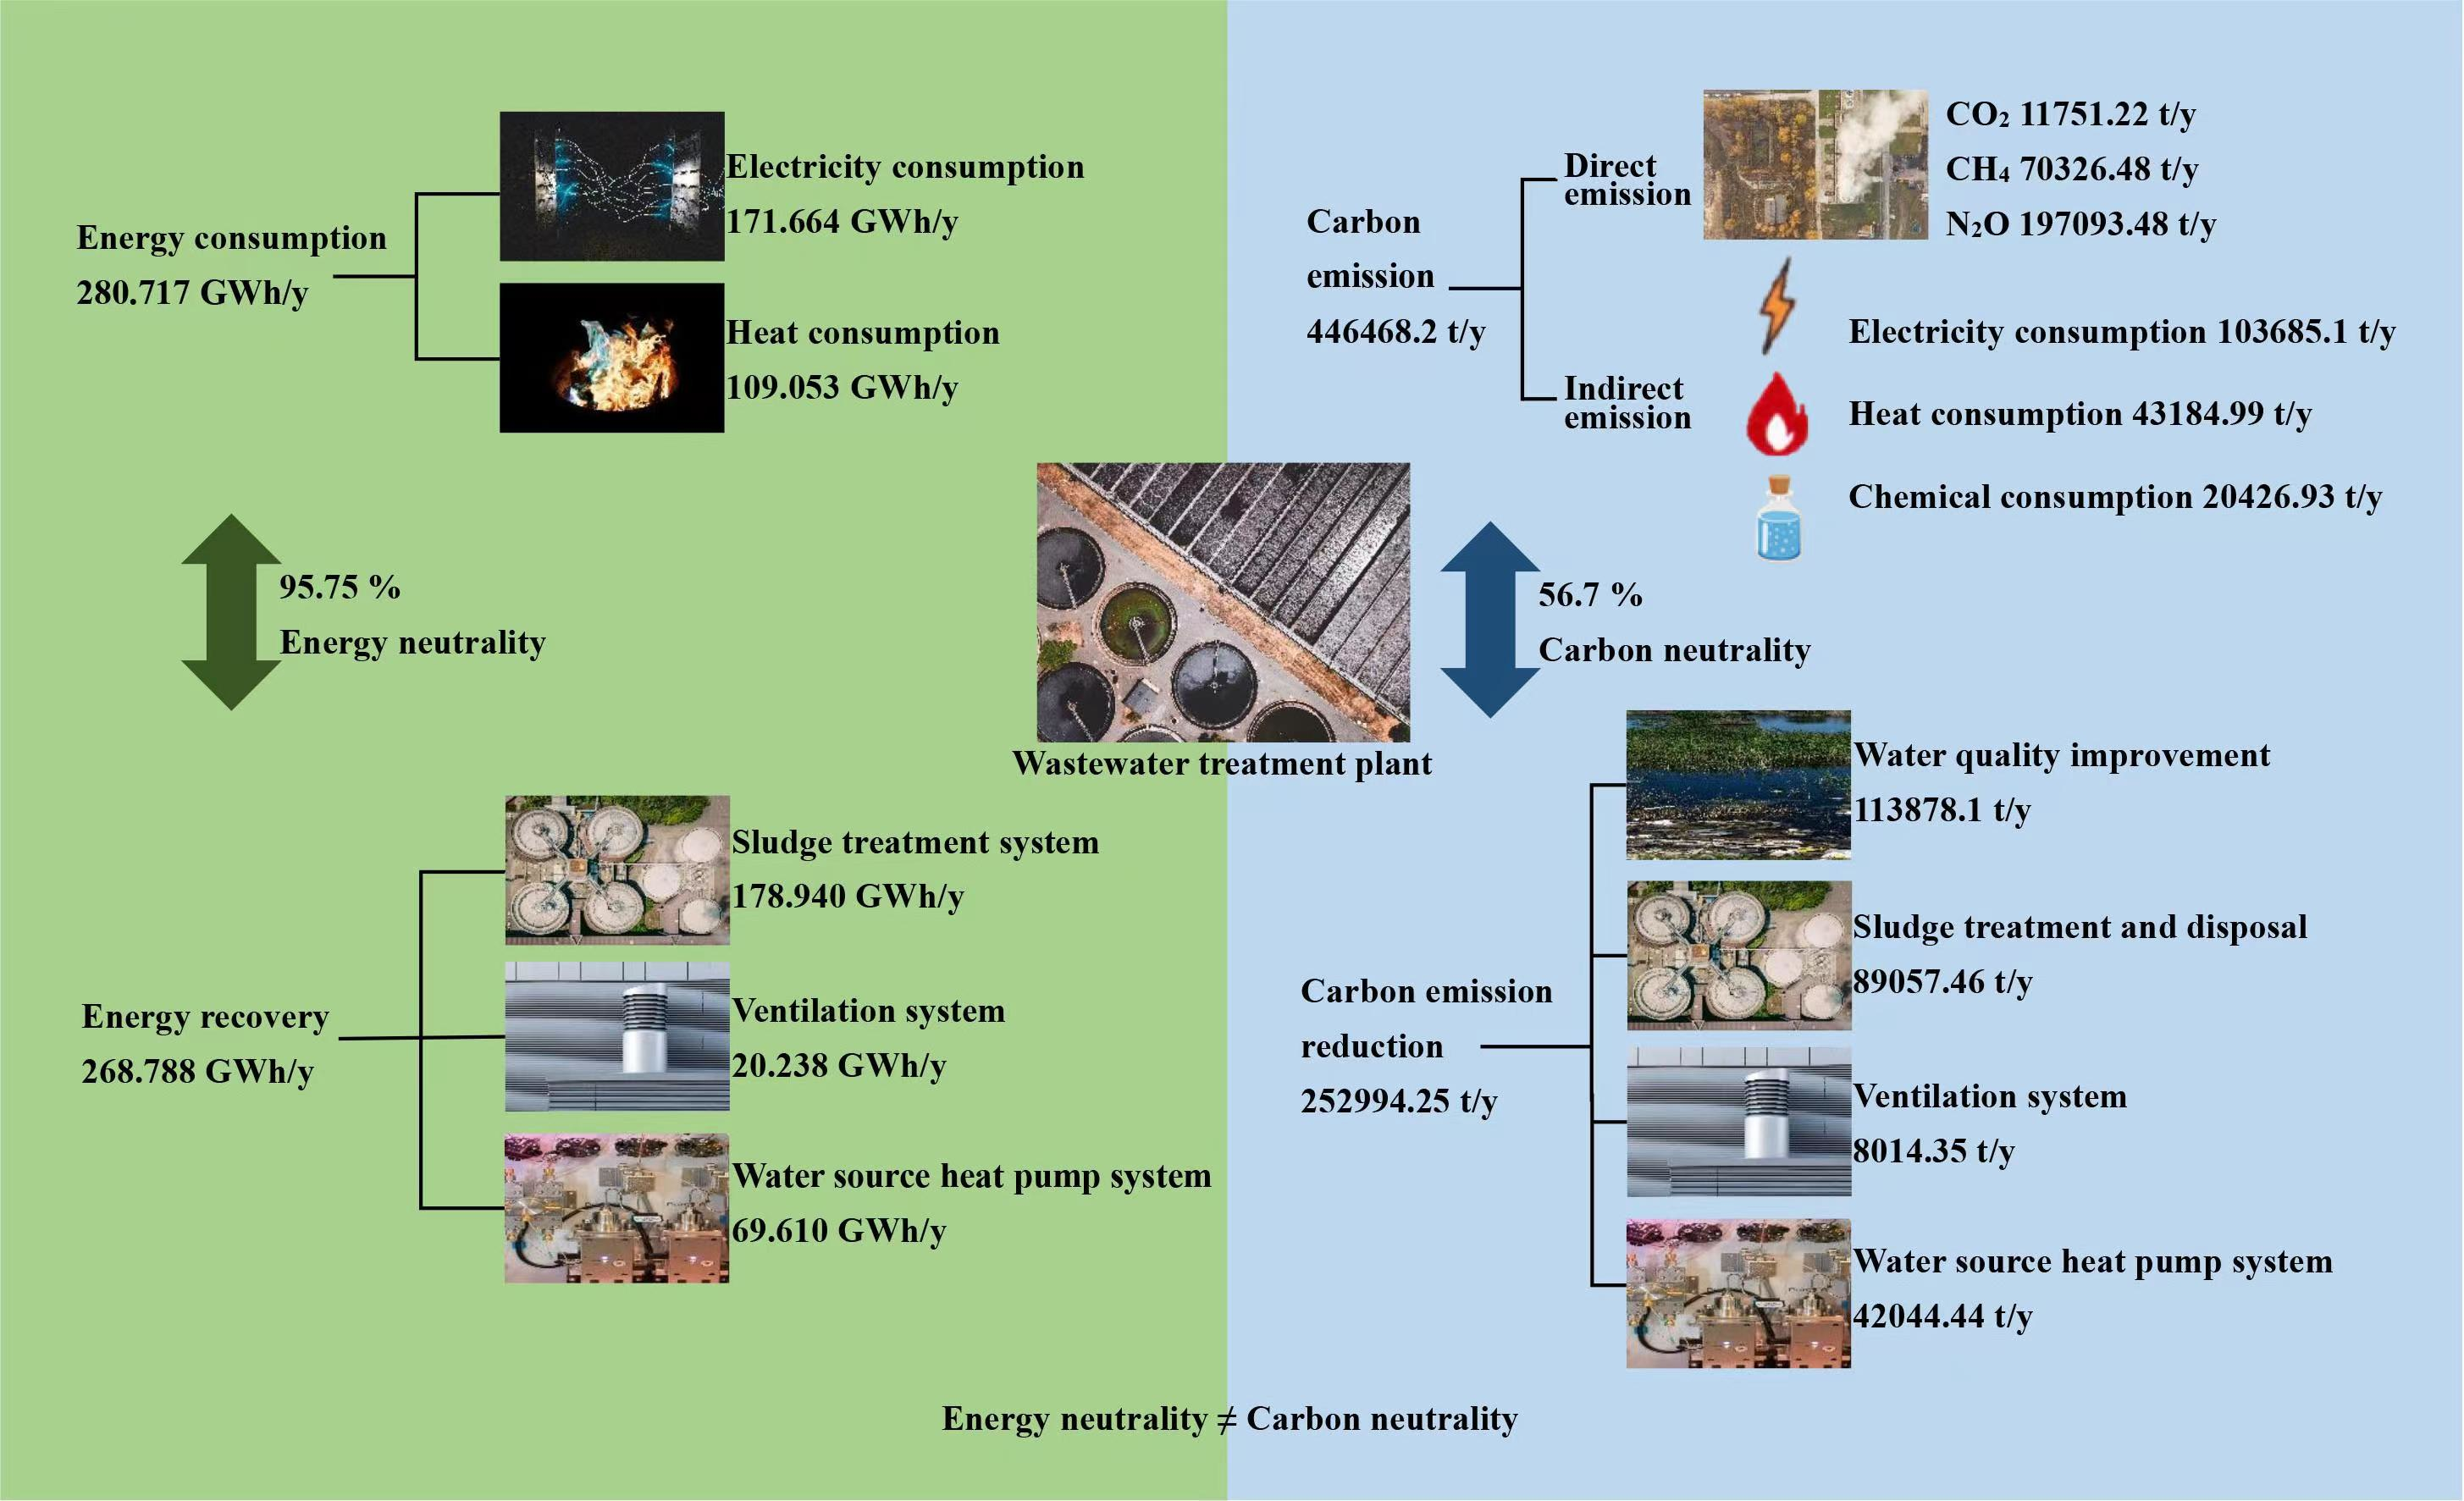
3.1. Analysis of the Energy Balance of Gaobeidian WWTP

The energy in Gaobeidian WWTP is mainly consumed by electricity and heating systems (Table 2). The total annual energy consumption of Gaobeidian WWTP was 280,717 MWh/y.
The primary energy recovery pathways of Gaobeidian WWTP include the production of methane from anaerobic digestion for combined heat and power (CHP) generation, heat recovery from the secondary effluent through the water-source heat pump system, and heat extraction from the cooling water of pumping station, air compressors, and ventilation pipes. The sludge treatment and disposal processes of Gaobeidian WWTP and other relevant data are shown in Figure 1C. The total amount of primary and excess sludge was 5432 t/d with a water content of 95% [12]. In the sludge treatment center, the mixed sludge was pumped into a thickener and then dewatered with the addition of polyacrylamide (PAM). The dewatered sludge was transferred to a sludge storage tank where it was thermally hydrolyzed and anaerobically digested for heat and power cogeneration. After the thickening treatment, thermal hydrolysis, and anaerobic digestion, 509 t/d of sludge with a water content of 60% was placed into the plate and frame filter press for further treatment [16]. The biogas production of Gaobeidian WWTP was 2555 × 104 m3/y, of which 1285 × 104 m3/y was used for heat and power cogeneration, with a cumulative annual power generation of up to 43,040 MWh [28]. The other half of the biogas was used in the boiler system to produce steam for heating the digestion tanks in the thermal hydrolysis stage and heating the WWTP and its surrounding area. The annual energy recovery capacity of the sludge treatment process (i.e., the sum of electrical energy from heat and power cogeneration, heat recovery from flue gas, heat recovery from water cylinder jackets, and steam from boilers) was 178,940 MWh/y, of which 104,920 MWh/y was used for the thermal hydrolysis treatment of sludge, while 20,800 MWh/y [28] was used as an electricity supply for equipment and sludge transportation. Energy generated from anaerobic digestion reduced the energy required for sludge treatment, so surplus energy was used as an output for other processes and treatments.
Heat from the effluent was recovered by a water-source heat pump system located within the plant. This system provided heating or cooling for the plant area by extracting the temperature difference between the effluent and influent temperature. The potential of thermal energy recovery from the secondary effluent was estimated using the thermal energy recovery model [9]. In particular, the amount of secondary effluent that can be used for heat recovery was 339 × 106 m3/y [29], while the annual average extractable temperature difference was ~4 °C. Therefore, the theoretical heating or cooling capacity of the secondary effluent (A) was 5,668,080 GJ/y. Furthermore, the heating or cooling capacity that could be released from the water-source heat pump system was calculated and shown in Table 3. The heating capacity released from the water-source heat pump system (AH) was 7,417,487 GJ/y, while the cooling capacity (AC) was 4,569,615 GJ/y. These are equal to 2,060,413 MWh/y and 1,269,337 MWh/y of electric energy, respectively. After subtracting the electricity consumption of the water-source heat pump system, the net energy production capacity from the heat of the secondary effluent was 1,574,467 MWh/y for heating and 964,208 MWh/y for cooling. Assuming that heating and cooling each last for 6 months per year, a theoretical annual energy recovery of 1,269,337 MWh can be obtained from the waste heat of the secondary effluent. Presently, the annual heat recovery from the heat pump system in Gaobeidian WWTP is only 69,610 MWh/y [33], less than 6% of the theoretical value. These results indicate that the residual energy from the secondary effluent has a great development value. Thus, a reasonable use of the low-grade energy contained in the effluent is also of great significance to the low-carbon operation of WWTPs.
Lastly, the annual heat recovery of the ventilation system was 20,238 MWh/y [33].
In summary, the total energy recovery of Gaobeidian WWTP is 268,788 MWh/y (Figure 2), among which the energy recovery from the sludge treatment process (178,940 MWh/y) accounts for 66.6%, heat recovery from the secondary effluent (69,610 MWh/y) accounts for 25.9%, and heat recovery from the ventilation system (20,238 MWh/y) accounts for 7.5% (Table 4). Because the total energy consumption of the plant is 280,717 MWh/y, it has achieved 95.8% of energy neutralization. However, if the residual heat energy contained in the secondary effluent can be completely extracted, the total energy recovery would be increased to 1,468,515 MWh/y, which is 4.2 times greater than energy consumption. And the proportion of heat recovery from secondary effluent (1,269,337 MWh/y) rises to 86.4%, while those of energy recovery from sludge treatment process and heat recovery from the ventilation system decrease to 12.2% and 1.4%, respectively. The improvement of heat recovery technology can transform the WWTP into an energy generation factory.

3.2. The Carbon Footprint of Gaobeidian WWTP

3.2.1. Direct GHG Emissions

This study considered only CO2 emissions from the external carbon source, but not CO2 emissions from the influent TOC conversion [34]. Gaobeidian WWTP uses sodium acetate as the external carbon source with an annual dosing of 10,950 t/y [7]. The corresponding direct CO2 emission from the oxidation of sodium acetate ( m C O 2 ,   carbon   source ) was 11,751 t/y. Furthermore, N2O emission from the wastewater treatment process ( m N 2 O ,   st ) was calculated to be 507 t/y, while CH4 emission from the anaerobic stage of wastewater treatment ( m C H 4 ,   st ) was 2582 t/y.
The amount of CH4 released into the atmosphere during anaerobic digestion of sludge ( m a d ,   C H 4 ) was calculated using Equation (4) and estimated to be 543 t/y. Sludge of 1358 t/d with a water content of 80% entered the sludge treatment center for thermal hydrolysis and anaerobic digestion, which reduced the weight of sludge by 25%. As a result, the dry sludge used in land application (Wland) was 74,351 t/y. The amount of N2O released from land application ( m l a n d ,   N 2 O ) was 154 t/y, while that of CH4 ( m l a n d ,   C H 4 ) was 223 t/y.
After converting all the amounts of GHGs into CO2 equivalents, the direct carbon emission from Gaobeidian WWTP was summarized and is shown in Table 5. Firstly, the direct carbon emission from the wastewater treatment process was 217,117 t/y. Although the amount of N2O emission during the wastewater treatment (507 t/y) was much lower than that of CO2 (11,751 t/y) and CH4 (2582 t/y), the carbon emission equivalent to N2O (151,136 t/y) was significantly higher than that of CO2 (11,751 t/y) and CH4 (54,230 t/y). Therefore, the carbon emission equivalent to N2O accounted for 69.6% of the direct carbon emissions during wastewater treatment. Secondly, the direct carbon emission from sludge treatment and disposal was 62,054 t/y, in which N2O contributed 74.1%. Therefore, the total direct carbon emission from Gaobeidian WWTP was 279,171 t/y. The direct carbon emission from the wastewater treatment process accounted for 77.8% and that from sludge treatment and disposal accounted for 22.2%. These results indicate that direct carbon emission from wastewater treatment is much higher than that from sludge treatment and disposal. In both processes, N2O emissions are a major contributor to direct carbon emissions.

3.2.2. Indirect GHG Emissions

As described in 2.4, indirect GHG emissions include electricity, heat, and chemical consumption. Electricity was consumed for wastewater treatment (94,900 MWh/y), sludge treatment (20,795 MWh/y), pump station (52,080 MWh/y), administrative buildings (3793 MWh/y), and fuel transportation (96 MWh/y) (Table 2). As a result, the total electricity consumption of Gaobeidian WWTP was 171,664 MWh/y and the corresponding carbon emission from electricity consumption (mec) was 103,685 t/y. Furthermore, thermal energy was used during the thermal hydrolysis of sludge (104,920 MWh/y) and consumed by the heating system of buildings (4133 MWh/y) (Table 2). The total heat consumption was 109,053 MWh/y, and its corresponding carbon emission was 43,185 t/y. The chemical consumption and its corresponding indirect carbon emission is shown in Table 6. The total indirect carbon emission from chemical consumptions was 20,427 t/y, with 75.0% coming from the use of sodium acetate. Therefore, the total indirect carbon emission from Gaobeidian WWTP was 167,297 t/y, with electricity, heat, and chemical consumption contributing to 62.0%, 25.8%, and 12.2% of the indirect carbon emission, respectively.

3.2.3. Total GHG Emissions

In terms of the CO2 equivalent emission, the total annual carbon emission from Gaobeidian WWTP was 446,468 t/y, of which 279,171 t/y (62.5%) was the product of direct and 167,297 t/y (37.5%) was the product of indirect carbon emissions. Emissions from different processes are shown in Figure 3. Firstly, the direct carbon emission resulting from N2O emission (197,094 t/y) was the main contributor to GHG emissions, accounting for 44.2%. N2O was discharged from the wastewater treatment process (151,136 t/y equivalent carbon emission) and land application of sludge (45,958 t/y equivalent carbon emission), which accounted for 33.9% and 10.3% of the total GHG emissions, respectively. This demonstrates that efficient nitrogen removal technologies are urgently required to fully convert the substances containing nitrogen in sewage into nitrogen gas for the low-carbon operation of WWTPs. Then, the indirect carbon emission from electricity consumption was the second highest contributor (103,685 t/y, 23.2%) to the total GHG emissions, indicating that energy-efficient operation modes for WWTPs are needed, as well. The direct carbon emission resulting from CH4 emission (70,326 t/y equivalent carbon emission) was the third highest contributor to the total GHG emissions, accounting for 15.8%. Unexpectedly, CH4 emissions from wastewater treatment (54,230 t/y equivalent carbon emission, 12.1%) were much higher than those from anaerobic digestion (11,412 t/y, 2.6%) and land application of sludge (4684 t/y, 1.1%). This result could stem from the fact that most of the sewage treatment structures are open systems, so the CH4 directly enters the atmosphere. Although a large amount of CH4 was produced during anaerobic digestion, most of it was recovered for heat and power cogeneration. Therefore, biogas recovery is an efficient method to reduce CH4 emissions. Likewise, wastewater treatment technologies that lower CH4 emission are important in reducing GHG emissions. Following these contributors, indirect carbon emission from heat consumption, indirect carbon emission from chemical consumption, and direct CO2 emission accounted for 9.7%, 4.6%, and 2.6% of the total GHG emissions, respectively.

3.3. Carbon Emission Reduction

The carbon emission reduction resulting from water quality improvement (Jwq) was calculated by comparing the GHG emission (CH4 and N2O) from wastewater after treatment with that from direct sewage discharge (Equation (10)), which was 113,878 t/y. The carbon emission reduction was 79,333 t/y when CH4 emission was reduced from wastewater, and it was 34,545 t/y when N2O emission was reduced. The former accounted for 69.7% of Jwq while the later accounted for 30.3% of Jwq.
As described in 3.1, the annual energy recovery capacity of the biogas system of the sludge treatment process was 178,940 MWh/y. The detailed composition of energy recovery from sludge treatment and the corresponding carbon emission reductions are listed in Table 7. The carbon emission reduction corresponding to energy recovery from sludge treatment was 79,813 t/y. In addition, an anaerobic ammonia oxidation system with a treatment scale of 3500 m3/d was used in treating sludge digestion liquid in the WWTP. Compared to previous techniques without the anaerobic ammonia oxidation system (ANAMMOX), the one with it save 3830 MWh/y of electrical energy, which corresponds to a carbon emission reduction of 2313 t/y [33]. The amount of dry sludge that can be used in land application (Wland) was 204 t/d. As a result, the carbon emission reduction was 6932 t/y when sludge was used instead of commercial fertilizers (Sland). Therefore, sludge treatment and disposal account for 89,058 t/y of total carbon emission reduction, of which energy recovery from the biogas system, electricity saving by treating sludge with ANAMMOX, and land application of sludge accounted for 89.6%, 2.6%, and 7.8%, respectively.
In addition, heat recovery from the ventilation system (20,238 MWh/y) corresponds to a carbon emission reduction of 8014 t/y.
According to the calculation of heat recovery capacity from the secondary effluent in Section 3.1, the annual electricity recovery from the heat pump system of the WWTP was 69,610 MWh/y, corresponding to a carbon emission reduction of 42,044 t/y. The theoretical energy recovery capacity from the secondary effluent is about 1,269,337 MWh/y, corresponding to a theoretical carbon emission reduction capacity of 766,680 t/y. This theoretical carbon emission reduction capacity is 17.2 times greater than the actual carbon emission reduction from secondary effluent. Therefore, there is still room for improvement when it comes to using residual thermal energy from the secondary effluent to reduce carbon emission.
All the mentioned carbon emission reductions are listed in Table 8. Based on the emission reductions, this study calculated the total carbon emission reduction of Gaobeidian WWTP. Currently, the total amount of carbon emission reduction is 252,994 t/y, which is mainly achieved through water quality improvement (45.0%), sludge treatment and disposal (35.2%), residual thermal energy recovery from the secondary effluent (16.6%), and heat recovery from the ventilation system (3.2%).

3.4. Carbon Neutralization Evaluation

The amounts of carbon emitted from and reduced by Gaobeidian WWTP are summarized and compared in Figure 4. The current amount of carbon emission reduction (252,994 t/y) is still much lower than emitted (446,468 t/y), with a carbon neutralization ratio of only 56.7%. This indicates that the operation of Gaobeidian WWTP is far from carbon-neutral, although it already achieved near energy-neutral operation (95.8% energy neutralization as described in Section 3.1).
If the residual thermal energy from the secondary effluent is fully developed and recovered, the plant is expected to achieve around 977,630 t/y of total carbon emission reduction. The proportion of carbon emission reduction as a result of heat recovery from secondary effluent increases to 78.4%, while that resulting from water quality improvement, sludge treatment and disposal, and heat recovery from the ventilation system decreases to 11.6%, 9.1%, and 0.8%, respectively. That means that heat recovery from the secondary effluent will be the main contributor to carbon emission reduction instead of water quality improvement. The carbon neutralization ratio after waste heat recovery can be as high as 219.0% (Table 9), indicating that Gaobeidian WWTP has the potential to transform from a carbon emission plant to a carbon sink.
The current amount of carbon emission from Gaobeidian WWTP shows that it is difficult to reach carbon neutrality by solely relying on the wastewater treatment process and biogas cogeneration. Carbon neutrality is not equivalent to energy neutrality, although energy neutrality has almost been achieved in the plant. Improving the efficiency of heat pump stations to recover thermal energy from the secondary effluent is the key to achieving carbon neutrality.

3.5. Measures to Reduce the Carbon Footprint

Two paths can be taken to achieve low-carbon operation of WWTPs. One relies on increasing carbon sinks as many as possible by optimizing the sludge digestion process to improve energy recovery from sludge, devoting attention to the residual thermal energy in the secondary effluent, and using self-generated clean energy. The other path relies on reducing the amount of carbon emission during the operation of the plant by upgrading the aeration system, optimizing the chemical dosing section, improving the pipe network system, and renovating equipment for lower carbon emission. The actions of government departments and the development of an ecological civilization are also important for achieving carbon neutrality in WWTPs. WWTPs should continue to explore energy-saving modes and systematically plan environmental water management so as to utilize resources under the premise of eco-friendliness.

4. Conclusions

The current energy consumption of Gaobeidian WWTP is 280,717 MWh/y, and its energy recovery is 268,788 MWh/y, resulting in an energy neutralization ratio of 95.8%. Therefore, from the perspective of energy balance, energy neutrality has almost been achieved in the plant. However, from the perspective of carbon footprint, the current amount of carbon emission from the WWTP is 446,468 t/y, and the amount of carbon emission reduction is 252,994 t/y, resulting in a carbon neutrality ratio of only 56.7%. These indicate that although the plant almost reached energy neutrality, it still has a long way to go before reaching carbon neutrality. In order to increase the amount of carbon emission reduction, a sustainable and feasible method of recovering waste heat from secondary effluent was proposed. If the waste heat of the secondary effluent can be completely extracted, the total energy recovery of the plant would be increased to 1,468,515 MWh/y, and the carbon emission reduction would be increased to 977,630 t/y. In this context, the energy and carbon neutralization ratio could be as high as 523.1% and 219.0%, respectively. That means that the WWTP can become a power production unit and a carbon sink.

Author Contributions

Conceptualization, C.P. and X.X.; methodology, C.P.; validation, B.R. and Z.J.; investigation, C.P.; resources, X.N.; writing—original draft preparation, C.P.; writing—review and editing, X.L.; supervision, X.X.; project administration, X.X.; funding acquisition, X.X. All authors have read and agreed to the published version of the manuscript.

Funding

This research was funded by the Special Fund of the State Key Joint Laboratory of Environmental Simulation and Pollution Control (No. 22K06ESPCT) and the Fundamental Research Funds for the Central Universities (2021JCXK01, 2022QNYL25).

Institutional Review Board Statement

Not applicable.

Informed Consent Statement

Not applicable.

Data Availability Statement

The data presented in this study are available in article here.

Conflicts of Interest

Xi Luo was employed by Yangtze Ecology and Environment Co., Ltd., Wuhan, Hubei 430062, China. Bing Rong was employed by Beijing Urban Construction Design & Development Group Co., Limited, Beijing 100037, China. Xuebiao Nie was employed by Beijing Enterprises Water Group (China) Investment Limited, Beijing 100102, China. The remaining authors declare that the research was conducted in the absence of any commercial or financial relationships that could be construed as a potential conflict of interest.

References

  1. Yang, Q.; Wang, Y.; Cao, X.; Liu, X.; Zhang, S. Research Progress of Carbon Neutrality Operation Technology in Sewage Treatment. J. Beijing Univ. Technol. 2022, 48, 292–305. [Google Scholar]
  2. Zylka, R.; Dabrowski, W.; Malinowski, P.; Karolinczak, B. Modeling of Electric Energy Consumption during Dairy Wastewater Treatment Plant Operation. Energies 2020, 13, 3769. [Google Scholar] [CrossRef]
  3. Li, L.; Wang, X.; Miao, J.; Abulimiti, A.; Jing, X.; Ren, N. Carbon neutrality of wastewater treatment-A systematic concept beyond the plant boundary. Environ. Sci. Ecotechnology 2022, 11, 100180. [Google Scholar] [CrossRef] [PubMed]
  4. Tan, X.; Yuan, Z.; Gu, B.; Tan, X.; Xu, B. The accounting for greenhouse gas emissions of a low-carbon industrial park in China: A case study in Chongqing. Energy Procedia 2017, 142, 3176–3181. [Google Scholar] [CrossRef]
  5. Wang, H.; Yi, Y.; Keller, A.A.; Xiang, L.; Li, F. Comparative Analysis of Energy Intensity and Carbon Emissions in Wastewater Treatment in USA, Germany, China and South Africa. Applied Energy 2016, 184, 873–881. [Google Scholar] [CrossRef] [Green Version]
  6. Englehardt, J.; Wu, T.; Bloetscher, F.; Yang, D.; Tchobanoglous, G. Net-zero water management: Achieving energy-positive municipal water supply. Environ. Sci. Water Res. Technol. 2015, 2, 250–260. [Google Scholar] [CrossRef]
  7. Hao, X.; Liu, R.; Xin, H. Evaluation of the potential for operating carbon neutral WWTPs in China. Water Res. 2015, 87, 424–431. [Google Scholar] [CrossRef]
  8. Larsen, T.A. CO2-neutral wastewater treatment plants or robust, climate-friendly wastewater management? A systems perspective-ScienceDirect. Water Res. 2015, 87, 513–521. [Google Scholar] [CrossRef]
  9. Hao, X.; Li, J.; van Loosdrecht, M.C.M.; Jiang, H.; Liu, R. Energy recovery from wastewater: Heat over organics. Water Res. 2019, 161, 74–77. [Google Scholar] [CrossRef]
  10. IPCC. 2019 Refinement to the 2006 IPCC Guidelines for National Greenhouse Gas In ventories, Chacter 6-Wastewater Treatment and Discharge. In Proceedings of the Intergovernmental Panel on Climate Change, Kyoto, Japan, 12 May 2019. [Google Scholar]
  11. Tang, J.; Xie, J.; Chen, C.; Yu, C.; Chen, D. Carbon neutral technologies and case studies in urban sewage treatment plants. Chem. Ind. Eng. Prog. 2022, 41, 2662–2671. [Google Scholar]
  12. Hao, X.; Zhang, Y.; Li, J.; Liu, J. Case Analysis of Energy Neutrality and Carbon Neutrality for Wastewater Treatment. China Water Wastewater 2021, 37, 1–8. [Google Scholar]
  13. Xi, J.; Gong, H.; Zhang, Y.; Dai, X.; Chen, L. The evaluation of GHG emissions from Shanghai municipal wastewater treatment plants based on IPCC and operational data integrated methods (ODIM). Sci. Total Environ. 2021, 797, 148967. [Google Scholar] [CrossRef] [PubMed]
  14. Zeng, S.Y.; Chen, X.; Dong, X.; Liu, Y. Efficiency assessment of urban wastewater treatment plants in China: Considering greenhouse gas emissions. Resour. Conserv. Recycl. 2017, 120, 157–165. [Google Scholar] [CrossRef]
  15. Koutsou, O.P.; Gatidou, G.; Stasinakis, A.S. Domestic wastewater management in Greece: Greenhouse gas emissions estimation at country scale. J. Clean. Prod. 2018, 188, 851–859. [Google Scholar] [CrossRef]
  16. Liao, X.W.; Tian, Y.J.; Gan, Y.W.; Ji, J.P. Quantifying urban wastewater treatment sector’s greenhouse gas emissions using a hybrid life cycle analysis method-An applica tion on Shenzhen city in China. Sci. Total Environ. 2020, 745, 141176. [Google Scholar] [CrossRef] [PubMed]
  17. Khiewwijit, R.; Temmink, H.; Rijnaarts, H.; Keesman, K.J. Energy and nutrient recovery for municipal wastewater treatment: How to design a feasible plant layout? Environ. Model. Softw. 2015, 68, 156–165. [Google Scholar] [CrossRef]
  18. Jin, P.; Li, B.; Mu, D.; Li, X.; Peng, Y. High-efficient nitrogen removal from municipal wastewater via two-stage nitritation/anammox process: Long-term stability assessment and mechanism analysis. Bioresour. Technol. 2019, 271, 150–158. [Google Scholar] [CrossRef]
  19. Oladejo, J.; Shi, K.; Luo, X.; Yang, G.; Wu, T. A Review of Sludge-to-Energy Recovery Methods. Energies 2019, 12, 60. [Google Scholar] [CrossRef] [Green Version]
  20. Hao, X.; Zhao, Z.; Li, J.; Li, S.; Jiang, H. Analysis of energy recovery and carbon neutrality for the Kakolanmaki WWTP in Finland. Chin. J. Environ. Eng. 2021, 15, 2849–2857. [Google Scholar]
  21. Rossi, R.; Hur, A.Y.; Page, M.A.; Thomas, A.O.B.; Butkiewicz, J.J.; Jones, D.W.; Baek, G.; Saikaly, P.E.; Cropek, D.M.; Logan, B.E. Pilot scale microbial fuel cells using air cathodes for producing electricity while treating wastewater. Water Res. 2022, 215, 118208. [Google Scholar] [CrossRef]
  22. Chai, C.; Zhang, D.; Yu, Y.; Feng, Y.; Wong, M.S. Carbon footprint analyses of mainstream wastewater treatment technologies under different sludge treatment scenarios in China. MDPI AG 2015, 7, 918–938. [Google Scholar] [CrossRef]
  23. DB11/890—2012; Discharge Standard of Water Pollutants for Municipal Wastewater Treatment Plants. Beijing Municipal Bureau of Environmental Protection; Beijing Municipal Bureau of Quality and Technical Supervision: Beijing, China, 2012.
  24. Comparison of Scale, Process, Inlet and Outlet Water Quality of 15 Sewage Treatment Plants in Beijing. Available online: https://max.book118.com/html/2021/0312/5304343002003143.shtm (accessed on 13 March 2021).
  25. Foley, J.; de Haas, D.; Yuan, Z.; Lant, P. Nitrous oxide generation in full-scale biological nutrient removal wastewater treatment plants. Water Res. 2010, 44, 831–844. [Google Scholar] [CrossRef] [PubMed]
  26. Hao, X.; Wang, B.; Liu, R.; Jiang, H. Carbon neutrality vs excess methane release from water environments/the methane paradox. Acta Sci. Circumstantiae 2021, 41, 1593–1598. [Google Scholar]
  27. Lelieveld, J.; Lechtenbohmer, S.; Assonov, S.S.; Brenninkmeijer, C.A.; Dienst, C.; Fischedick, M.; Hanke, T. Greenhouse gases: Low methane leakage from gas pipelines. Nature 2005, 434, 841–842. [Google Scholar] [CrossRef]
  28. Jing, L.; Wei, A.; Da, T.Q.; Qing, W. Evironmental Impact Report of Beijing Gaobeidian Sewage Treatment Plant Sludge Advanced Digestion Project. Available online: https://jz.docin.com/p-1367485451.html (accessed on 22 November 2015).
  29. Zhang, Y.; Ge, T.; Sun, Y.; Liu, J.; Gao, C.; Zhang, W. Research on Carbon Emission Model Based on the Whole Process of Urban Sewage Treatment. China Water Wastewater 2021, 37, 65–74. [Google Scholar]
  30. DB11/T 1785—2020; Requirements for Carbon Dioxide Emission Accounting and Reporting Service Enterprises. Beijing Municipal Administration of Market Supervision: Beijing, China, 2020.
  31. Niu, D.J.; Huang, H.; Dai, X.H.; Zhao, Y.C. Greenhouse gases emissions accounting for typical sewage sludge digestion with energy utilization and residue land application in China. Waste Manag. 2013, 33, 123–128. [Google Scholar] [CrossRef]
  32. Hao, X.; Rao, Z.; Li, S.; Li, J.; Jiang, H. Potential Carbon Trading Volume of Thermal Energy Contained in Wastewater. China Water Wastewater 2021, 37, 7–13. [Google Scholar]
  33. Song, X.; Lin, J.; Liu, J.; Xu, X.; Li, J.; Li, C.; Jiang, H.; Wang, H.; Yin, F. The current situation and engineering practice of sewage treatment technology facing the future. Acta Sci. Circumstantiae 2021, 41, 39–53. [Google Scholar]
  34. Li, P.; Jiang, Q.; Zhang, Z.; Wang, J. Upgrading reconstruction operation optimizing of Gaobeidian Reclaimed Water Plant. Water Wastewater Eng. 2019, 55, 13–17. [Google Scholar]
Figure 1. The system boundaries of (A) Gaobeidian WWTP, (B) the wastewater treatment process, and (C) the sludge treatment process for calculating the carbon footprint.
Ijerph 20 00140 g001
Figure 2. Annual energy consumption, actual energy recovery, and improved energy recovery after extracting heat from the secondary effluent in Gaobeidian WWTP.
Ijerph 20 00140 g002
Figure 3. The composition of carbon emission from Gaobeidian WWTP.
Ijerph 20 00140 g003
Figure 4. Carbon emission, actual carbon emission reduction, and improved carbon emission reduction after the complete extraction of heat from the secondary effluent in Gaobeidian WWTP.
Ijerph 20 00140 g004
Table 1. Qualities of the influent and effluent in Gaobeidian WWTP.
Water Quality IndexesInfluent (mg/L) [24]Effluent (mg/L) [24]Removal
Efficiency (%)
Effluent Standards (mg/L) [23]
COD2831595%30
BOD51752.599%6
TP6.900.05999%0.3
TN50.610.978%15
SS239<5>98%5
Chroma505.489%15
NH4+-N44.280.4599%1.5
Table 2. Energy consumption of Gaobeidian WWTP [28].
ProjectsEnergy Consumption (MWh/y)
Electricity consumption of the wastewater treatment process94,900
Electricity consumption of the sludge treatment unit20,795
Thermal hydrolysis of sludge104,920
Electricity consumption of the pump station52,080
Heating system for buildings4133
Electricity consumption of administrative buildings3793
Electricity consumption of fuel transportation96
Total280,717
Table 3. Theoretical heating and cooling capacity of the water-source heat pump system in Gaobeidian WWTP.
ProjectCOP [32]Heating/Cooling Capacity
(GJ/y)
Equivalent Electricity (MWh/y)Energy Consumption by Water-Source Heat Pump (MWh/y)Net Energy
Production (MWh/y)
Heating capacity4.247,417,4872,060,413485,9471,574,467
Cooling capacity4.164,569,6151,269,337305,129964,208
Table 4. Calculations of energy recovery in Gaobeidian WWTP.
ProjectActual
Energy
Recovery (MWh/y)
Proportion (%)Energy Recovery after
Residual Thermal Energy
Utilization (MWh/y)
Proportion (%)
Biogas system178,94066.6178,94012.2
Ventilation system20,2387.520,2381.4
Water source heat pump system69,61025.91,269,33786.4
Total268,7881001,468,515100
Table 5. Direct carbon emissions from Gaobeidian WWTP.
Emission ProcessGHG SpeciesGHG Emission (t/y)Carbon Emission (t/y)
Wastewater treatmentCO211,75111,751217,117
CH4258254,230
N2O507151,136
Sludge treatment and disposalCH4 (from anaerobic digestion)54311,41262,054
CH4 (from land application)2234684
N2O (from land application)15445,958
Total279,171
Table 6. Chemical consumption and its indirect carbon emission.
ChemicalsAnnual
Consumption (t/y) [28]
UsageCarbon Emission
Factor (kg CO2/kg)
Indirect Carbon Emission (t/y)
Sodium acetate10,950External carbon source1.415,330
Sodium hypochlorite4562.5Disinfectant0.894061
Polyacrylamide (PAM)461.7Dewatering flocculant1.9877
Fe2O325.5Dry desulfurizer for biogas1.333
FeCl3 (38%)601.4Desulfurizer in digester0.18108
Polyaluminum chloride (PAC)32.9Chemical phosphors removal0.53718
Total20,427
Table 7. Energy recovery from sludge treatment and its corresponding carbon emission reduction.
Total Energy Recovery from Sludge Treatment Process (MWh/y)Energy Recovery PathwayEnergy (MWh/y) [12]CO2 Emission
Factor of
Electricity/Heat
Carbon
Emission
Reduction (t/y)
178,940Electrical energy from heat and power cogeneration43,0400.604 t/MWh25,996
Heat recovery from flue gases19,3700.11 t/GJ7671
Heat recovery from water cylinder jackets24,7509801
Heat recovery from boiler steams91,78036,345
Total79,813
Table 8. Calculation of the total carbon emission reduction.
Carbon Emission ProjectPresent Carbon Emission
Reduction (t/y)
Proportion (%)Carbon Emission
Reduction after Residual Thermal Energy
Utilization (t/y)
Proportion (%)
Water quality improvement113,87845.0113,87811.6
Sludge treatment and disposal processesBiogas system79,81331.579,8138.2
Sludge land application69322.769320.7
Anammox system23130.923130.2
Ventilation system80143.280140.8
Water source heat pump system42,04416.6766,68078.4
Total252,994100977,630100
Table 9. Carbon footprint calculations.
TypeCarbon Emission (t/y)Carbon Emission
Reduction (t/y)
Carbon Sink (t/y)Carbon Neutrality Rate (%)
Actual446,468−252,994193,47456.7%
After residual thermal energy utilization446,468−977,630−531,162219.0%
Disclaimer/Publisher’s Note: The statements, opinions and data contained in all publications are solely those of the individual author(s) and contributor(s) and not of MDPI and/or the editor(s). MDPI and/or the editor(s) disclaim responsibility for any injury to people or property resulting from any ideas, methods, instructions or products referred to in the content.

