
A Cross-Sectional Study about the Associations between Physical Activity Level, Self-Perceived Health Perception and Mental Health in Informal Caregivers of Elderly or People with Chronic Conditions in Spain

 ,
,  ,
,  ,
,  , , ,
, , ,  , and
, and 
Abstract
1. Introduction
2. Materials and Methods
2.1. Study Design and Ethical Concerns
2.2. Participants
2.3. Measures and Variables
2.3.1. Extracted Variables
2.3.2. Elaborated Variables
- Successful coping (FI). The variable was derived from the GHQ-12. It was obtained with the sum of the responses to the items: Q.47.1, Q.47.3, Q.47.4, Q.47.7, Q.47.8 and Q.47.12. The score range was 0 and 18, with 0 being the most successful coping and 18 the worst. This factor has an external validity of 0.82 [46].
- Self-esteem (FII). The variable was derived from the GHQ-12. It was obtained from the sum of the responses to the items: Q.47.6, Q.47.9, Q.47.10 and Q.47.11. It presents scores between 0 and 12, with 0 being the highest self-esteem and 12, the lowest. This factor has an external validity of 0.70 [46]
- Stress (FIII). The variable was derived from the GHQ-12. It was obtained with the sum of the responses to the items: Q.47.2, Q.47.5 and Q.47.9. It presents scores between 0 and 9, with 0 being the least stressful and 9 the most stressful. This factor has an external validity of 0.75 [46].
- Q113: “During the last seven days, how many days did you do vigorous physical activity? Vigorous activity requires great physical exertion and makes you breathe much harder than usual, such as heavy lifting, digging, aerobic exercise, or fast pedalling on a bicycle. Think only of those you performed for at least ten consecutive minutes”. Possible answers would be the number of days per week performed, none, do not know/no answer.
- Q.115: “During the last seven days, how many days did you do moderate physical activity? Please do not include walking. Moderate activities require moderate physical exertion that makes you breathe harder than usual, such as carrying light weights, cycling at a regular speed, or playing tennis doubles. Think only of those you did for at least ten consecutive minutes”. Possible answers would be the number of days per week performed, none, do not know/no answer.
- Q.117: “Now think about how much time you spent walking in the last seven days. This includes walking at work, home, and from one place to another, or walking for sport, exercise, or pleasure. Think only of those occasions when you walked for at least ten consecutive minutes”. Possible answers would be the number of days per week, none, do not know/no answer.
2.4. Statistical Analysis
3. Results
4. Discussion
4.1. Main Findings and Theoretical Implications
4.2. Practical Implications
4.3. Limitations and Future Lines
5. Conclusions
Author Contributions
Funding
Institutional Review Board Statement
Informed Consent Statement
Data Availability Statement
Acknowledgments
Conflicts of Interest
References
- Metzelthin, S.F.; Verbakel, E.; Veenstra, M.Y.; van Exel, J.; Ambergen, A.W.; Kempen, G. Positive and Negative Outcomes of Informal Caregiving at Home and in Institutionalised Long-Term Care: A Cross-Sectional Study. BMC Geriatr. 2017, 17, 232. [Google Scholar] [CrossRef] [PubMed]
- Lopreite, M.; Mauro, M. The Effects of Population Ageing on Health Care Expenditure: A Bayesian VAR Analysis Using Data from Italy. Health Policy 2017, 121, 663–674. [Google Scholar] [CrossRef] [PubMed]
- Shrank, W.H.; DeParle, N.-A.; Gottlieb, S.; Jain, S.H.; Orszag, P.; Powers, B.W.; Wilensky, G.R. Health Costs and Financing: Challenges And Strategies for a New Administration: Commentary Recommends Health Cost, Financing, and Other Priorities for a New US Administration. Health Aff. 2021, 40, 235–242. [Google Scholar] [CrossRef] [PubMed]
- Department of Economic and Social Affairs Population Division. World Population Prospects 2019 Highlights 2019; United Nations: New York, NY, USA, 2019. [Google Scholar]
- Bimou, C.; Harel, M.; Laubarie-Mouret, C.; Cardinaud, N.; Charenton-Blavignac, M.; Toumi, N.; Trimouillas, J.; Gayot, C.; Boyer, S.; Hebert, R.; et al. Patterns and Predictive Factors of Loss of the Independence Trajectory among Community-Dwelling Older Adults. BMC Geriatr. 2021, 21, 142. [Google Scholar] [CrossRef]
- Li, J.; Song, Y. Formal and Informal Care. In Encyclopedia of Gerontology and Population Aging; Gu, D., Dupre, M.E., Eds.; Springer International Publishing: Cham, Switzerland, 2019; pp. 1–8. ISBN 978-3-319-69892-2. [Google Scholar]
- Smith, L.; Shin, J.I.; Oh, H.; López Sánchez, G.F.; Underwood, B.; Jacob, L.; Veronese, N.; Soysal, P.; Butler, L.; Barnett, Y.; et al. Anxiety Symptoms among Informal Caregivers in 47 Low- and Middle-Income Countries: A Cross-Sectional Analysis of Community-Based Surveys. J. Affect. Disord. 2022, 298, 532–539. [Google Scholar] [CrossRef]
- Lin, W. The Relationship between Formal and Informal Care among Chinese Older Adults: Based on the 2014 CLHLS Dataset. BMC Health Serv. Res. 2019, 19, 323. [Google Scholar] [CrossRef] [PubMed]
- Banks, J.; Batty, G.D.; Nazroo, J.Y.; Steptoe, A. The Dynamics of Ageing: Evidence from the English Longitudinal Study of Ageing 2002-15 (Wave 7); Institute for Physical Studies: London, UK, 2016. [Google Scholar]
- Muñoz-Bermejo, L.; Adsuar, J.C.; Postigo-Mota, S.; Casado-Verdejo, I.; de Melo-Tavares, C.M.; Garcia-Gordillo, M.; Pérez-Gómez, J.; Carlos-Vivas, J. Relationship of Perceived Social Support with Mental Health in Older Caregivers. Int. J. Environ. Res. Public Health 2020, 17, 3886. [Google Scholar] [CrossRef]
- Anastos-Wallen, R.; Werner, R.M.; Chatterjee, P. Prevalence of Informal Caregiving in States Participating in the US Patient Protection and Affordable Care Act Balancing Incentive Program, 2011–2018. JAMA Netw. Open 2020, 3, e2025833. [Google Scholar] [CrossRef] [PubMed]
- Jacob, L.; Smith, L.; Jackson, S.E.; Shin, J.I.; Haro, J.M.; Vancampfort, D.; Stubbs, B.; Koyanagi, A. Informal Caregiving and Physical Activity among 204,315 Adults in 38 Low- and Middle-Income Countries: A Cross-Sectional Study. Prev. Med. 2020, 132, 106007. [Google Scholar] [CrossRef] [PubMed]
- Zueras, P.; Spijker, J.; Blanes, A. Evolución del perfil de los cuidadores de personas de 65 y más años con discapacidad en la persistencia de un modelo de cuidado familiar. Rev. Esp. Geriatr. Gerontol. 2018, 53, 66–72. [Google Scholar] [CrossRef]
- Machón, M.; Vergara, I.; Dorronsoro, M.; Vrotsou, K.; Larrañaga, I. Self-Perceived Health in Functionally Independent Older People: Associated Factors. BMC Geriatr. 2016, 16, 66. [Google Scholar] [CrossRef] [PubMed]
- Bonner, W.I.A.; Weiler, R.; Orisatoki, R.; Lu, X.; Andkhoie, M.; Ramsay, D.; Yaghoubi, M.; Steeves, M.; Szafron, M.; Farag, M. Determinants of Self-Perceived Health for Canadians Aged 40 and Older and Policy Implications. Int. J. Equity Health 2017, 16, 94. [Google Scholar] [CrossRef] [PubMed]
- Pereira-de-Sousa, A.M.; López-Rodríguez, J.A. Salud autopercibida en ancianos jóvenes españoles y portugueses tras la recesión según la Encuesta Europea de Salud: Un estudio transversal. Aten. Primaria 2021, 53, 102064. [Google Scholar] [CrossRef] [PubMed]
- Lacey, R.E.; McMunn, A.; Webb, E. Informal Caregiving Patterns and Trajectories of Psychological Distress in the UK Household Longitudinal Study. Psychol. Med. 2019, 49, 1652–1660. [Google Scholar] [CrossRef]
- McDonald, J.; Swami, N.; Pope, A.; Hales, S.; Nissim, R.; Rodin, G.; Hannon, B.; Zimmermann, C. Caregiver Quality of Life in Advanced Cancer: Qualitative Results from a Trial of Early Palliative Care. Palliat. Med. 2018, 32, 69–78. [Google Scholar] [CrossRef]
- Lapid, M.I.; Atherton, P.J.; Kung, S.; Sloan, J.A.; Shahi, V.; Clark, M.M.; Rummans, T.A. Cancer Caregiver Quality of Life: Need for Targeted Intervention. Psychooncology 2016, 25, 1400–1407. [Google Scholar] [CrossRef]
- Sallim, A.B.; Sayampanathan, A.A.; Cuttilan, A.; Chun-Man Ho, R. Prevalence of Mental Health Disorders Among Caregivers of Patients With Alzheimer Disease. J. Am. Med. Dir. Assoc. 2015, 16, 1034–1041. [Google Scholar] [CrossRef]
- Loh, A.Z.; Tan, J.S.; Zhang, M.W.; Ho, R.C. The Global Prevalence of Anxiety and Depressive Symptoms Among Caregivers of Stroke Survivors. J. Am. Med. Dir. Assoc. 2017, 18, 111–116. [Google Scholar] [CrossRef]
- Baboolal, N.; Davis, G.; Stewart, R.; Ramesar, J.; McRae, A. Comparisons between Different Elements of Reported Burden and Common Mental Disorder in Caregivers of Ethnically Diverse People with Dementia in Trinidad. PLoS ONE 2018, 13, e0201165. [Google Scholar] [CrossRef]
- Hernández-Padilla, J.M.; Ruiz-Fernández, M.D.; Granero-Molina, J.; Ortíz-Amo, R.; López Rodríguez, M.M.; Fernández-Sola, C. Perceived Health, Caregiver Overload and Perceived Social Support in Family Caregivers of Patients with Alzheimer’s: Gender Differences. Health Soc. Care Community 2021, 29, 1001–1009. [Google Scholar] [CrossRef]
- Gomes, A.C.; Rebelo, M.A.B.; de Queiroz, A.C.; Herkrath, A.; Herkrath, F.J.; Vieira, J.M.R.; Pereira, J.V.; Vettore, M.V. Socioeconomic Status, Social Support, Oral Health Beliefs, Psychosocial Factors, Health Behaviours and Health-Related Quality of Life in Adolescents. Qual. Life Res. 2020, 29, 141–151. [Google Scholar] [CrossRef] [PubMed]
- Hazzan, A.A.; Dauenhauer, J.; Follansbee, P.; Hazzan, J.O.; Allen, K.; Omobepade, I. Family Caregiver Quality of Life and the Care Provided to Older People Living with Dementia: Qualitative Analyses of Caregiver Interviews. BMC Geriatr. 2022, 22, 86. [Google Scholar] [CrossRef] [PubMed]
- Perdomo-Romero, A.Y.; Ramírez-Perdomo, C.A. Perception of Quality of Life in Caregivers of Patients with Dementia. Rev. Cient. Soc. Enferm. Neurol. 2017, 46, 26–31. [Google Scholar] [CrossRef]
- Flesch, L.; Batistoni, S.; Neri, A.; Cachioni, M. Psychological Aspects of the Quality of Life of Caregivers of the Elderly: An Integrative Review. Geriatr. Gerontol. Aging 2017, 11, 138–149. [Google Scholar] [CrossRef]
- Van der Lee, J.; Bakker, T.J.E.M.; Duivenvoorden, H.J.; Dröes, R.-M. Do Determinants of Burden and Emotional Distress in Dementia Caregivers Change over Time? Aging Ment. Health 2017, 21, 232–240. [Google Scholar] [CrossRef]
- Gonçalves, A.-C.; Demain, S.; Samuel, D.; Marques, A. Physical Activity for People Living with Dementia: Carer Outcomes and Side Effects from the Perspectives of Professionals and Family Carers. Aging Clin. Exp. Res. 2021, 33, 1267–1274. [Google Scholar] [CrossRef]
- Jakicic, J.M.; Rogers, R.J.; Davis, K.K.; Collins, K.A. Role of Physical Activity and Exercise in Treating Patients with Overweight and Obesity. Clin. Chem. 2018, 64, 99–107. [Google Scholar] [CrossRef]
- Bull, F.C.; Al-Ansari, S.S.; Biddle, S.; Borodulin, K.; Buman, M.P.; Cardon, G.; Carty, C.; Chaput, J.-P.; Chastin, S.; Chou, R.; et al. World Health Organization 2020 Guidelines on Physical Activity and Sedentary Behaviour. Br. J. Sports Med. 2020, 54, 1451–1462. [Google Scholar] [CrossRef]
- Wolf, S.; Seiffer, B.; Zeibig, J.M.; Welkerling, J.; Brokmeier, L.; Atrott, B.; Ehring, T.; Schuch, F.B. Is Physical Activity Associated with Less Depression and Anxiety During the COVID-19 Pandemic? A Rapid Systematic Review. Sports Med. 2021, 51, 1771–1783. [Google Scholar] [CrossRef]
- McDowell, C.P.; Dishman, R.K.; Gordon, B.R.; Herring, M.P. Physical Activity and Anxiety: A Systematic Review and Meta-Analysis of Prospective Cohort Studies. Am. J. Prev. Med. 2019, 57, 545–556. [Google Scholar] [CrossRef]
- O’Neill, A.; O’Sullivan, K.; McCreesh, K. Lower Levels of Physical Activity Are Associated with Pain Progression in Older Adults, a Longitudinal Study. Eur. J. Pain 2021, 25, 1462–1471. [Google Scholar] [CrossRef] [PubMed]
- Gill, D.L.; Hammond, C.C.; Reifsteck, E.J.; Jehu, C.M.; Williams, R.A.; Adams, M.M.; Lange, E.H.; Becofsky, K.; Rodriguez, E.; Shang, Y.-T. Physical Activity and Quality of Life. J. Prev. Med. Public Health 2013, 46, S28–S34. [Google Scholar] [CrossRef] [PubMed]
- Marquez, D.X.; Aguiñaga, S.; Vásquez, P.M.; Conroy, D.E.; Erickson, K.I.; Hillman, C.; Stillman, C.M.; Ballard, R.M.; Sheppard, B.B.; Petruzzello, S.J.; et al. A Systematic Review of Physical Activity and Quality of Life and Well-Being. Transl. Behav. Med. 2020, 10, 1098–1109. [Google Scholar] [CrossRef] [PubMed]
- Baik, D.; Song, J.; Tark, A.; Coats, H.; Shive, N.; Jankowski, C. Effects of Physical Activity Programs on Health Outcomes of Family Caregivers of Older Adults with Chronic Diseases: A Systematic Review. Geriatr. Nurs. 2021, 42, 1056–1069. [Google Scholar] [CrossRef]
- Doyle, K.L.; Toepfer, M.; Bradfield, A.F.; Noffke, A.; Ausderau, K.K.; Andreae, S.; Pickett, K.A. Systematic Review of Exercise for Caregiver–Care Recipient Dyads: What Is Best for Spousal Caregivers—Exercising Together or Not at All? Gerontologist 2021, 61, e283–e301. [Google Scholar] [CrossRef] [PubMed]
- Montero-Cuadrado, F.; Galán-Martín, M.Á.; Sánchez-Sánchez, J.; Lluch, E.; Mayo-Iscar, A.; Cuesta-Vargas, Á. Effectiveness of a Physical Therapeutic Exercise Programme for Caregivers of Dependent Patients: A Pragmatic Randomised Controlled Trial from Spanish Primary Care. Int. J. Environ. Res. Public Health 2020, 17, 7359. [Google Scholar] [CrossRef]
- Ministerio de Sanidad, Consumo y Bienestar Social. Gobierno de España Encuesta Nacional de Salud. 2017. Available online: https://www.mscbs.gob.es/estadEstudios/estadisticas/encuestaNacional/encuesta2017.htm (accessed on 14 January 2022).
- Ministerio de Sanidad, Consumo y Bienestar Social. Encuesta Nacional De Salud 2017 Metodología; Instituto Nacional de Estadística: Madrid, Spain, 2017; pp. 1–64.
- Ministerio de Sanidad, Consumo y Bienestar Social. Encuesta Nacional De Salud 2017 Cuestionario De Adultos; Instituto Nacional de Estadística: Madrid, Spain, 2017; pp. 1–61.
- Union Europea. Reglamento (UE) 2016/679 Del Parlamento Europeo y Del Consejo de 27 de Abril de 2016 Relativo a La Protección de Las Personas Físicas En Lo Que Respecta al Tratamiento de Datos Personales Ya La Libre Circulación de Estos Datos y Por El Que Se Deroga La Directiva 95/46/CE (Reglamento General de Protección de Datos)(Texto Pertinente a Efectos Del EEE); Eur-Lex: Luxembourg, 2021. [Google Scholar]
- Goldberg, D.P.; Williams, P. A User’s Guide to the General Health Questionnaire; NFER-NELSON: Windsor, UK, 1988. [Google Scholar]
- Rocha, K.B.; Perez, K.; Rodriguez-Sanz, M.; Borrell, C.; Obiols, J.E. Psychometric Properties and Normative Values of General Health Questionnaire (GHQ-12) in Spanish Population. Int. J. Clin. Health Psychol. 2011, 11, 125–139. [Google Scholar]
- Del Pilar Sánchez-López, M.; Dresch, V. The 12-Item General Health Questionnaire (GHQ-12): Reliability, External Validity and Factor Structure in the Spanish Population. Psicothema 2008, 20, 839–843. [Google Scholar]
- Craig, C.L.; Marshall, A.L.; Sjöström, M.; Bauman, A.E.; Booth, M.L.; Ainsworth, B.E.; Pratt, M.; Ekelund, U.; Yngve, A.; Sallis, J.F.; et al. International Physical Activity Questionnaire: 12-Country Reliability and Validity. Med. Sci. Sports Exerc. 2003, 35, 1381–1395. [Google Scholar] [CrossRef]
- Martínez Marcos, M.; De la Cuesta Benjumea, C. La experiencia del cuidado de las mujeres cuidadoras con procesos crónicos de salud de familiares dependientes. Aten. Primaria 2016, 48, 77–84. [Google Scholar] [CrossRef][Green Version]
- Instituto Nacional de Estadística y Ministerio de Sanidad, Servicios Sociales e Igualdad. Mujeres y Hombres En España; Catálogo de Publicaciones de la Administración General del Estado: Madrid, Spain, 2015.
- Arnsberger, P.; Lynch, U.; Li, F. The Effects of Caregiving on Women’s Self-Assessed Health Status: An International Comparison. Health Care Women Int. 2012, 33, 878–895. [Google Scholar] [CrossRef] [PubMed]
- Calvente, M.G.; del Río Lozano, M.; Marcos, J.M. Desigualdades de Género En El Deterioro de La Salud Como Consecuencia Del Cuidado Informal En España. Gac. Sanit. 2011, 25, 100–107. [Google Scholar] [CrossRef] [PubMed]
- Duggleby, W.; Williams, A.; Ghosh, S.; Moquin, H.; Ploeg, J.; Markle-Reid, M.; Peacock, S. Factors Influencing Changes in Health Related Quality of Life of Caregivers of Persons with Multiple Chronic Conditions. Health Qual. Life Outcomes 2016, 14, 81. [Google Scholar] [CrossRef] [PubMed]
- Pollard, T.M.; Wagnild, J.M. Gender Differences in Walking (for Leisure, Transport and in Total) across Adult Life: A Systematic Review. BMC Public Health 2017, 17, 341. [Google Scholar] [CrossRef]
- Goel, R.; Oyebode, O.; Foley, L.; Tatah, L.; Millett, C.; Woodcock, J. Gender Differences in Active Travel in Major Cities across the World. Transportation 2022, 1–17. [Google Scholar] [CrossRef]
- Abu Saad, H.; Low, P.K.; Jamaluddin, R.; Chee, H.P. Level of Physical Activity and Its Associated Factors among Primary Healthcare Workers in Perak, Malaysia. Int. J. Environ. Res. Public Health 2020, 17, 5947. [Google Scholar] [CrossRef]
- Warburton, D.E.R. Health Benefits of Physical Activity: The Evidence. Can. Med. Assoc. J. 2006, 174, 801–809. [Google Scholar] [CrossRef]
- Kaleta, D.; Makowiec-Dąbrowska, T.; Dziankowska-Zaborszczyk, E.; Jegier, A. Physical Activity and Self-Perceived Health Status. Int. J. Occup. Med. Environ. Health 2006, 19, 61. [Google Scholar] [CrossRef]
- Ihász, F.; Schulteisz, N.; Finn, K.J.; Szabó, K.; Gangl, J.; Nagy, D.; Ács, P.; Oláh, A. Associations between Fitness Levels and Self-Perceived Health-Related Quality of Life in Community—Dwelling for a Group of Older Females. BMC Public Health 2020, 20, 1057. [Google Scholar] [CrossRef]
- Bernard, P.; Doré, I.; Romain, A.J.; Hains-Monfette, G.; Kingsbury, C.; Sabiston, C. Dose Response Association of Objective Physical Activity with Mental Health in a Representative National Sample of Adults: A Cross-Sectional Study. PLoS ONE 2018, 13, e0204682. [Google Scholar] [CrossRef]
- Hamer, M.; Coombs, N.; Stamatakis, E. Associations between Objectively Assessed and Self-Reported Sedentary Time with Mental Health in Adults: An Analysis of Data from the Health Survey for England. BMJ Open 2014, 4, e004580. [Google Scholar] [CrossRef] [PubMed]
- Madruga, M.; Gozalo, M.; Prieto, J.; Rohlfs Domínguez, P.; Gusi, N. Effects of a Home-Based Exercise Program on Mental Health for Caregivers of Relatives with Dementia: A Randomized Controlled Trial. Int. Psychogeriatr. 2021, 33, 359–372. [Google Scholar] [CrossRef] [PubMed]
- Castro, C.M.; Wilcox, S.; O’Sullivan, P.; Baumann, K.; King, A.C. An Exercise Program for Women Who Are Caring for Relatives with Dementia. Psychosom Med. 2002, 64, 458–468. [Google Scholar] [CrossRef]
- King, A.C.; Baumann, K.; O’Sullivan, P.; Wilcox, S.; Castro, C. Effects of Moderate-Intensity Exercise on Physiological, Behavioral, and Emotional Responses to Family Caregiving: A Randomized Controlled Trial. J. Gerontol. Biol. Sci. Med. Sci. 2002, 57, M26–M36. [Google Scholar] [CrossRef] [PubMed]
- Connell, C.M.; Janevic, M.R. Effects of a Telephone-Based Exercise Intervention for Dementia Caregiving Wives: A Randomized Controlled Trial. J. Appl. Gerontol. 2009, 28, 171–194. [Google Scholar] [CrossRef]
- Orgeta, V.; Miranda-Castillo, C. Does Physical Activity Reduce Burden in Carers of People with Dementia? A Literature Review. Int. J. Geriatr. Psychiatry 2014, 29, 771–783. [Google Scholar] [CrossRef]
- Hirano, A.; Suzuki, Y.; Kuzuya, M.; Onishi, J.; Ban, N.; Umegaki, H. Influence of Regular Exercise on Subjective Sense of Burden and Physical Symptoms in Community-Dwelling Caregivers of Dementia Patients: A Randomized Controlled Trial. Arch. Gerontol. Geriatr. 2011, 53, e158–e163. [Google Scholar] [CrossRef]
- Vogtmann, H.; Maier, J. The future we want. In Proceedings of the United Nations Conference on Sustainable Development (UNCSD or “Rio + 20”), Rio de Janeiro, Brazil, 20–22 June 2012. [Google Scholar]


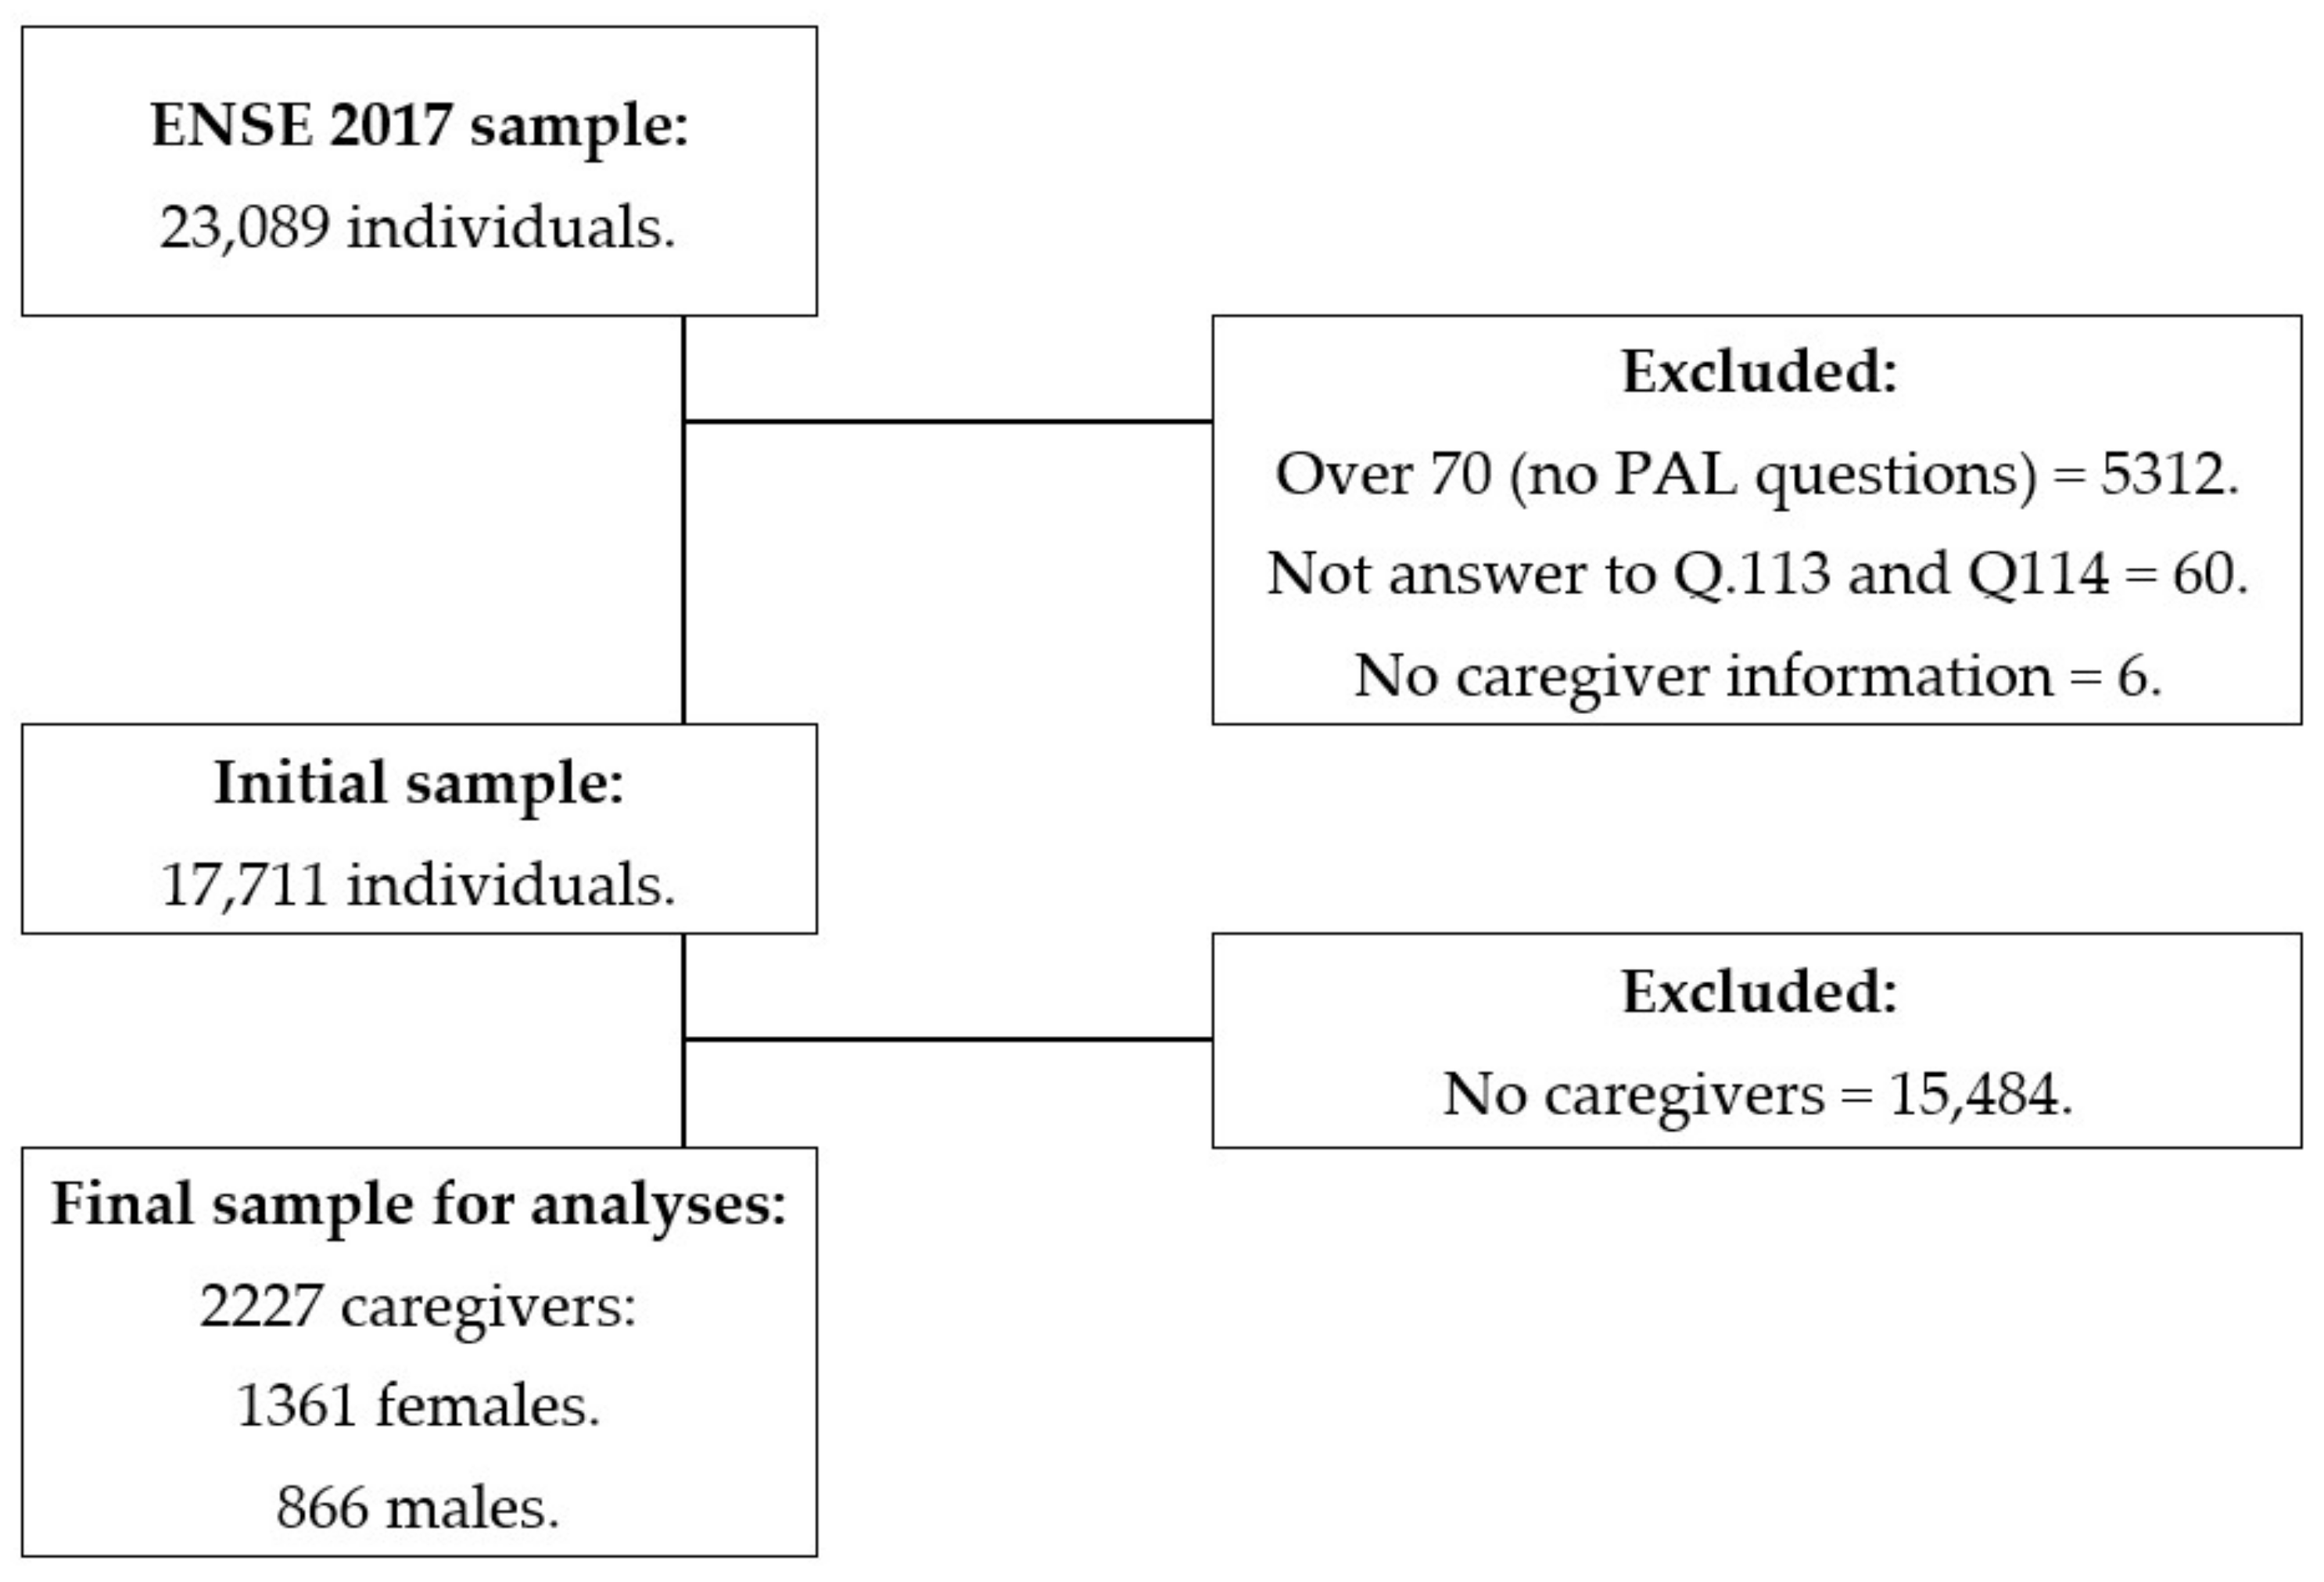
| Age (Years) | Total = 17,711 | Men = 8486 | Women = 9225 | p-Value from the Mann–Whitney U Test |
| Median (IQR) | 47 (21) | 47 (21) | 47 (21) | 0.329 |
| Caregivers | Total = 17,711 | Men = 8486 n (%) | Women = 9225 n (%) | p-Value from the Chi-Square Test |
| Yes | 2227 (12.6) | 866 (10.2) a | 1361 (14.8) b | <0.001 |
| No | 15,484 (87.4) | 7620 (89.8) a | 7864 (85.2) b |
| Age (Years) | Total = 2227 | Men = 866 n (%) | Women = 1361 n (%) | p-Value from the Chi-Square Test |
| Median (IQR) | 52 (15) | 52 (15) | 52 (14) | 0.272 |
| Caring Amount of Time (hours) | Total = 2220 | Men = 863 n (%) | Women = 1357 n (%) | |
| Less than 10 | 870 (39.0) | 383 (44.4) a | 485 (35.8) b | <0.001 |
| Between 10–20 | 461 (20.7) | 183 (21.2) a | 276 (20.3) a | |
| More than 20 | 897 (40.3) | 297 (34.4) a | 596 (43.9) b | |
| Self-Perceived Health | Total = 2227 | Men = 866 n (%) | Women = 1366 n (%) | |
| Very good | 300 (13.5) | 138 (15.9) a | 162 (11.9) b | <0.001 |
| Good | 1231 (55.3) | 486 (56.1) a | 745 (54.7) a | |
| Fair | 530 (23.8) | 181 (20.9) a | 349 (25.6) b | |
| Bad | 137 (6.2) | 52 (6.0) a | 85 (6.2) a | |
| Very Bad | 29 (1.3) | 9 (1.0) a | 20 (1.5) a | |
| Mental Health (GHQ-12) | Total = 2215 | Men = 863 | Women = 1352 | p-Value from the Mann–Whitney U test |
| Median (IQR) | 10 (4) | 10 (5) | 10 (4) | <0.001 |
| Mean (SD) | 10.9 (4.8) | 10.4 (4.7) | 11.1 (4.9) | |
| FI. Successful coping | Total = 2215 | Men = 863 | Women = 1352 | |
| Median (IQR) | 6 (0) | 6 (0) | 6 (0) | 0.506 |
| Mean (SD) | 6.3 (1.8) | 6.3 (1.7) | 6.4 (1.8) | |
| FII. Self-esteem | Total = 2215 | Men = 863 | Women = 1352 | |
| Median (IQR) | 2 (4) | 2 (4) | 2 (4) | <0.001 |
| Mean (SD) | 2.4 (2.4) | 2.2 (2.3) | 2.5 (2.4) | |
| FIII. Stress | Total = 2215 | Men = 866 | Women = 1357 | |
| Median (IQR) | 3 (3) | 3 (3) | 3 (2) | <0.001 |
| Mean (SD) | 3.0 (2.1) | 2.6 (2.1) | 3.1 (2.1) |
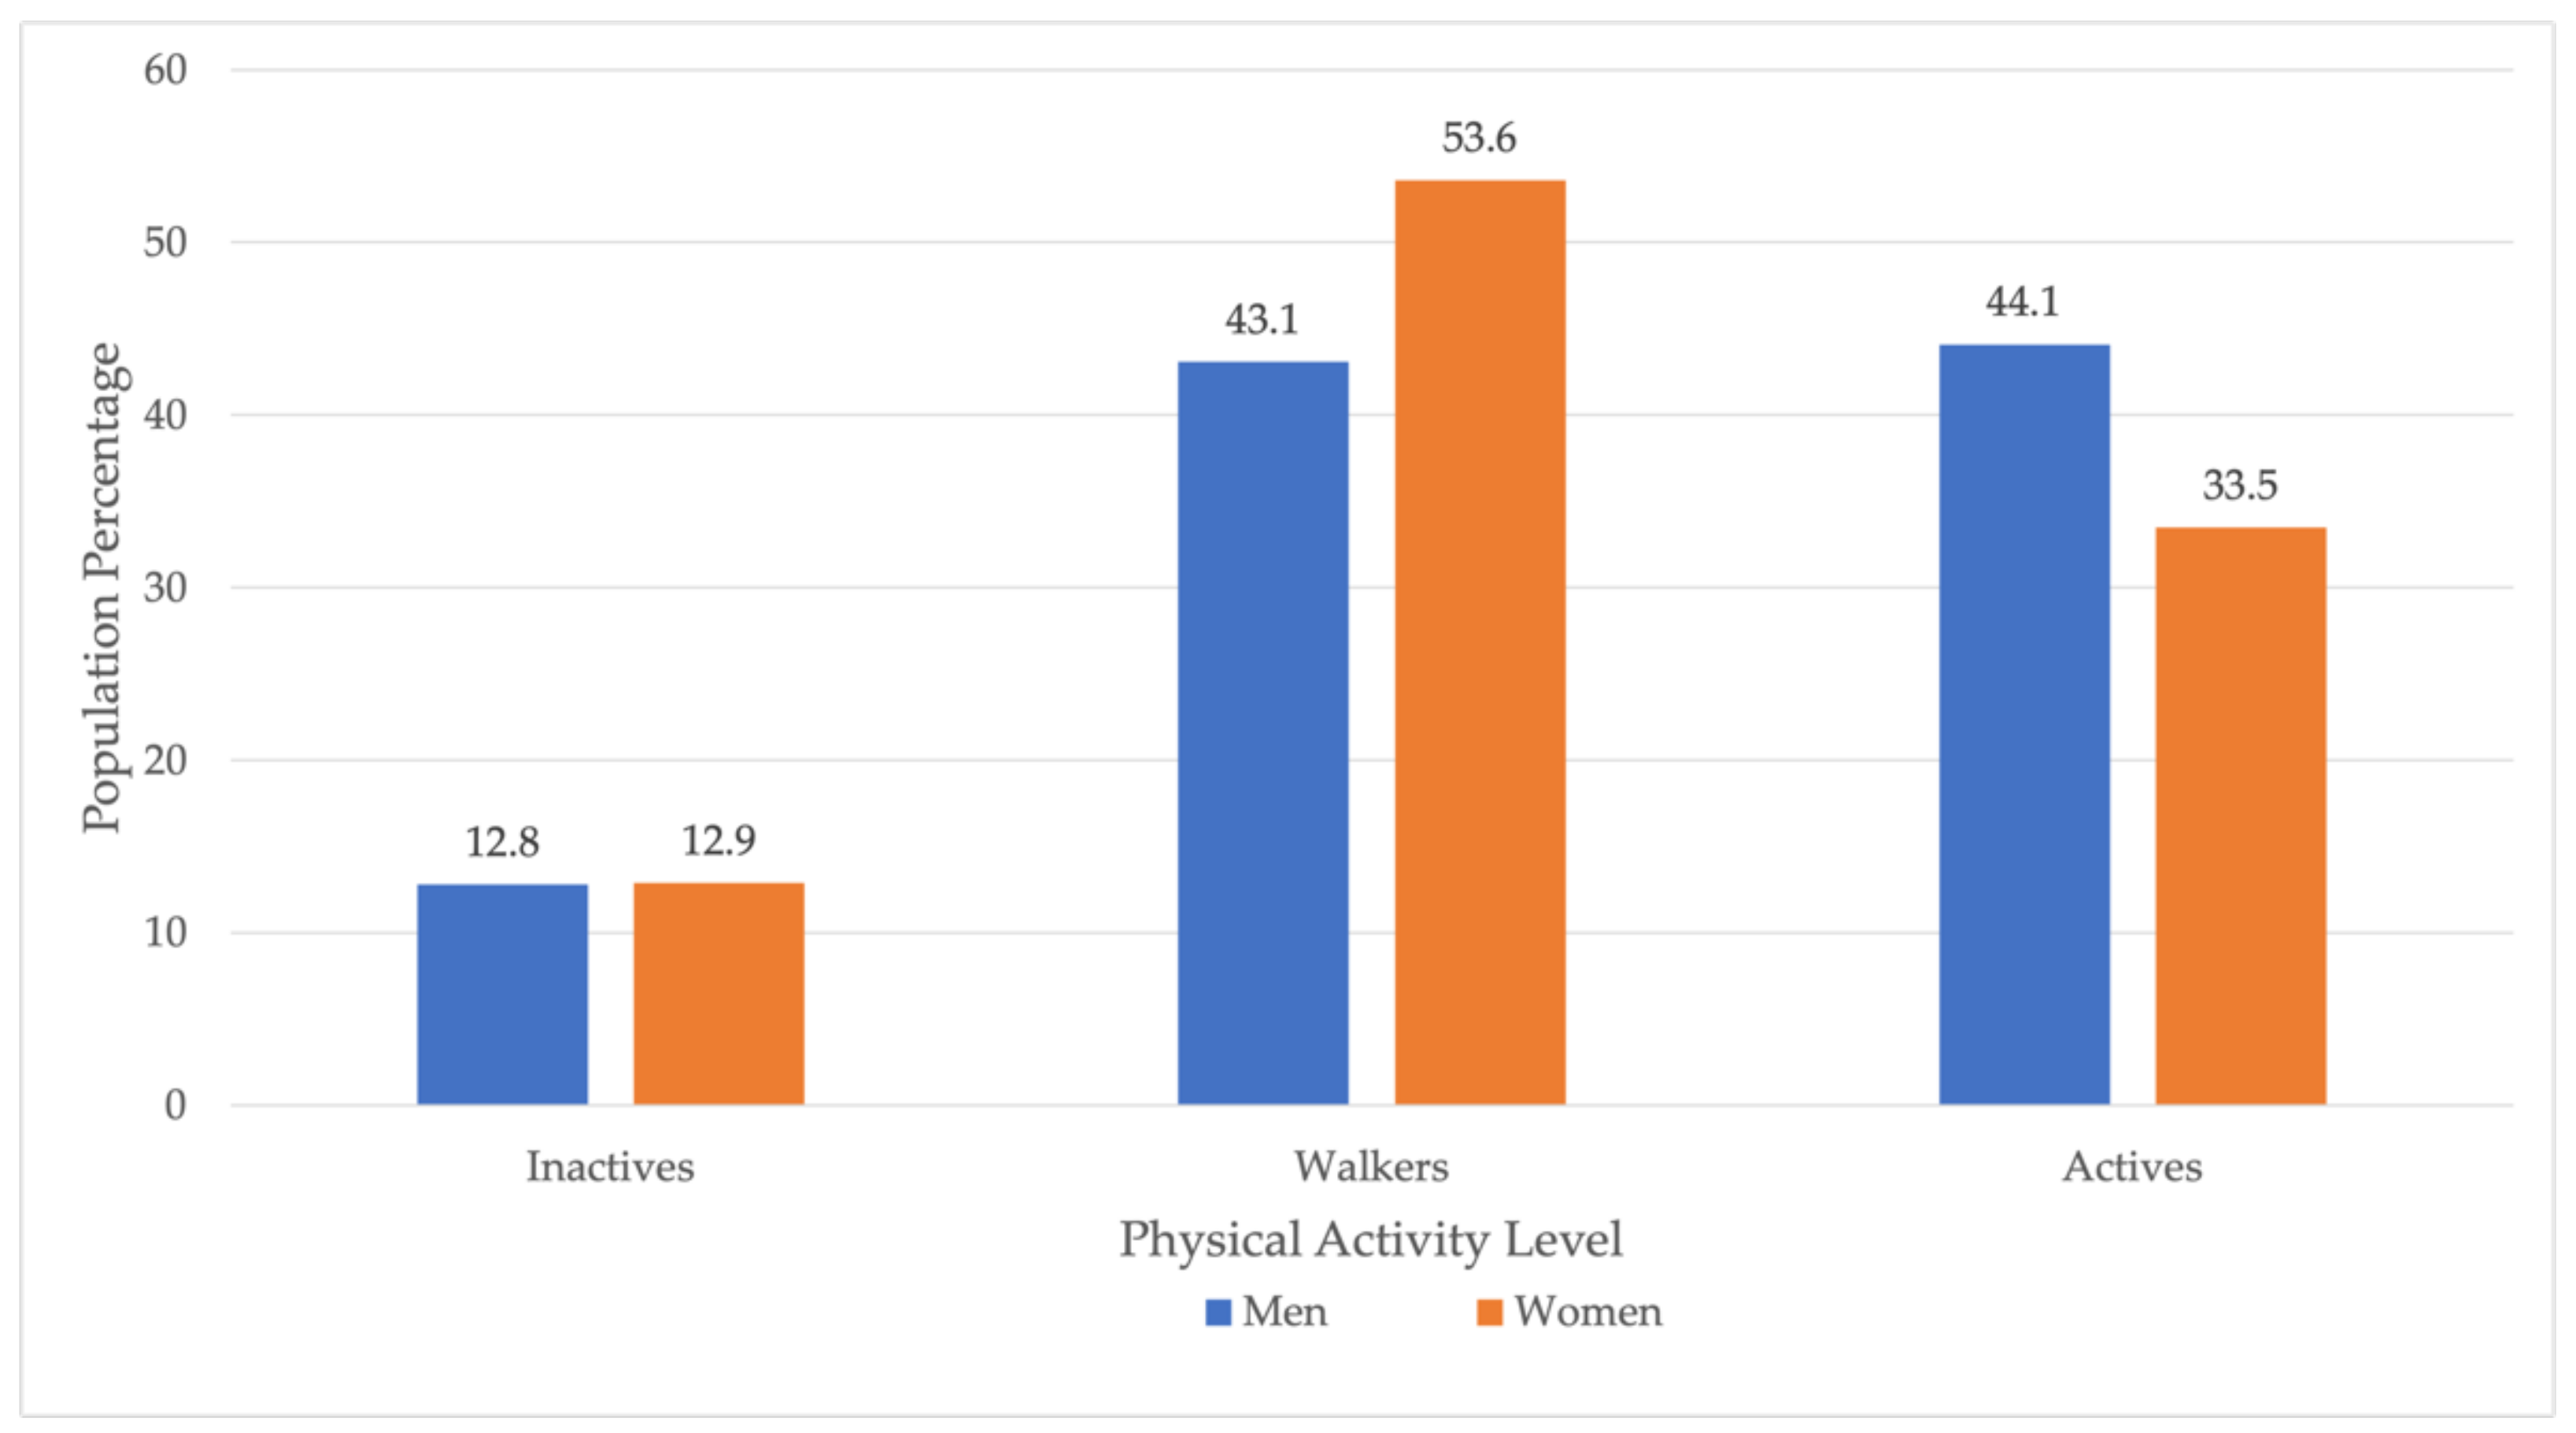
| Physical Activity Level | |||||||
| Sex | Inactives n (%) | Walkers n (%) | Actives n (%) | p-Value from the Chi-Square Test | |||
| Men | 111 a | (12.8) | 373 a | (43.1) | 382 a | (44.1) | <0.001 |
| Women | 175 a | (12.9) | 730 b | (53.6) | 456 b | (33.5) | |
| Total | 286 | (12.8) | 1103 | (49.5) | 838 | (37.6) | |
| Men | |||||||
| SPH | Inactives n (%) | Walkers n (%) | Actives n (%) | ||||
| Very good | 11 a | (9.9) | 44 a | (11.8) | 83 a | (21.7) | <0.001 |
| Good | 57 a | (51.4) | 201 a | (53.9) | 228 a | (59.7) | |
| Fair | 30 a | (27.0) | 92 a | (27.4) | 59 b | (15.4) | |
| Bad | 12 a | (10.8) | 30 a | (8.0) | 10 b | (2.6) | |
| Very bad | 1 a | (0.9) | 6 a | (1.6) | 2 a | (0.5) | |
| Women | |||||||
| SPH | Inactives n (%) | Walkers n (%) | Actives n (%) | ||||
| Very good | 11 a | (6.3) | 85 ab | (11.6) | 66 b | (14.5) | <0.001 |
| Good | 75 a | (42.9) | 393 b | (53.8) | 277 b | (60.7) | |
| Fair | 57 a | (32.6) | 195 ab | (26.7) | 97 b | (21.3) | |
| Bad | 25 a | (14.3) | 44 b | (6.0) | 16 b | (3.5) | |
| Very bad | 7 a | (4.0) | 13 a | (1.8) | 0 b | (0.0) | |
| (a) | |||||||
| PAL | GHQ-12 | PAL | Med. Diff. | Mean Diff. | p * | p ** | |
| Inactives | Med. (IQR) | 10 (5) | Walkers | 0 | 0.7 | <0.001 | 0.667 |
| Mean (SD) | 11.6 (6.3) | Actives | 1 | 2.0 | 0.003 | ||
| Walkers | Med. (IQR) | 10 (5) | Inactives | 0 | −0.7 | <0.001 | 0.667 |
| Mean (SD) | 10.9 (4.6) | Actives | 1 | 1.3 | <0.001 | ||
| Actives | Med. (IQR) | 9 (5) | Inactives | −1 | −2.0 | <0.001 | 0.003 |
| Mean (SD) | 9.6 (4.1) | Walkers | −1 | −1.3 | <0.001 | ||
| PAL | FI | PAL | Med. Diff. | Mean Diff. | p * | p ** | |
| Inactives | Med. (IQR) | 6 (1) | Walkers | 0 | 0.4 | <0.001 | 0.152 |
| Mean (SD) | 6.9 (2.4) | Actives | 0 | 0.9 | <0.001 | ||
| Walkers | Med. (IQR) | 6 (0) | Inactives | 0 | −0.4 | <0.001 | 0.152 |
| Mean (SD) | 6.5 (3.0) | Actives | 0 | 0.5 | <0.001 | ||
| Actives | Med. (IQR) | 6 (0) | Inactives | 0 | −0.9 | <0.001 | <0.001 |
| Mean (SD) | 6.0 (1.4) | Walkers | 0 | −0.5 | <0.001 | ||
| PAL | FII | PAL | Med. Diff. | Mean Diff. | p * | p ** | |
| Inactives | Med. (IQR) | 2 (4) | Walkers | 0 | 0.3 | <0.001 | 0.820 |
| Mean (SD) | 2.7 (2.9) | Actives | 1 | 0.9 | 0.011 | ||
| Walkers | Med. (IQR) | 2 (4) | Inactives | 0 | −0.3 | <0.001 | 0.820 |
| Mean (SD) | 2.4 (2.2) | Actives | −1 | 0.6 | <0.001 | ||
| Actives | Med. (IQR) | 1 (3) | Inactives | −1 | −0.3 | <0.001 | 0.011 |
| Mean (SD) | 1.8 (2.2) | Walkers | −1 | −0.6 | <0.001 | ||
| PAL | FIII | PAL | Med. Diff. | Mean Diff. | p * | p ** | |
| Inactives | Med. (IQR) | 3 (3) | Walkers | 0 | 0.0 | <0.002 | 0.886 |
| Mean (SD) | 2.9 (2.6) | Actives | 1 | 0.5 | 0.041 | ||
| Walkers | Med. (IQR) | 3 (3) | Inactives | 0 | 0.0 | <0.002 | 0.886 |
| Mean (SD) | 2.9 (2.1) | Actives | 1 | 0.5 | 0.001 | ||
| Actives | Med. (IQR) | 2 (2) | Inactives | −1 | −0.5 | <0.002 | 0.041 |
| Mean (SD) | 2.4 (2.0) | Walkers | −1 | −0.5 | 0.001 | ||
| (b) | |||||||
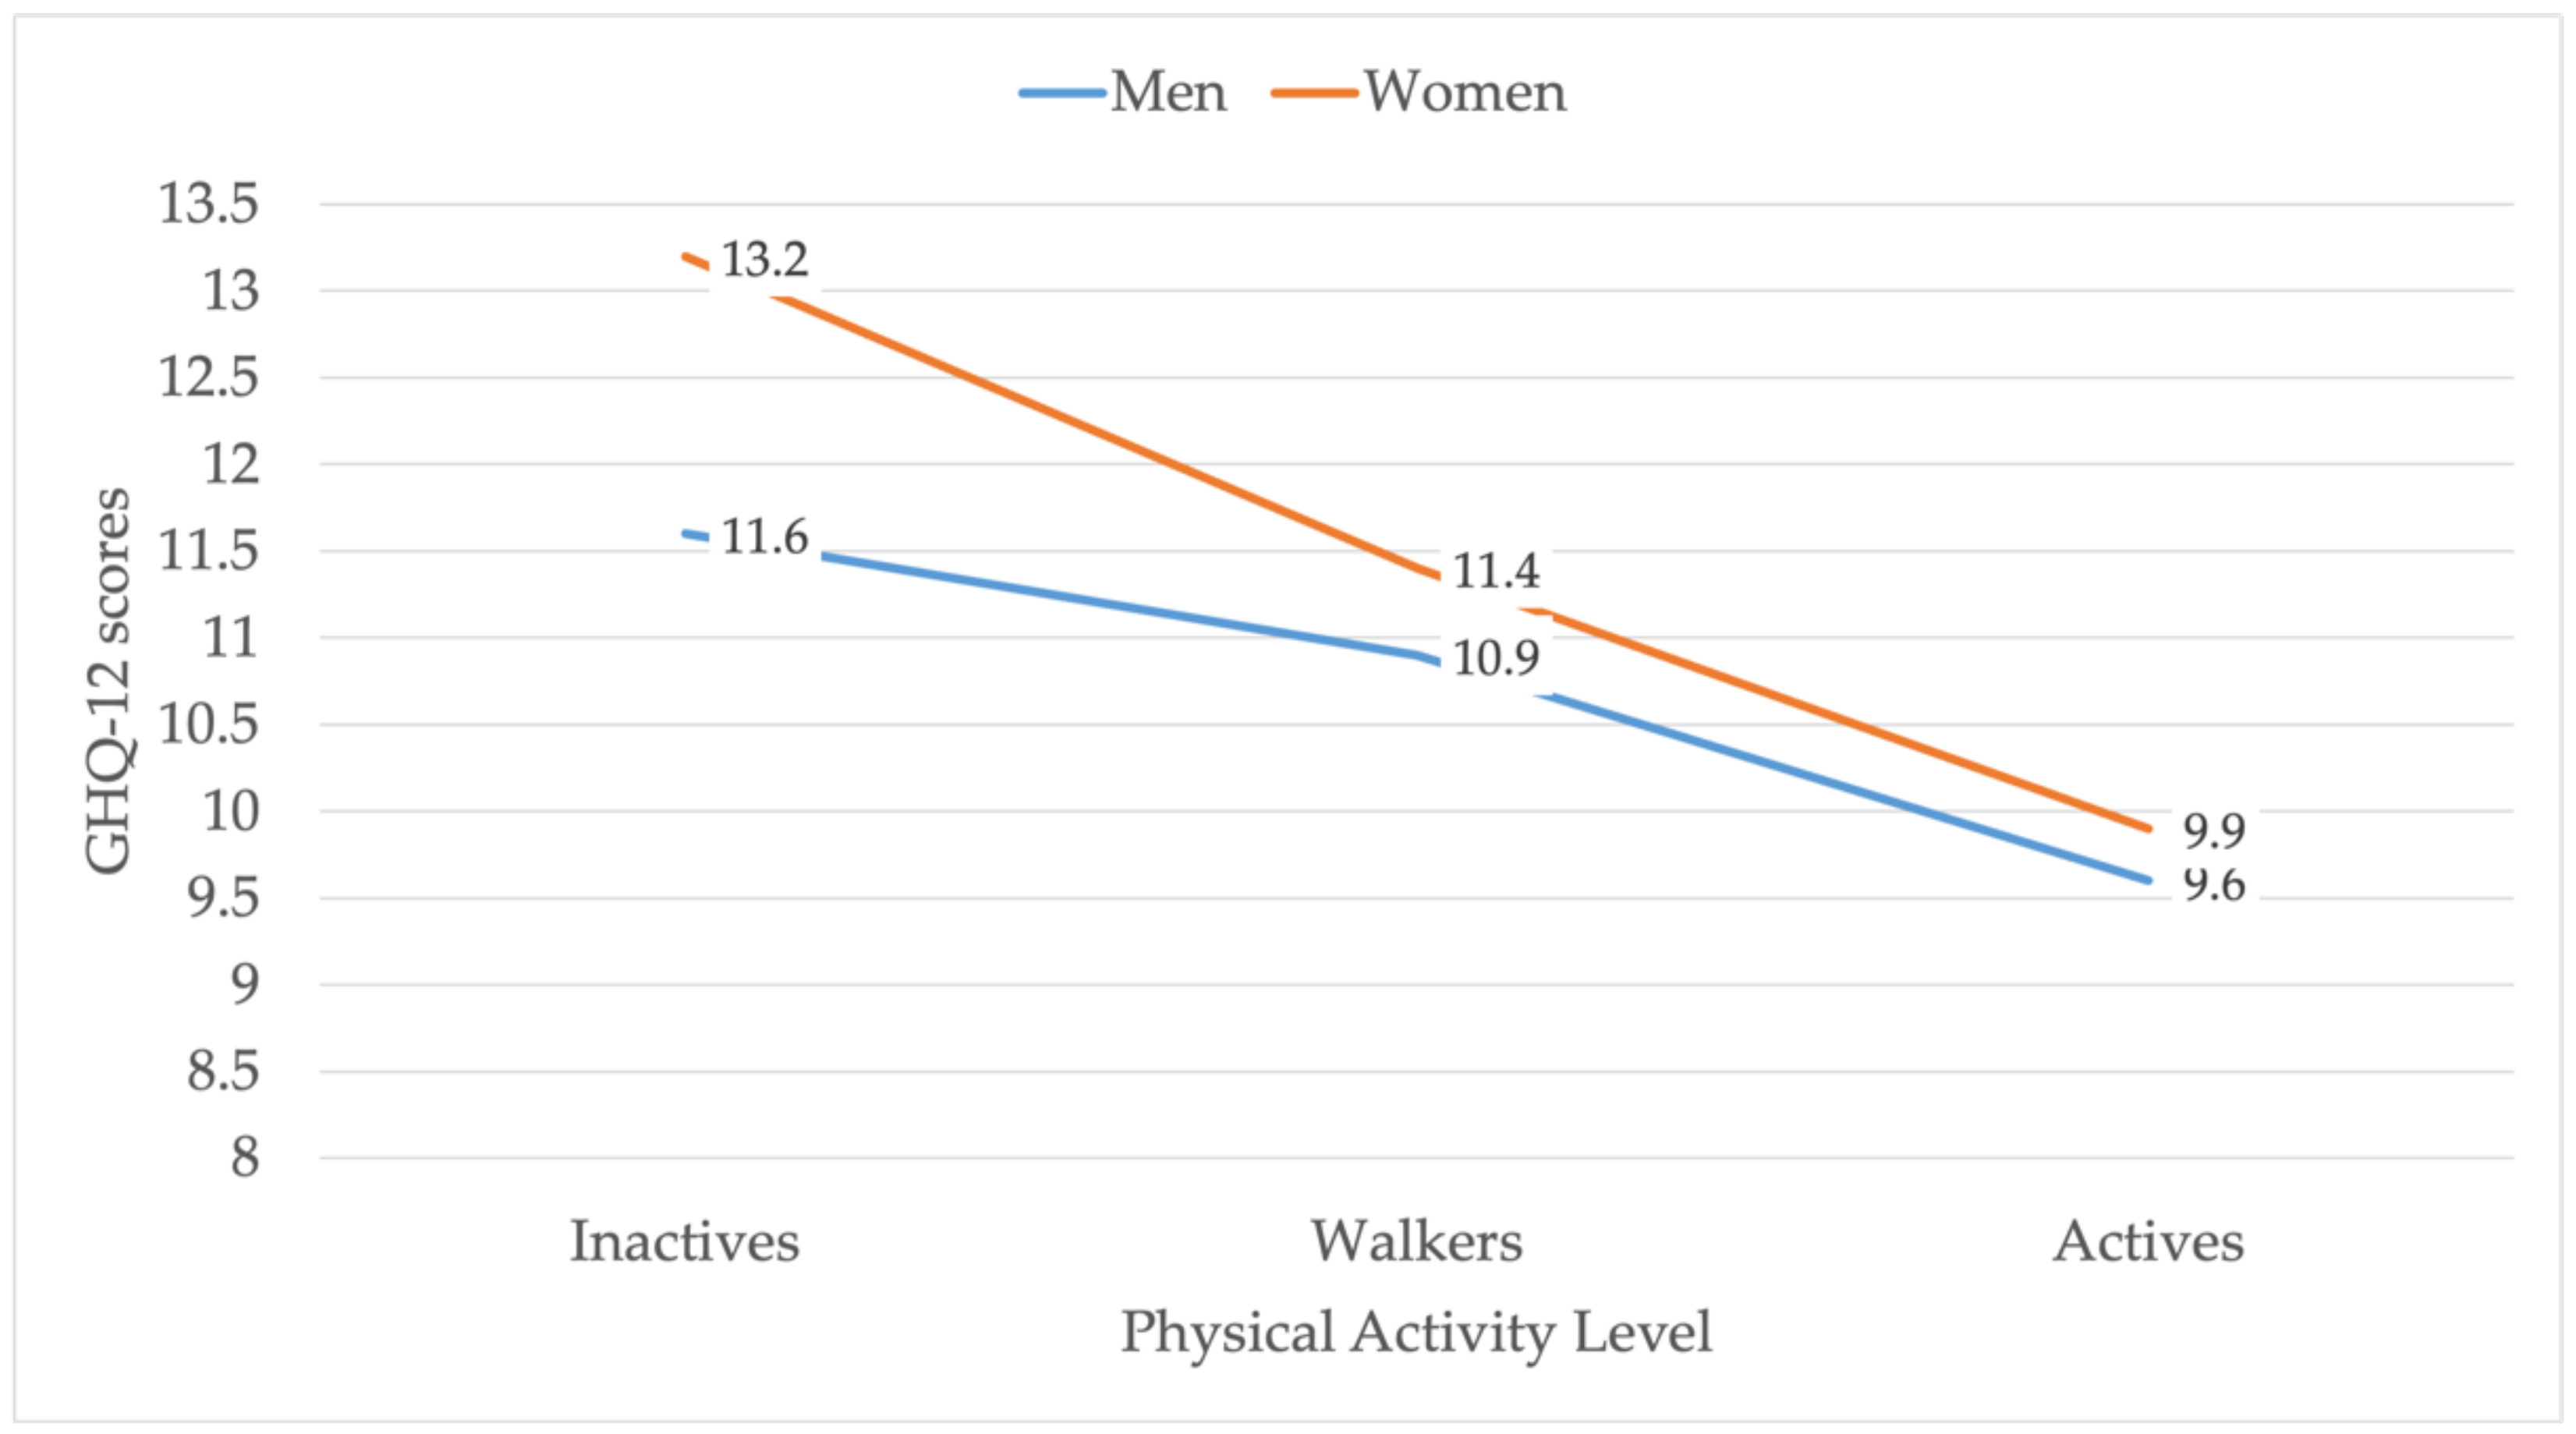
| PAL | GHQ-12 | PAL | Med. Diff. | Mean Diff. | p * | p ** | |
| Inactives | Med. (IQR) | 12 (7) | Walkers | 1 | 1.74 | <0.001 | <0.001 |
| Mean (SD) | 13.15 (5.89) | Actives | 3 | 3.24 | <0.001 | ||
| Walkers | Med. (IQR) | 11 (5) | Inactives | −1 | −1.74 | <0.001 | <0.001 |
| Mean (SD) | 11.41 (4.89) | Actives | 2 | 1.5 | <0.001 | ||
| Actives | Med. (IQR) | 9 (5) | Inactives | −3 | −3.24 | <0.001 | <0.001 |
| Mean (SD) | 9.91 (3.96) | Walkers | −2 | −1.5 | <0.001 | ||
| PAL | FI | PAL | Med. Diff. | Mean Diff. | p * | p ** | |
| Inactives | Med. (IQR) | 6 (2) | Walkers | 0 | 0.61 | <0.001 | <0.001 |
| Mean (SD) | 7.04 (2.30) | Actives | 0 | 1.06 | <0.001 | ||
| Walkers | Med. (IQR) | 6 (1) | Inactives | 0 | −0.61 | <0.001 | <0.001 |
| Mean (SD) | 6.43 (1.86) | Actives | 0 | 0.45 | <0.001 | ||
| Actives | Med. (IQR) | 6 (0) | Inactives | 0 | −1.06 | <0.001 | <0.001 |
| Mean (SD) | 5.98 (1.28) | Walkers | 0 | −0.45 | <0.001 | ||
| PAL | FII | PAI | Med. Diff. | Mean Diff. | p * | p ** | |
| Inactives | Med. (IQR) | 4 (4) | Walkers | 2 | 1.05 | <0.001 | <0.001 |
| Mean (SD) | 3.61 | Actives | 3 | 1.66 | <0.001 | ||
| Walkers | Med. (IQR) | 2 (3) | Inactives | −2 | −1.05 | <0.001 | <0.001 |
| Mean (SD) | 2.56 (2.38) | Actives | 1 | 0.61 | <0.001 | ||
| Actives | Med. (IQR) | 1 (3) | Inactives | −3 | −1.66 | <0.001 | <0.001 |
| Mean (SD) | 1.95 (2.10) | Walkers | −1 | −0.61 | <0.001 | ||
| PAL | FIII | PAI | Med. Diff. | Mean Diff. | p * | p ** | |
| Inactives | Med. (IQR) | 3 (2) | Walkers | 0 | 0.30 | <0.001 | <0.001 |
| Mean (SD) | 3.61 (2.1) | Actives | 0 | 0.93 | <0.001 | ||
| Walkers | Med. (IQR) | 3 (3) | Inactives | 0 | −0.30 | <0.001 | <0.001 |
| Mean (SD) | 3.31 (2.08) | Actives | 0 | 0.64 | <0.001 | ||
| Actives | Med. (IQR) | 3 (3) | Inactives | 0 | −0.93 | <0.001 | <0.001 |
| Mean (SD) | 2.68 (2.09) | Walkers | 0 | −0.64 | <0.001 | ||
Publisher’s Note: MDPI stays neutral with regard to jurisdictional claims in published maps and institutional affiliations. |
© 2022 by the authors. Licensee MDPI, Basel, Switzerland. This article is an open access article distributed under the terms and conditions of the Creative Commons Attribution (CC BY) license (https://creativecommons.org/licenses/by/4.0/).
Share and Cite
Denche-Zamorano, Á.; Muñoz-Bermejo, L.; Carlos-Vivas, J.; Mendoza-Muñoz, M.; Franco-García, J.M.; Rojo-Ramos, J.; Vega-Muñoz, A.; Contreras-Barraza, N.; Barrios-Fernandez, S. A Cross-Sectional Study about the Associations between Physical Activity Level, Self-Perceived Health Perception and Mental Health in Informal Caregivers of Elderly or People with Chronic Conditions in Spain. Int. J. Environ. Res. Public Health 2022, 19, 5320. https://doi.org/10.3390/ijerph19095320
Denche-Zamorano Á, Muñoz-Bermejo L, Carlos-Vivas J, Mendoza-Muñoz M, Franco-García JM, Rojo-Ramos J, Vega-Muñoz A, Contreras-Barraza N, Barrios-Fernandez S. A Cross-Sectional Study about the Associations between Physical Activity Level, Self-Perceived Health Perception and Mental Health in Informal Caregivers of Elderly or People with Chronic Conditions in Spain. International Journal of Environmental Research and Public Health. 2022; 19(9):5320. https://doi.org/10.3390/ijerph19095320
Chicago/Turabian StyleDenche-Zamorano, Ángel, Laura Muñoz-Bermejo, Jorge Carlos-Vivas, María Mendoza-Muñoz, Juan Manuel Franco-García, Jorge Rojo-Ramos, Alejandro Vega-Muñoz, Nicolás Contreras-Barraza, and Sabina Barrios-Fernandez. 2022. "A Cross-Sectional Study about the Associations between Physical Activity Level, Self-Perceived Health Perception and Mental Health in Informal Caregivers of Elderly or People with Chronic Conditions in Spain" International Journal of Environmental Research and Public Health 19, no. 9: 5320. https://doi.org/10.3390/ijerph19095320
APA StyleDenche-Zamorano, Á., Muñoz-Bermejo, L., Carlos-Vivas, J., Mendoza-Muñoz, M., Franco-García, J. M., Rojo-Ramos, J., Vega-Muñoz, A., Contreras-Barraza, N., & Barrios-Fernandez, S. (2022). A Cross-Sectional Study about the Associations between Physical Activity Level, Self-Perceived Health Perception and Mental Health in Informal Caregivers of Elderly or People with Chronic Conditions in Spain. International Journal of Environmental Research and Public Health, 19(9), 5320. https://doi.org/10.3390/ijerph19095320