
Analysis of Physical Demands in Four Tug of War World Indoor Championships (2010–2016)

 , ,
, ,  ,
,  ,
,
Abstract
:1. Introduction
2. Material and Methods
2.1. Participants
2.2. Procedure
2.3. Instruments
2.4. Statistical Analysis
3. Results
4. Discussion
5. Limitations
6. Strengths
7. Practical Applications
- -
- The knowledge about the times of the matches helps us to design adequate training programs;
- -
- Related to the total time of competition, these results could help strength and conditioning coaches to improve their sport planning and training;
- -
- Finally, this article also helps to individualize training between men and women, considering the differences between the two genders.
8. Conclusions
Author Contributions
Funding
Institutional Review Board Statement
Informed Consent Statement
Data Availability Statement
Conflicts of Interest
References
- Smith, J.; Krabak, B. Tug of war: Introduction to the sport and an epidemiological injury study among elite pullers. Scand. J. Med. Sci. Sports 2002, 12, 117–124. [Google Scholar] [CrossRef] [PubMed]
- Chotai, P.N.; Amr, A. Abdelgawad Tug-of-War Injuries: A Case Report and Review of the Literature. Case Rep. Orthop. 2014, 2014, 519819. [Google Scholar] [PubMed] [Green Version]
- Warrington, G.; Ryan, C.; Murray, F.; Duffy, P.; Kirwan, J.P. Physiological and metabolic characteristics of elite tug of war athletes. Br. J. Sports Med. 2001, 35, 396–401. [Google Scholar] [CrossRef] [PubMed] [Green Version]
- Twif. Tug of War International Federation Rules Manual. 2021. Available online: https://tugofwar-twif.org/2016/08/05/rules/ (accessed on 21 March 2021).
- Tang, W.-T.; Liao, W.-C.; Lee, H.-M. Contribution of upper limb muscles to two different gripping styles in elite indoor tug of war athletes. Sports Biomech. 2017, 17, 322–335. [Google Scholar] [CrossRef] [PubMed]
- Castañeda-Babarro, A.; Gutiérrez Santamaría, B.; Coca, A.; Calleja-González, J.; Cayero, R. Assessment of Tug of War pullers’ competition intensity and physiological response at the 2019 European Championship. Retos 2022, 44, 357–363. [Google Scholar] [CrossRef]
- Tanaka, K.; Ushizu, A.; Minamitani NFukushima, M.; Yamamoto, H. Biomechanical Analysis on dynamic pulling skill for elite indoor tug of war athletes. In Proceedings of the 23th International Symposium on Biomechanics in Sports, Beijing, China, 22–27 August 2005; pp. 330–333. [Google Scholar]
- Astrand, P.O.; Rodahl, K. Fisiología del Trabajo Físico: Bases Fisiológicas del Ejercicio, 2nd ed.; Panamericana: Buenos Aires, Argentina, 1986. [Google Scholar]
- Plowman, S.A.; Smith, D.L. Exercise Physiology for Health, Fitness, and Performance, 3rd ed.; Wolters Kluwer, Lippincott Williams & Wilkins: Philadelphia, PA, USA, 2011. [Google Scholar]
- Kraemer, W.J.; Fleck, S.J.; Deschenes, M.R. Exercise Physiology: Integrating Theory and Application, 1st ed.; Wolters Kluwer, Lippincott Williams & Wilkins: Philadelphia, PA, USA, 2012. [Google Scholar]
- Cayero, R.; Rocandio, V.; Zubillaga, A.; Refoyo, I.; Calleja-González, J.; Castañeda-Babarro, A.; Martínez de Aldama, I.M. Analysis of Tug of War Competition: A Narrative Complete review. Int. J. Environ. Res. Public Health 2022, 19, 3. [Google Scholar] [CrossRef] [PubMed]
- Hopkins, W.G.; Marshall, S.W.; Batterham, A.M.; Hanin, J. Progressive statistics for studies in sports medicine and exercise science. Med. Sci. Sports Exerc. 2009, 41, 3–13. [Google Scholar] [CrossRef] [PubMed] [Green Version]
- Cohen, J. Statistical Power Analysis for the Behavioral Sciences, 2nd ed.; Lawrence Erlbaum: Hillsday, NJ, USA, 1988. [Google Scholar]
- Yamamoto, H.; Makitani, S.; Yasuda, N.; Watanabe, Y. Influences of some sports shoes on the strength of pulling exercise in Indoor Tug-of-War. In Proceedings of the 15th International Symposium on Biomechanics in Sports, Denton, TX, USA, 21–25 June 1997; pp. 403–409. [Google Scholar]
- Jones, C.M.; Griffiths, P.C.; Mellalieu, S.D. Training Load and Fatigue Marker Associations with Injury and Illness: A Systematic Review of Longitudinal Studies. Sports Med. 2017, 47, 943–974. [Google Scholar] [CrossRef] [PubMed] [Green Version]
- McLaren, S.J.; Macpherson, T.W.; Coutts, A.J.; Hurst, C.; Spears, I.R.; Weston, M. The Relationships between Internal and External Measures of Training Load and Intensity in Team Sports: A Meta-Analysis. Sports Med. 2018, 48, 641–658. [Google Scholar] [CrossRef] [PubMed] [Green Version]

| Year | 2010 | 2012 | 2014 | 2016 | 4 Champs. |
|---|---|---|---|---|---|
| Weight | No Teams | No Teams | No Teams | No Teams | No Teams |
| 500 | 9 | 11 | 13 | 12 | 45 |
| 540 | 11 | 14 | 15 | 22 | 69 |
| 560 | 27 | 28 | 19 | 21 | 95 |
| 600 | 32 | 25 | 29 | 35 | 120 |
| 640 | 24 | 20 | 21 | 30 | 94 |
| 680 | 16 | 15 | 16 | 14 | 60 |
| no teams | 119 | 113 | 113 | 134 | 479 |
| no of pulls | 992 | 864 | 864 | 1004 | 3724 |
| Descriptive Statistical | |||||
|---|---|---|---|---|---|
| N | Minimum | Maximum | Medium | Standard Deviation | |
| T1 | 1862 | 6 | 309 | 76.90 | 51.78 |
| T2 | 1862 | 7 | 362 | 60.96 | 39.29 |
| N valid | 1862 | ||||
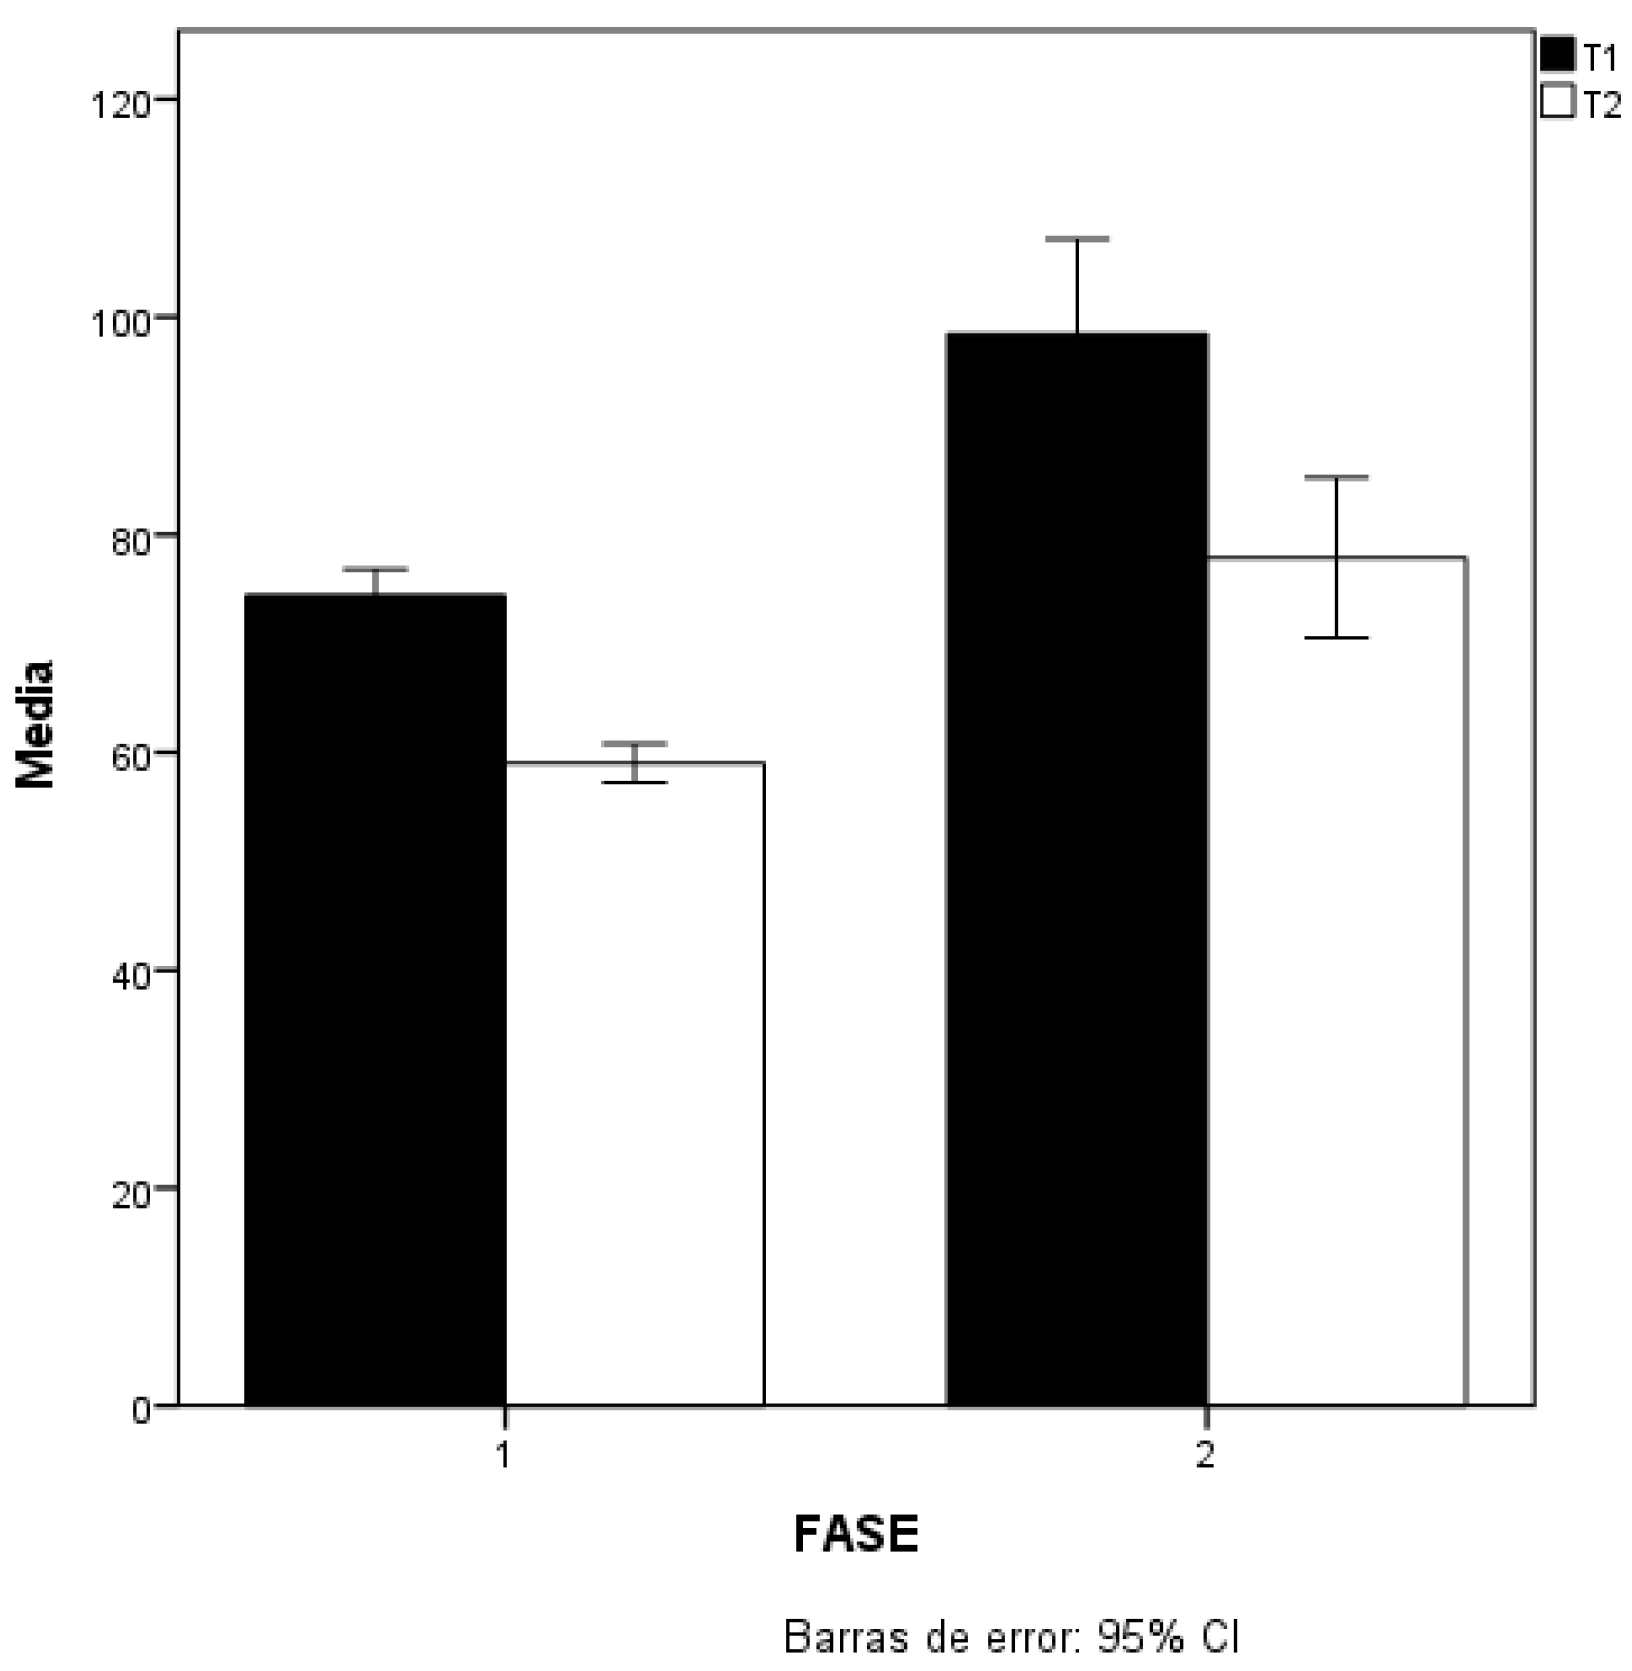
| Phase | N | Medium | Standard Deviation | t | Effect Size | |
|---|---|---|---|---|---|---|
| T1 | 1 | 1671 | 74.43 | 50.02 | ||
| 2 | 191 | 98.46 | 61.10 | −5.238 | 0.469 (small) | |
| T2 | 1 | 1671 | 59.02 | 37.17 | ||
| 2 | 191 | 77.90 | 51.51 | −4.922 | 0.486 (small) |
| Gender | Weight | Phase | N | Average | Standard Deviation | t | p | Effect Size | ||
|---|---|---|---|---|---|---|---|---|---|---|
| 500 K | T1 | 1 | 110 | 82.21 | 43.68 | −1.775 | NS | |||
| 2 | 32 | 103.47 | 63.52 | |||||||
| W | T2 | 1 | 110 | 62.09 | 30.26 | −2.065 | p < 0.05 | 0.5 | Moderate | |
| O | 2 | 32 | 78.84 | 42.88 | ||||||
| M | 540 K | T1 | 1 | 224 | 61.23 | 41.67 | −2.756 | p < 0.01 | 0.749 | Moderate |
| E | 2 | 35 | 96.66 | 74.24 | ||||||
| N | T2 | 1 | 224 | 49.50 | 28.26 | −2.159 | p < 0.05 | 0.646 | Moderate | |
| 2 | 35 | 71.49 | 59.18 | |||||||
| 560 K | T1 | 1 | 337 | 95.99 | 57.82 | −2.498 | p < 0.05 | 0.462 | Small | |
| 2 | 32 | 122.72 | 57.94 | |||||||
| T2 | 1 | 337 | 75.93 | 49.17 | −2.497 | p < 0.05 | 0.462 | Small | ||
| 2 | 32 | 98.94 | 56.28 | |||||||
| 600 K | T1 | 1 | 478 | 75.96 | 51.46 | −2.718 | p < 0.01 | 0.496 | Small | |
| 2 | 32 | 101.97 | 65.20 | |||||||
| M | T2 | 1 | 478 | 60.47 | 36.25 | −2.738 | p < 0.05 | 0.798 | Moderate | |
| E | 2 | 32 | 90.69 | 61.72 | ||||||
| N | 640 K | T1 | 1 | 338 | 65.42 | 43.30 | −2.522 | p < 0.05 | 0.466 | Small |
| 2 | 32 | 85.78 | 47.36 | |||||||
| T2 | 1 | 338 | 51.21 | 28.71 | −1.765 | NS | ||||
| 2 | 32 | 60.81 | 36.10 | |||||||
| 680 K | T1 | 1 | 184 | 58.91 | 39.84 | −2.288 | p < 0.05 | 0.464 | Small | |
| 2 | 28 | 77.71 | 44.73 | |||||||
| T2 | 1 | 184 | 48.38 | 28.89 | −2.374 | p < 0.05 | 0.577 | Moderate | ||
| 2 | 28 | 65.71 | 36.97 | |||||||
| GENDER | N | Average | Standard Deviation | 95% Confidence Interval | |||
|---|---|---|---|---|---|---|---|
| Lower Limit | Upper Limit | ||||||
| T1 | 2010 | 59 | 97.83 | 52.64 | 84.11 | 111.55 | |
| 2012 | 82 | 75.4 | 40.96 | 66.4 | 84.4 | ||
| W | 2014 | 103 | 75.5 | 43.64 | 66.97 | 84.02 | |
| O | 2016 | 157 | 62.04 | 53.87 | 53.55 | 70.54 | |
| M | Total | 401 | 73.5 | 50.00 | 68.59 | 78.41 | |
| E | T2 | 2010 | 59 | 77.39 | 34.96 | 68.28 | 86.5 |
| N | 2012 | 82 | 63.15 | 35.13 | 55.43 | 70.87 | |
| 2014 | 103 | 57.87 | 35.19 | 51 | 64.75 | ||
| 2016 | 157 | 46.1 | 30.86 | 41.24 | 50.97 | ||
| Total | 401 | 57.21 | 35.07 | 53.77 | 60.66 | ||
| T1 | 2010 | 437 | 78.24 | 57.31 | 72.86 | 83.63 | |
| 2012 | 350 | 81.07 | 51.45 | 75.66 | 86.48 | ||
| 2014 | 329 | 76.75 | 50.4 | 71.28 | 82.22 | ||
| M | 2016 | 345 | 75.08 | 47.80 | 70.02 | 80.14 | |
| E | Total | 1461 | 77.84 | 52.24 | 75.16 | 80.52 | |
| N | T2 | 2010 | 437 | 64.08 | 42.02 | 60.12 | 68.03 |
| 2012 | 350 | 64.91 | 40.16 | 60.69 | 69.14 | ||
| 2014 | 329 | 60,03 | 40.06 | 55.68 | 64.37 | ||
| 2016 | 345 | 58.22 | 38.26 | 54.17 | 62.27 | ||
| Total | 1461 | 61.98 | 40.32 | 59.91 | 64.05 | ||
| 2010 | 2012 | 2014 | 2016 | ||||||
|---|---|---|---|---|---|---|---|---|---|
| Weight | Comp. | No Team | Time | No Team | Time | No Team | Time | No Team | Time |
| 500 K | Open | 5 | 1387 | 7 | 1782 | 7 | 1321 | 5 | 1868 ** |
| WC | 4 | 959 | 4 | 788 | 6 | 1196 | 7 | 1213 | |
| 540 K | Club | 7 | 1876 | 7 | 1370 | 9 | 1587 | 11 | 1996 ** |
| WC | 4 | 1232 | 7 | 978 | 6 | 1225 | 11 | 1392 | |
| 560 K | Open | 17 | 2593 | 20 | 2669 ** | 12 | 1963 | 14 | 1688 |
| WC | 10 | 2250 | 8 | 1733 | 7 | 1641 | 7 | 1659 | |
| 600 K | Open | 22 | 2155 ** | 18 | 1776 | 19 | 1941 | 25 | 1205 |
| WC | 10 | 2114 | 7 | 1547 | 10 | 1872 | 10 | 1476 | |
| 640 K | Open | 16 | 1418 | 14 | 1362 | 14 | 998 | 21 | 2035 ** |
| WC | 8 | 1689 | 6 | 882 | 7 | 952 | 9 | 1152 | |
| 680 K | Open | 9 | 1295 | 10 | 1385 | 9 | 1017 | 12 | 1062 |
| WC | 7 | 1741 ** | 5 | 1060 | 7 | 1125 | 8 | 1155 | |
Publisher’s Note: MDPI stays neutral with regard to jurisdictional claims in published maps and institutional affiliations. |
© 2022 by the authors. Licensee MDPI, Basel, Switzerland. This article is an open access article distributed under the terms and conditions of the Creative Commons Attribution (CC BY) license (https://creativecommons.org/licenses/by/4.0/).
Share and Cite
Cayero, R.; Zubillaga, A.; Rocandio, V.; Castañeda-Babarro, A.; Refoyo, I.; Calleja-González, J.; Martínez de Aldama, I. Analysis of Physical Demands in Four Tug of War World Indoor Championships (2010–2016). Int. J. Environ. Res. Public Health 2022, 19, 4871. https://doi.org/10.3390/ijerph19084871
Cayero R, Zubillaga A, Rocandio V, Castañeda-Babarro A, Refoyo I, Calleja-González J, Martínez de Aldama I. Analysis of Physical Demands in Four Tug of War World Indoor Championships (2010–2016). International Journal of Environmental Research and Public Health. 2022; 19(8):4871. https://doi.org/10.3390/ijerph19084871
Chicago/Turabian StyleCayero, Ruth, Asier Zubillaga, Valentín Rocandio, Arkaitz Castañeda-Babarro, Ignacio Refoyo, Julio Calleja-González, and Inmaculada Martínez de Aldama. 2022. "Analysis of Physical Demands in Four Tug of War World Indoor Championships (2010–2016)" International Journal of Environmental Research and Public Health 19, no. 8: 4871. https://doi.org/10.3390/ijerph19084871
APA StyleCayero, R., Zubillaga, A., Rocandio, V., Castañeda-Babarro, A., Refoyo, I., Calleja-González, J., & Martínez de Aldama, I. (2022). Analysis of Physical Demands in Four Tug of War World Indoor Championships (2010–2016). International Journal of Environmental Research and Public Health, 19(8), 4871. https://doi.org/10.3390/ijerph19084871