
Accuracy of Tracking Devices’ Ability to Assess Exercise Energy Expenditure in Professional Female Soccer Players: Implications for Quantifying Energy Availability

 ,
,
Abstract
:1. Introduction
2. Materials and Methods
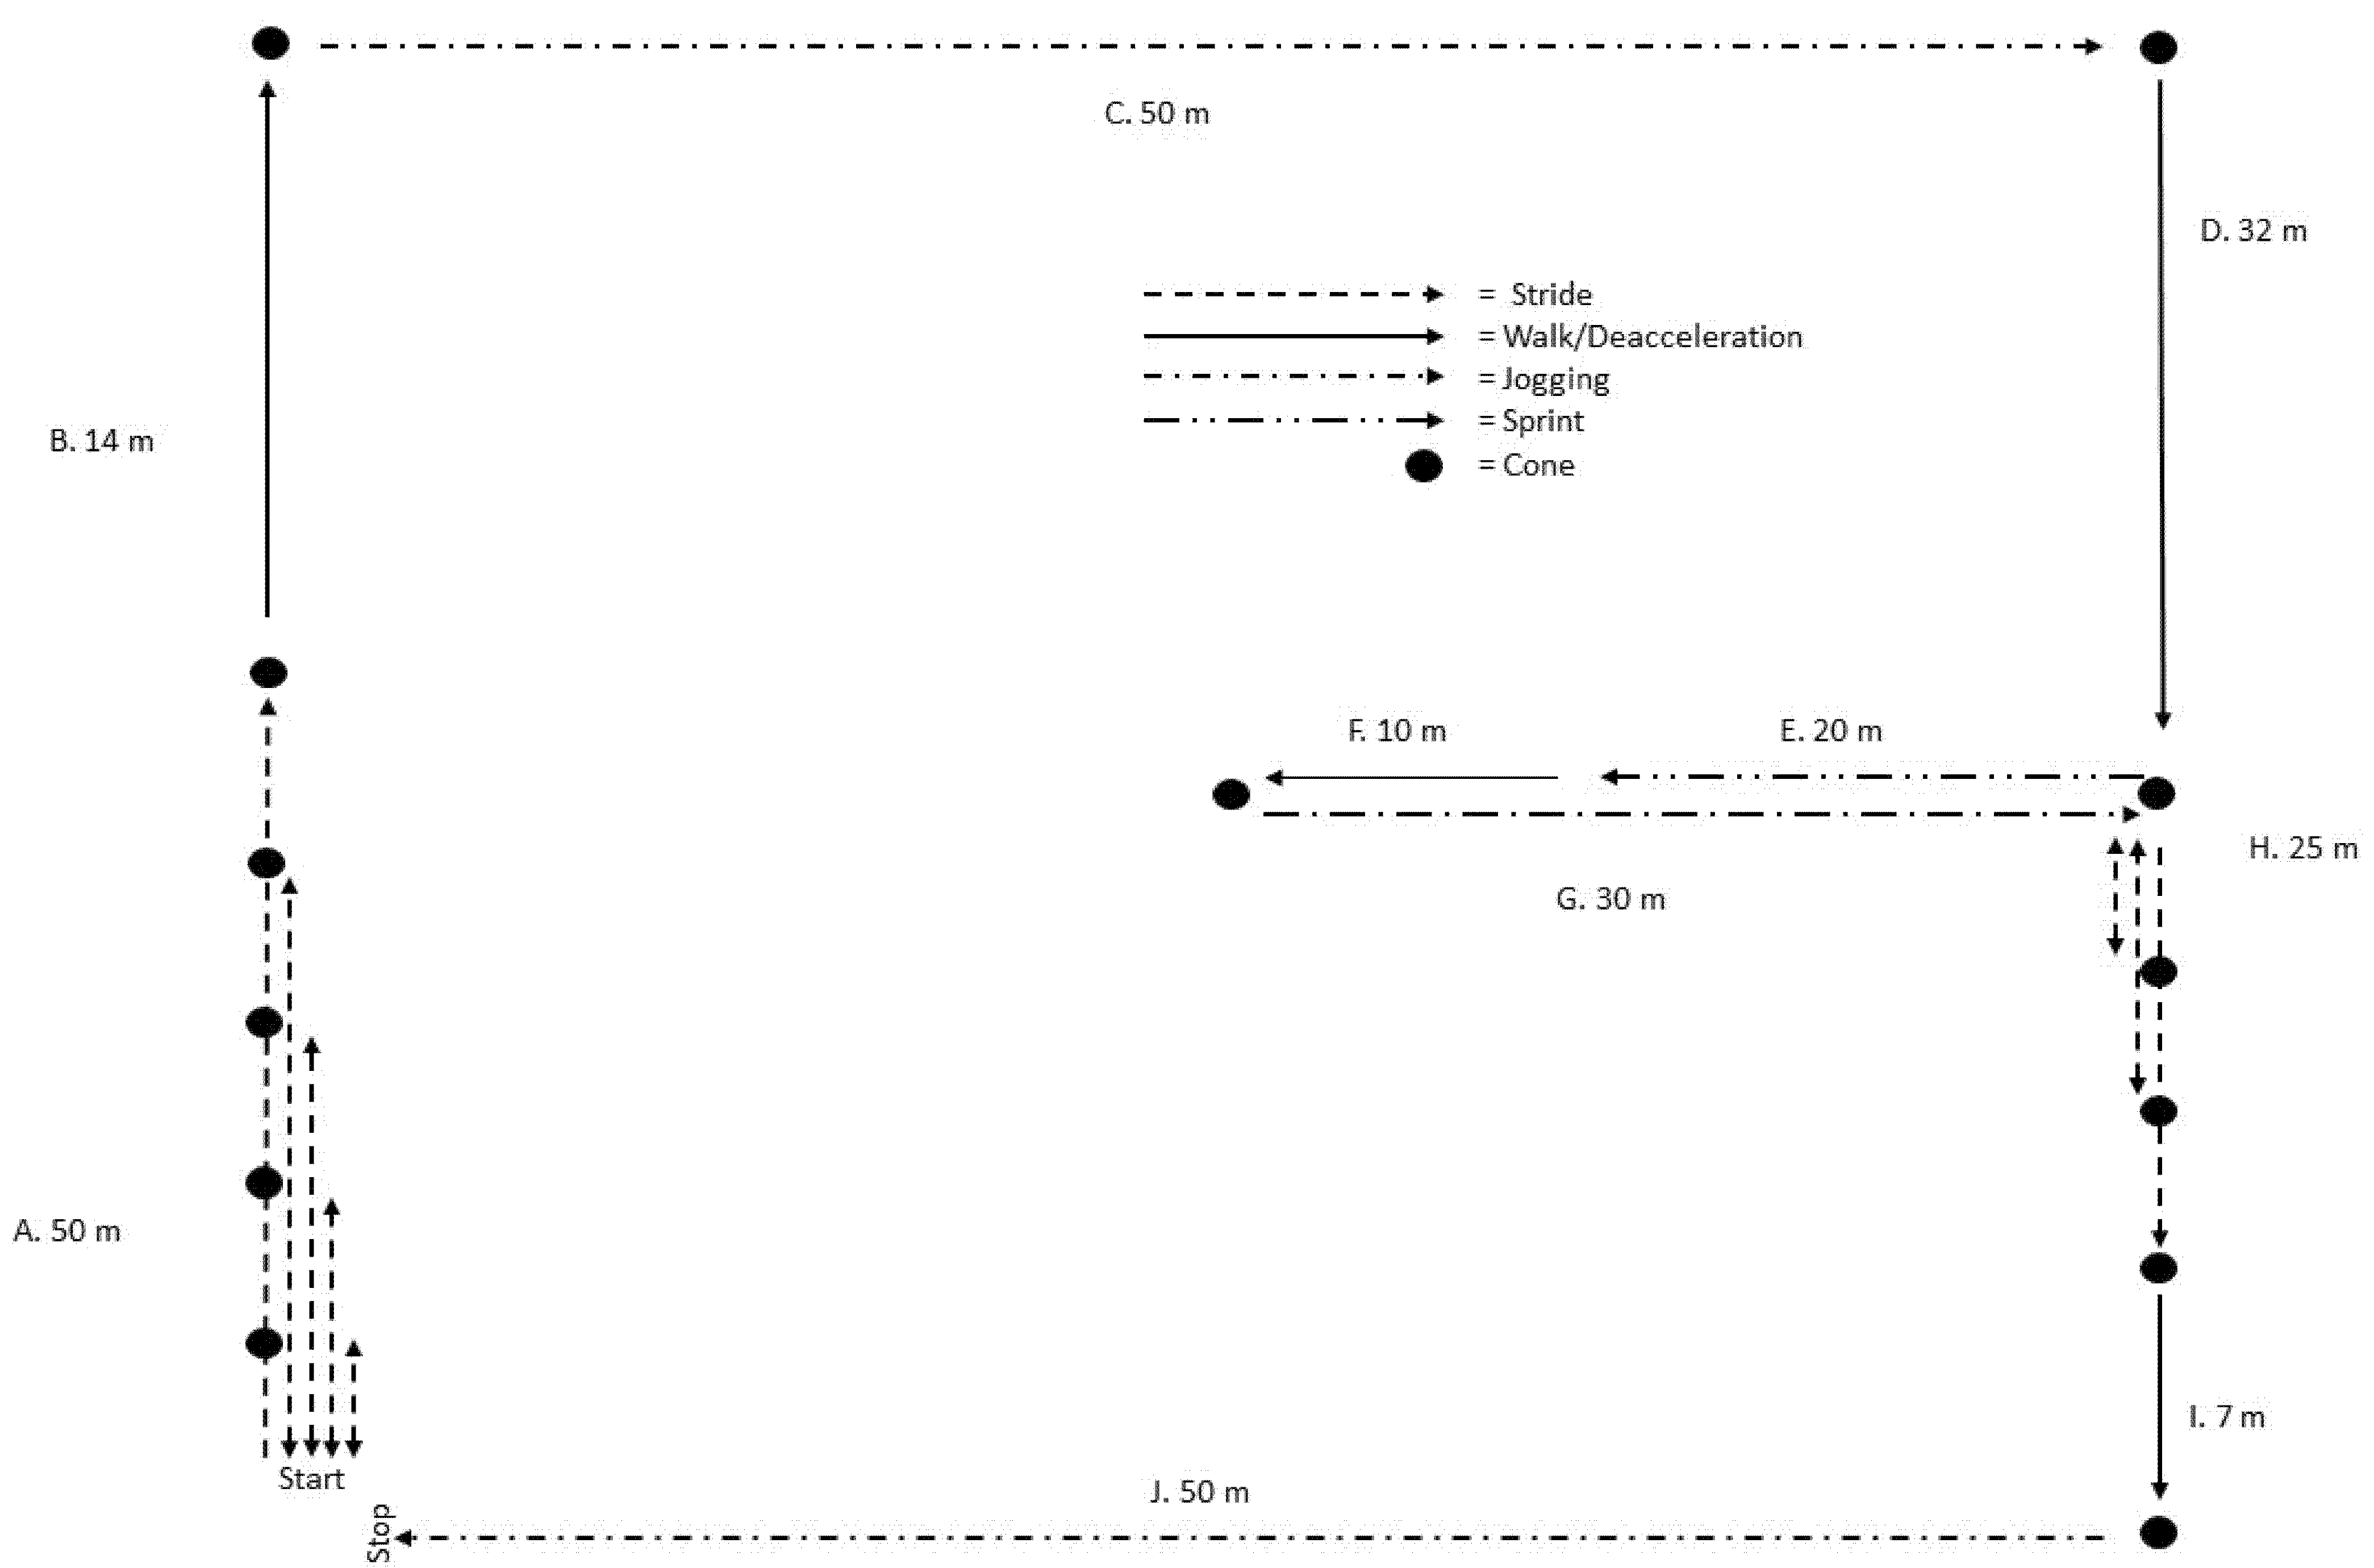
2.1. Study Design
2.2. Participants
2.3. Tracking Measures
2.4. Indirect Calorimetry
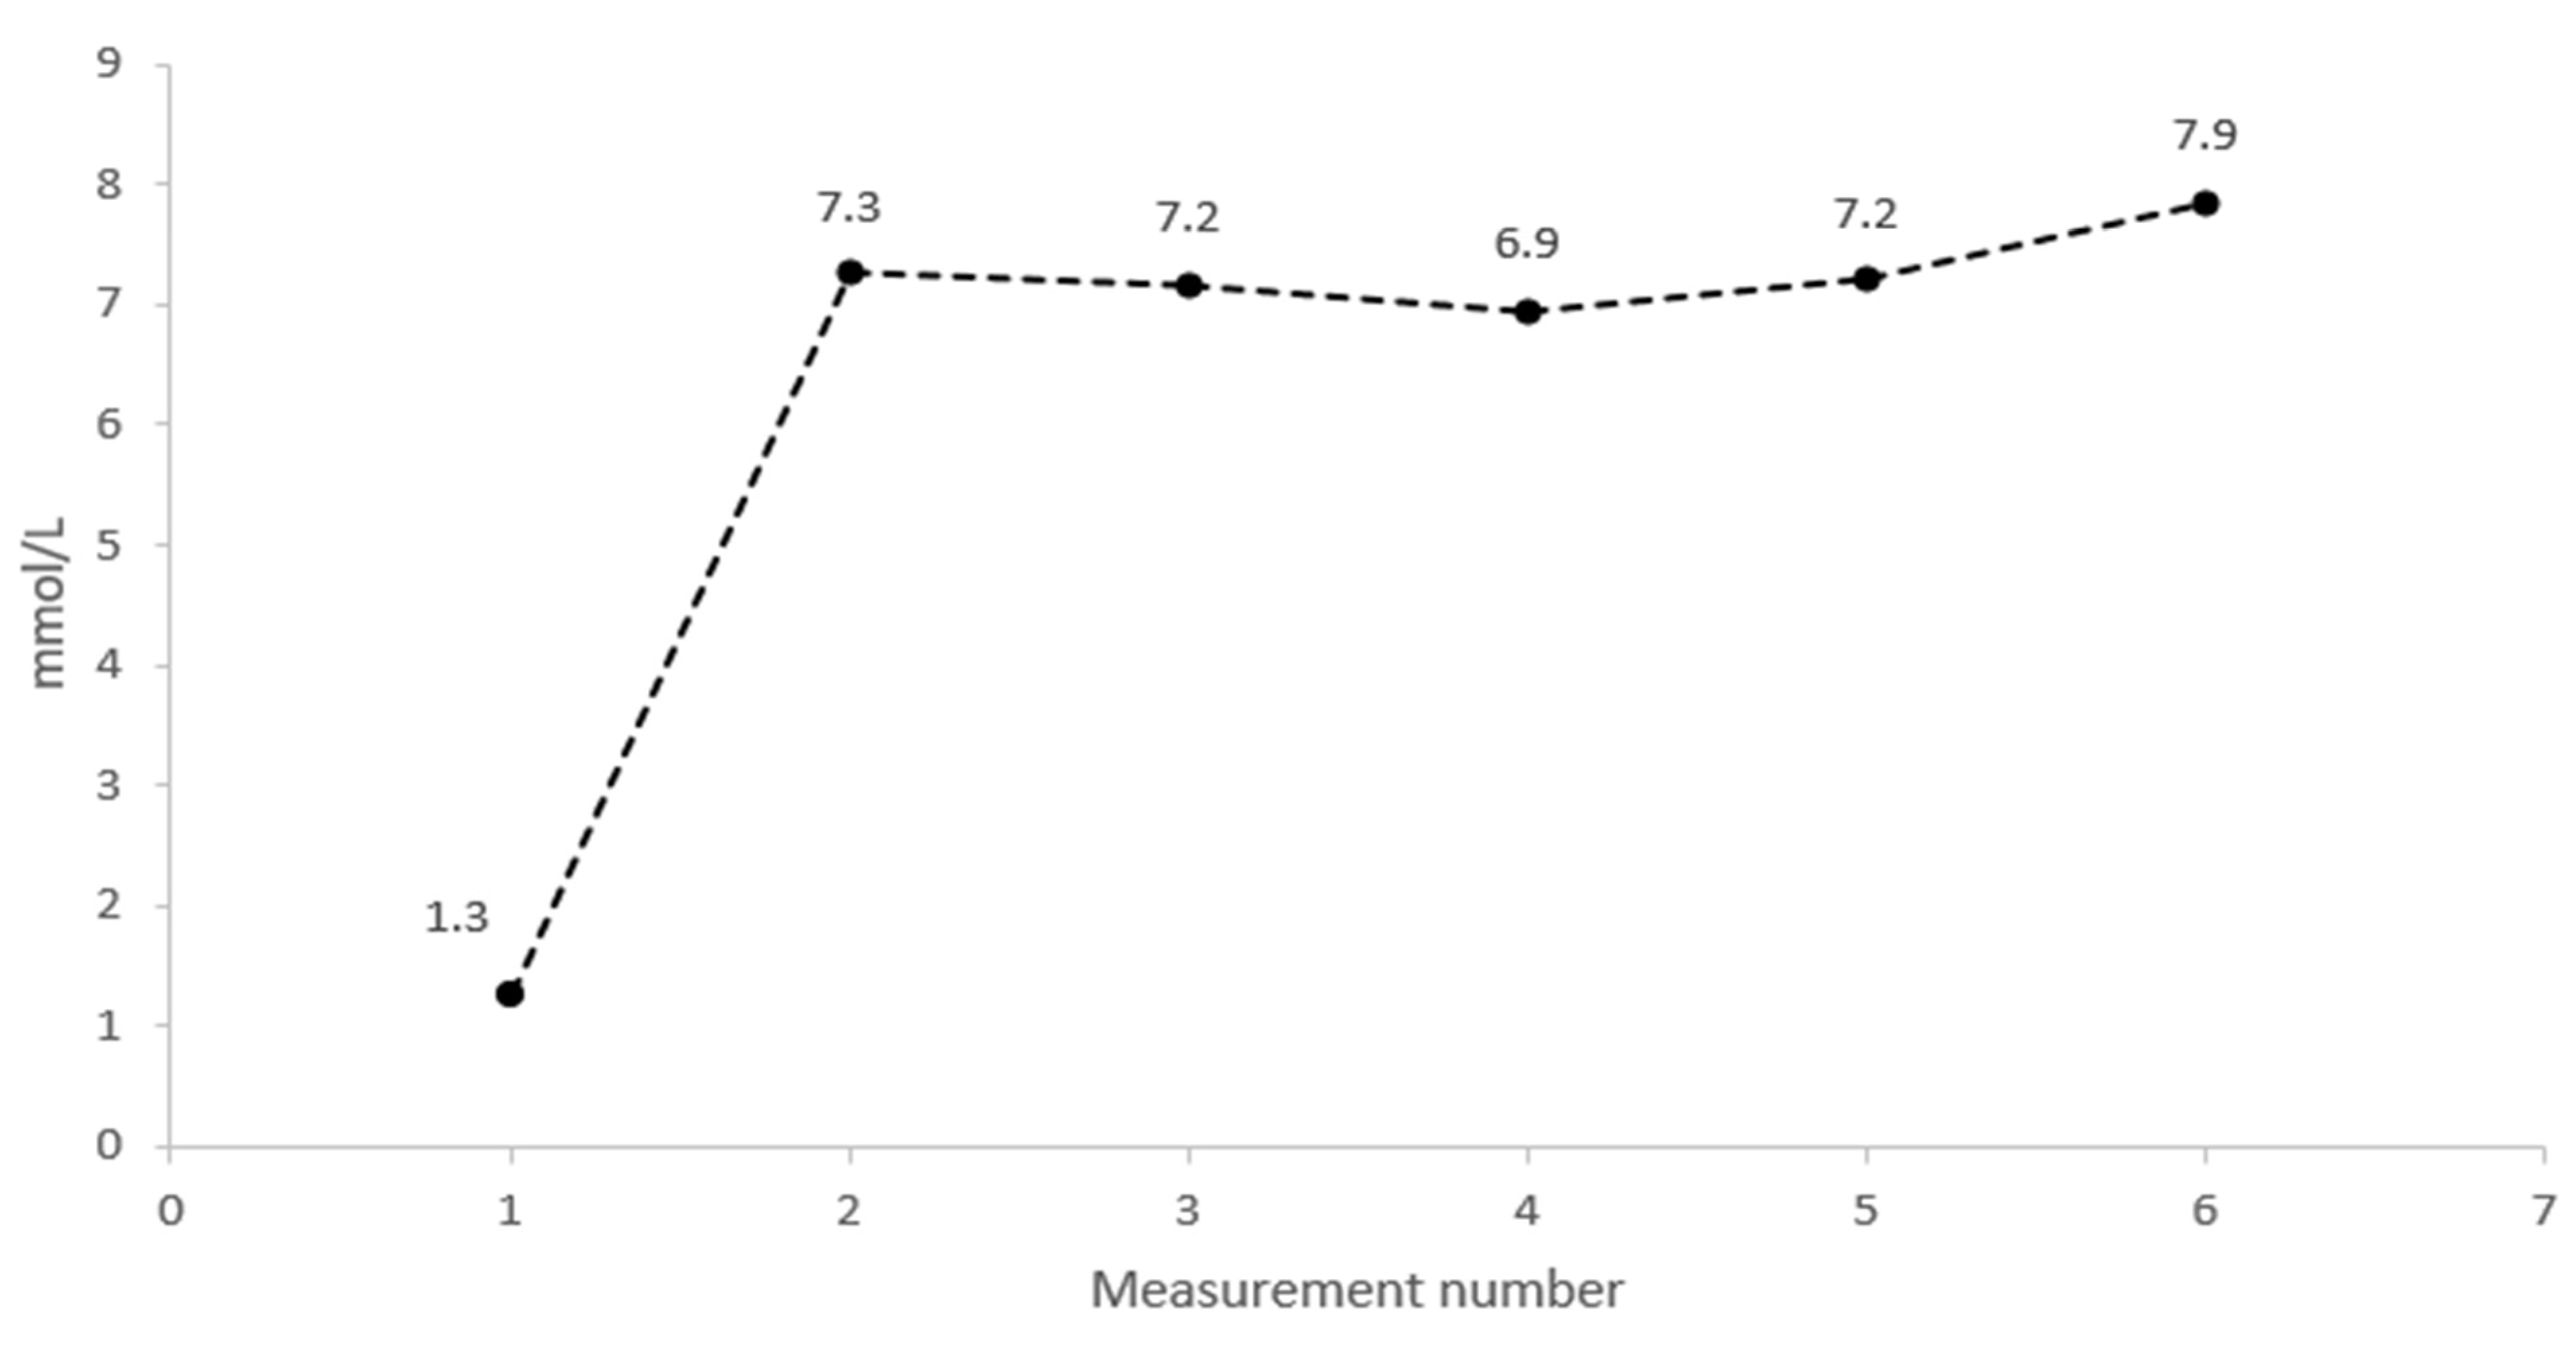
2.5. Lactate Measurement
2.6. Statistical Analyses
3. Results
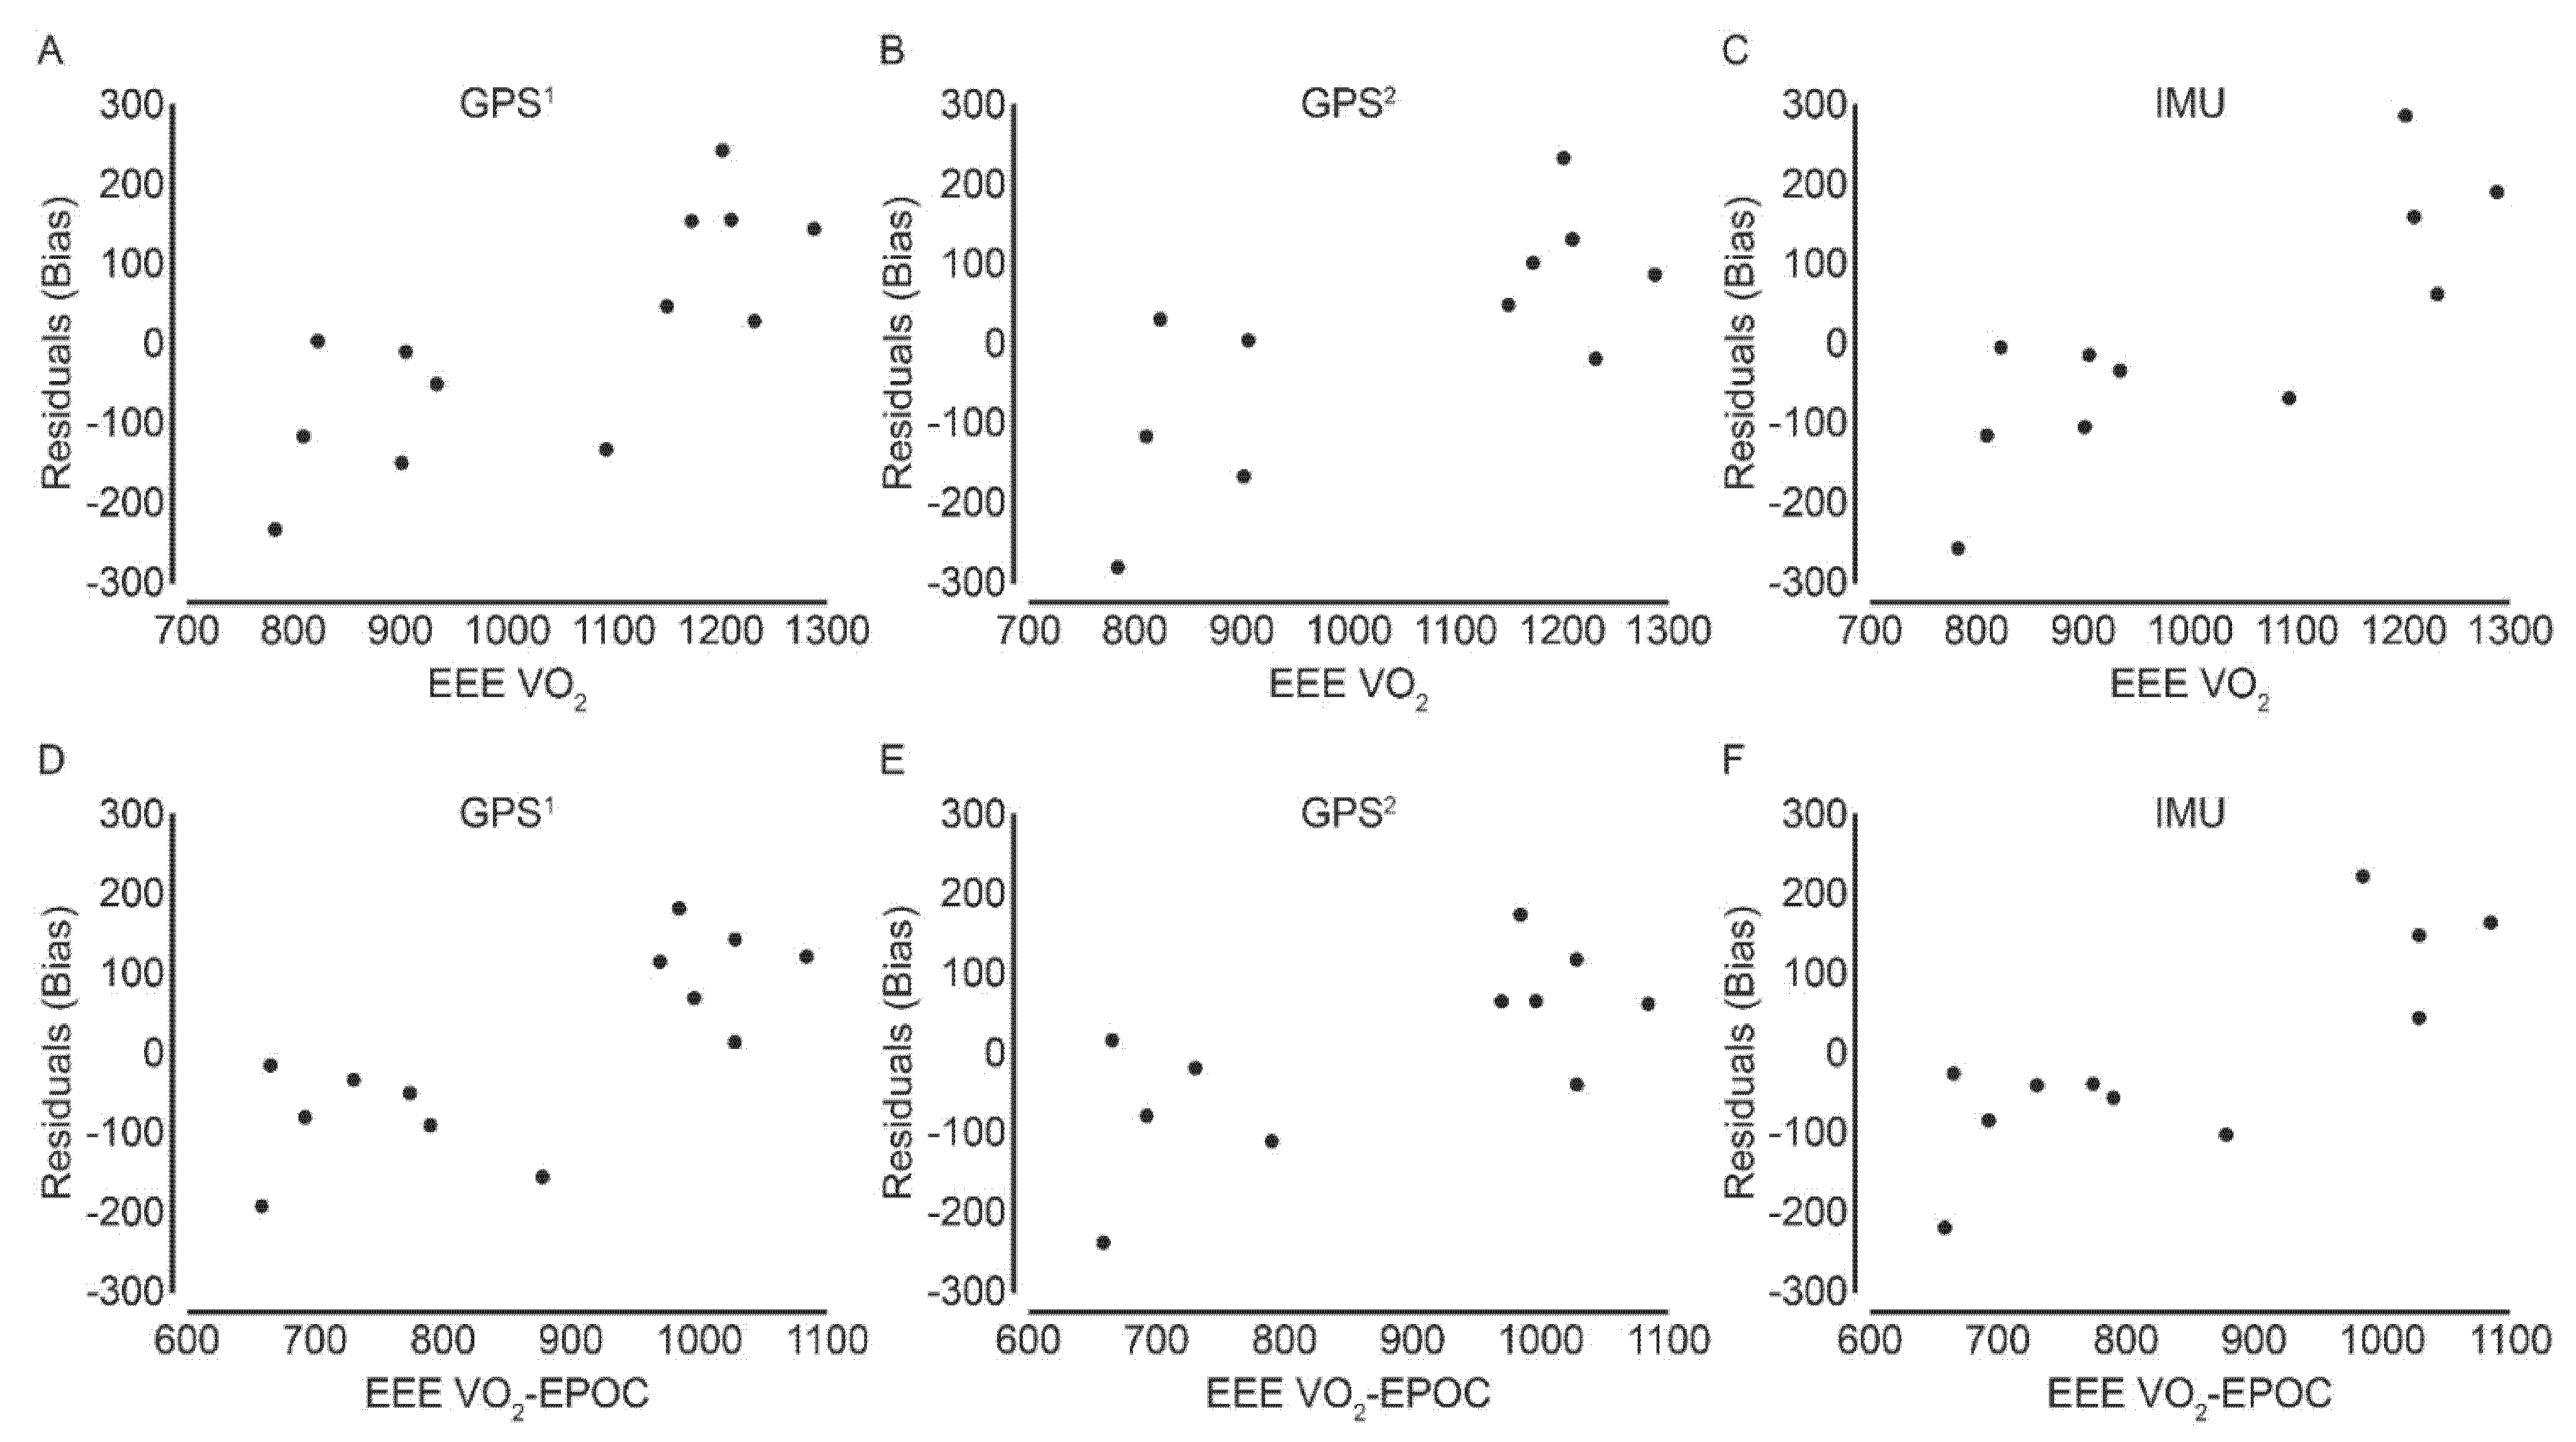
4. Discussion
5. Conclusions
Author Contributions
Funding
Institutional Review Board Statement
Informed Consent Statement
Data Availability Statement
Acknowledgments
Conflicts of Interest
References
- Loucks, A.B. Energy balance and body composition in sports and exercise. J. Sports Sci. 2004, 22, 1–14. [Google Scholar] [CrossRef] [PubMed]
- Collins, J.; Maughan, R.J.; Gleeson, M.; Bilsborough, J.; Jeukendrup, A.; Morton, J.P.; Phillips, S.M.; Armstrong, L.; Burke, L.M.; Close, G.L.; et al. UEFA expert group statement on nutrition in elite football. Current evidence to inform practical recommendations and guide future research. Br. J. Sports Med. 2021, 55, 416. [Google Scholar] [CrossRef] [PubMed]
- Mountjoy, M.; Sundgot-Borgen, J.K.; Burke, L.M.; Ackerman, K.E.; Blauwet, C.; Constantini, N.; Lebrun, C.; Lundy, B.; Melin, A.K.; Meyer, N.L.; et al. IOC consensus statement on relative energy deficiency in sport (RED-S): 2018 update. Br. J. Sports Med. 2018, 52, 687–697. [Google Scholar] [CrossRef] [PubMed] [Green Version]
- Logue, D.; Madigan, S.M.; Delahunt, E.; Heinen, M.; Mc Donnell, S.-J.; Corish, C.A. Low Energy Availability in Athletes: A Review of Prevalence, Dietary Patterns, Physiological Health, and Sports Performance. Sports Med. 2018, 48, 73–96. [Google Scholar] [CrossRef]
- Melin, A.; Tornberg, A.B.; Skouby, S.; Faber, J.; Ritz, C.; Sjödin, A.; Sundgot-Borgen, J. The LEAF questionnaire: A screening tool for the identification of female athletes at risk for the female athlete triad. Br. J. Sports Med. 2014, 48, 540–545. [Google Scholar] [CrossRef]
- Areta, J.L.; Taylor, H.L.; Koehler, K. Low energy availability: History, definition and evidence of its endocrine, metabolic and physiological effects in prospective studies in females and males. Eur. J. Appl. Physiol. 2021, 121, 1–21. [Google Scholar] [CrossRef]
- Hennessy, L.; Jeffreys, I. The Current Use of GPS, Its Potential, and Limitations in Soccer. Strength Cond. J. 2018, 40, 83–94. [Google Scholar] [CrossRef]
- Moss, S.L.; Randell, R.K.; Burgess, D.; Ridley, S.; ÓCairealláin, C.; Allison, R.; Rollo, I. Assessment of energy availability and associated risk factors in professional female soccer players. Eur. J. Sport Sci. 2021, 21, 861–870. [Google Scholar] [CrossRef]
- Reed, J.L.; De Souza, M.J.; Williams, N.I. Changes in energy availability across the season in Division I female soccer players. J. Sports Sci. 2013, 31, 314–324. [Google Scholar] [CrossRef]
- Reed, J.L.; De Souza, M.J.; Kindler, J.M.; Williams, N.I. Nutritional practices associated with low energy availability in Division I female soccer players. J. Sports Sci. 2014, 32, 1499–1509. [Google Scholar] [CrossRef]
- Burke, L.M.; Lundy, B.; Fahrenholtz, I.L.; Melin, A.K. Pitfalls of Conducting and Interpreting Estimates of Energy Availability in Free-Living Athletes. Int. J. Sport Nutr. Exerc. Metab. 2018, 28, 350. [Google Scholar] [CrossRef] [PubMed]
- Oxendale, C.L.; Highton, J.; Twist, C. Energy expenditure, metabolic power and high speed activity during linear and multi-directional running. J. Sci. Med. Sport 2017, 20, 957–961. [Google Scholar] [CrossRef] [PubMed]
- Scott, C.B. Contribution of anaerobic energy expenditure to whole body thermogenesis. Nutr. Metab. 2005, 2, 14. [Google Scholar] [CrossRef] [PubMed] [Green Version]
- Thornton, H.R.; Nelson, A.R.; Delaney, J.A.; Serpiello, F.R.; Duthie, G.M. Interunit Reliability and Effect of Data-Processing Methods of Global Positioning Systems. Int. J. Sports Physiol. Perform. 2019, 14, 432–438. [Google Scholar] [CrossRef]
- Terziotti, P.; Sim, M.; Polglaze, T. A comparison of displacement and energetic variables between three team sport GPS devices. Int. J. Perform. Anal. Sport 2018, 18, 823–834. [Google Scholar] [CrossRef]
- Osgnach, C.; Poser, S.; Bernardini, R.; Rinaldo, R.; di Prampero, P.E. Energy cost and metabolic power in elite soccer: A new match analysis approach. Med. Sci. Sports Exerc. 2010, 42, 170–178. [Google Scholar] [CrossRef]
- di Prampero, P.E.; Botter, A.; Osgnach, C. The energy cost of sprint running and the role of metabolic power in setting top performances. Eur. J. Appl. Physiol. 2015, 115, 451–469. [Google Scholar] [CrossRef]
- Buchheit, M.; Manouvrier, C.; Cassirame, J.; Morin, J.B. Monitoring locomotor load in soccer: Is metabolic power, powerful. Int J. Sports Med. 2015, 36, 1149–1155. [Google Scholar] [CrossRef] [Green Version]
- Stevens, T.G.; De Ruiter, C.J.; Van Maurik, D.; Van Lierop, C.J.; Savelsbergh, G.J.; Beek, P.J. Measured and estimated energy cost of constant and shuttle running in soccer players. Med. Sci. Sports Exerc. 2015, 47, 1219–1224. [Google Scholar] [CrossRef]
- Brown, D.M.; Dwyer, D.B.; Robertson, S.J.; Gastin, P.B. Metabolic power method: Underestimation of energy expenditure in field-sport movements using a global positioning system tracking system. Int. J. Sports Physiol. Perform. 2016, 11, 1067–1073. [Google Scholar] [CrossRef] [Green Version]
- Osgnach, C.; Paolini, E.; Roberti, V.; Vettor, M.; di Prampero, P.E. Metabolic Power and Oxygen Consumption in Team Sports: A Brief Response to Buchheit et al. Int. J. Sports Med. 2016, 37, 77–81. [Google Scholar] [CrossRef] [PubMed]
- Savoia, C.; Padulo, J.; Colli, R.; Marra, E.; McRobert, A.; Chester, N.; Azzone, V.; Pullinger, S.A.; Doran, D.A. The Validity of an Updated Metabolic Power Algorithm Based upon di Prampero’s Theoretical Model in Elite Soccer Players. Int. J. Environ. Res. Public Health 2020, 17, 9554. [Google Scholar] [CrossRef] [PubMed]
- Sandbakk, y.; Solli, G.S.m.; Holmberg, H.-C. Sex Differences in World-Record Performance: The Influence of Sport Discipline and Competition Duration. Int. J. Sports Physiol. Perform. 2018, 13, 2–8. [Google Scholar] [CrossRef] [PubMed]
- Schaal, K.; VanLoan, M.D.; Hausswirth, C.; Casazza, G.A. Decreased energy availability during training overload is associated with non-functional overreaching and suppressed ovarian function in female runners. Appl. Physiol. Nutr. Metab. 2021, 46, 1179–1188. [Google Scholar] [CrossRef]
- Bradley, P.S.; Dellal, A.; Mohr, M.; Castellano, J.; Wilkie, A. Gender differences in match performance characteristics of soccer players competing in the UEFA Champions League. Hum. Mov. Sci. 2014, 33, 159–171. [Google Scholar] [CrossRef]
- Andersson, H.Å.; Randers, M.B.; Heiner-Møller, A.; Krustrup, P.; Mohr, M. Elite Female Soccer Players Perform More High-Intensity Running When Playing in International Games Compared With Domestic League Games. J. Strength Cond. Res. 2010, 24, 912–919. [Google Scholar] [CrossRef]
- Borg, G. Borg’s Perceived Exertion and Pain Scales; Human Kinetics: Champaign, IL, USA, 1998. [Google Scholar]
- Waldron, M.; Harding, J.; Barrett, S.; Gray, A. A New Foot-Mounted Inertial Measurement System in Soccer: Reliability and Comparison to Global Positioning Systems for Velocity Measurements During Team Sport Actions. J. Hum. Kinet 2021, 77, 37–50. [Google Scholar] [CrossRef]
- Montoye, A.H.; Vondrasek, J.D.; James B Hancock, I. Validity and Reliability of the VO2 Master Pro for Oxygen Consumption and Ventilation Assessment. Int. J. Exerc. Sci. 2020, 13, 1382. [Google Scholar]
- Buglione, A.; Di Prampero, P.E. The energy cost of shuttle running. Eur. J. Appl. Physiol. 2013, 113, 1535–1543. [Google Scholar] [CrossRef]
- Scott, C.; Kemp, R. Direct and indirect calorimetry of lactate oxidation: Implications for whole-body energy expenditure. J. Sports Sci. 2005, 23, 15–19. [Google Scholar] [CrossRef]
- Kenney, W.L.; Wilmore, J.H.; Costill, D.L. Physiology of Sport and Exercise; Human Kinetics: Champaigne, IL, USA, 2021. [Google Scholar]
- Hart, S.; Drevets, K.; Alford, M.; Salacinski, A.; Hunt, B.E. A method-comparison study regarding the validity and reliability of the Lactate Plus analyzer. BMJ Open 2013, 3, e001899. [Google Scholar] [CrossRef] [PubMed]
- Beneke, R.; Leithäuser, R.M.; Ochentel, O. Blood Lactate Diagnostics in Exercise Testing and Training. Int. J. Sports Physiol. Perform. 2011, 6, 8–24. [Google Scholar] [CrossRef] [PubMed] [Green Version]
- Landis, J.R.; Koch, G.G. The measurement of observer agreement for categorical data. Biometrics 1977, 33, 159–174. [Google Scholar] [CrossRef] [PubMed] [Green Version]
- Lakens, D. Calculating and reporting effect sizes to facilitate cumulative science: A practical primer for t-tests and ANOVAs. Front. Psychol. 2013, 4, 863. [Google Scholar] [CrossRef] [Green Version]
- Hedges, L.V.; Olkin, I. Statistical Methods for Meta-Analysis; Academic Press: Cambridge, MA, USA, 2014. [Google Scholar]
- Hoppe, M.W.; Baumgart, C.; Polglaze, T.; Freiwald, J. Validity and reliability of GPS and LPS for measuring distances covered and sprint mechanical properties in team sports. PLoS ONE 2018, 13, e0192708. [Google Scholar] [CrossRef] [Green Version]
- di Prampero, P.E.; Fusi, S.; Sepulcri, L.; Morin, J.B.; Belli, A.; Antonutto, G. Sprint running: A new energetic approach. J. Exp. Biol. 2005, 208, 2809–2816. [Google Scholar] [CrossRef] [Green Version]
- Sassi, A.; Stefanescu, A.; Menaspa, P.; Bosio, A.; Riggio, M.; Rampinini, E. The cost of running on natural grass and artificial turf surfaces. J. Strength Cond. Res. 2011, 25, 606–611. [Google Scholar] [CrossRef]
- Datson, N.; Hulton, A.; Andersson, H.; Lewis, T.; Weston, M.; Drust, B.; Gregson, W. Applied Physiology of Female Soccer: An Update. Sports Med. 2014, 44, 1225–1240. [Google Scholar] [CrossRef] [Green Version]
- Børsheim, E.; Bahr, R. Effect of exercise intensity, duration and mode on post-exercise oxygen consumption. Sports Med. 2003, 33, 1037–1060. [Google Scholar] [CrossRef]
- Heikura, I.A.; Stellingwerff, T.; Areta, J.L. Low energy availability in female athletes: From the lab to the field. Eur. J. Sport Sci. 2021, 1–11. [Google Scholar] [CrossRef]


| GPS1 | GPS2 | IMU | |
|---|---|---|---|
| N | 13 | 11 | 11 |
| VO2EEE (kJ) | 1038 ± 183 | 1043 ± 198 | 1016 ± 191 |
| Distance (% error) | 2625 ± 25 (4.4%) | 2644 ± 73 (3.7%) | 2767 ± 207 (0.7%) |
| EEE (kJ) | 933 ± 83 | 843 ± 73 | 879 ± 82 |
| ICCABS | 0.39 | 0.24 | 0.30 |
| ICCCON | 0.48 | 0.44 | 0.42 |
| Percentage error | 10.7% | 20.6% | 14.5% |
| p value | 0.022 | 0.002 | 0.017 |
| ES | 0.60 | 0.96 | 0.77 |
| Values adjusted for EPOC | |||
| VO2-EPOC (kJ) | 868 ± 156 | 875 ± 168 | 847 ± 161 |
| ICCABS | 0.49 | 0.54 | 0.49 |
| ICCCON | 0.54 | 0.53 | 0.48 |
| Percentage error | 7.2% | 3.1% | 3.7% |
| p value | >0.05 | >0.05 | >0.05 |
| ES | 0.44 | 0.15 | 0.21 |
| GPS1 | GPS2 | IMU | |
|---|---|---|---|
| N | 13 | 11 | 11 |
| Intercept | 1038.5 | 1043.1 | 1016.2 |
| Beta | 1.42 | 1.82 | 1.28 |
| t | 2.75 | 2.75 | 2.1 |
| Absolute residual error (kJ) | 112.3 ± 78.7 | 109.1 ± 89.4 | 121.6 ± 92.3 |
| p value | 0.019 | 0.022 | 0.077 |
| 95% CI | 0.3–2.5 | 0.3–3.3 | 0–2.6 |
| Values adjusted for EPOC are presented below | |||
| Intercept | 867.8 | 875.4 | 846.8 |
| Beta | 1.23 | 1.66 | 1.11 |
| T | 2.86 | 3.16 | 2.1 |
| Absolute residual error (kJ) | 97.3 ± 59.9 | 89.1 ± 67.2 | 103.6 ± 72.1 |
| p value | 0.015 | 0.011 | 0.69 |
| 95% CI | 0.3–2.2 | 0.5–2.8 | 0–2.2 |
Publisher’s Note: MDPI stays neutral with regard to jurisdictional claims in published maps and institutional affiliations. |
© 2022 by the authors. Licensee MDPI, Basel, Switzerland. This article is an open access article distributed under the terms and conditions of the Creative Commons Attribution (CC BY) license (https://creativecommons.org/licenses/by/4.0/).
Share and Cite
Dasa, M.S.; Friborg, O.; Kristoffersen, M.; Pettersen, G.; Sundgot-Borgen, J.; Rosenvinge, J.H. Accuracy of Tracking Devices’ Ability to Assess Exercise Energy Expenditure in Professional Female Soccer Players: Implications for Quantifying Energy Availability. Int. J. Environ. Res. Public Health 2022, 19, 4770. https://doi.org/10.3390/ijerph19084770
Dasa MS, Friborg O, Kristoffersen M, Pettersen G, Sundgot-Borgen J, Rosenvinge JH. Accuracy of Tracking Devices’ Ability to Assess Exercise Energy Expenditure in Professional Female Soccer Players: Implications for Quantifying Energy Availability. International Journal of Environmental Research and Public Health. 2022; 19(8):4770. https://doi.org/10.3390/ijerph19084770
Chicago/Turabian StyleDasa, Marcus S., Oddgeir Friborg, Morten Kristoffersen, Gunn Pettersen, Jorunn Sundgot-Borgen, and Jan H. Rosenvinge. 2022. "Accuracy of Tracking Devices’ Ability to Assess Exercise Energy Expenditure in Professional Female Soccer Players: Implications for Quantifying Energy Availability" International Journal of Environmental Research and Public Health 19, no. 8: 4770. https://doi.org/10.3390/ijerph19084770
APA StyleDasa, M. S., Friborg, O., Kristoffersen, M., Pettersen, G., Sundgot-Borgen, J., & Rosenvinge, J. H. (2022). Accuracy of Tracking Devices’ Ability to Assess Exercise Energy Expenditure in Professional Female Soccer Players: Implications for Quantifying Energy Availability. International Journal of Environmental Research and Public Health, 19(8), 4770. https://doi.org/10.3390/ijerph19084770