
Study on the Co-Benefits of Air Pollution Control and Carbon Reduction in the Yellow River Basin: An Assessment Based on a Spatial Econometric Model

Abstract
:1. Introduction
2. Methodology
2.1. Evaluation Model
2.2. Global Moran Index
2.3. Spatial Econometric Model
3. Empirical Estimation
3.1. Evaluation of the Co-Benefits of Carbon Reduction and Air Pollution Control
3.2. Spatial Correlation Analysis
3.3. Analysis of Spatial Spillover Effects
4. Results and Discussion
4.1. Co-Benefits of Carbon Reduction and Air Pollution Control
4.2. Spatial Correlation Analysis
4.3. Analysis of Spatial Spillover Effects
5. Conclusions
Author Contributions
Funding
Institutional Review Board Statement
Informed Consent Statement
Data Availability Statement
Conflicts of Interest
References
- Intergovernmental Panel on Climate Change (IPCC). Climate Change 1995; Cambridge University Press: Cambridge, UK, 1996. [Google Scholar]
- Guan, C.; Li, X.R.; Zhang, P.; Li, C.H. Effect of Global Warming on Soil Respiration and Cumulative Carbon Release in Biocrust-dominated Areas in the Tengger Desert, Northern China. J. Soils Sediments 2019, 19, 1161–1170. [Google Scholar] [CrossRef]
- Xu, H.; Shi, N.; Wu, L.L.; Zhang, D.W. High-quality Development Level and Its Spatiotemporal Changes in the Yellow River Basin. Resour. Sci. 2020, 42, 115–126. [Google Scholar] [CrossRef]
- Zhao, M.M.; Wang, S.M.; Chen, Y.P.; Wu, J.H.; Xue, L.G.; Fan, T.T. Pollution Status of the Yellow River Tributaries in Middle and Lower Reaches. Sci. Total Environ. 2020, 722, 137861. [Google Scholar] [CrossRef] [PubMed]
- Wang, F.; Miao, C.H.; Liu, F.G.; Chen, X.P.; Wang, C.X. The Locality and Adaptability of Human Settlements in the Yellow River Basin: Challenges and Opportunities. J. Nat. Resour. 2021, 36, 1–26. [Google Scholar] [CrossRef]
- Mi, Z.F.; Wei, Y.M.; Wang, B.; Meng, J.; Liu, Z.; Shan, Y.L.; Liu, J.R.; Guan, D.B. Socioeconomic Impact Assessment of China’s CO2 Emissions Peak Prior to 2030. J. Clean. Prod. 2017, 142, 2227–2236. [Google Scholar] [CrossRef] [Green Version]
- Maji, K.J.; Li, V.O.K.; Lam, J.C.K. Effects of China’s Current Air Pollution Prevention and Control Action Plan on Air Pollution Patterns, Health Risks and Mortalities in Beijing 2014–2018. Chemosphere 2020, 260, 127572. [Google Scholar] [CrossRef] [PubMed]
- Wang, Z.L.; Zhu, Y.F. Do Energy Technology Innovations Contribute to CO2 Emissions Abatement? A Spatial Perspective. Sci. Total Environ. 2020, 726, 138574. [Google Scholar] [CrossRef]
- Yang, X.; Teng, F.; Wang, G.H. A Comprehensive Review of Co-Benefit of GHG Mitigation. Ecol. Econ. 2013, 8, 45–50. [Google Scholar]
- Jiang, P.; Chen, Y.H.; Geng, Y.; Dong, W.B.; Xue, B.; Xu, B.; Li, W.X. Analysis of the Co-benefits of Climate Change Mitigation and Air Pollution Reduction in China. J. Clean. Prod. 2013, 58, 130–137. [Google Scholar] [CrossRef]
- Ma, Z.X.; Xue, B.; Geng, Y.; Ren, W.X.; Fujita, T.; Zhang, Z.L.; Oliveira, J.A.P.; Jacques, D.A.; Xi, F.M. Co-benefits Analysis on Climate Change and Environmental Effects of Wind-power: A Case Study from Xinjiang, China. Renew. Energy 2013, 57, 35–42. [Google Scholar] [CrossRef]
- Hasanbeigi, A.; Lobscheid, A.; Lu, H.Y.; Price, L.; Dai, Y. Quantifying the Co-benefits of Energy-efficiency Policies: A Case Study of the Cement Industry in Shandong Province, China. Sci. Total Environ. 2013, 458, 624–636. [Google Scholar] [CrossRef] [PubMed]
- Yang, X.; Teng, F.; Wang, G.H. Incorporating Environmental Co-benefits into Climate Policies: A Regional Study of the Cement Industry in China. Appl. Energy 2013, 112, 1446–1453. [Google Scholar] [CrossRef]
- He, H.; Lei, Y.; Pan, X.; Zhang, Y.; Zhang, Q.; Chen, D.W. Co-benefits from Energy Policies in China. Energy 2010, 35, 4265–4272. [Google Scholar] [CrossRef]
- Jiang, P. Study on Co-Benefits of Environmental Sustainable Development; Fudan University Press: Shanghai, China, 2018. [Google Scholar]
- Markandya, A.; Sampedro, J.; Smith, S.J.; Van Dingenen, R.; Pizarro-Irizar, C.; Arto, I.; Gonzalez-Eguino, M. Health Co-benefits from Air Pollution and Mitigation Costs of the Paris Agreement: A Modelling Study. Lancet Planet. Health 2018, 2, 126–133. [Google Scholar] [CrossRef] [Green Version]
- Zhang, D.S.; Aunan, K.; Seip, H.M.; Larssen, S.; Liu, J.H.; Zhang, D.S. The Assessment of Health Damage Caused by Air Pollution and Its Implication for Policy Making in Taiyuan, Shanxi, China. Energy Policy 2010, 38, 491–502. [Google Scholar] [CrossRef] [Green Version]
- Dimanchev, E.G.; Paltsev, S.; Yuan, M.; Rothenberg, D.; Tessum, C.W.; Marshall, J.D.; Selin, N.E. Health Co-benefits of Sub-national Renewable Energy Policy in the US. Environ. Res. Lett. 2019, 14, 085012. [Google Scholar] [CrossRef] [Green Version]
- Alimujiang, A.; Jiang, P. Synergy and Co-benefits of Reducing CO2 and Air Pollutant Emissions by Promoting Electric Vehicles—A Case of Shanghai. Energy Sustain. Dev. 2020, 55, 181–189. [Google Scholar] [CrossRef]
- Qian, H.Q.; Xu, S.D.; Cao, J.; Ren, F.Z.; Wei, W.D.; Meng, J.; Wu, L.B. Air Pollution Reduction and Climate Co-benefits in China’s Industries. Nat. Sustain. 2021, 4, 417. [Google Scholar] [CrossRef]
- Kanada, M.; Fujita, T.; Fujii, M.; Ohnishi, S. The Long-term Impacts of Air Pollution Control Policy: Historical Links between Municipal Actions and Industrial Energy Efficiency in Kawasaki City, Japan. J. Clean. Prod. 2013, 58, 92–101. [Google Scholar] [CrossRef]
- Pathak, M.; Shukla, P.R. Co-benefits of Low Carbon Passenger Transport Actions in Indian Cities: Case Study of Ahmedabad. Transp. Res. Part D Transp. Environ. 2016, 44, 303–316. [Google Scholar] [CrossRef]
- Saari, R.K.; Selin, N.E.; Rausch, S.; Thompson, T.M. A Self-consistent Method to Assess Air Quality Co-benefits from U.S. Climate Policies. J. Air Waste Manag. Assoc. 2015, 65, 74–89. [Google Scholar] [CrossRef] [PubMed]
- Vandenberghe, D.; Albrecht, J. Tackling the Chronic Disease Burden: Are There Co-benefits from Climate Policy Measures? Eur. J. Health Econ. 2018, 19, 1259–1283. [Google Scholar] [CrossRef] [PubMed]
- Cao, C.J.; Cui, X.Q.; Cai, W.J.; Wang, C.; Xing, L.; Zhang, N.; Shen, S.D.; Bai, Y.Q.; Deng, Z. Incorporating Health Co-benefits into Regional Carbon Emission Reduction Policy Making: A Case Study of China’s Power Sector. Appl. Energy 2019, 253, 113498. [Google Scholar] [CrossRef]
- Karhunmaa, K. Opening up Storylines of Co-benefits in Voluntary Carbon Markets: An Analysis of Household Energy Technology Projects in Developing Countries. Energy Res. Soc. Sci. 2016, 14, 71–79. [Google Scholar] [CrossRef]
- Iacobuta, G.I.; Hohne, N.; van Soest, H.L.; Leemans, R. Transitioning to Low-Carbon Economies under the 2030 Agenda: Minimizing Trade-Offs and Enhancing Co-Benefits of Climate-Change Action for the SDGs. Sustainability 2022, 13, 10774. [Google Scholar] [CrossRef]
- Lee, T.; van de Meene, S. Comparative Studies of Urban Climate Co-benefits in Asian Cities: An Analysis of Relationships between CO2 Emissions and Environmental Indicators. J. Clean. Prod. 2013, 58, 15–24. [Google Scholar] [CrossRef]
- Levy, J.I.; Woo, M.K.; Penn, S.L.; Omary, M.; Tambouret, Y.; Kim, C.S.; Arunachalam, S. Carbon Reductions and Health Co-benefits from US Residential Energy Efficiency Measures. Environ. Res. Lett. 2016, 11, 034017. [Google Scholar] [CrossRef] [Green Version]
- Bollen, J. The value of air pollution co-benefits of climate policies: Analysis with A Global Sector-trade CGE Model called WorldScan. Technol. Forecast. Soc. Chang. 2015, 90, 178–191. [Google Scholar] [CrossRef]
- Li, M.W.; Zhang, D.; Li, C.T.; Selin, N.E.; Karplus, V.J. Co-benefits of China’s Climate Policy for Air Quality and Human Health in China and Transboundary Regions in 2030. Environ. Res. Lett. 2019, 14, 084006. [Google Scholar] [CrossRef]
- Dong, H.J.; Dai, H.C.; Dong, L.; Fujita, T.; Geng, Y.; Klimont, Z.; Inoue, T.; Bunya, S.; Fujii, M.; Masui, T. Pursuing Air Pollutant Co-benefits of CO2 Mitigation in China: A Provincial Leveled Analysis. Appl. Energy 2015, 144, 165–174. [Google Scholar] [CrossRef]
- Yang, T.R.; Liu, W.L. Health Effects of Energy Intensive Sectors and the Potential Health Co-Benefits of a Low Carbon Industrial Transition in China. Int. J. Environ. Res. Public Health 2019, 16, 3022. [Google Scholar] [CrossRef] [PubMed] [Green Version]
- Zhang, S.H.; Worrell, E.; Crijns-Graus, W. Evaluating Co-benefits of Energy Efficiency and Air Pollution Abatement in China’s Cement Industry. Appl. Energy 2015, 147, 192–213. [Google Scholar] [CrossRef]
- Ye, M.H.; Wang, C. Climate and Air Quality Co-benefits of Local Air Pollution Control: The Case of China’s Power Sector. Adv. Environ. Technol. 2013, 726, 2045–2050. [Google Scholar] [CrossRef]
- Zhou, L.; Xia, Y.H.; Chen, W.Y. Review of Low Carbon Development Targets and Relative Co-benefits in China. China Popul. Resour. Environ. 2020, 30, 10–17. [Google Scholar]
- Sandberg, N.H.; Næss, J.S.; Brattebø, H.; Andresen, I.; Gustavsenc, A. Large Potentials for Energy Saving and Greenhouse Gas Emission Reductions from Large-scale Deployment of Zero Emission Building Technologies in A National Building Stock. Energy Policy 2021, 152, 112–114. [Google Scholar] [CrossRef]
- Wang, X.E.; Wang, H.N.; Xia, J.; Zhao, J.C.; Duan, H.Y. Typical Country’s Coordinated Development of the Economy-society and Energy-Environment during Industrialization. Resour. Sci. 2016, 38, 2001–2011. [Google Scholar]
- Dong, L.F. Comprehensive Evaluation of Regional Land Resources Carrying Capacity based on Dpsirm Framework: A Case Study of Nanjing City. Farmers Consult. 2020, 1, 53–54. [Google Scholar]
- Qin, X.H.; Du, D.B.; Kwan, M.P. Spatial Spillovers and Value Chain Spillovers: Evaluating Regional R&D Efficiency and Its Spillover Effects in China. Scientometrics 2019, 119, 721–747. [Google Scholar] [CrossRef]
- Wu, Y.M. Measurement of Input Output Elasticity of Regional Agricultural Production Factors in China: An Empirical Study based on Spatial Econometric Model. Chin. Rural Econ. 2010, 6, 25–37. [Google Scholar]
- Jiang, H.; Yu, Y.; Chen, M.M.; Huang, W. The Climate Change Vulnerability of China: Spatial Evolution and Driving Factors. Environ. Sci. Pollut. Res. 2021, 28, 39757–39768. [Google Scholar] [CrossRef]
- James, L.; Robert, K.P. Introduction to Spatial Econometrics; CRC Press: Boca Raton, FL, USA, 2009. [Google Scholar]
- Liu, H.J.; Yang, Q. The Spatial Disparities and Influence Factors of China’s Total Factor Productivity Growth under the Constraints of Resource and Environment. J. Manag. Sci. 2014, 27, 133–144. [Google Scholar]
- Qiao, W.; Sun, X.; Jiang, P.; Wang, L.J. Analysis of the Environmental Sustainability of a Megacity through a Cobenefits Indicator System—The Case of Shanghai. Sustainability 2020, 12, 5549. [Google Scholar] [CrossRef]
- Liu, J.; Liu, Z.W.; Jiao, S.S.; Wang, L.; Tang, Z.Y. Co-effect of CO Mitigation and PM2.5 Control in Chinese Cities. Urban Environ. Stud. 2019, 4, 80–97. [Google Scholar]
- Guo, H.; Tian, J.; Liao, S.M.; Liang, Z.J. Exploring the Spatial Aggregation and Determinants of Energy Intensity in Guangdong Province of China. J. Clean. Prod. 2021, 282, 124367. [Google Scholar] [CrossRef]
- Zhou, B.; Zhang, C.; Song, H.Y.; Wang, Q.W. How does Emission Trading Reduce China’s Carbon Intensity? An Exploration using a Decomposition and Difference-in-differences Approach. Sci. Total Environ. 2019, 676, 514–523. [Google Scholar] [CrossRef]
- Nguyen, D.K.; Huynh, T.L.D.; Nasir, M.A. Carbon Emissions Determinants and Forecasting: Evidence from G6 Countries. J. Environ. Manag. 2021, 285, 111988. [Google Scholar] [CrossRef]
- Zheng, Y.; Peng, J.C.; Xiao, J.Z.; Su, P.D.; Li, S.Y. Industrial Structure Transformation and Provincial Heterogeneity Characteristics Evolution of Air Pollution: Evidence of A Threshold Effect from China. Atmos. Pollut. Res. 2020, 11, 598–609. [Google Scholar] [CrossRef]
- Qi, X.Y.; Han, Y.; Kou, P. Population Urbanization, Trade Openness and Carbon Emissions: An Empirical Analysis based on China. Air Qual. Atmos. Health 2020, 13, 519–528. [Google Scholar] [CrossRef]
- Wang, X.M.; Wu, J.; Bai, B.; Wang, Z. Spatial Differentiation and Driving Factors of CO2 Emissions: Analysis Based on 198 Cities at Prefecture Level and Above in China. Econ. Geogr. 2020, 40, 29–38. [Google Scholar] [CrossRef]
- Andersson, F.N.G. International Trade and Carbon Emissions: The Role of Chinese Institutional and Policy Reforms. J. Environ. Manag. 2018, 205, 29–39. [Google Scholar] [CrossRef]
- Li, J.K.; Cheng, L.Y.; Zhang, T.B. Does Foreign Direct Investment have the Pollution Halo Effect? China Popul. Resour. Environ. 2017, 27, 74–83. [Google Scholar]
- Jiao, J.L.; Wang, C.X.; Yang, R.R. Exploring the Driving Orientations and Driving Mechanisms of Environmental Innovation: The Case Study of the China Gezhouba. J. Clean. Prod. 2020, 260, 121016. [Google Scholar] [CrossRef]
- Liu, J.H.; Huang, L.C.; Zuo, Q.T. Evaluation of Harmonious Development of Economy-population-resource-environment in the Lower Reaches of the Yellow River. Resour. Sci. 2021, 43, 412–422. [Google Scholar] [CrossRef]
- Zhang, B.C.; Fu, K.K. Innovation of Shaanxi Qinling Ecological Environment Protection Regulations. Environ. Prot. 2008, 4, 19–21. [Google Scholar]
- Gao, X.T.; Wu, Z.G. Deeply Learn and Apply XI Jin-ping’s Thoughts on Ecological Civilization, and Firmly Follow the Path of High-quality Development: Summary of the Seminar Taking a New Path of High-quality Development Guided by Ecological Priority and Green Development. Inn. Mong. Soc. Sci. 2020, 41, 203–206. [Google Scholar] [CrossRef]
- Jin, X.Q.; Guo, Y.Y.; Huang, Y.M. Research on the High-Quality Development of Yellow River Basin Manufacturing Industry Based on Niche Assessment. Ecol. Econ. 2020, 36, 50–55. [Google Scholar]
- Zhang, G.S. Construction of the Yellow River Economic Belt: Significance, Feasibility and Path Selection. Econ. Probl. 2019, 7, 123–129. [Google Scholar] [CrossRef]
- Zhang, C.J.; Bai, Q.; Zhang, W.A. The Influencing Factors of Regional Carbon Emission Intensity in China and Spatial Spillover. Syst. Eng. 2017, 35, 70–78. [Google Scholar]
- He, A.P.; An, M.T.; Li, X.J. Study on Green Development Efficiency and Its Promotion Path in the Yellow River Basin. J. Humanit. 2021, 4, 32–42. [Google Scholar] [CrossRef]
- Ding, X.H.; Cai, Z.Y.; Fu, Z. Does the New-type Urbanization Construction Improve the Efficiency of Agricultural Green Water Utilization in the Yangtze River Economic Belt? Environ. Sci. Pollut. Res. 2021, 28, 64103–64112. [Google Scholar] [CrossRef]
- Zaidi, S.A.H.; Zafar, M.W.; Shahbaz, M.; Hou, F.J. Dynamic Linkages between Globalization, Financial Development and Carbon Emissions: Evidence from Asia Pacific Economic Cooperation Countries. J. Clean. Prod. 2019, 228, 533–543. [Google Scholar] [CrossRef]
- Xia, H.H.; Ding, L.; Zeng, K.F.; Liu, C. Atmospheric Pollution Effects in the Process of Industrial Development of the Yangtze River Economic Belt during 1996-2013. Resour. Environ. Yangtze Basin 2017, 26, 1057–1067. [Google Scholar]
- Li, W.H.; Li, C.; Huang, W.C.; Dong, C.J. Effect of Environmental Regulation on the Manufacturing FDI in China: Spatial Econometric Studies. Bulg. Chem. Commun. 2017, 49, 26–31. [Google Scholar]
- Ding, X.H.; Tang, N.; He, J.H. The Threshold Effect of Environmental Regulation, FDI Agglomeration, and Water Utilization Efficiency under “Double Control Actions”-An Empirical Test Based on Yangtze River Economic Belt. Water 2019, 11, 452. [Google Scholar] [CrossRef] [Green Version]
- Hu, Z.G.; Li, G.Q.; Cao, J.H. Air Pollution Regional Linkage Control and Prevention from the Perspective of Environmental Regulation: The Scheme Design, State Evaluation and lnfluencing Factors Analysis. China Ind. Econ. 2019, 5, 24–42. [Google Scholar] [CrossRef]
- Sun, H.J.; Zhang, L.N.; Wang, S.G. Technological Talent Agglomeration, Spatial Spillover and Regional Technological Innovation Based on Spatial Durbin Model Partial Differential Method. Sci. Sci. Manag. S. T. 2019, 40, 58–69. [Google Scholar]


| Frame Layer | Element Layer | Index Layer | Weight |
|---|---|---|---|
| Driving force (D) | Economic development level | GDP | 0.072 |
| GDP per capita | 0.032 | ||
| Industrial structure | Proportion of secondary industry to GDP | 0.012 | |
| Proportion of tertiary industry to GDP | 0.024 | ||
| Population size | Permanent population | 0.062 | |
| Scientific and technological innovation level | Number of green technology patents authorized | 0.127 | |
| Pressure (P) | Energy consumption intensity | Total energy consumption | 0.045 |
| Energy consumption per 10,000 yuan GDP | 0.040 | ||
| State (S) | Emission level of air pollutants | Annual average concentration of PM2.5 | 0.039 |
| Total annual SO2 emissions | 0.040 | ||
| Carbon emission level | Carbon emissions | 0.044 | |
| Per capita carbon emissions | 0.041 | ||
| Carbon emissions per 10,000 yuan GDP | 0.052 | ||
| Impacts (I) | Air pollution | Air quality index | 0.019 |
| Greenhouse effect | Annual average temperature | 0.026 | |
| Response (R) | Government measures | Elasticity coefficient of energy consumption | 0.042 |
| Green coverage of built-up area | 0.013 | ||
| Environmental protection fund | Proportion of energy conservation and environmental protection expenditure in the total financial expenditure | 0.030 | |
| Operation cost of industrial waste gas treatment facilities | 0.065 | ||
| Management (M) | Environmental regulation | Total investment in environmental pollution control | 0.063 |
| Treatment capacity of industrial waste gas treatment facilities | 0.110 |
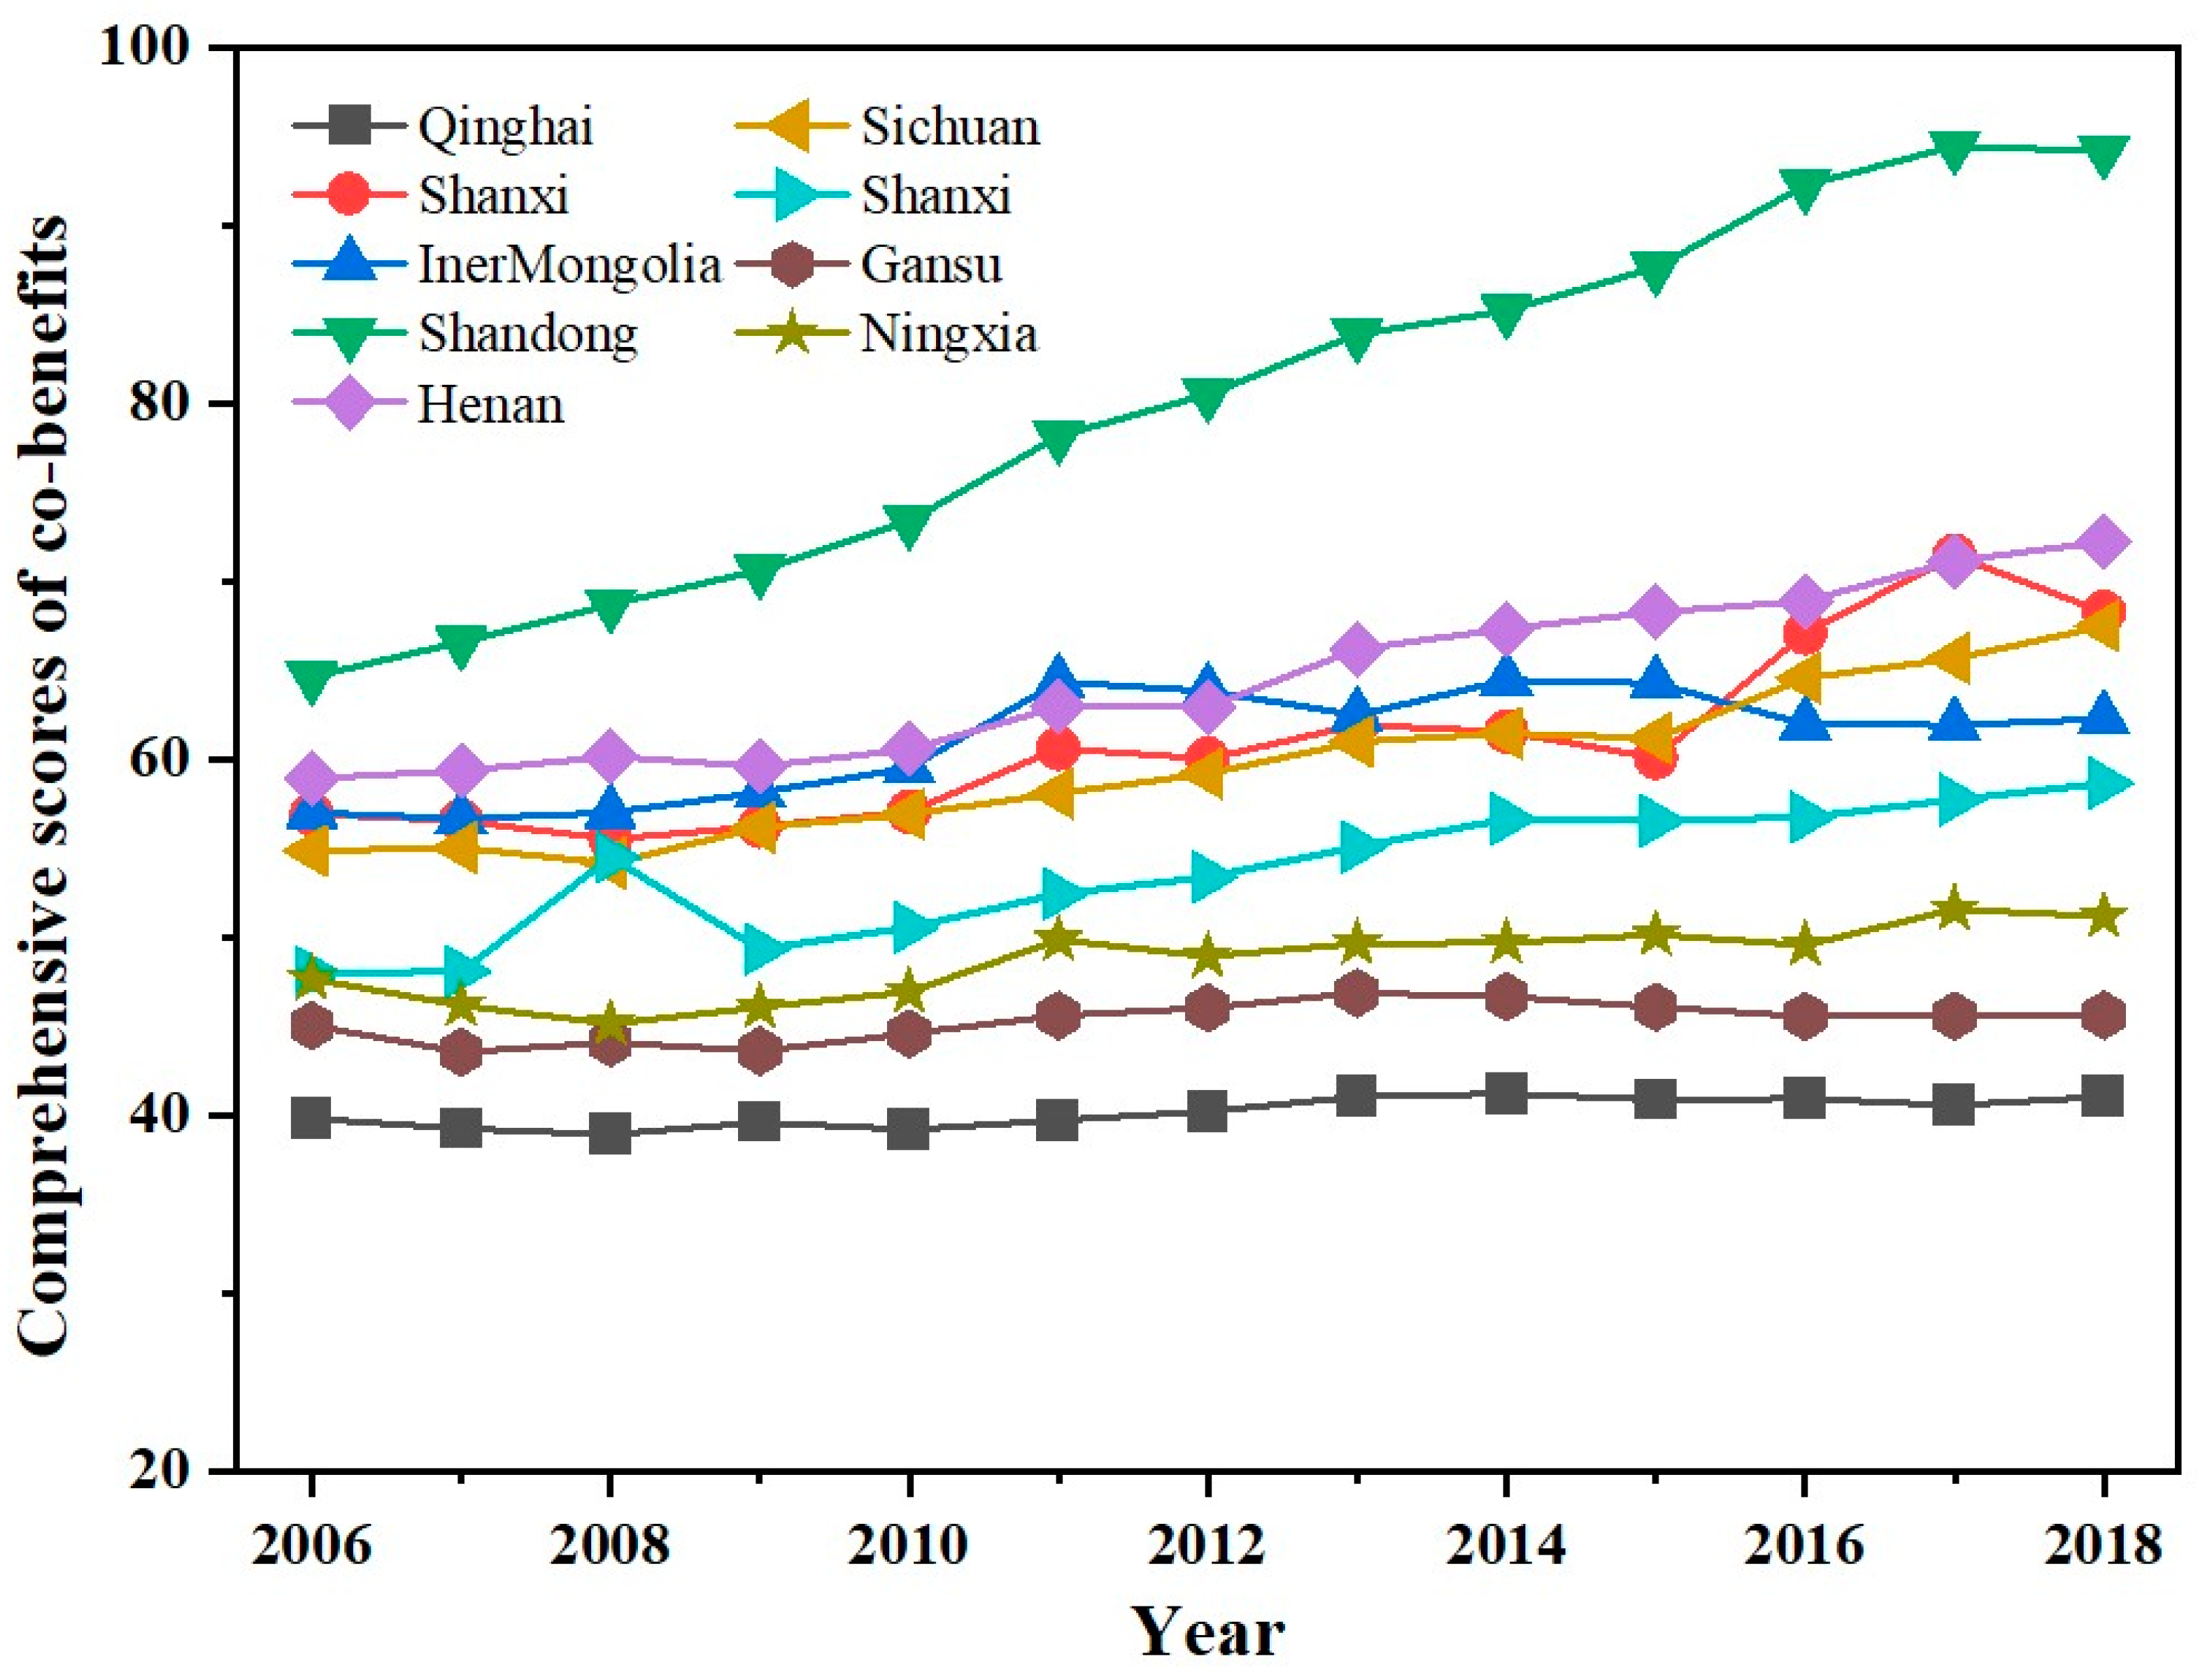
| Region | 2006 | 2007 | 2008 | 2009 | 2010 | 2011 | 2012 | 2013 | 2014 | 2015 | 2016 | 2017 | 2018 |
|---|---|---|---|---|---|---|---|---|---|---|---|---|---|
| Qinghai | 39.83 | 39.27 | 38.94 | 39.62 | 39.21 | 39.74 | 40.23 | 41.07 | 41.24 | 40.90 | 40.96 | 40.57 | 41.08 |
| Shanxi | 56.95 | 56.59 | 55.53 | 56.27 | 57.08 | 60.64 | 60.07 | 61.96 | 61.58 | 60.12 | 67.14 | 71.48 | 68.30 |
| Inner Mongolia | 57.04 | 56.70 | 57.04 | 58.16 | 59.54 | 64.37 | 63.87 | 62.51 | 64.49 | 64.30 | 62.00 | 61.95 | 62.31 |
| Shandong | 64.66 | 66.64 | 68.74 | 70.67 | 73.43 | 78.19 | 80.56 | 83.93 | 85.27 | 87.68 | 92.31 | 94.49 | 94.22 |
| Henan | 58.96 | 59.40 | 60.19 | 59.64 | 60.59 | 62.99 | 62.97 | 66.23 | 67.38 | 68.31 | 68.91 | 71.19 | 72.26 |
| Sichuan | 54.89 | 55.07 | 54.19 | 56.20 | 56.95 | 58.12 | 59.23 | 61.02 | 61.50 | 61.22 | 64.60 | 65.70 | 67.52 |
| Shannxi | 48.02 | 48.10 | 54.53 | 49.37 | 50.58 | 52.47 | 53.42 | 55.10 | 56.67 | 56.58 | 56.76 | 57.77 | 58.69 |
| Gansu | 45.07 | 43.57 | 44.11 | 43.63 | 44.60 | 45.62 | 46.06 | 46.90 | 46.68 | 46.10 | 45.57 | 45.60 | 45.65 |
| Ningxia | 47.68 | 46.20 | 45.17 | 46.09 | 46.95 | 49.88 | 48.96 | 49.67 | 49.73 | 50.17 | 49.59 | 51.61 | 51.20 |
| AVG | 52.57 | 52.39 | 53.16 | 53.29 | 54.32 | 56.89 | 57.26 | 58.71 | 59.39 | 59.49 | 60.87 | 62.26 | 62.36 |
| SD | 7.41 | 8.18 | 8.59 | 9.01 | 9.65 | 10.81 | 11.20 | 11.87 | 12.30 | 12.99 | 14.46 | 15.26 | 15.07 |
| CV | 0.14 | 0.16 | 0.16 | 0.17 | 0.18 | 0.19 | 0.20 | 0.20 | 0.21 | 0.22 | 0.24 | 0.25 | 0.24 |
| Year | Moran’s I | Value Z | p-Value 1 | High–High (H–H) Agglomeration | Low–Low (L–L) Agglomeration | Low–High (L–H) Agglomeration | High–Low (H–L) Agglomeration |
|---|---|---|---|---|---|---|---|
| 2006 | 0.2892 | 1.7964 | 0.048 | \ | Gansu | \ | Sichuan |
| 2007 | 0.3131 | 1.9133 | 0.036 | \ | \ | \ | Sichuan |
| 2008 | 0.3608 | 2.2042 | 0.022 | \ | Gansu, Qinghai | \ | Sichuan |
| 2009 | 0.2791 | 1.8129 | 0.046 | \ | \ | \ | Sichuan |
| 2010 | 0.2697 | 1.8039 | 0.045 | \ | \ | \ | Sichuan |
| 2011 | 0.2702 | 1.7961 | 0.049 | \ | \ | \ | Sichuan |
| 2012 | 0.2460 | 1.7386 | 0.049 | \ | \ | \ | Sichuan |
| 2013 | 0.3098 | 2.0870 | 0.016 | \ | \ | \ | Sichuan |
| 2014 | 0.3089 | 2.0586 | 0.022 | \ | \ | \ | Sichuan |
| 2015 | 0.3222 | 2.1603 | 0.016 | \ | \ | \ | Sichuan |
| 2016 | 0.3081 | 2.1340 | 0.018 | \ | \ | \ | Sichuan |
| 2017 | 0.3336 | 2.2255 | 0.016 | Henan | Gansu | \ | Sichuan |
| 2018 | 0.3303 | 2.1971 | 0.014 | \ | \ | \ | Sichuan |
| Index | Variable | Fixed Effect | SAC | ||||
|---|---|---|---|---|---|---|---|
| Estimated Coefficient | t Value | p > |t| 2 | Estimated Coefficient | z Value | p > |z| | ||
| Economic development level (ECOL) | The GDP | 0.7701 | 11.75 | 0.000 | 0.6279 | 6.41 | 0.000 |
| Industrial structure (INDS) | The proportion of added value of secondary industry in GDP | −0.0954 | −4.06 | 0.000 | −0.0543 | −1.84 | 0.066 |
| Urbanization level (URBL) | The urbanization rate | −0.0498 | −1.07 | 0.287 | −0.1356 | −4.83 | 0.000 |
| Scientific and technological innovation level (STIL) | The research and experimental development funding intensity | −0.0486 | −0.79 | 0.429 | −0.0565 | −0.78 | 0.438 |
| Opening up level (OPEL) | The total volume of import and export trade | 0.0082 | 0.30 | 0.763 | 0.0171 | 1.18 | 0.238 |
| Foreign investment level (FORL) | The actual amount of foreign investment | −0.1118 | −3.23 | 0.002 | −0.0762 | −2.17 | 0.030 |
| Education level (EDUL) | The average number of years of education per capita | 0.0710 | 1.81 | 0.074 | 0.0562 | 1.81 | 0.070 |
| Environmental regulation intensity (ENVI) | The proportion of environmental pollution control investment in GDP | 0.0263 | 1.15 | 0.254 | 0.0381 | 2.35 | 0.019 |
| Hausman | 87.49 | 0.000 | |||||
| cons | −0.0001 | −0.00 | 1.000 | ||||
| Rho | 0.9419 | 0.4471 | 3.94 | 0.000 | |||
| Number of samples | 117 | 117 | |||||
| Index | Direct Effect | Indirect Effect | Total Effect |
|---|---|---|---|
| ECOL | 0.6849 *** 3 (8.16) | 0.4779 *** (2.97) | 1.1628 *** (8.28) |
| INDS | −0.0605 * (−1.84) | −0.0407 (−1.46) | −0.1012 * (−1.80) |
| URBL | −0.1455 *** (−4.85) | −0.1012 *** (−2.66) | −0.2466 *** (−4.91) |
| STIL | −0.0630 (−0.78) | −0.0414 (0.64) | −0.1044 (−0.74) |
| OPEL | 0.0196 (0.96) | 0.0159 (0.80) | 0.0355 (0.91) |
| FORL | −0.0825 ** (−2.34) | −0.0558 * (−1.89) | −0.1383 ** (−2.38) |
| EDUL | 0.0613 * (1.86) | 0.0384 * (1.85) | 0.0997 ** (2.01) |
| ENVI | 0.0406 ** (2.44) | 0.0268 ** (2.08) | 0.0674 *** (2.58) |
Publisher’s Note: MDPI stays neutral with regard to jurisdictional claims in published maps and institutional affiliations. |
© 2022 by the authors. Licensee MDPI, Basel, Switzerland. This article is an open access article distributed under the terms and conditions of the Creative Commons Attribution (CC BY) license (https://creativecommons.org/licenses/by/4.0/).
Share and Cite
Cai, Z.; Yang, X.; Lin, H.; Yang, X.; Jiang, P. Study on the Co-Benefits of Air Pollution Control and Carbon Reduction in the Yellow River Basin: An Assessment Based on a Spatial Econometric Model. Int. J. Environ. Res. Public Health 2022, 19, 4537. https://doi.org/10.3390/ijerph19084537
Cai Z, Yang X, Lin H, Yang X, Jiang P. Study on the Co-Benefits of Air Pollution Control and Carbon Reduction in the Yellow River Basin: An Assessment Based on a Spatial Econometric Model. International Journal of Environmental Research and Public Health. 2022; 19(8):4537. https://doi.org/10.3390/ijerph19084537
Chicago/Turabian StyleCai, Zhongyao, Xiaohui Yang, Huaxing Lin, Xinyu Yang, and Ping Jiang. 2022. "Study on the Co-Benefits of Air Pollution Control and Carbon Reduction in the Yellow River Basin: An Assessment Based on a Spatial Econometric Model" International Journal of Environmental Research and Public Health 19, no. 8: 4537. https://doi.org/10.3390/ijerph19084537
APA StyleCai, Z., Yang, X., Lin, H., Yang, X., & Jiang, P. (2022). Study on the Co-Benefits of Air Pollution Control and Carbon Reduction in the Yellow River Basin: An Assessment Based on a Spatial Econometric Model. International Journal of Environmental Research and Public Health, 19(8), 4537. https://doi.org/10.3390/ijerph19084537