
Traditional and Undulating Periodization on Body Composition, Strength Levels and Physical Fitness in Older Adults

 ,
,  , ,
, ,  ,
,  ,
,  ,
,  and
and 
Abstract
1. Introduction
2. Methods
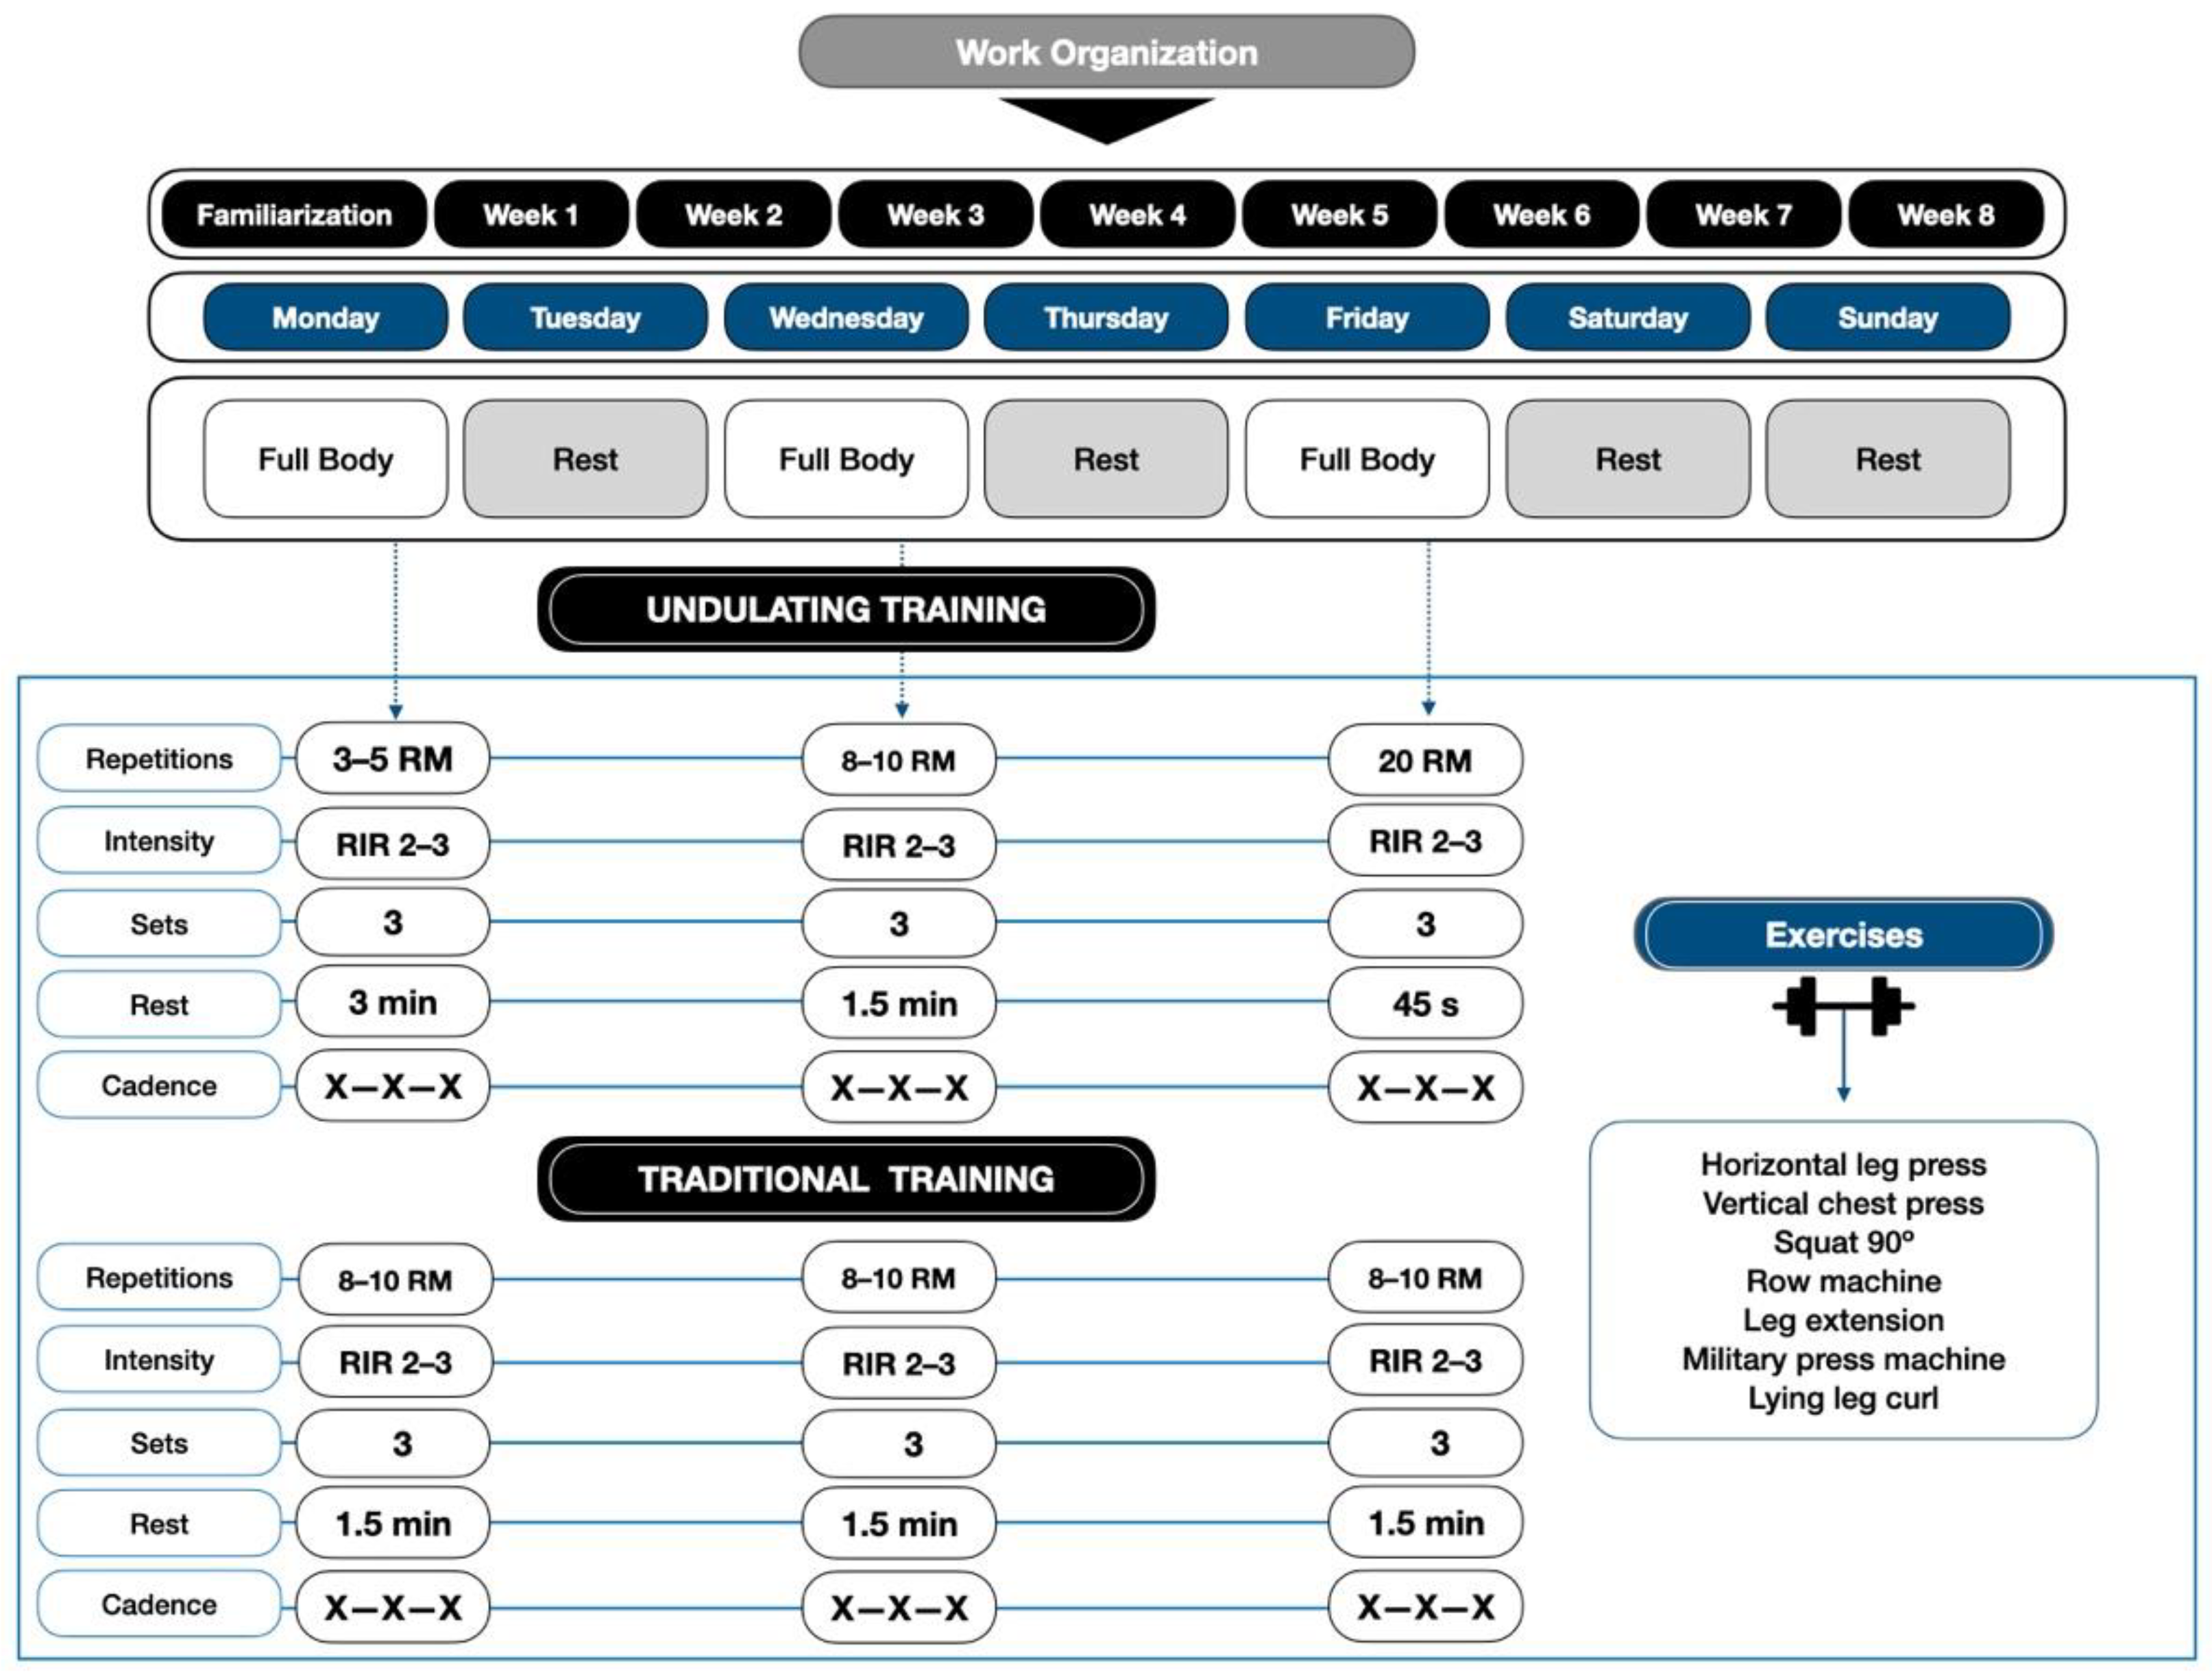
2.1. Trial Design
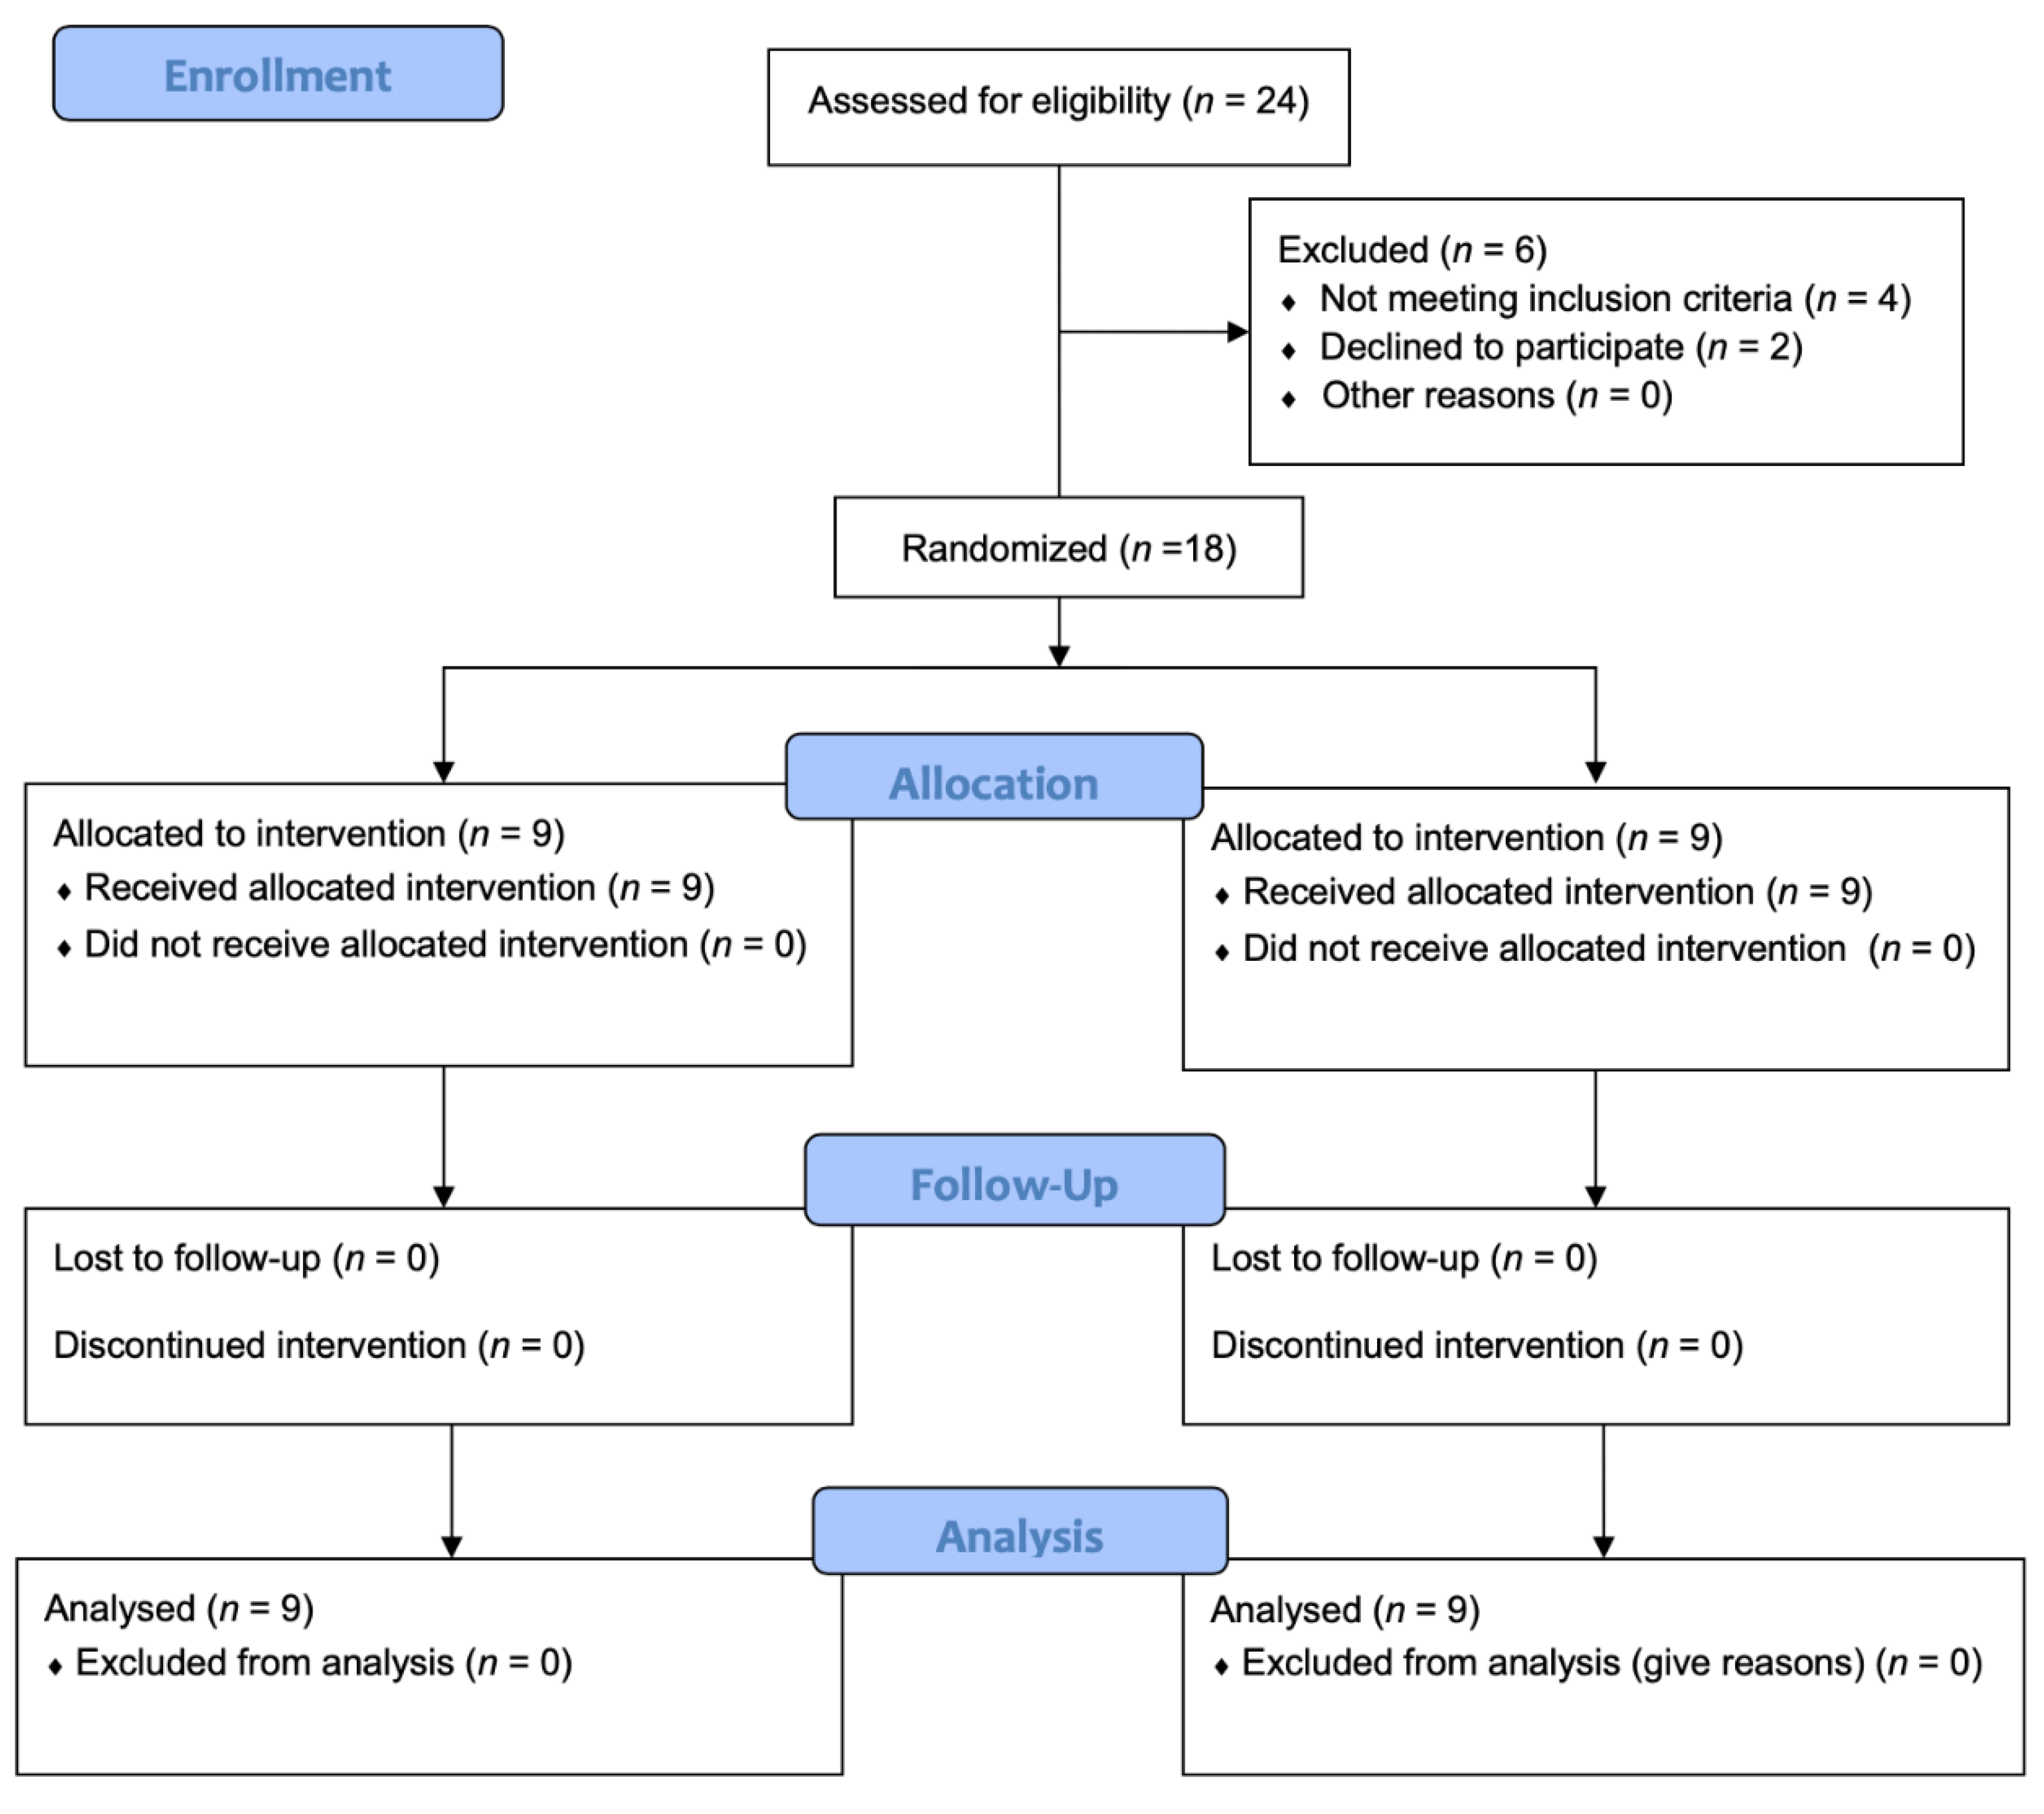
2.2. Participants
2.3. Dietary Intake
2.4. Anthropometry
2.5. Body Composition
2.6. Functional Capacity
2.7. Familiarization
2.8. Exercise Protocol
2.9. Statistical Analysis
3. Results
3.1. Demographics
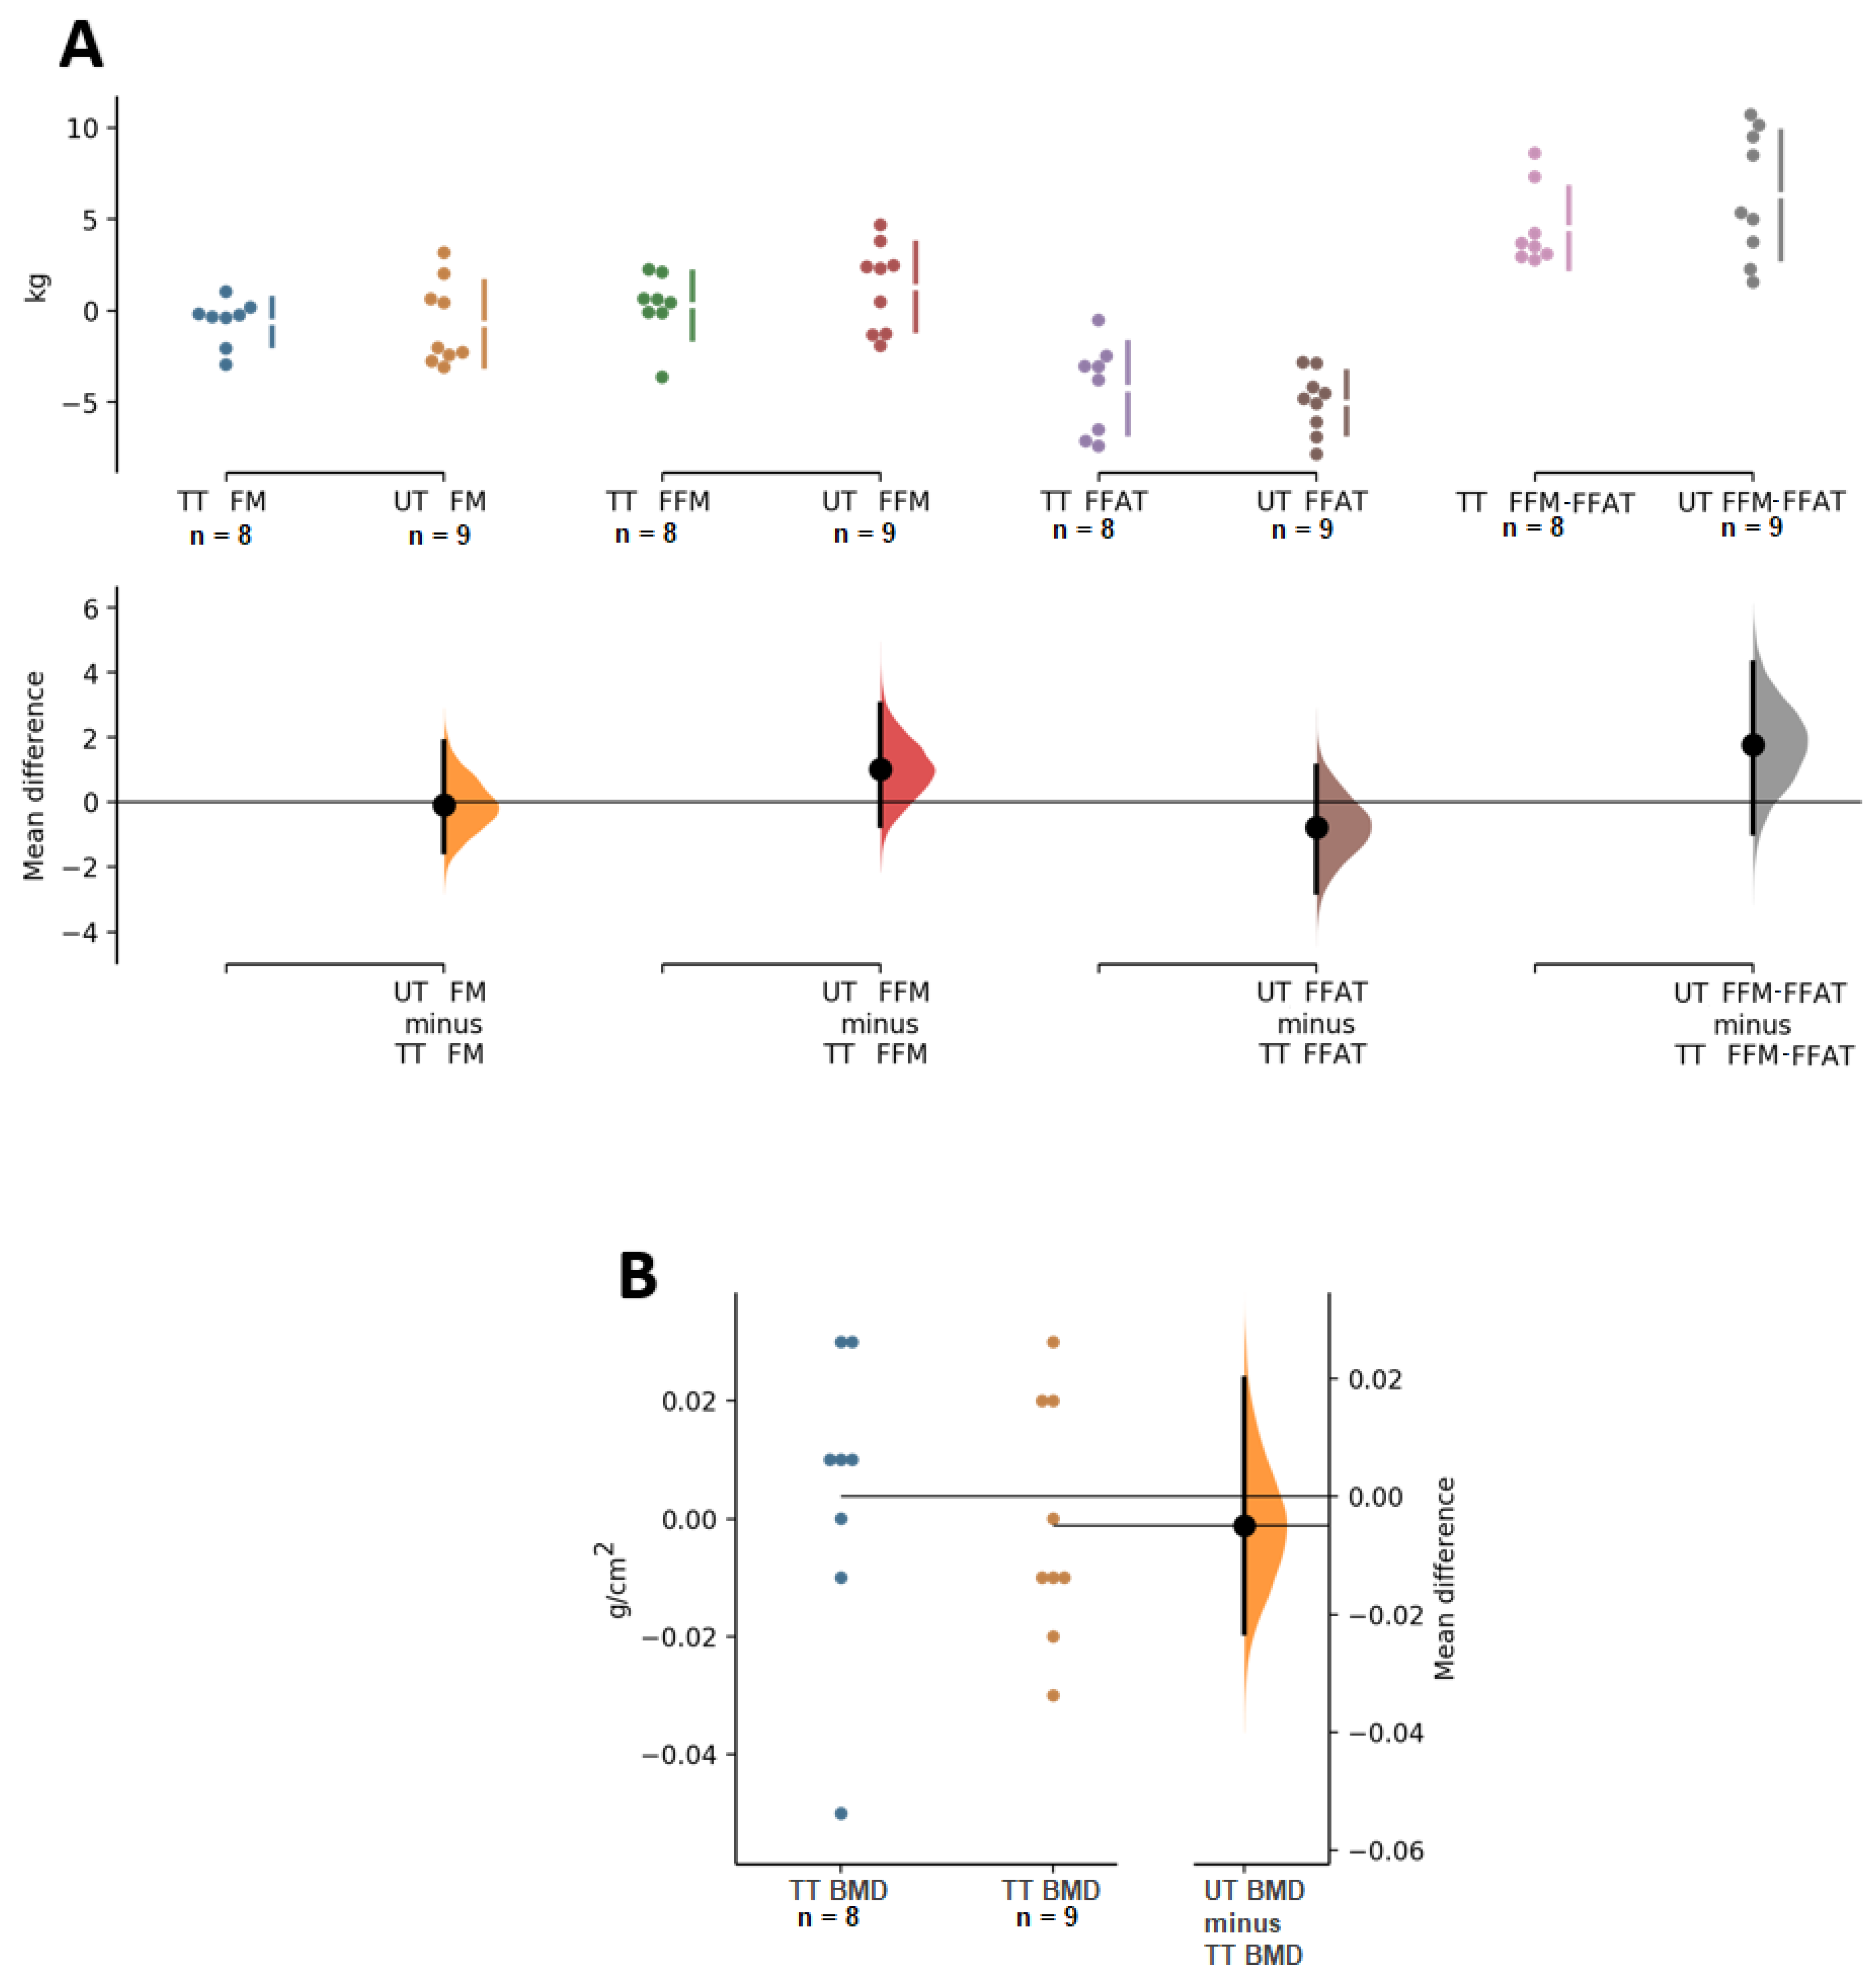
3.2. Body Composition
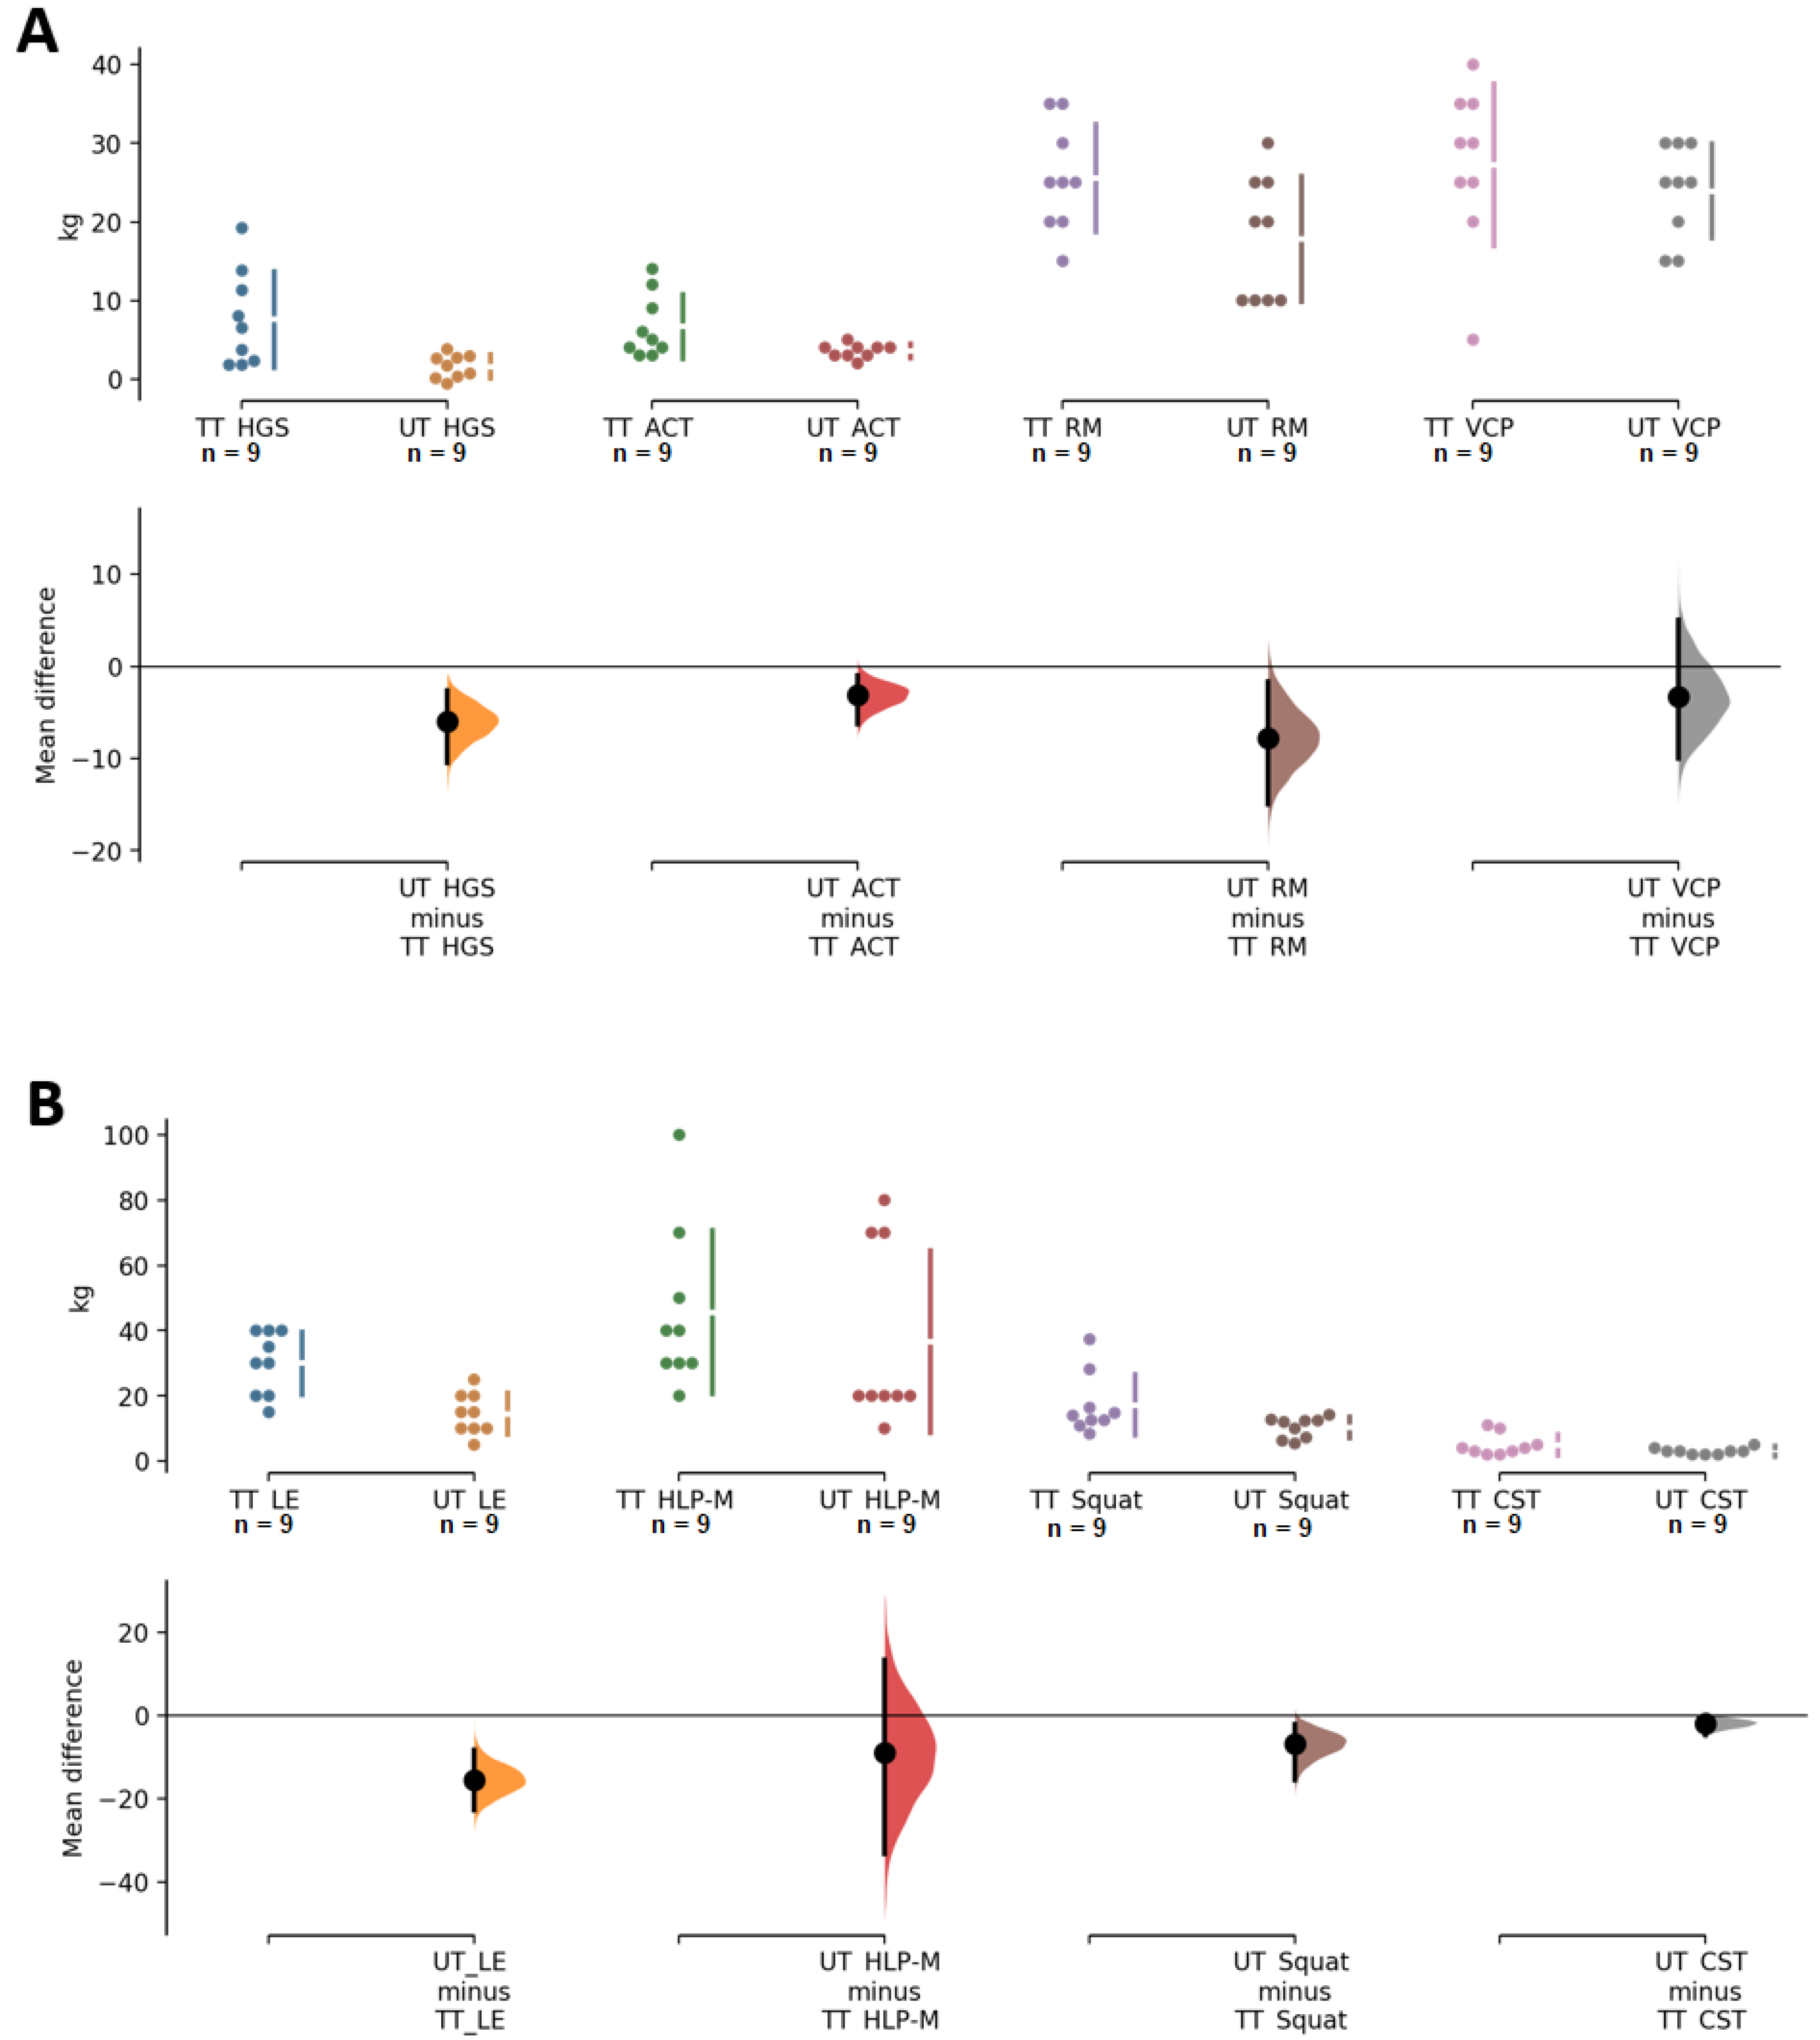
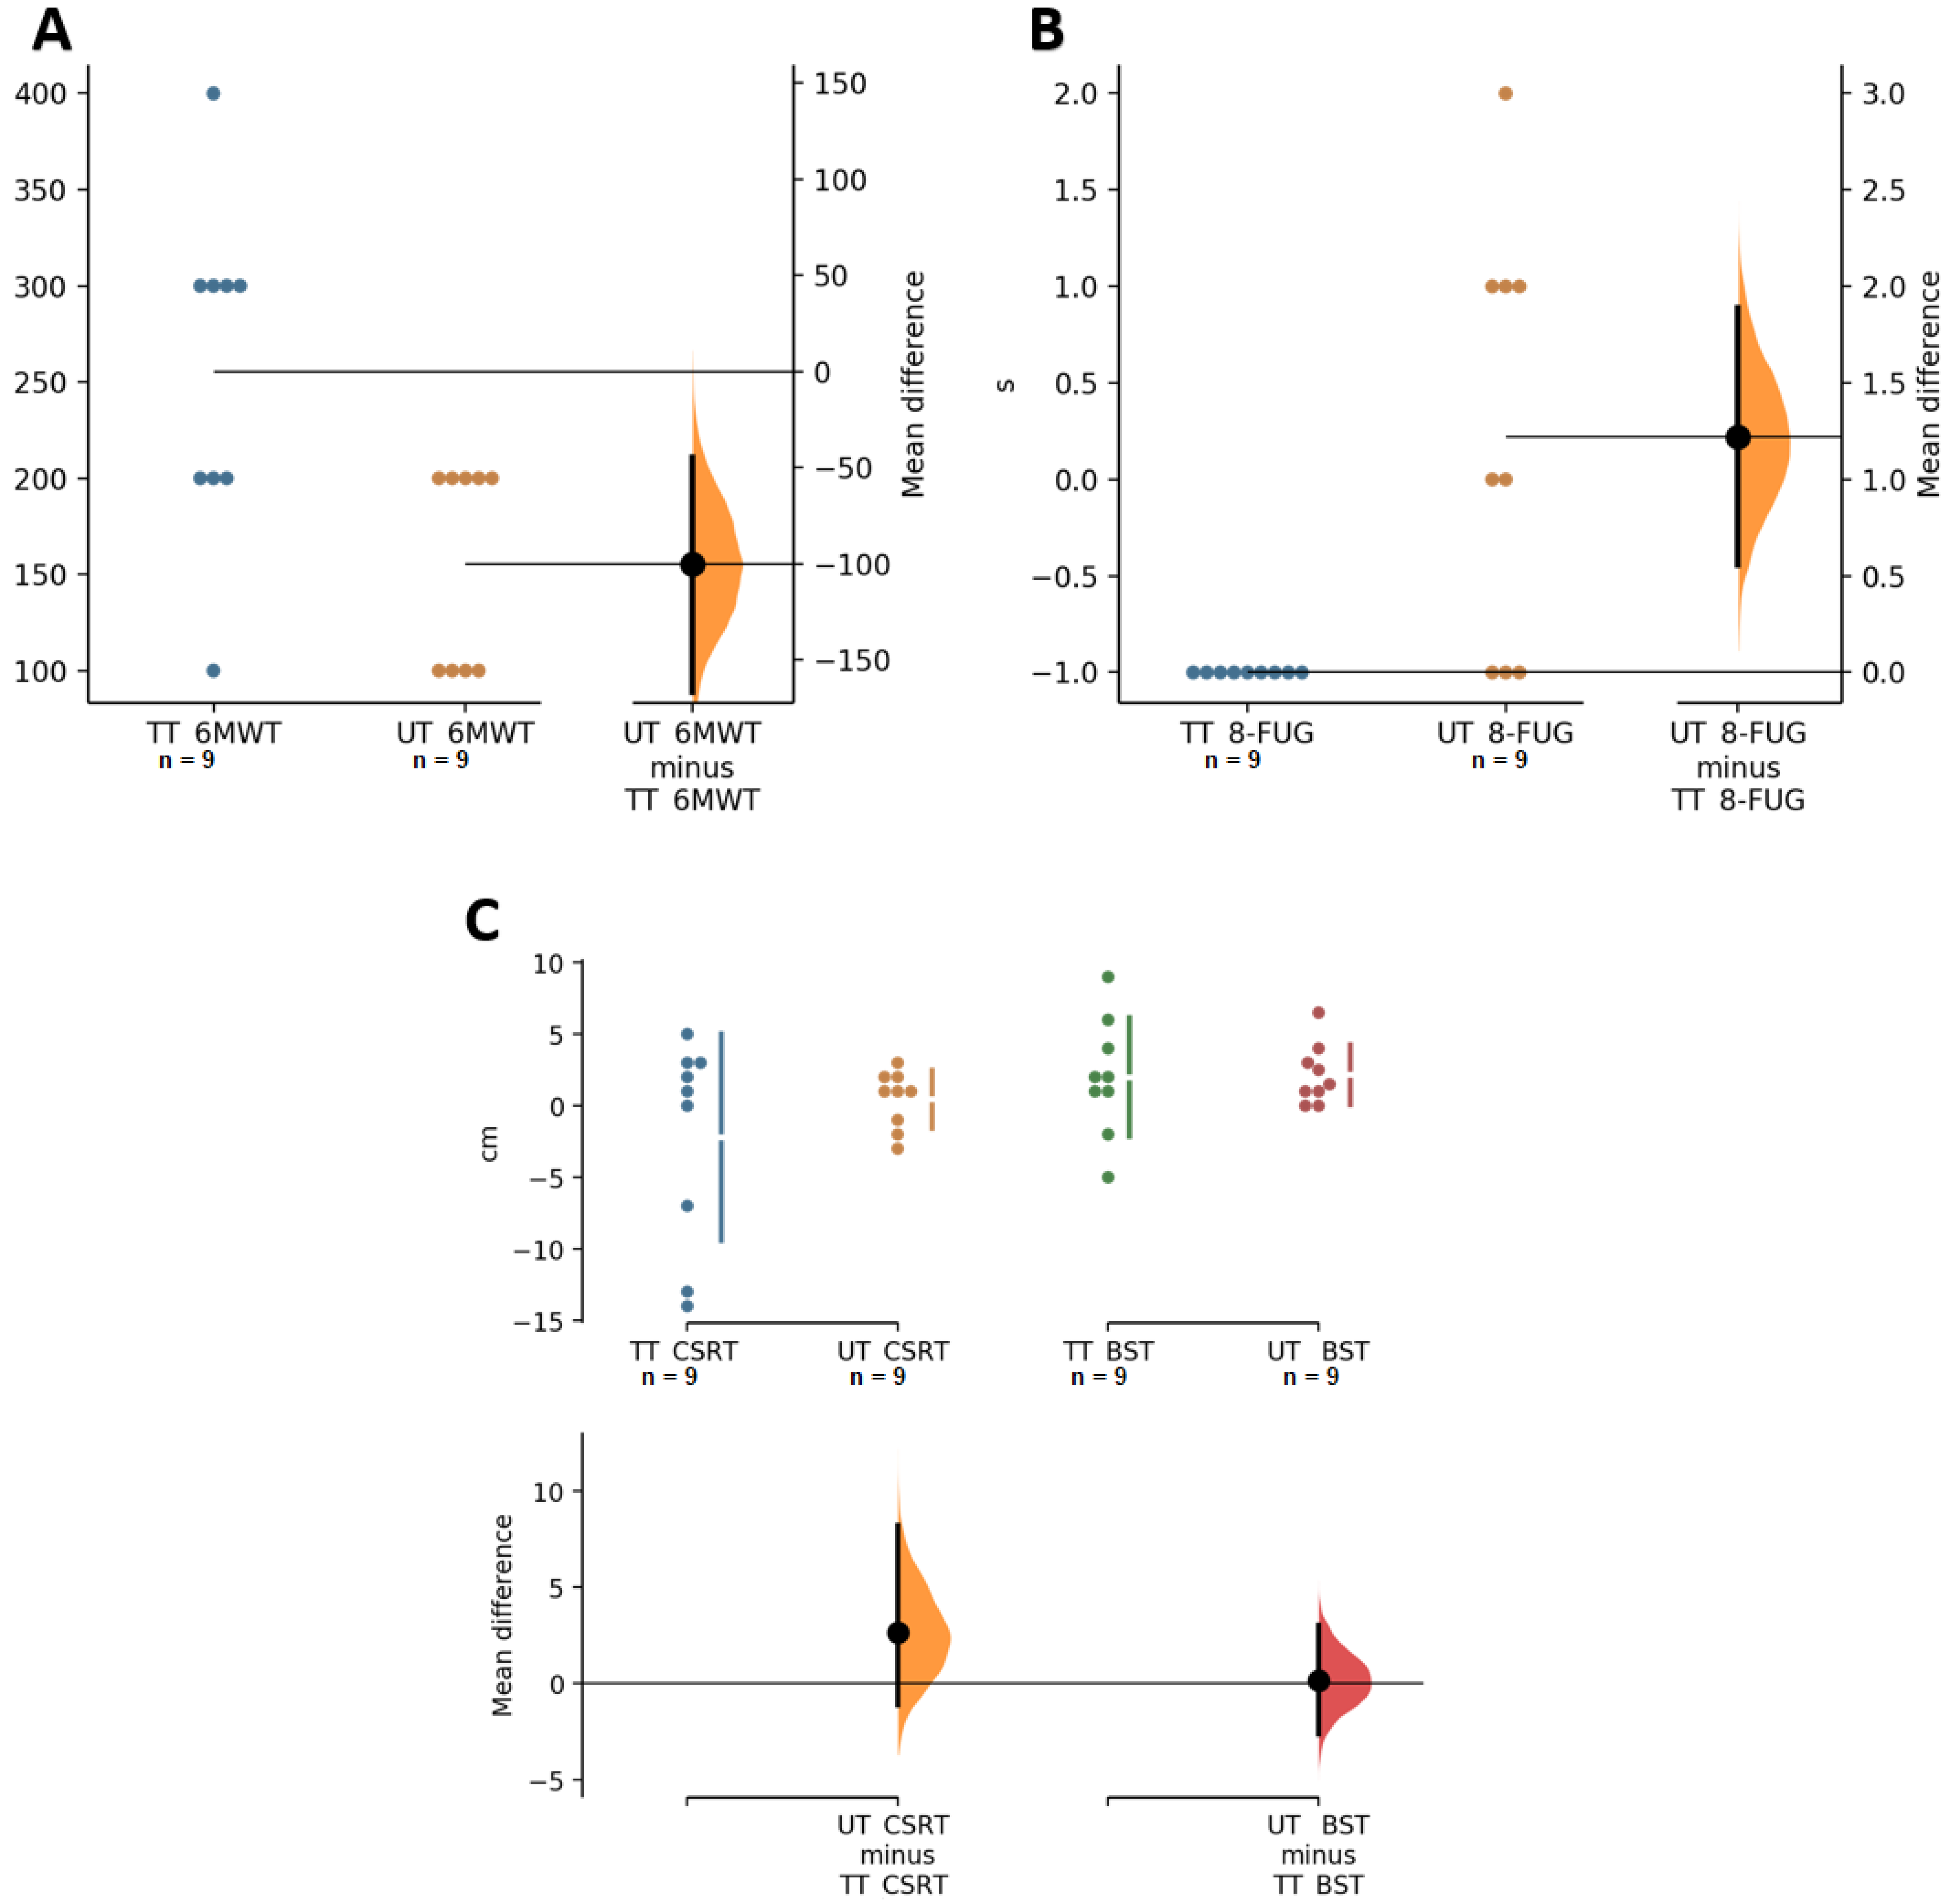
3.3. Functional Capacity
4. Discussion
5. Conclusions
6. Practical Application
Author Contributions
Funding
Institutional Review Board Statement
Informed Consent Statement
Data Availability Statement
Acknowledgments
Conflicts of Interest
References
- Newman, A.B.; Lee, J.S.; Visser, M.; Goodpaster, B.H.; Kritchevsky, S.B.; Tylavsky, F.A.; Nevitt, M.; Harris, T.B. Weight change and the conservation of lean mass in old age: The Health, Aging and Body Composition Study. Am. J. Clin. Nutr. 2005, 82, 872–878. [Google Scholar] [CrossRef] [PubMed]
- Kallman, D.A.; Plato, C.C.; Tobin, J.D. The role of muscle loss in the age-related decline of grip strength: Cross-sectional and longitudinal perspectives. J. Gerontol. 1990, 45, M82–M88. [Google Scholar] [CrossRef] [PubMed]
- Gallagher, D.; Ruts, E.; Visser, M.; Heshka, S.; Baumgartner, R.N.; Wang, J.; Pierson, R.N.; Pi-Sunyer, F.X.; Heymsfield, S.B. Weight stability masks sarcopenia in elderly men and women. Am. J. Physiol. Endocrinol. Metab. 2000, 279, E366–E375. [Google Scholar] [CrossRef] [PubMed]
- Cannataro, R.; Carbone, L.; Petro, J.L.; Cione, E.; Vargas, S.; Angulo, H.; Forero, D.A.; Odriozola-Martínez, A.; Kreider, R.B.; Bonilla, D.A. Sarcopenia: Etiology, Nutritional Approaches, and miRNAs. Int. J. Mol. Sci. 2021, 22, 9724. [Google Scholar] [CrossRef]
- Fiatarone, M.A.; Marks, E.C.; Ryan, N.D.; Meredith, C.N.; Lipsitz, L.A.; Evans, W.J. High-intensity strength training in nonagenarians. Effects on skeletal muscle. JAMA 1990, 263, 3029–3034. [Google Scholar] [CrossRef]
- Tinetti, M.E. Prevention of falls and fall injuries in elderly persons: A research agenda. Prev. Med. 1994, 23, 756–762. [Google Scholar] [CrossRef]
- Hunter, G.R.; McCarthy, J.P.; Bamman, M.M. Effects of resistance training on older adults. Sports Med. 2004, 34, 329–348. [Google Scholar] [CrossRef]
- Latham, N.K.; Bennett, D.A.; Stretton, C.M.; Anderson, C.S. Systematic review of progressive resistance strength training in older adults. J. Gerontol. A Biol. Sci. Med. Sci. 2004, 59, 48–61. [Google Scholar] [CrossRef]
- Joshua, A.M.; D’Souza, V.; Unnikrishnan, B.; Mithra, P.; Kamath, A.; Acharya, V.; Venugopal, A. Effectiveness of progressive resistance strength training versus traditional balance exercise in improving balance among the elderly—A randomised controlled trial. J. Clin. Diagn. Res. 2014, 8, 98–102. [Google Scholar] [CrossRef]
- Bento, P.C.; Pereira, G.; Ugrinowitsch, C.; Rodacki, A.L. Peak torque and rate of torque development in elderly with and without fall history. Clin. Biomech. 2010, 25, 450–454. [Google Scholar] [CrossRef]
- Frontera, W.R.; Meredith, C.N.; O’Reilly, K.P.; Knuttgen, H.G.; Evans, W.J. Strength conditioning in older men: Skeletal muscle hypertrophy and improved function. J. Appl. Physiol. 1988, 64, 1038–1044. [Google Scholar] [CrossRef]
- Straight, C.R.; Lindheimer, J.B.; Brady, A.O.; Dishman, R.K.; Evans, E.M. Effects of Resistance Training on Lower-Extremity Muscle Power in Middle-Aged and Older Adults: A Systematic Review and Meta-Analysis of Randomized Controlled Trials. Sports Med. 2016, 46, 353–364. [Google Scholar] [CrossRef]
- Alcazar, J.; Rodriguez-Lopez, C.; Ara, I.; Alfaro-Acha, A.; Rodriguez-Gomez, I.; Navarro-Cruz, R.; Losa-Reyna, J.; Garcia-Garcia, F.J.; Alegre, L.M. Force-velocity profiling in older adults: An adequate tool for the management of functional trajectories with aging. Exp. Gerontol. 2018, 108, 1–6. [Google Scholar] [CrossRef]
- Martinikorena, I.; Martinez-Ramirez, A.; Gomez, M.; Lecumberri, P.; Casas-Herrero, A.; Cadore, E.L.; Millor, N.; Zambom-Ferraresi, F.; Idoate, F.; Izquierdo, M. Gait Variability Related to Muscle Quality and Muscle Power Output in Frail Nonagenarian Older Adults. J. Am. Med. Dir. Assoc. 2016, 17, 162–167. [Google Scholar] [CrossRef]
- Aagaard, P.; Suetta, C.; Caserotti, P.; Magnusson, S.P.; Kjaer, M. Role of the nervous system in sarcopenia and muscle atrophy with aging: Strength training as a countermeasure. Scand. J. Med. Sci. Sports 2010, 20, 49–64. [Google Scholar] [CrossRef]
- Fragala, M.S.; Cadore, E.L.; Dorgo, S.; Izquierdo, M.; Kraemer, W.J.; Peterson, M.D.; Ryan, E.D. Resistance Training for Older Adults: Position Statement From the National Strength and Conditioning Association. J. Strength Cond. Res. 2019, 33, 2019–2052. [Google Scholar] [CrossRef]
- Bottaro, M.; Machado, S.N.; Nogueira, W.; Scales, R.; Veloso, J. Effect of high versus low-velocity resistance training on muscular fitness and functional performance in older men. Eur. J. Appl. Physiol. 2007, 99, 257–264. [Google Scholar] [CrossRef]
- Ramirez-Campillo, R.; Castillo, A.; de la Fuente, C.I.; Campos-Jara, C.; Andrade, D.C.; Alvarez, C.; Martinez, C.; Castro-Sepulveda, M.; Pereira, A.; Marques, M.C.; et al. High-speed resistance training is more effective than low-speed resistance training to increase functional capacity and muscle performance in older women. Exp. Gerontol. 2014, 58, 51–57. [Google Scholar] [CrossRef]
- Radaelli, R.; Brusco, C.M.; Lopez, P.; Rech, A.; Machado, C.L.F.; Grazioli, R.; Muller, D.C.; Cadore, E.L.; Pinto, R.S. Higher muscle power training volume is not determinant for the magnitude of neuromuscular improvements in elderly women. Exp. Gerontol. 2018, 110, 15–22. [Google Scholar] [CrossRef]
- Poliquin, C. ive ways to increase the effectiveness of your strength training program. Natl. Strength Cond. Assoc. 1988, 10, 34–39. [Google Scholar] [CrossRef]
- Harries, S.K.; Lubans, D.R.; Callister, R. Comparison of resistance training progression models on maximal strength in sub-elite adolescent rugby union players. J. Sci. Med. Sport 2016, 19, 163–169. [Google Scholar] [CrossRef]
- Buskard, A.; Zalma, B.; Cherup, N.; Armitage, C.; Dent, C.; Signorile, J.F. Effects of linear periodization versus daily undulating periodization on neuromuscular performance and activities of daily living in an elderly population. Exp. Gerontol. 2018, 113, 199–208. [Google Scholar] [CrossRef]
- WMO. World medical association declaration of Helsinki: Ethical principles for medical research involving human subjects. JAMA 2013, 310, 2191–2194. [Google Scholar] [CrossRef]
- Heymsfield, S.B.; Gallagher, D.; Kotler, D.P.; Wang, Z.; Allison, D.B.; Heshka, S. Body-size dependence of resting energy expenditure can be attributed to nonenergetic homogeneity of fat-free mass. Am. J. Physiol. Endocrinol. Metab. 2002, 282, E132–E138. [Google Scholar] [CrossRef]
- Bonilla, D.A.; Kreider, R.B.; Petro, J.L.; Romance, R.; Garcia-Sillero, M.; Benitez-Porres, J.; Vargas-Molina, S. Creatine Enhances the Effects of Cluster-Set Resistance Training on Lower-Limb Body Composition and Strength in Resistance-Trained Men: A Pilot Study. Nutrients 2021, 13, 2303. [Google Scholar] [CrossRef]
- Fess, E.; Moran, C. Grip Strength. In Recommendations; American Society of Hand Therapists: Indianapolis, Indiana, 1981. [Google Scholar]
- Jones, J.; Rikli, R. Measuring Functional Fitness in Older Adults. J. Act. Ageing 2002, 1, 24–30. [Google Scholar]
- Ho, J.; Tumkaya, T.; Aryal, S.; Choi, H.; Claridge-Chang, A. Moving beyond P values: Data analysis with estimation graphics. Nat. Methods 2019, 16, 565–566. [Google Scholar] [CrossRef] [PubMed]
- Team, R.C. R: A Language and Environment for Statistical Computing [Computer Software]. Available online: https://www.R-project.org/ (accessed on 31 October 2021).
- Joseph, L.J.; Davey, S.L.; Evans, W.J.; Campbell, W.W. Differential effect of resistance training on the body composition and lipoprotein-lipid profile in older men and women. Metabolism 1999, 48, 1474–1480. [Google Scholar] [CrossRef]
- Lemmer, J.T.; Hurlbut, D.E.; Martel, G.F.; Tracy, B.L.; Ivey, F.M.; Metter, E.J.; Fozard, J.L.; Fleg, J.L.; Hurley, B.F. Age and gender responses to strength training and detraining. Med. Sci. Sports Exerc. 2000, 32, 1505–1512. [Google Scholar] [CrossRef] [PubMed]
- Lemmer, J.T.; Ivey, F.M.; Ryan, A.S.; Martel, G.F.; Hurlbut, D.E.; Metter, J.E.; Fozard, J.L.; Fleg, J.L.; Hurley, B.F. Effect of strength training on resting metabolic rate and physical activity: Age and gender comparisons. Med. Sci. Sports Exerc. 2001, 33, 532–541. [Google Scholar] [CrossRef] [PubMed]
- Martel, G.F.; Hurlbut, D.E.; Lott, M.E.; Lemmer, J.T.; Ivey, F.M.; Roth, S.M.; Rogers, M.A.; Fleg, J.L.; Hurley, B.F. Strength training normalizes resting blood pressure in 65- to 73-year-old men and women with high normal blood pressure. J. Am. Geriatr. Soc. 1999, 47, 1215–1221. [Google Scholar] [CrossRef]
- Hurlbut, D.E.; Lott, M.E.; Ryan, A.S.; Ferrell, R.E.; Roth, S.M.; Ivey, F.M.; Martel, G.F.; Lemmer, J.T.; Fleg, J.L.; Hurley, B.F. Does age, sex, or ACE genotype affect glucose and insulin responses to strength training? J. Appl. Physiol. 2002, 92, 643–650. [Google Scholar] [CrossRef][Green Version]
- Ryan, A.S.; Ivey, F.M.; Hurlbut, D.E.; Martel, G.F.; Lemmer, J.T.; Sorkin, J.D.; Metter, E.J.; Fleg, J.L.; Hurley, B.F. Regional bone mineral density after resistive training in young and older men and women. Scand. J. Med. Sci. Sports 2004, 14, 16–23. [Google Scholar] [CrossRef]
- Abe, T.; Loenneke, J.P.; Thiebaud, R.S.; Fujita, E.; Akamine, T. The impact of DXA-derived fat-free adipose tissue on the prevalence of low muscle mass in older adults. Eur. J. Clin. Nutr. 2018, 73, 757–762. [Google Scholar] [CrossRef]
- Abe, T.; Dankel, S.J.; Loenneke, J.P. Body Fat Loss Automatically Reduces Lean Mass by Changing the Fat-Free Component of Adipose Tissue. Obesity 2019, 27, 357–358. [Google Scholar] [CrossRef]
- McCartney, N.; Hicks, A.L.; Martin, J.; Webber, C.E. Long-term resistance training in the elderly: Effects on dynamic strength, exercise capacity, muscle, and bone. J. Gerontol. A Biol. Sci. Med. Sci. 1995, 50, B97–B104. [Google Scholar] [CrossRef]
- Tracy, B.L.; Ivey, F.M.; Hurlbut, D.; Martel, G.F.; Lemmer, J.T.; Siegel, E.L.; Metter, E.J.; Fozard, J.L.; Fleg, J.L.; Hurley, B.F. Muscle quality. II. Effects Of strength training in 65- to 75-yr-old men and women. J. Appl. Physiol. 1999, 86, 195–201. [Google Scholar] [CrossRef]
- Hakkinen, K.; Kallinen, M.; Linnamo, V.; Pastinen, U.M.; Newton, R.U.; Kraemer, W.J. Neuromuscular adaptations during bilateral versus unilateral strength training in middle-aged and elderly men and women. Acta Physiol. Scand. 1996, 158, 77–88. [Google Scholar] [CrossRef]
- Hakkinen, K.; Kraemer, W.J.; Pakarinen, A.; Triplett-McBride, T.; McBride, J.M.; Hakkinen, A.; Alen, M.; McGuigan, M.R.; Bronks, R.; Newton, R.U. Effects of heavy resistance/power training on maximal strength, muscle morphology, and hormonal response patterns in 60-75-year-old men and women. Can. J. Appl. Physiol. 2002, 27, 213–231. [Google Scholar] [CrossRef]
- Bamman, M.M.; Hill, V.J.; Adams, G.R.; Haddad, F.; Wetzstein, C.J.; Gower, B.A.; Ahmed, A.; Hunter, G.R. Gender differences in resistance-training-induced myofiber hypertrophy among older adults. J. Gerontol. A Biol. Sci. Med. Sci. 2003, 58, 108–116. [Google Scholar] [CrossRef]
- Pyka, G.; Lindenberger, E.; Charette, S.; Marcus, R. Muscle strength and fiber adaptations to a year-long resistance training program in elderly men and women. J. Gerontol. 1994, 49, M22–M27. [Google Scholar] [CrossRef]
- Lexell, J.; Downham, D.Y.; Larsson, Y.; Bruhn, E.; Morsing, B. Heavy-resistance training in older Scandinavian men and women: Short- and long-term effects on arm and leg muscles. Scand. J. Med. Sci. Sports 1995, 5, 329–341. [Google Scholar] [CrossRef]
- Petersen, B.A.; Hastings, B.; Gottschall, J.S. Low load, high repetition resistance training program increases bone mineral density in untrained adults. J. Sports Med. Phys. Fit. 2017, 57, 70–76. [Google Scholar] [CrossRef]
- Crosby, C.A.; Wehbe, M.A.; Mawr, B. Hand strength: Normative values. J. Hand Surg. Am. 1994, 19, 665–670. [Google Scholar] [CrossRef]
- Kraemer, W.J.; Hakkinen, K.; Newton, R.U.; Nindl, B.C.; Volek, J.S.; McCormick, M.; Gotshalk, L.A.; Gordon, S.E.; Fleck, S.J.; Campbell, W.W.; et al. Effects of heavy-resistance training on hormonal response patterns in younger vs. older men. J. Appl. Physiol. 1999, 87, 982–992. [Google Scholar] [CrossRef]
- Prestes, J.; da Cunha Nascimento, D.; Tibana, R.A.; Teixeira, T.G.; Vieira, D.C.; Tajra, V.; de Farias, D.L.; Silva, A.O.; Funghetto, S.S.; de Souza, V.C.; et al. Understanding the individual responsiveness to resistance training periodization. Age 2015, 37, 9793. [Google Scholar] [CrossRef]


| Variables | TT (n = 9) | UT (n = 9) | p-Level |
|---|---|---|---|
| Age (years) | 64.3 ± 2.1 | 63.7 ± 2.1 | 0.514 |
| Stature (cm) | 165.4 ± 7.9 | 164.9 ± 7.5 | 0.890 |
| BM (kg) | 70.2 ± 9.5 | 72.4 ± 12.1 | 0.681 |
| BMI (kg·m−2) | 25.7 ± 1.8 | 26.6 ± 3.9 | 0.570 |
| FM (kg) | 21.6 ± 3.5 | 22.3 ± 5.1 | 0.724 |
| FFM (kg) | 48.6 ± 9.8 | 50.1 ± 9.4 | 0.762 |
| FFAT (kg) | 7.9 ± 2.3 | 8.8 ± 1.7 | 0.359 |
| FFM-FFAT (kg) | 40.7 ± 8.6 | 41.2 ± 7.8 | 0.893 |
| BMD (g·cm−2) | 1.1 ± 0.1 | 1.1 ± 0.1 | 0.576 |
| HGS (kg) | 66.7 ± 17.6 | 66.3 ± 18.4 | 0.961 |
| ACT (kg) | 21.3 ± 3.9 | 17.2 ± 2.0 | 0.017 |
| RM (kg) | 56.7 ± 16.6 | 48.3 ± 12.2 | 0.243 |
| VCP (kg) | 38.9 ± 20.1 | 32.8 ± 15.0 | 0.476 |
| LE (kg) | 62.2 ± 19.4 | 62.2 ± 23.2 | 1.000 |
| HLP-M (kg) | 71.1 ± 36.6 | 83.3 ± 27.8 | 0.437 |
| Squat (kg) | 60.9 ± 24.4 | 60.1 ± 24.7 | 0.947 |
| CST (kg) | 13.3 ± 2.3 | 13.6 ± 1.4 | 0.808 |
| CSRT (kg) | −2.6 ± 9.4 | −3.6 ± 6.3 | 0.795 |
| BST (cm) | 10.8 ± 9.1 | 11.2 ± 9.1 | 0.919 |
| 6 MWT (m) | 533.3 ± 50.0 | 477.8 ± 44.1 | 0.024 |
| 8-FUG | 6.4 ± 1.2 | 6.2 ± 1.1 | 0.692 |
| TT | TU | Between-Group Difference | ||||||
|---|---|---|---|---|---|---|---|---|
| Δ ± SD (95% CI) | p | ES | Δ ± SD (95% CI) | p | ES | TT − TU | p | |
| FM (kg) | −0.6 ± 1.3 (−1.7–0.4) | 0.212 | −0.2 | −0.7 ± 2.3 (−2.5–1.1) | 0.389 | −0.1 | 0.1 (−1.9–2.0) | 0.928 |
| FFM (kg) | 0.3 ± 1.8 (−1.2–1.8) | 0.679 | 0.0 | 1.3 ± 2.4 (−0.5–3.1) | 0.145 | 0.1 | −1.0 (−3.2–1.2) | 0.346 |
| FFAT (kg) | −4.2 ± 2.5 (−6.3–−2.2) | 0.002 | −2.5 | −5.0 ± 1.7 (−6.3–−3.7) | <0.01 | −3.5 | 0.8 (−1.4–3.0) | 0.459 |
| FFM-FFAT (kg) | 4.5 ± 2.2 (2.7–6.4) | 0.012 | 0.5 | 6.3 ± 3.5 (3.6–9.0) | 0.001 | 0.7 | −1.8 (−4.9–1.3) | 0.232 |
| BMD (g·cm2) | 0.00 ± 0.03 (−0.02–0.02) | 0.745 | 0.0 | 0.00 ± 0.02 (−0.02–0.01) | 0.844 | 0.0 | 0.00 (−0.02–0.03) | 0.697 |
| HGS (kg) | 7.6 ± 6.1 (2.9–12.3) | 0.006 | 0.4 | 1.6 ± 1.5 (0.4–2.7) | 0.014 | 0.1 | 6.0 (1.6–10.5) | 0.011 |
| ACT (kg) | 6.7 ± 4.1 (3.5–9.8) | 0.001 | 1.1 | 3.6 ± 0.9 (2.9–4.2) | <0.01 | 1.6 | 3.1 (0.2–6.0) | 0.056 |
| RM (kg) | 25.6 ± 6.8 (20.3–30.8) | <0.01 | 1.3 | 17.8 ± 7.9 (11.7–23.9) | <0.01 | 1.1 | 7.8 (0.4–15.2) | 0.041 |
| VCP (kg) | 27.2 ± 10.3 (19.3–35.2) | <0.01 | 1.3 | 23.9 ± 6.0 (19.3–28.5) | <0.01 | 1.5 | 3.3 (−5.1–11.8) | 0.415 |
| LE (kg) | 30.0 ± 9.7 (22.6–37.4) | <0.01 | 1.2 | 14.4 ± 6.3 (9.6–19.3) | <0.01 | 0.5 | 15.6 (7.4–23.7) | 0.001 |
| HLP-M (kg) | 45.6 ± 25.1 (26.3–64.8) | 0.001 | 1.0 | 36.7 ± 27.8 (15.3–58.1) | 0.007 | 1.5 | 8.9 (−17.6–35.4) | 0.487 |
| Squat (kg) | 17.2 ± 9.4 (10.0–24.4) | 0.008 | 0.6 | 10.3 ± 3.2 (7.8–12.7) | <0.01 | 0.4 | 6.9 (−0.1–13.9) | 0.053 |
| CST (kg) | 4.9 ± 3.3 (2.3–7.5) | 0.008 | 1.3 | 3.0 ± 1.0 (2.2–3.8) | <0.01 | 1.8 | 1.9 (−0.6–4.3) | 0.202 |
| CSRT (kg) | −2.2 ± 7.2 (−7.8–3.3) | 0.674 | −0.3 | 0.4 ± 2.0 (−1.1–2.0) | 0.525 | 0.1 | −2.7 (−8.0–2.6) | 0.302 |
| BST (cm) | 2.0 ± 4.1 (−1.2–5.2) | 0.171 | 0.25 | 2.0 ± 2.0 (0.5–3.5) | 0.017 | 0.20 | 0.0 (−3.2–3.2) | 1.00 |
| 6 MWT (m) | 255.6 ± 88.2 (187.8–323.3) | <0.01 | 2.7 | 155.6 ± 52.7 (115.0–196.1) | 0.006 | 2.2 | 100.0 (27.4–172.6) | 0.010 |
| 8-FUG | −1.0 ± 0.0 (−1.0–−1.0) | 0.003 | −0.8 | 0.2 ± 1.1 (−0.6–1.1) | 0.559 | 0.2 | −1.2 (−2.0–−0.4) | 0.004 |
Publisher’s Note: MDPI stays neutral with regard to jurisdictional claims in published maps and institutional affiliations. |
© 2022 by the authors. Licensee MDPI, Basel, Switzerland. This article is an open access article distributed under the terms and conditions of the Creative Commons Attribution (CC BY) license (https://creativecommons.org/licenses/by/4.0/).
Share and Cite
Vargas-Molina, S.; García-Sillero, M.; Romance, R.; Petro, J.L.; Jiménez-García, J.D.; Bonilla, D.A.; Kreider, R.B.; Benítez-Porres, J. Traditional and Undulating Periodization on Body Composition, Strength Levels and Physical Fitness in Older Adults. Int. J. Environ. Res. Public Health 2022, 19, 4522. https://doi.org/10.3390/ijerph19084522
Vargas-Molina S, García-Sillero M, Romance R, Petro JL, Jiménez-García JD, Bonilla DA, Kreider RB, Benítez-Porres J. Traditional and Undulating Periodization on Body Composition, Strength Levels and Physical Fitness in Older Adults. International Journal of Environmental Research and Public Health. 2022; 19(8):4522. https://doi.org/10.3390/ijerph19084522
Chicago/Turabian StyleVargas-Molina, Salvador, Manuel García-Sillero, Ramón Romance, Jorge L. Petro, José Daniel Jiménez-García, Diego A. Bonilla, Richard B. Kreider, and Javier Benítez-Porres. 2022. "Traditional and Undulating Periodization on Body Composition, Strength Levels and Physical Fitness in Older Adults" International Journal of Environmental Research and Public Health 19, no. 8: 4522. https://doi.org/10.3390/ijerph19084522
APA StyleVargas-Molina, S., García-Sillero, M., Romance, R., Petro, J. L., Jiménez-García, J. D., Bonilla, D. A., Kreider, R. B., & Benítez-Porres, J. (2022). Traditional and Undulating Periodization on Body Composition, Strength Levels and Physical Fitness in Older Adults. International Journal of Environmental Research and Public Health, 19(8), 4522. https://doi.org/10.3390/ijerph19084522