
The Effect of Neighborhood Deprivation on Mortality in Newly Diagnosed Diabetes Patients: A Countrywide Population-Based Korean Retrospective Cohort Study, 2002–2013


Abstract
:1. Introduction
2. Methods
2.1. Data Source
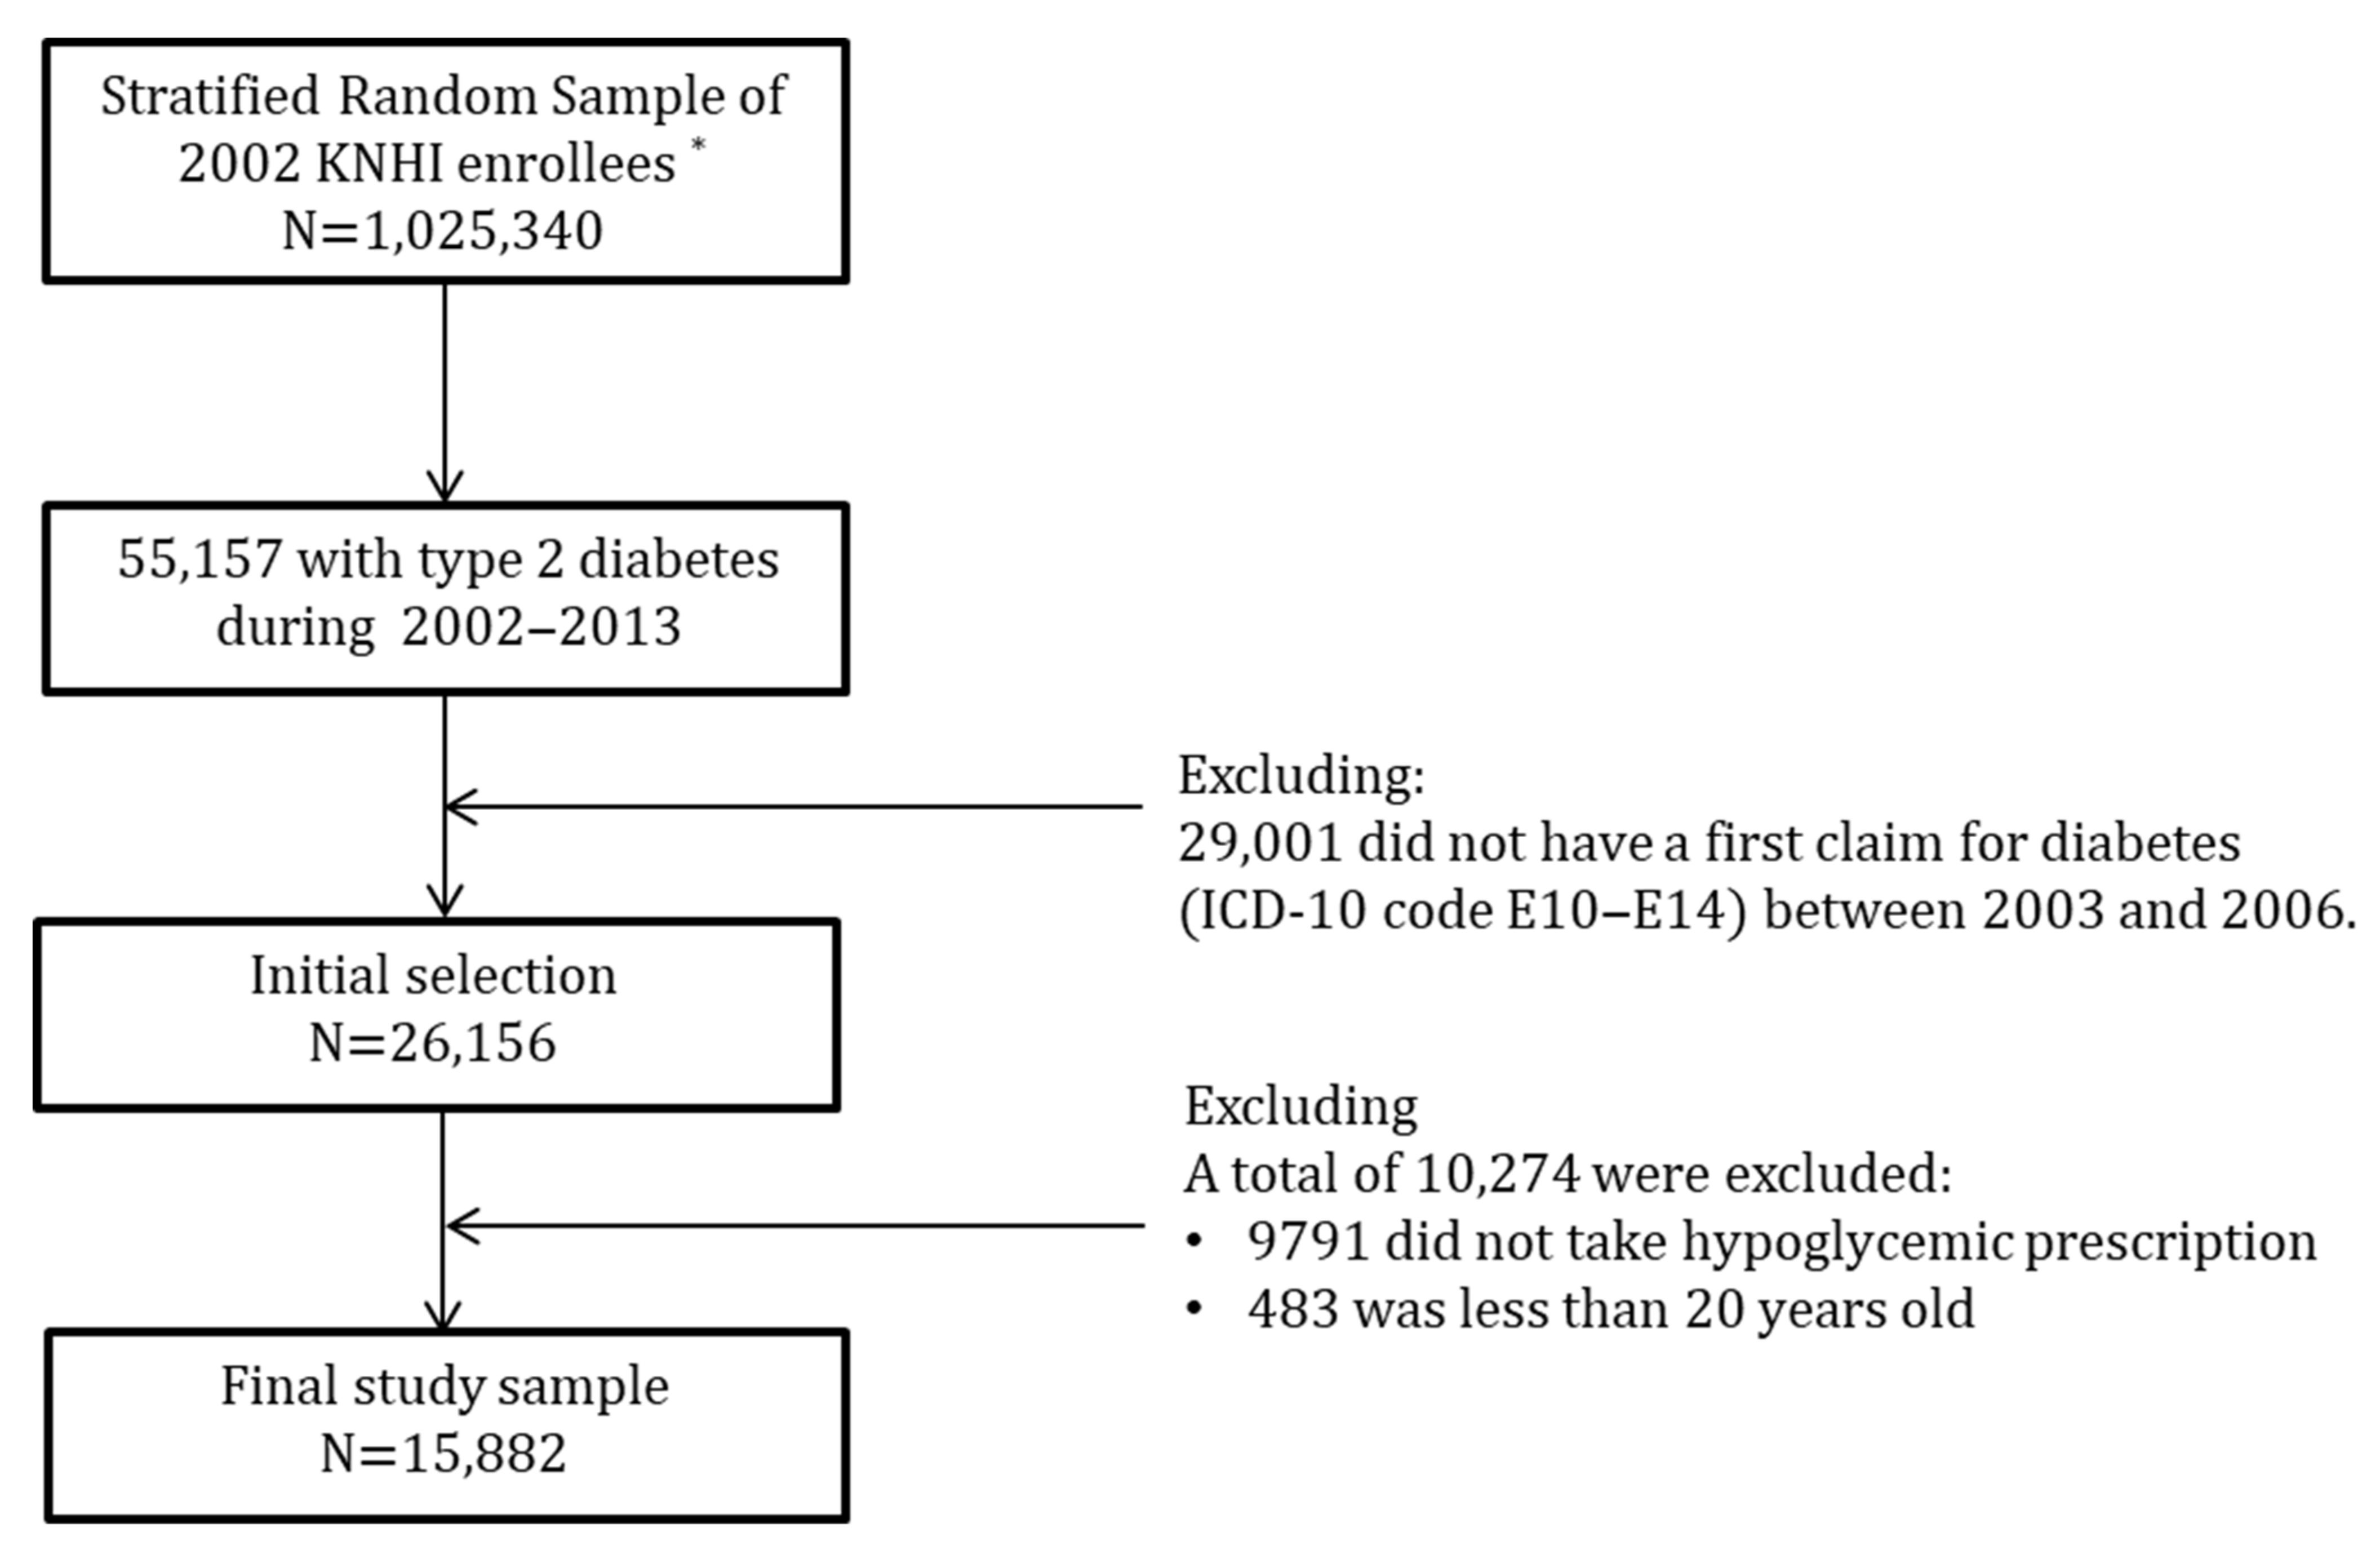
2.2. Study Sample
2.3. Dependent Variable
2.4. Individual Socioeconomic Status
2.5. Neighborhood Deprivation Index
2.6. Covariates
2.7. Statistical Analysis
3. Results
4. Discussion
5. Conclusions
Author Contributions
Funding
Institutional Review Board Statement
Informed Consent Statement
Data Availability Statement
Conflicts of Interest
References
- Statistics on Cause of Death in 2020. Statistics Korea. Available online: https://kostat.go.kr/portal/korea/kor_nw/1/6/2/index.board (accessed on 17 March 2022).
- Viigimaa, M.; Sachinidis, A.; Toumpourleka, M.; Koutsampasopoulos, K.; Alliksoo, S.; Titma, T. Macrovascular Complications of Type 2 Diabetes Mellitus. Curr. Vasc. Pharmacol. 2020, 18, 110–116. [Google Scholar] [CrossRef]
- Giannopoulos, S.; Armstrong, E.J. Diabetes mellitus: An important risk factor for peripheral vascular disease. Expert Rev. Cardiovasc. Ther. 2020, 18, 131–137. [Google Scholar] [CrossRef] [PubMed] [Green Version]
- Jakubiak, G.K.; Pawlas, N.; Cieślar, G.; Stanek, A. Pathogenesis and clinical significance of in-stent restenosis in patients with diabetes. Int. J. Envion. Res. Public Health 2021, 18, 11970. [Google Scholar] [CrossRef]
- Saiki, A.; Otsuki, M.; Tamada, D.; Kitamura, T.; Shimomura, I.; Kurihara, I.; Ichijo, T.; Takeda, Y.; Katabami, T.; Tsuiki, M.; et al. Diabetes mellitus itself increase cardio-cerebrovascular risk and renal complications in primary aldosteronism. J. Clin. Endocrinol. Metab. 2020, 105, 177. [Google Scholar] [CrossRef] [PubMed]
- Demakakos, P.; Marmot, M.; Steptoe, A. Socioeconomic position and the incidence of type 2 diabetes: The ELSA study. Eur. J. Epidemiol. 2012, 27, 367–378. [Google Scholar] [CrossRef] [PubMed]
- Hsu, C.C.; Lee, C.H.; Wahlqvist, M.L.; Huang, H.L.; Chang, H.Y.; Chen, L.; Shih, S.-F.; Shin, S.-J.; Tsai, W.C.; Chen, T.; et al. Poverty increases type 2 diabetes incidence and inequality of care despite universal health coverage. Diabetes Care 2012, 35, 2286–2292. [Google Scholar] [CrossRef] [PubMed] [Green Version]
- Le, C.; Jun, D.; Zhankun, S.; Yichun, L.; Jie, T. Socioeconomic differences in diabetes prevalence, awareness, and treatment in rural southwest China. Trop. Med. Int. Health 2011, 16, 1070–1076. [Google Scholar] [CrossRef]
- Sims, M.; Roux, A.V.D.; Boykin, S.; Sarpong, D.; Gebreab, S.Y.; Wyatt, S.B.; Hickson, D.; Payton, M.; Ekunwe, L.; Taylor, H.A. The Socioeconomic Gradient of Diabetes Prevalence, Awareness, Treatment, and Control Among African Americans in the Jackson Heart Study. Ann. Epidemiol. 2011, 21, 892–898. [Google Scholar] [CrossRef] [Green Version]
- Smith, B.T.; Lynch, J.W.; Fox, C.S.; Harper, S.; Abrahamowicz, M.; Almeida, N.D.; Loucks, E.B. Life-course socioeconomic position and type 2 diabetes mellitus: The Framingham Offspring Study. Am. J. Epidemiol. 2011, 173, 438–447. [Google Scholar] [CrossRef] [Green Version]
- Williams, E.D.; Magliano, D.J.; Zimmet, P.Z.; Kavanagh, A.M.; Stevenson, C.E.; Oldenburg, B.F.; Shaw, J.E. Area-level socioeconomic status and incidence of abnormal glucose metabolism: The Australian Diabetes, Obesity and Lifestyle (AusDiab) study. Diabetes Care 2012, 35, 1455–1461. [Google Scholar] [CrossRef] [Green Version]
- Lee, T.C.; Glynn, R.J.; Peña, J.M.; Paynter, N.P.; Conen, D.; Ridker, P.M.; Pradhan, A.D.; Buring, J.E.; Albert, M.A. Socioeconomic Status and Incident Type 2 Diabetes Mellitus: Data from the Women’s Health Study. PLoS ONE 2011, 6, e27670. [Google Scholar] [CrossRef] [PubMed]
- Pekkanen, J.; Tuomilehto, J.; Uutela, A.; Vartiainen, E.; Nissinen, A. Social class, health behaviour, and mortality among men and women in eastern Finland. BMJ 1995, 311, 589–593. [Google Scholar] [CrossRef] [PubMed] [Green Version]
- Lantz, P.M.; House, J.S.; Lepkowski, J.M.; Williams, D.R.; Mero, R.P.; Chen, J. Socioeconomic factors, health behaviors, and mortality: Results from a nationally representative prospective study of US adults. JAMA 1998, 279, 1703–1708. [Google Scholar] [CrossRef] [PubMed] [Green Version]
- Schrijvers, C.T.; Stronks, K.; Van De Mheen, H.D.; MacKenbach, J.P. Explaining educational differences in mortality: The role of behavioral and material factors. Am. J. Public Health 1999, 89, 535–540. [Google Scholar] [CrossRef] [PubMed] [Green Version]
- Lynch, J.W.; Kaplan, G.A.; Cohen, R.D.; Tuomilehto, J.; Salonen, J.T. Do cardiovascular risk factors explain the relation between socioeconomic status, risk of all-cause mortality, cardiovascular mortality, and acute myocardial infarction? Am. J. Epidemiol. 1996, 144, 934–942. [Google Scholar] [CrossRef] [PubMed]
- Smith, G.D.; Hart, C.; Blane, D.; Gillis, C.; Hawthorne, V. Lifetime socioeconomic position and mortality: Prospective observational study. BMJ 1997, 314, 547. [Google Scholar] [CrossRef] [Green Version]
- Do Socorro Candeira Costa, M.; Dos Santos Figueiredo, F.W. Relationship between income inequality, socioeconomic development, vulnerability index, and maternal mortality in Brazil, 2017. BMC Public Health 2021, 21, 1842. [Google Scholar] [CrossRef]
- Finkelstein, M. Relationship between income and mortality in a Canadian family practice cohort. Can. Fam. Physician 2018, 64, e181–e189. [Google Scholar]
- Landes, S.D. The Association between Education and Mortality for Adults with Intellectual Disability. J. Health Soc. Behav. 2017, 58, 70–85. [Google Scholar] [CrossRef]
- Hahn, R.A.; Truman, B.I. Education Improves Public Health and Promotes Health Equity. Int. J. Health Serv. 2015, 45, 657–678. [Google Scholar] [CrossRef]
- Meyer, O.L.; Castro-Schilo, L.; Aguilar-Gaxiola, S. Determinants of Mental Health and Self-Rated Health: A Model of Socioeconomic Status, Neighborhood Safety, and Physical Activity. Am. J. Public Health 2014, 104, 1734–1741. [Google Scholar] [CrossRef] [PubMed]
- Swope, C.B.; Hernández, D. Housing as a determinant of health equity: A conceptual model. Soc. Sci. Med. 2019, 243, 112571. [Google Scholar] [CrossRef] [PubMed]
- Palumbo, A.J.; Wiebe, D.J.; Kassam-Adams, N.; Richmond, T.S. Neighborhood Environment and Health of Injured Urban Black Men. J. Racial Ethn. Health Disparities 2019, 6, 1068–1077. [Google Scholar] [CrossRef] [PubMed]
- Ryvicker, M.; Sridharan, S. Neighborhood environment and disparities in health care access among urban Medicare beneficiaries with diabetes: A retrospective cohort study. Inquiry 2018, 55, 46958018771414. [Google Scholar] [CrossRef] [Green Version]
- Makenzius, M.; Skoog-Garås, E.; Lindqvist, N.; Forslund, M.; Tegnell, A. Health disparities based on neighborhood and social conditions: Open comparisons-an indicator-based comparative study in Sweden. Public Health 2019, 174, 97–101. [Google Scholar] [CrossRef]
- Dahlgren, G.; Whitehead, M. The Dalhgren-Whitehead model of health determinants. Public Health 2021, 199, 20–24. [Google Scholar] [CrossRef]
- Marmot, M.; Friel, S.; Bell, R.; Houweling, T.A.; Taylor, S. Commission on Social Determinants of health. Closing the gap in a generation: Health equity through action on the social determinants of health. Lancet 2008, 8, 1661–1669. [Google Scholar] [CrossRef]
- Solar, O.; Irwin, A. A Conceptual Framework for Action on the Social Determinants of Health; World Health Organization: Geneva, Switzerland, 2010. [Google Scholar]
- Ramsay, S.E.; Morris, R.W.; Whincup, P.H.; Subramanian, S.V.; Papacosta, A.O.; Lennon, L.T.; Wannamethee, S.G. The influence of neighbourhood-level socioeconomic deprivation on cardiovascular disease mortality in older age: Longitudinal multilevel analyses from a cohort of older British men. J. Epidemiol. Community Health 2015, 69, 1224–1231. [Google Scholar] [CrossRef] [Green Version]
- Bray, B.D.; Paley, L.; Hoffman, A.; James, M.; Gompertz, P.; Wolfe, C.D.A.; Hemingway, H.; Rudd, A.G. Socioeconomic disparities in first stroke incidence, quality of care, and survival: A nationwide registry-based cohort study of 44 million adults in England. Lancet Public Health 2018, 3, e185–e193. [Google Scholar] [CrossRef] [Green Version]
- Okui, T. Socioeconomic Predictors of Diabetes Mortality in Japan: An Ecological Study Using Municipality-specific Data. J. Prev. Med. Public Health 2021, 54, 352–359. [Google Scholar] [CrossRef]
- Aguilar-Palacio, I.; Martinez-Beneito, M.; Rabanaque, M.; Borrell, C.; Cirera, L.; Daponte, A.; Domínguez-Berjón, M.; Gandarillas, A.; Gotsens, M.; Lorenzo-Ruano, P.; et al. Diabetes mellitus mortality in Spanish cities: Trends and geographical inequalities. Prim. Care Diabetes 2017, 11, 453–460. [Google Scholar] [CrossRef] [PubMed]
- Cheng, E.; Soulos, P.R.; Irwin, M.L.; Cespedes Feliciano, E.M.; Presley, C.J.; Fuchs, C.S.; Meyerhardt, J.A.; Gross, C.P. Neighborhood and Individual Socioeconomic Disadvantage and Survival Among Patients With Nonmetastatic Common Cancers. JAMA Netw. Open 2021, 4, e2139593. [Google Scholar] [CrossRef] [PubMed]
- Erskine, S.; Maheswaran, R.; Pearson, T.; Gleeson, D. Socioeconomic deprivation, urban-rural location and alcohol-related mortality in England and Wales. BMC Public Health 2010, 10, 99. [Google Scholar] [CrossRef] [PubMed] [Green Version]
- Yen, I.H.; Kaplan, G.A. Neighborhood Social Environment and Risk of Death: Multilevel Evidence from the Alameda County Study. Am. J. Epidemiol. 1999, 149, 898–907. [Google Scholar] [CrossRef]
- Pampalon, R.; Duncan, C.; Subramanian, S.; Jones, K. Geographies of health perception in Québec: A multilevel perspective. Soc. Sci. Med. 1999, 48, 1483–1490. [Google Scholar] [CrossRef]
- Malmström, M.; Johansson, S.; Sundquist, J. A hierarchical analysis of long-term illness and mortality in socially deprived areas. Soc. Sci. Med. 2001, 53, 265–275. [Google Scholar] [CrossRef]
- Kölegård Stjärne, M.; Diderichsen, F.; Reuterwall, C.; Hallqvist, J.; Sheep Study Group. Socioeconomic context in area of living and risk of myocardial infarction: Results from Stockholm Heart Epidemiology Program (SHEEP). J. Epidemiol. Community Health 2002, 56, 29–35. [Google Scholar] [CrossRef] [Green Version]
- Sloggett, A.; Joshi, H. Higher mortality in deprived areas: Community or personal disadvantage? BMJ 1994, 309, 1470–1474. [Google Scholar] [CrossRef] [Green Version]
- Sturm, R.; Gresenz, C.R. Relations of income inequality and family income to chronic medical conditions and mental health disorders: National survey. BMJ 2002, 324, 20. [Google Scholar] [CrossRef] [Green Version]
- Li, X.; Sundquist, J.; Zöller, B.; Sundquist, K. Neighborhood Deprivation and Lung Cancer Incidence and Mortality: A Multilevel Analysis from Sweden. J. Thorac. Oncol. 2015, 10, 256–263. [Google Scholar] [CrossRef] [Green Version]
- Feinglass, J.; Rydzewski, N.; Yang, A. The socioeconomic gradient in all-cause mortality for women with breast cancer: Findings from the 1998 to 2006 National Cancer Data Base with follow-up through 2011. Ann. Epidemiol. 2015, 25, 549–555. [Google Scholar] [CrossRef]
- Li, X.; Sundquist, J.; Calling, S.; Zöller, B.; Sundquist, K. Neighborhood deprivation and risk of cervical cancer morbidity and mortality: A multilevel analysis from Sweden. Gynecol Oncol. 2012, 127, 283–289. [Google Scholar] [CrossRef] [PubMed] [Green Version]
- Lian, M.; Pérez, M.; Liu, Y.; Schootman, M.; Frisse, A.; Foldes, E.; Jeffe, D. Neighborhood socioeconomic deprivation, tumor subtypes, and causes of death after non-metastatic invasive breast cancer diagnosis: A multilevel competing-risk analysis. Breast Cancer Res. Treat. 2014, 147, 661–670. [Google Scholar] [CrossRef]
- Miki, Y.; Inoue, M.; Ikeda, A.; Sawada, N.; Nakaya, T.; Shimazu, T.; Iwasaki, M.; Yamaji, T.; Sasazuki, S.; Shibuya, K.; et al. Neighborhood Deprivation and Risk of Cancer Incidence, Mortality and Survival: Results from a Population-Based Cohort Study in Japan. PLoS ONE 2014, 9, e106729. [Google Scholar] [CrossRef] [PubMed]
- Consuegra-Sánchez, L.; Melgarejo-Moreno, A.; Galcerá-Tomás, J.; Alonso-Fernández, N.; Díaz-Pastor, Á.; Escudero-García, G.; Jaulent-Huertas, L.; Vicente-Gilabert, M. Educational Level and Long-term Mortality in Patients With Acute Myocardial Infarction. Rev. Española De Cardiol. Engl. Ed. 2015, 68, 935–942. [Google Scholar] [CrossRef]
- Winkleby, M.; Sundquist, K.; Cubbin, C. Inequities in CHD Incidence and Case Fatality by Neighborhood Deprivation. Am. J. Prev. Med. 2007, 32, 97–106. [Google Scholar] [CrossRef] [Green Version]
- Chen, C.-H.; Huang, K.-Y.; Wang, J.-Y.; Huang, H.-B.; Chou, P.; Lee, C.-C. Combined effect of individual and neighbourhood socioeconomic status on mortality of rheumatoid arthritis patients under universal health care coverage system. Fam. Pract. 2014, 32, 41–48. [Google Scholar] [CrossRef] [Green Version]
- McKellar, G.; Morrison, E.; McEntegart, A.; Hampson, R.; Tierney, A.; Mackle, G.; Scoular, J.; Scott, J.A.; Capell, H.A. A pilot study of a Mediterranean-type diet intervention in female patients with rheumatoid arthritis living in areas of social deprivation in Glasgow. Ann. Rheum. Dis. 2007, 66, 1239–1243. [Google Scholar] [CrossRef] [Green Version]
- Ministry of Health and Welfare, Health Insurance Review & Assessment Service. Easy to Understand Medical Aid System. 2017. Available online: https://www.medric.or.kr/ (accessed on 17 March 2022).
- Ministry of Health and Welfare. Disability Rating Criteria 2013. Available online: http://www.mohw.go.kr/ (accessed on 31 March 2022).
- Morgan, O.; Baker, A. Measuring deprivation in England and Wales using 2001 Carstairs scores. Health Stat. Q. 2006, 31, 28–33. [Google Scholar]
- Lee, S.G. The Effect of Neighborhood Socioeconomic Factors on Spatial Mortality and Individual Health Status. Ph.D. Thesis, Yonsei University, Seoul, Korea, 2002. [Google Scholar]
- Ministry of the Interior and Safety. Local Government Administrative Districts and Population Status in 2016. Available online: https://www.mois.go.kr/frt/bbs/type001/commonSelectBoardList.do?bbsId=BBSMSTR_000000000013 (accessed on 28 March 2022).
- Charlson, M.E.; Pompei, P.; Ales, K.L.; MacKenzie, C.R. A new method of classifying prognostic comorbidity in longitudinal studies: Development and validation. J. Chronic Dis. 1987, 40, 373–383. [Google Scholar] [CrossRef]
- Andersen, P.K.; Klein, J.P.; Zhang, M. Testing for centre effects in multi-centre survival studies: A Monte Carlo comparison of fixed and random effects tests. Stat. Med. 1999, 18, 1489–1500. [Google Scholar] [CrossRef]
- Kim, Y.J.; Jeon, J.Y.; Han, S.J.; Kim, H.J.; Lee, K.W.; Kim, D.J. Effect of Socio-Economic Status on the Prevalence of Diabetes. Yonsei Med. J. 2015, 56, 641–647. [Google Scholar] [CrossRef] [PubMed] [Green Version]
- Agardh, E.; Allebeck, P.; Hallqvist, J.; Moradi, T.; Sidorchuk, A. Type 2 diabetes incidence and socio-economic position: A systematic review and meta-analysis. Int. J. Epidemiol. 2011, 40, 804–818. [Google Scholar] [CrossRef] [PubMed] [Green Version]
- Epstein, A.M.; Stern, R.S.; Weissman, J.S. Do the Poor Cost More? A Multihospital Study of Patients’ Socioeconomic Status and Use of Hospital Resources. N. Engl. J. Med 1990, 322, 1122–1128. [Google Scholar] [CrossRef]
- Roos, N.; Mustard, C.A. Variation in Health and Health Care Use by Socioeconomic Status in Winnipeg, Canada: Does the System Work Well? Yes and No. Milbank Q. 1997, 75, 89–111. [Google Scholar] [CrossRef] [Green Version]
- Subramanian, S.V.; Belli, P.; Kawachi, I. The Macroeconomic Determinants of Health. Annu. Rev. Public Health 2002, 23, 287–302. [Google Scholar] [CrossRef]
- Elstad, J.I. The psycho-social perspective on social inequalities in health. Sociol Health Illn. 1998, 20, 598–618. [Google Scholar] [CrossRef]
- Boyce, W.T.; Chesterman, E.A.; Winkleby, M.A. Psychosocial predictors of maternal and infant health among adolescent mothers. Am. J. Dis. Child. 1991, 145, 267–273. [Google Scholar] [CrossRef]
- Williams, D.R.; Yan Yu Jackson, J.S.; Anderson, N.B. Racial Differences in Physical and Mental Health: Socio-economic Status, Stress and Discrimination. J. Health Psychol. 1997, 2, 335–351. [Google Scholar] [CrossRef] [Green Version]
- Bernstein, M.; Crosby, F. An empirical examination of relative deprivation theory. J. Exp. Soc. Psychol. 1980, 16, 442–456. [Google Scholar] [CrossRef]
- Link, B.; Northridge, M.; Phelan, J.C.; Ganz, M. Social Epidemiology and the Fundamental Cause Concept: On the Structuring of Effective Cancer Screens by Socioeconomic Status. Milbank Q. 1998, 76, 375–402. [Google Scholar] [CrossRef] [PubMed] [Green Version]
- Roos, L.L.; Traverse, D.; Turner, D. Delivering Prevention: The Role of Public Programs in Delivering Care to High-Risk Populations. Med. Care 1999, 37, JS264–JS278. [Google Scholar] [CrossRef] [PubMed]
- Roos, L.L.; Magoon, J.; Gupta, S.; Chateau, D.; Veugelers, P.J. Socioeconomic determinants of mortality in two Canadian provinces: Multilevel modelling and neighborhood context. Soc. Sci. Med. 2004, 59, 1435–1447. [Google Scholar] [CrossRef] [PubMed]


| Total | Alive | Dead | p-Value | |||
|---|---|---|---|---|---|---|
| Characteristics | n = 15,882 | n = 11,389 | (71.7) | n = 4493 | (28.3) | |
| Age, n (%) | ||||||
| 20~49 | 2932 | 2697 | (23.7) | 235 | (5.2) | <0.0001 |
| 50~59 | 3786 | 3262 | (28.6) | 524 | (11.7) | |
| 60~69 | 4928 | 3593 | (31.6) | 1335 | (29.7) | |
| ≥70 | 4236 | 1837 | (16.1) | 2399 | (53.4) | |
| Sex, n (%) | ||||||
| Male | 8102 | 5604 | (49.2) | 2498 | (55.6) | <0.0001 |
| Female | 7780 | 5785 | (50.8) | 1995 | (44.4) | |
| Health insurance type, n (%) | ||||||
| National health insurance | 15,505 | 11,174 | (98.1) | 4331 | (96.4) | <0.0001 |
| Medical aid | 377 | 215 | (1.9) | 162 | (3.6) | |
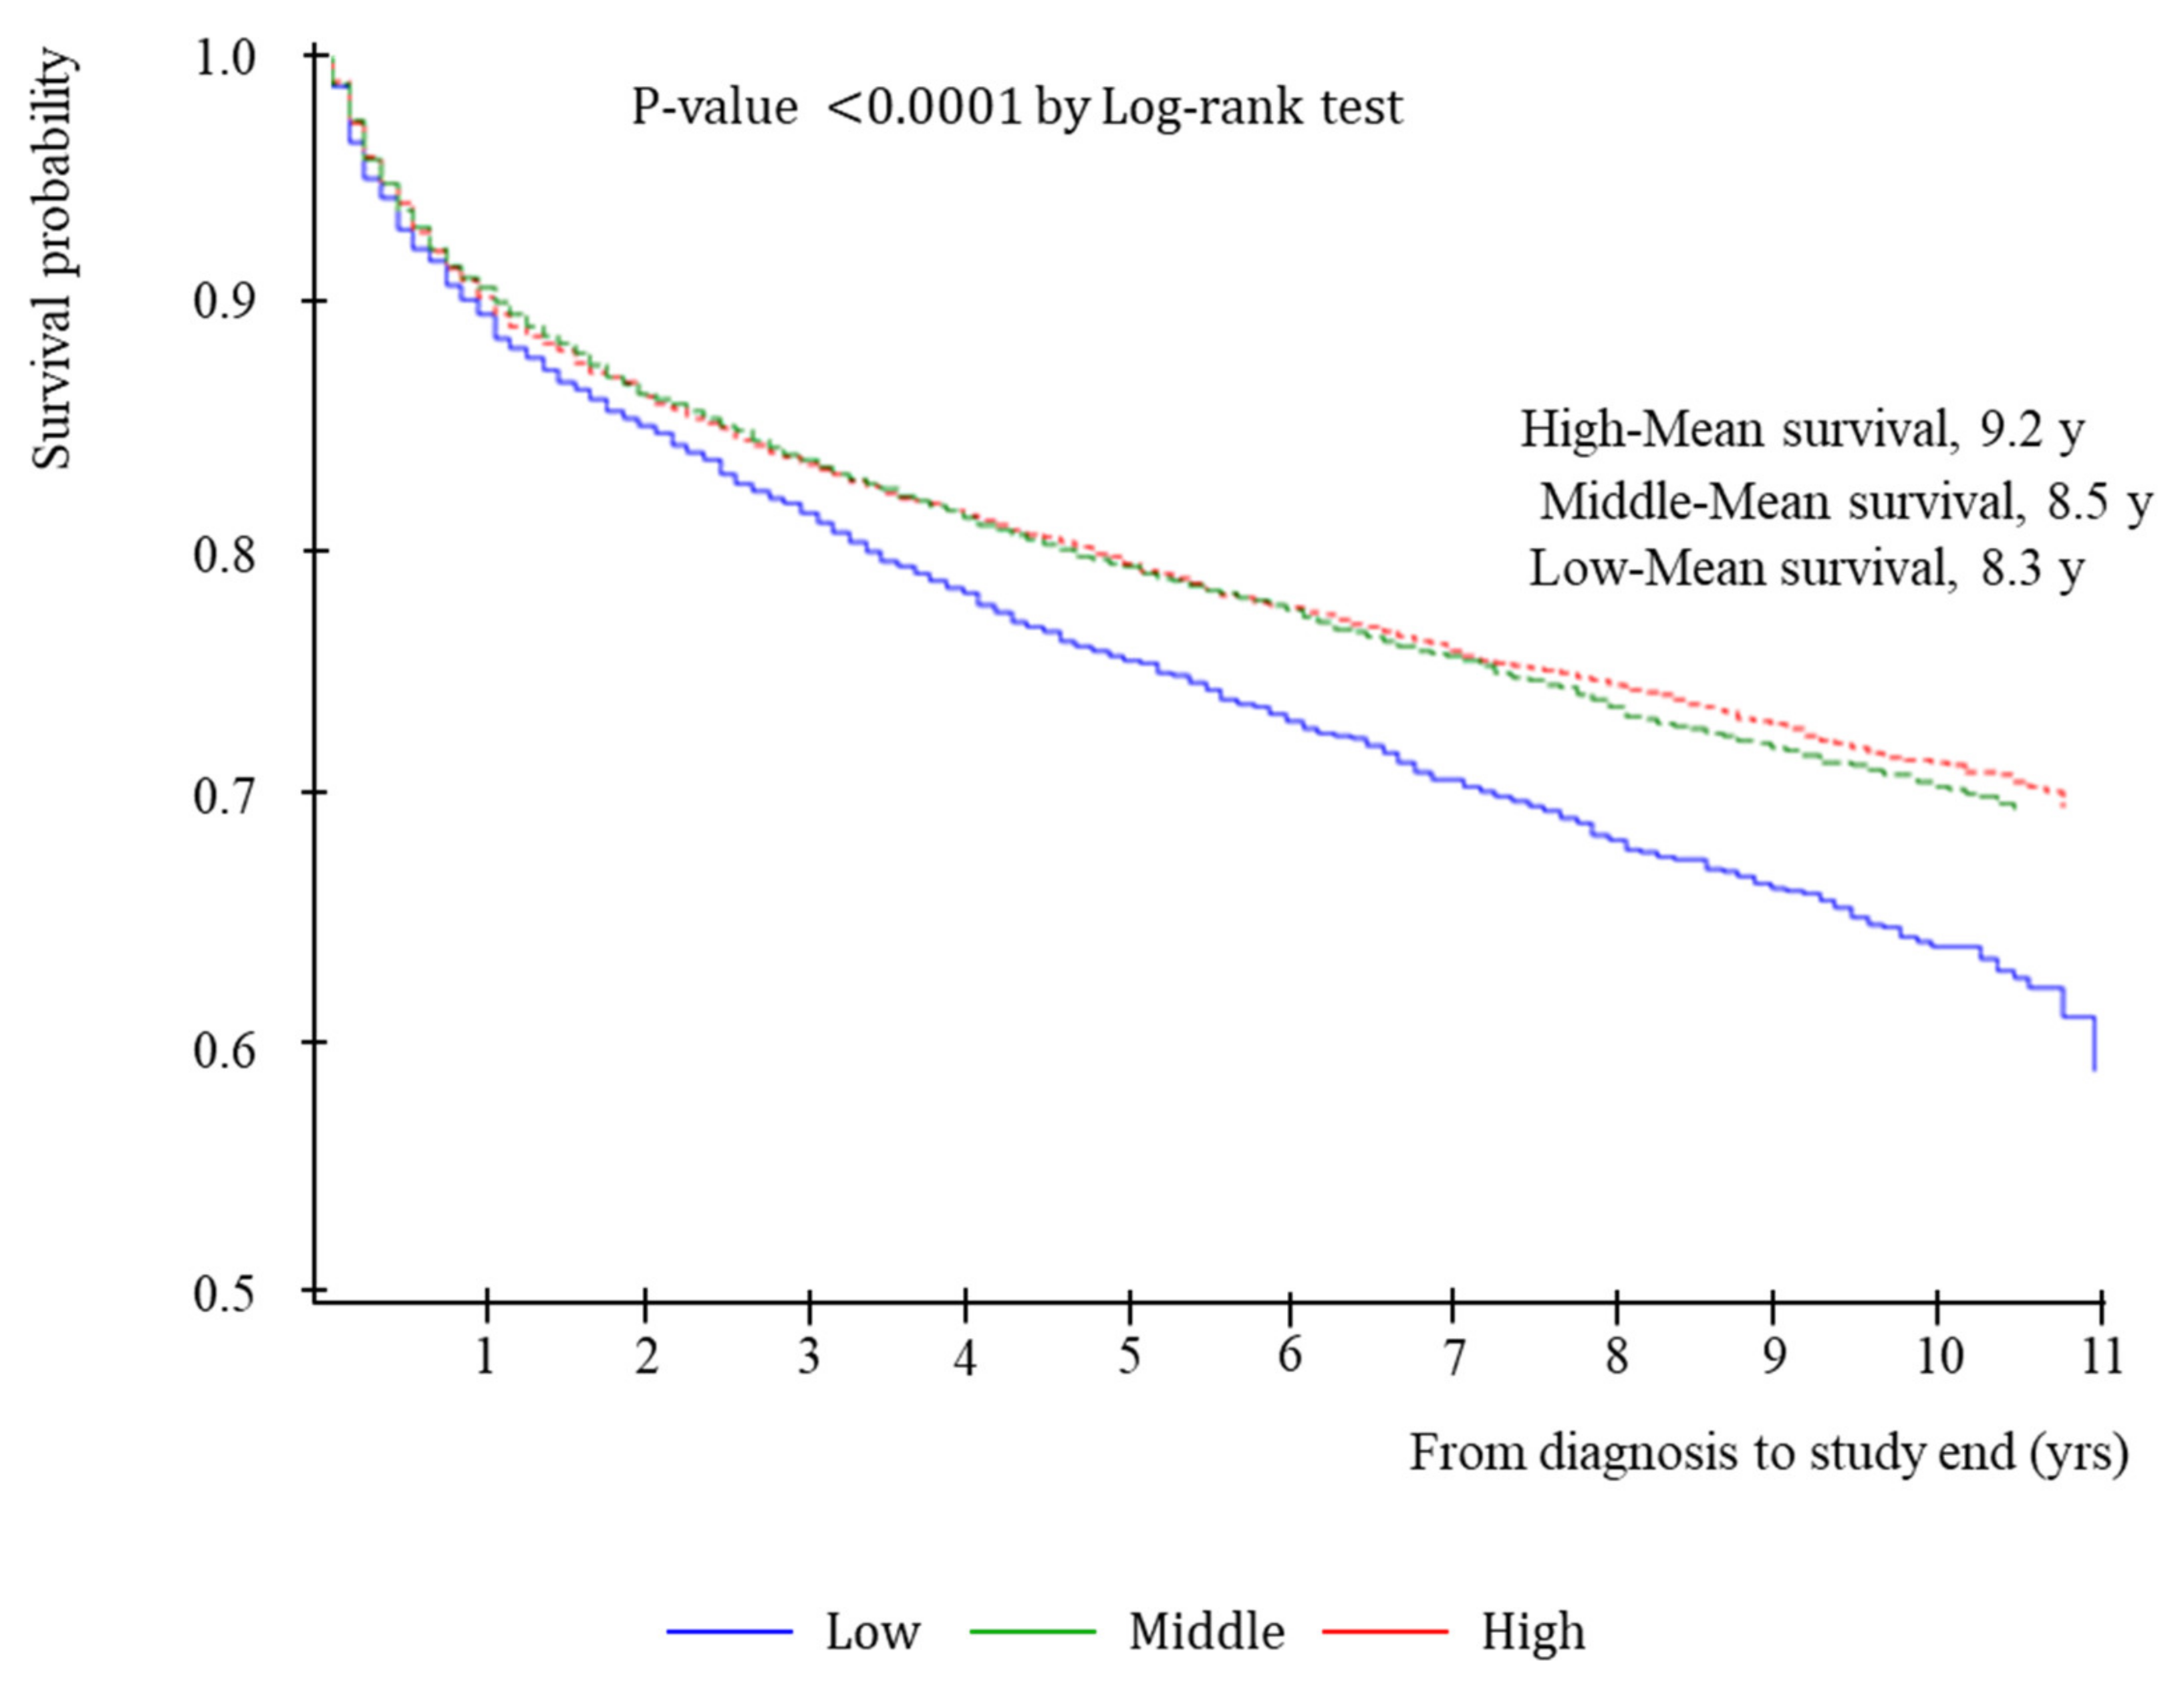
| Household income, n (%) | ||||||
| Low (≤20 percentile) | 2586 | 1715 | (15.1) | 871 | (19.4) | <0.0001 |
| Middle (21–80 percentile) | 8111 | 5929 | (52.1) | 2182 | (48.6) | |
| High (≥81 percentile) | 5185 | 3745 | (32.9) | 1440 | (32.1) | |
| Carstairs index, n (%) | ||||||
| Disadvantaged neighborhood (below mean) | 9033 | 6448 | (56.6) | 2585 | (57.5) | 0.293 |
| Advantaged neighborhood (above mean) | 6849 | 4941 | (43.4) | 1908 | (42.5) | |
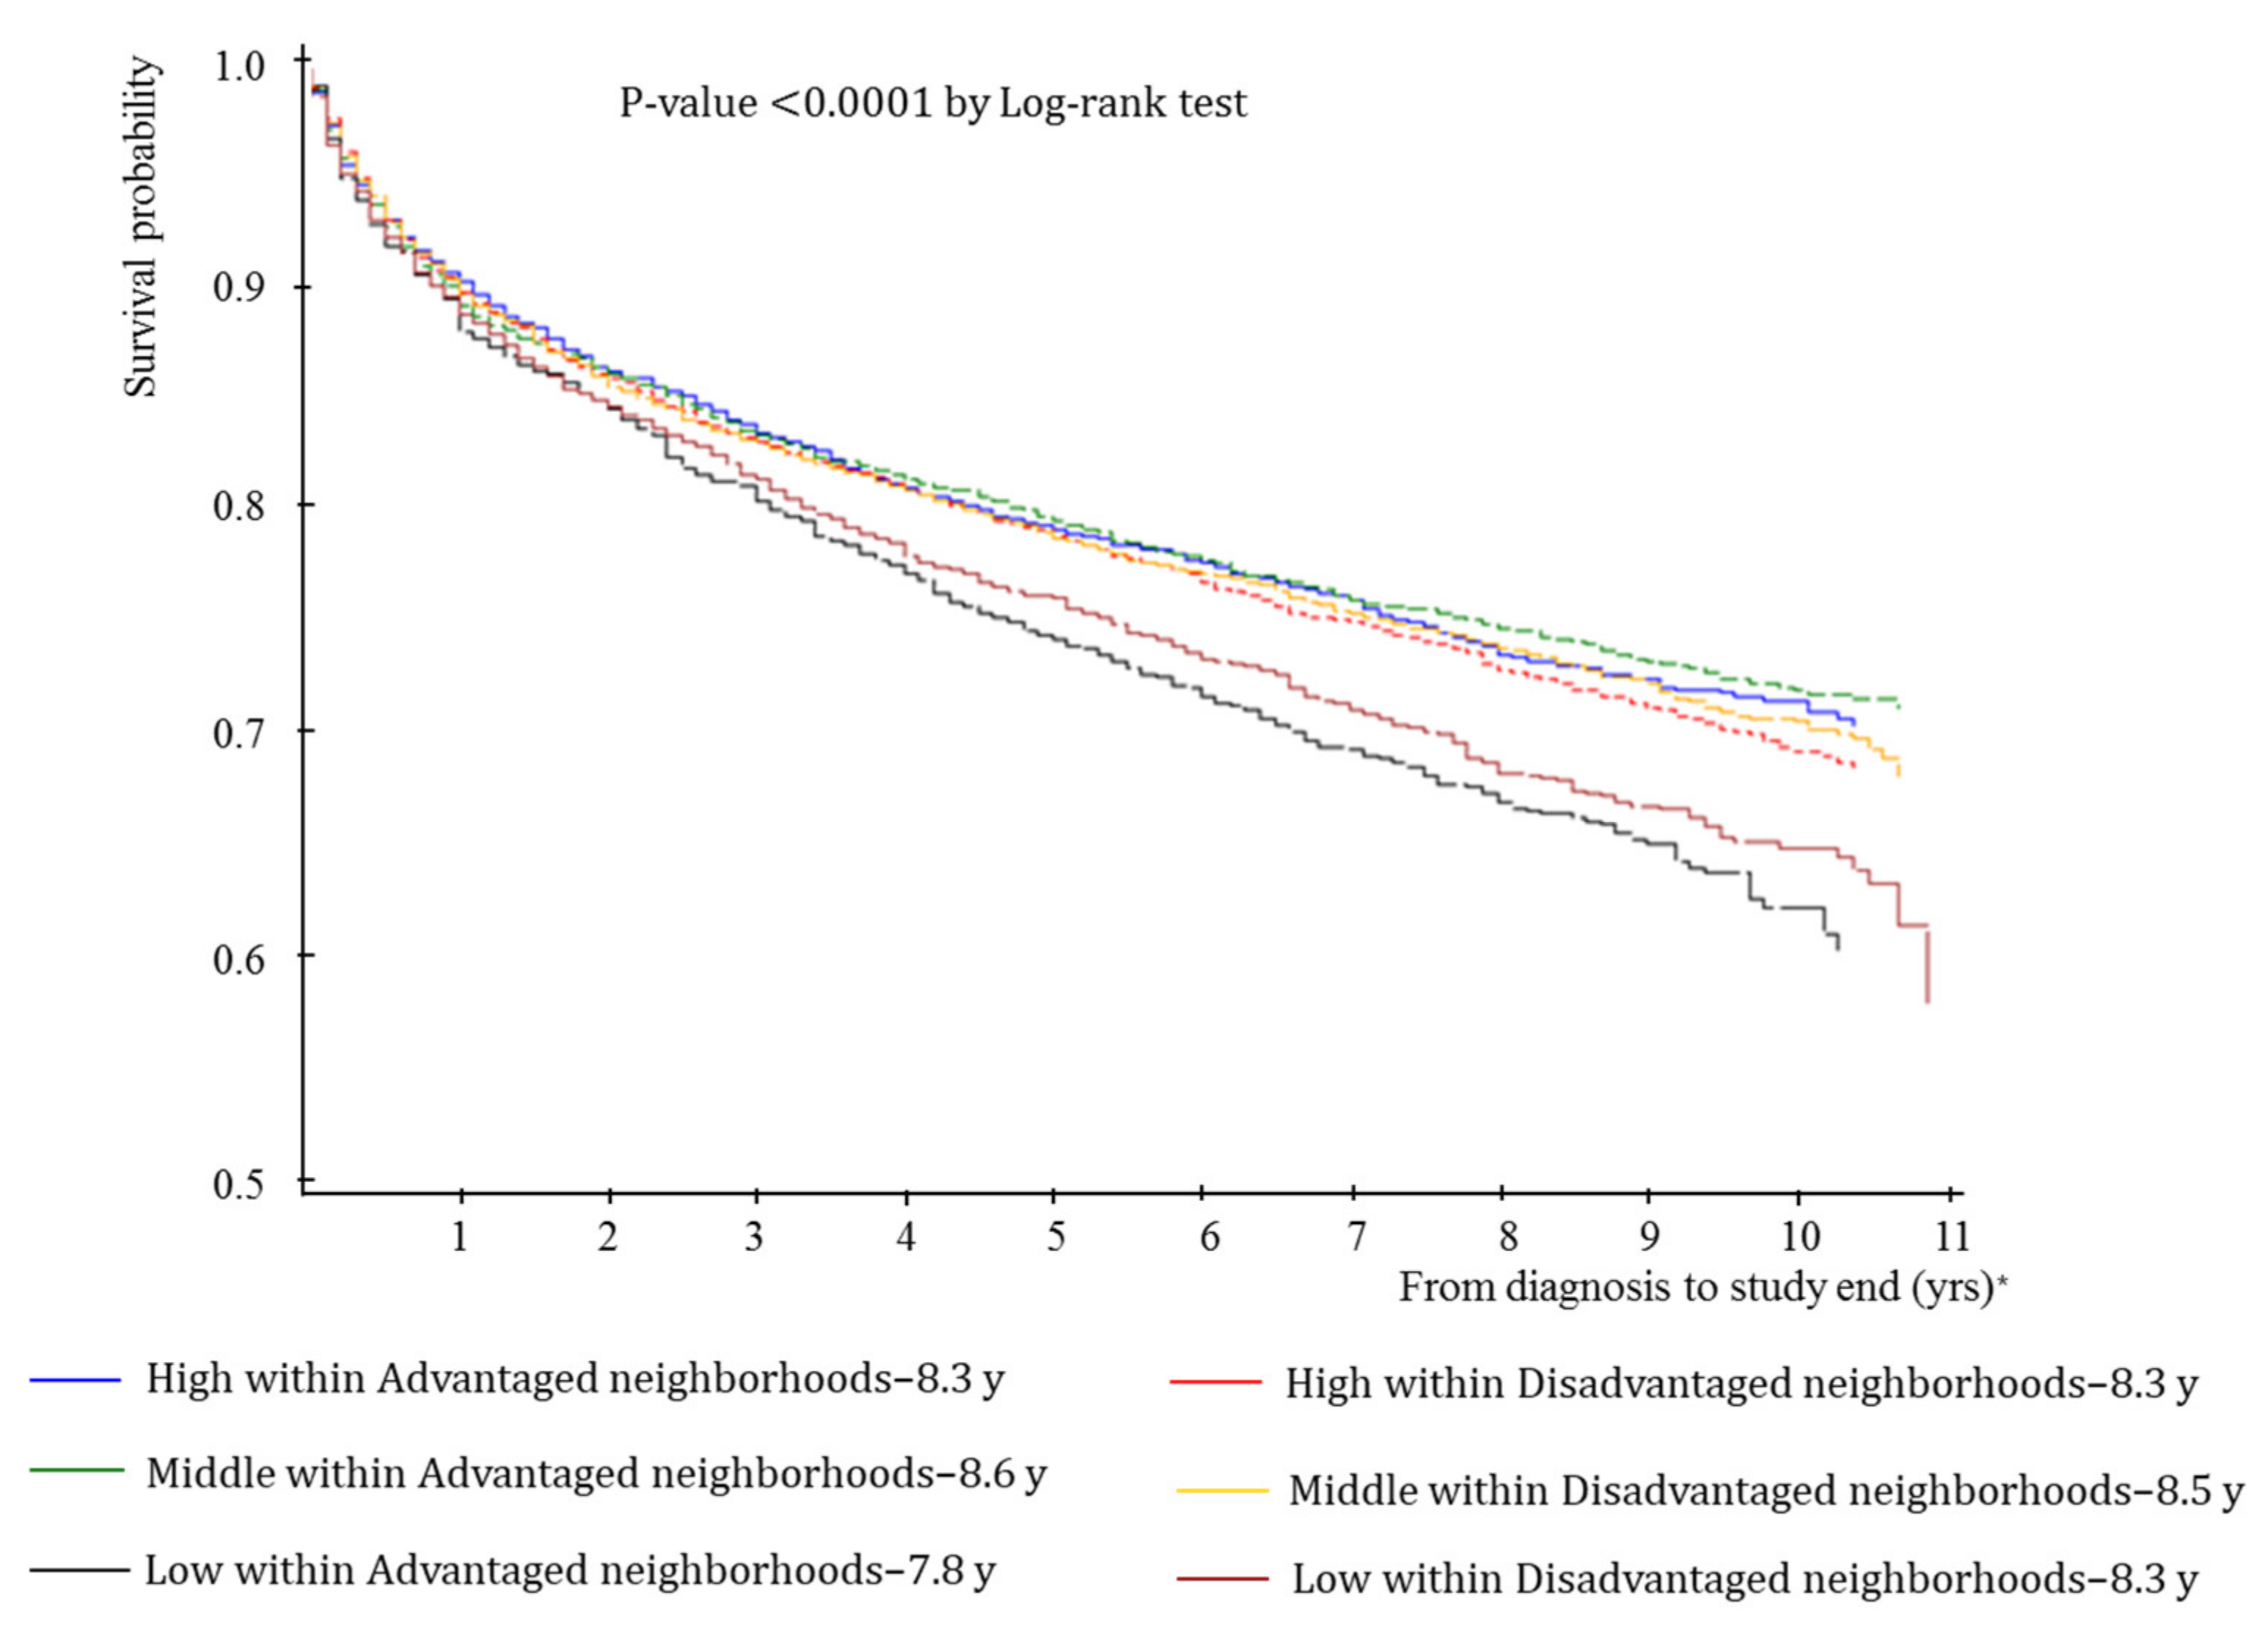
| Combined individual household income level–neighborhood deprivation, n (%) | ||||||
| High–Advantaged neighborhood | 2351 | 1714 | (15.1) | 637 | (14.2) | <0.0001 |
| High–Disadvantaged neighborhood | 2834 | 2031 | (17.8) | 803 | (17.9) | |
| Middle–Advantaged neighborhood | 3434 | 2533 | (22.2) | 901 | (20.1) | |
| Middle–Disadvantaged neighborhood | 4677 | 3396 | (29.8) | 1281 | (28.5) | |
| Low–Advantaged neighborhood | 1064 | 694 | (6.1) | 370 | (8.2) | |
| Low–Disadvantaged neighborhood | 1522 | 1021 | (9.0) | 501 | (11.2) | |
| Residential area, n (%) | ||||||
| Metropolitan | 7265 | 5339 | (46.9) | 1926 | (42.9) | <0.0001 |
| Urban | 6642 | 4750 | (41.7) | 1892 | (42.1) | |
| Rural | 1975 | 1300 | (11.4) | 675 | (15.0) | |
| Charlson comorbidity index †, n (%) | ||||||
| 0–1 | 8622 | 6931 | (60.9) | 1691 | (37.6) | <0.0001 |
| 2 | 3197 | 2354 | (20.7) | 843 | (18.8) | |
| 3 | 1805 | 1175 | (10.3) | 630 | (14.0) | |
| ≥4 | 2258 | 929 | (8.2) | 1329 | (29.6) | |
| Number of risk factors, n (%) | ||||||
| none | 2574 | 1333 | (11.7) | 1241 | (27.6) | <0.0001 |
| with hypertension or dyslipidemia | 9834 | 6994 | (61.4) | 2840 | (63.2) | |
| with hypertension and dyslipidemia | 3474 | 3062 | (26.9) | 412 | (9.2) | |
| Disability, n (%) | ||||||
| Normal | 14,127 | 10,466 | (91.9) | 3661 | (81.5) | <0.0001 |
| Mild disability | 1150 | 701 | (6.2) | 449 | (10) | |
| Severe disability | 605 | 222 | (2) | 383 | (8.5) | |
| Number of health screening during follow-up period, n (%) | ||||||
| 1 | 9125 | 5293 | (46.5) | 3832 | (85.3) | <0.0001 |
| 2 | 2286 | 1925 | (16.9) | 361 | (8.0) | |
| ≥3 | 4471 | 4171 | (36.6) | 300 | (6.7) | |
| Unadjusted | Adjusted | |||
|---|---|---|---|---|
| Characteristics | HR | 95% CI | HR | 95% CI |
| Age | ||||
| 20~49 | 1.00 | 1.00 | ||
| 50~59 | 1.79 | (1.53–2.09) | 2.44 | (2.09–2.86) |
| 60~69 | 3.79 | (3.30–4.36) | 4.59 | (3.98–5.29) |
| ≥70 | 9.89 | (8.65–11.31) | 9.86 | (8.58–11.32) |
| Sex | ||||
| Male | 1.26 | (1.19–1.34) | 1.60 | (1.50–1.70) |
| Female | 1.00 | 1.00 | ||
| Health insurance type | ||||
| National health insurance | 1.00 | 1.00 | ||
| Medical aid | 1.54 | (1.32–1.80) | 0.81 | (0.68–0.97) |
| Household income | ||||
| ≤20 percentile | 1.25 | (1.15–1.36) | 1.31 | (1.20–1.43) |
| 21–80 percentile | 0.97 | (0.91–1.04) | 1.16 | (1.09–1.25) |
| ≥81 percentile | 1.00 | 1.00 | ||
| Carstairs index | ||||
| Disadvantaged neighborhood (below mean) | 0.99 | (0.91–1.07) | 1.01 | (0.94–1.09) |
| Advantaged neighborhood (above mean) | 1.00 | |||
| Residential area | ||||
| Metropolitan | 1.00 | 1.00 | ||
| Urban | 1.09 | (1.03–1.17) | 1.06 | (0.98–1.15) |
| Rural | 1.37 | (1.25–1.50) | 1.28 | (1.16–1.43) |
| Charlson comorbidity index † | ||||
| 0–1 | 1.00 | 1.00 | ||
| 2 | 1.41 | (1.30–1.53) | 1.34 | (1.23–1.46) |
| 3 | 1.99 | (1.81–2.18) | 1.71 | (1.56–1.87) |
| ≥4 | 4.34 | (4.04–4.67) | 2.78 | (2.58–3.00) |
| Number of possessed risk factors | ||||
| none | 1.00 | 1.00 | ||
| those who have hypertension or dyslipidemia | 0.46 | (0.43–0.49) | 0.42 | (0.39–0.45) |
| those who have hypertension and dyslipidemia | 0.17 | (0.15–0.19) | 0.21 | (0.19–0.24) |
| Disability | ||||
| Normal | 1.00 | 1.00 | ||
| Mild | 1.68 | (1.52–1.85) | 1.30 | (1.18–1.44) |
| Severe | 3.17 | (2.85–3.52) | 1.65 | (1.48–1.83) |
| Health screening during follow-up period | ||||
| 1 | 1.00 | 1.00 | ||
| 2 | 0.31 | (0.28–0.34) | 0.37 | (0.34–0.42) |
| ≥3 | 0.12 | (0.11–0.14) | 0.17 | (0.15–0.19) |
| Disadvantaged Neighborhoods † | Advantaged Neighborhoods † | |||||||
|---|---|---|---|---|---|---|---|---|
| All-Cause Mortality | No. of Deaths (Deaths per 1000 py *) | Adjusted HR ** | 95% CI | No. of Deaths (Deaths per 1000 py *) | Adjusted HR ** | 95% CI | ||
| Individual household income | ||||||||
| High (≥81 percentile) | 803 | (39.6) | 1.02 | (0.91–1.15) | 637 | (37.7) | 1.00 | |
| Middle (21–80 percentile) | 1281 | (38.5) | 1.22 | (1.09–1.35) | 901 | (36.5) | 1.13 | (1.02–1.25) |
| Low (≤20 percentile) | 501 | (47.6) | 1.34 | (1.18–1.53) | 370 | (50.9) | 1.31 | (1.14–1.49) |
| Diabetes-related mortality ‡ | ||||||||
| Individual household income | ||||||||
| High (≥81 percentile) | 91 | (4.5) | 1.05 | (0.76–1.45) | 69 | (4.1) | 1.00 | |
| Middle (21–80 percentile) | 123 | (3.7) | 1.02 | (0.75–1.38) | 106 | (4.3) | 1.17 | (0.86–1.59) |
| Low (≤20 percentile) | 59 | (5.6) | 1.51 | (1.06–2.15) | 45 | (6.2) | 1.56 | (1.07–2.29) |
Publisher’s Note: MDPI stays neutral with regard to jurisdictional claims in published maps and institutional affiliations. |
© 2022 by the authors. Licensee MDPI, Basel, Switzerland. This article is an open access article distributed under the terms and conditions of the Creative Commons Attribution (CC BY) license (https://creativecommons.org/licenses/by/4.0/).
Share and Cite
Cho, K.-H.; Kim, J.; Choi, Y.; Kim, T.-H. The Effect of Neighborhood Deprivation on Mortality in Newly Diagnosed Diabetes Patients: A Countrywide Population-Based Korean Retrospective Cohort Study, 2002–2013. Int. J. Environ. Res. Public Health 2022, 19, 4324. https://doi.org/10.3390/ijerph19074324
Cho K-H, Kim J, Choi Y, Kim T-H. The Effect of Neighborhood Deprivation on Mortality in Newly Diagnosed Diabetes Patients: A Countrywide Population-Based Korean Retrospective Cohort Study, 2002–2013. International Journal of Environmental Research and Public Health. 2022; 19(7):4324. https://doi.org/10.3390/ijerph19074324
Chicago/Turabian StyleCho, Kyoung-Hee, Juyeong Kim, Young Choi, and Tae-Hyun Kim. 2022. "The Effect of Neighborhood Deprivation on Mortality in Newly Diagnosed Diabetes Patients: A Countrywide Population-Based Korean Retrospective Cohort Study, 2002–2013" International Journal of Environmental Research and Public Health 19, no. 7: 4324. https://doi.org/10.3390/ijerph19074324
APA StyleCho, K.-H., Kim, J., Choi, Y., & Kim, T.-H. (2022). The Effect of Neighborhood Deprivation on Mortality in Newly Diagnosed Diabetes Patients: A Countrywide Population-Based Korean Retrospective Cohort Study, 2002–2013. International Journal of Environmental Research and Public Health, 19(7), 4324. https://doi.org/10.3390/ijerph19074324