
The Relationship between Different Large-Sided Games and Official Matches on Professional Football Players’ Locomotor Intensity


 ,
,  ,
,  , ,
, , 

Abstract
:1. Introduction
2. Materials and Methods
2.1. Experimental Approach
2.2. Participants
2.3. Large-Sided Games
2.4. Official Matches
2.5. Locomotor Demands
2.6. Statistics
3. Results
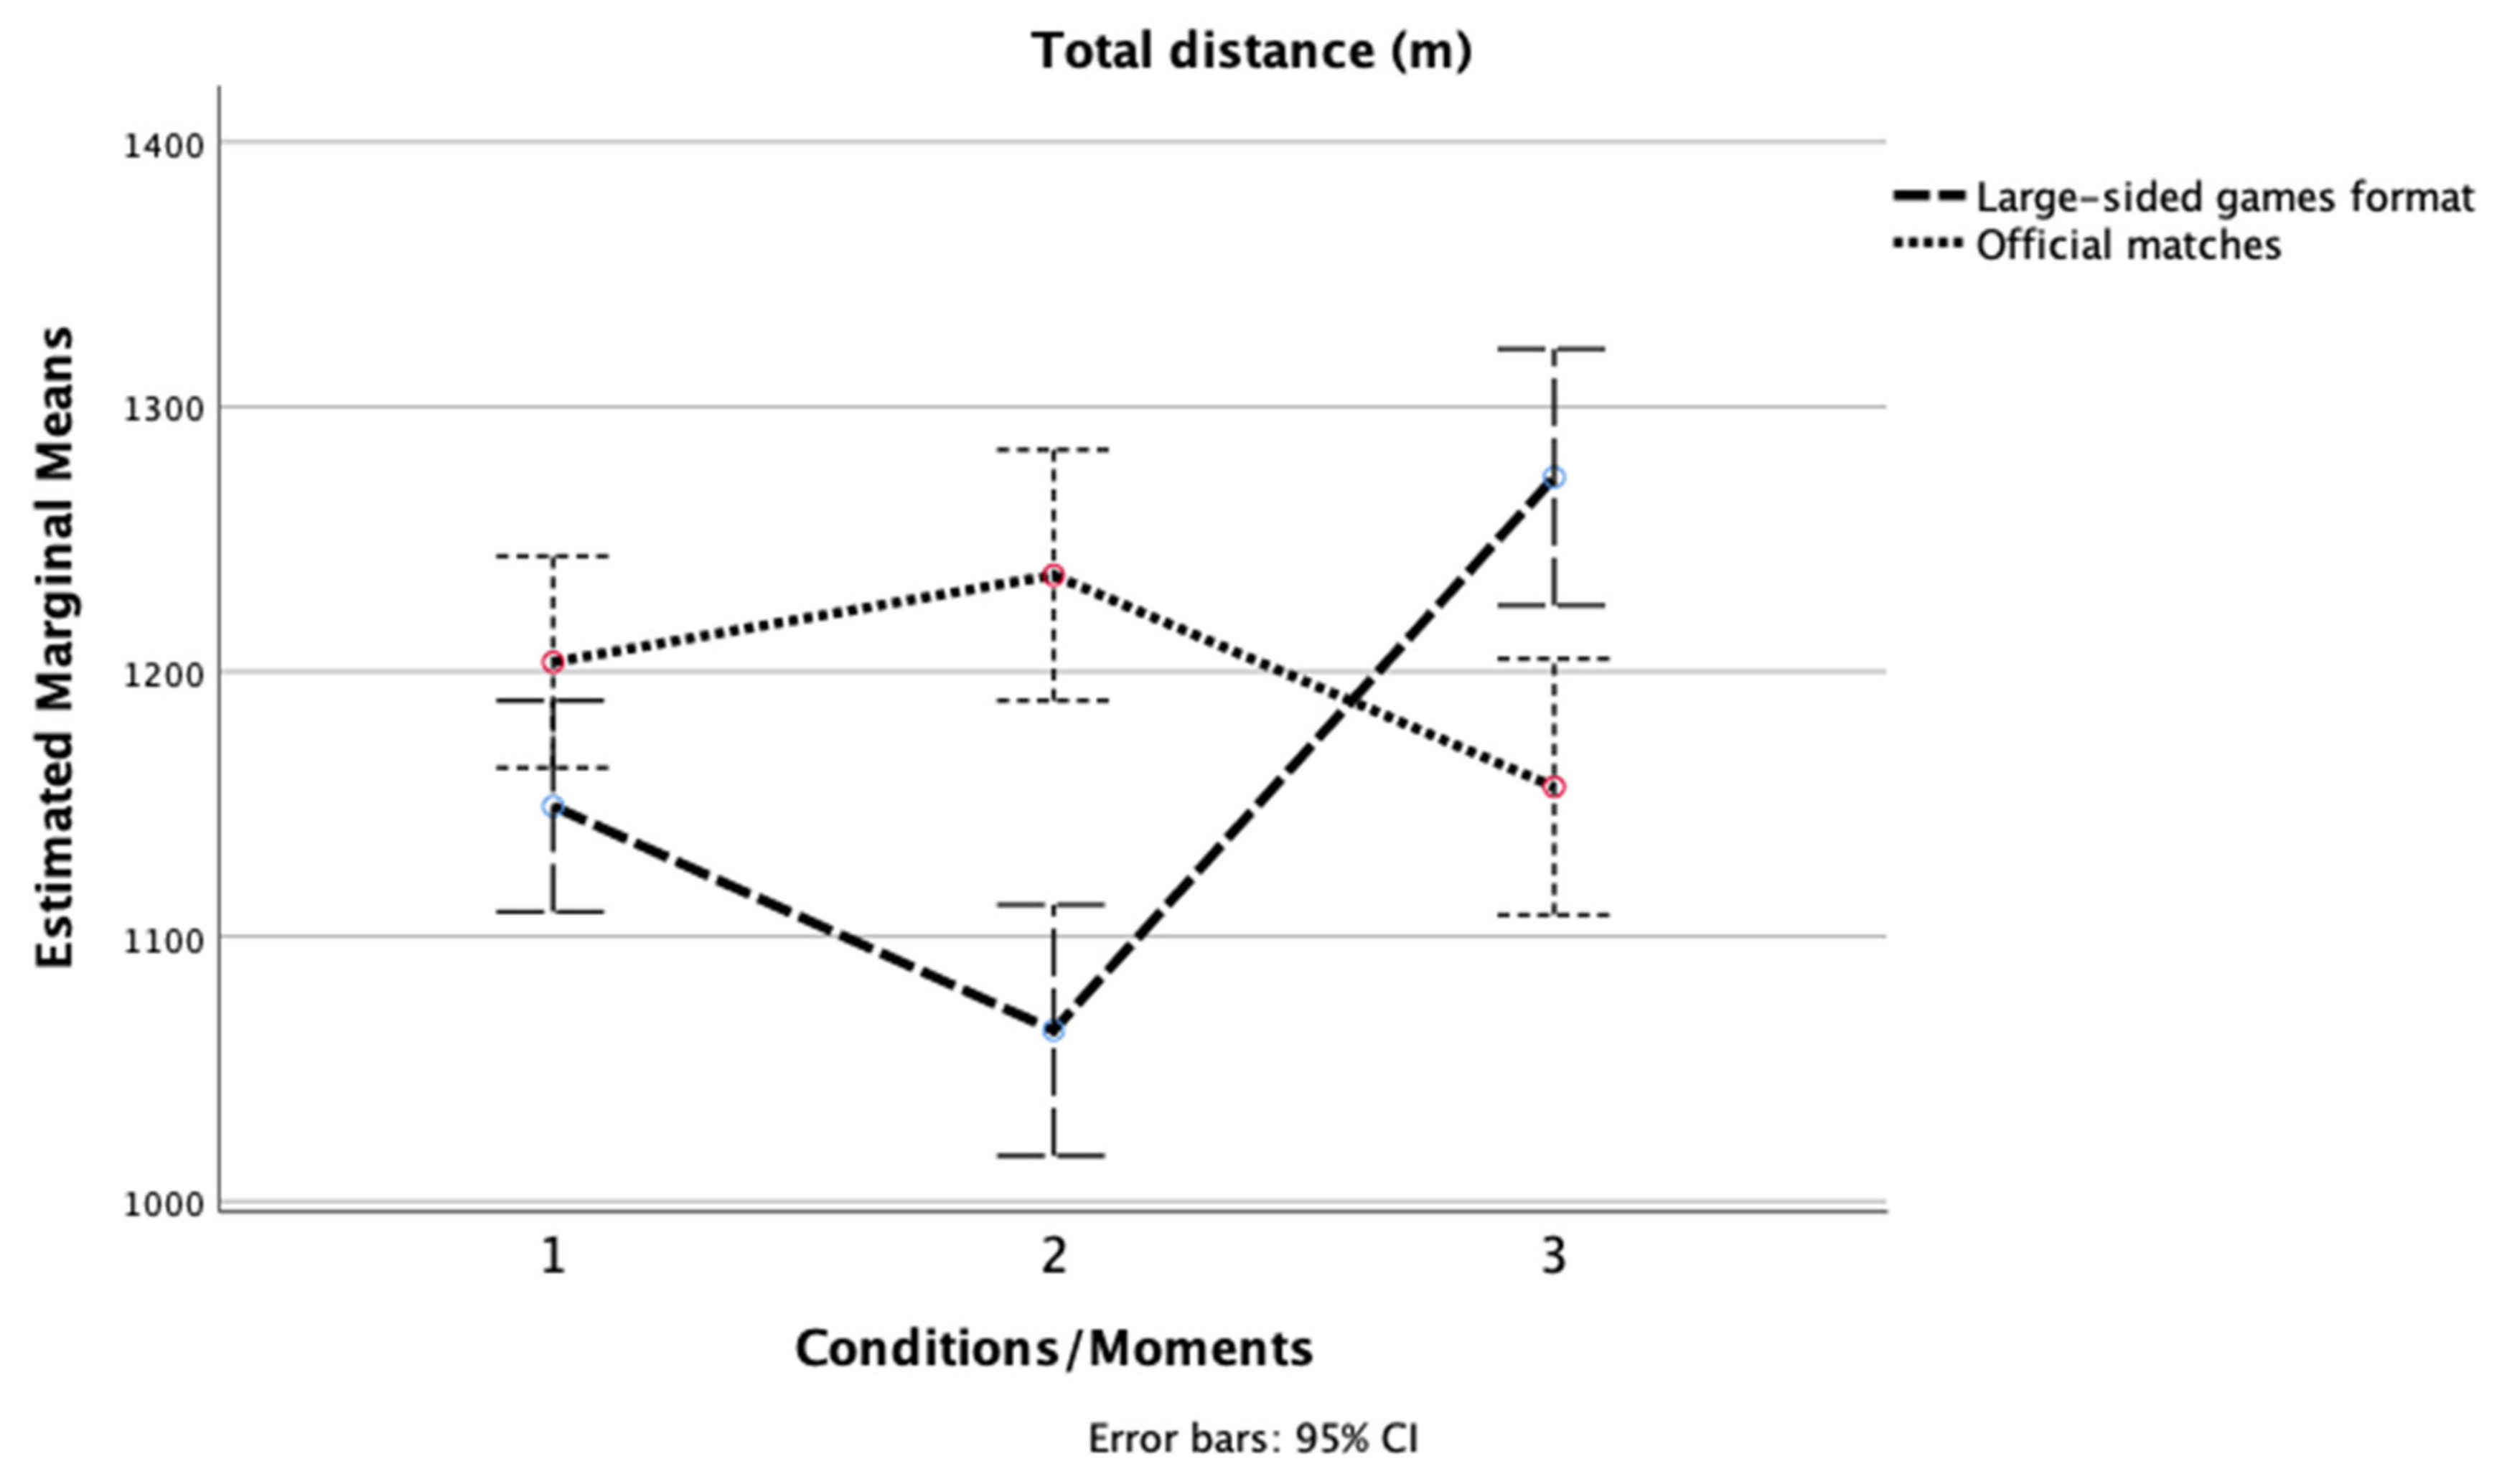
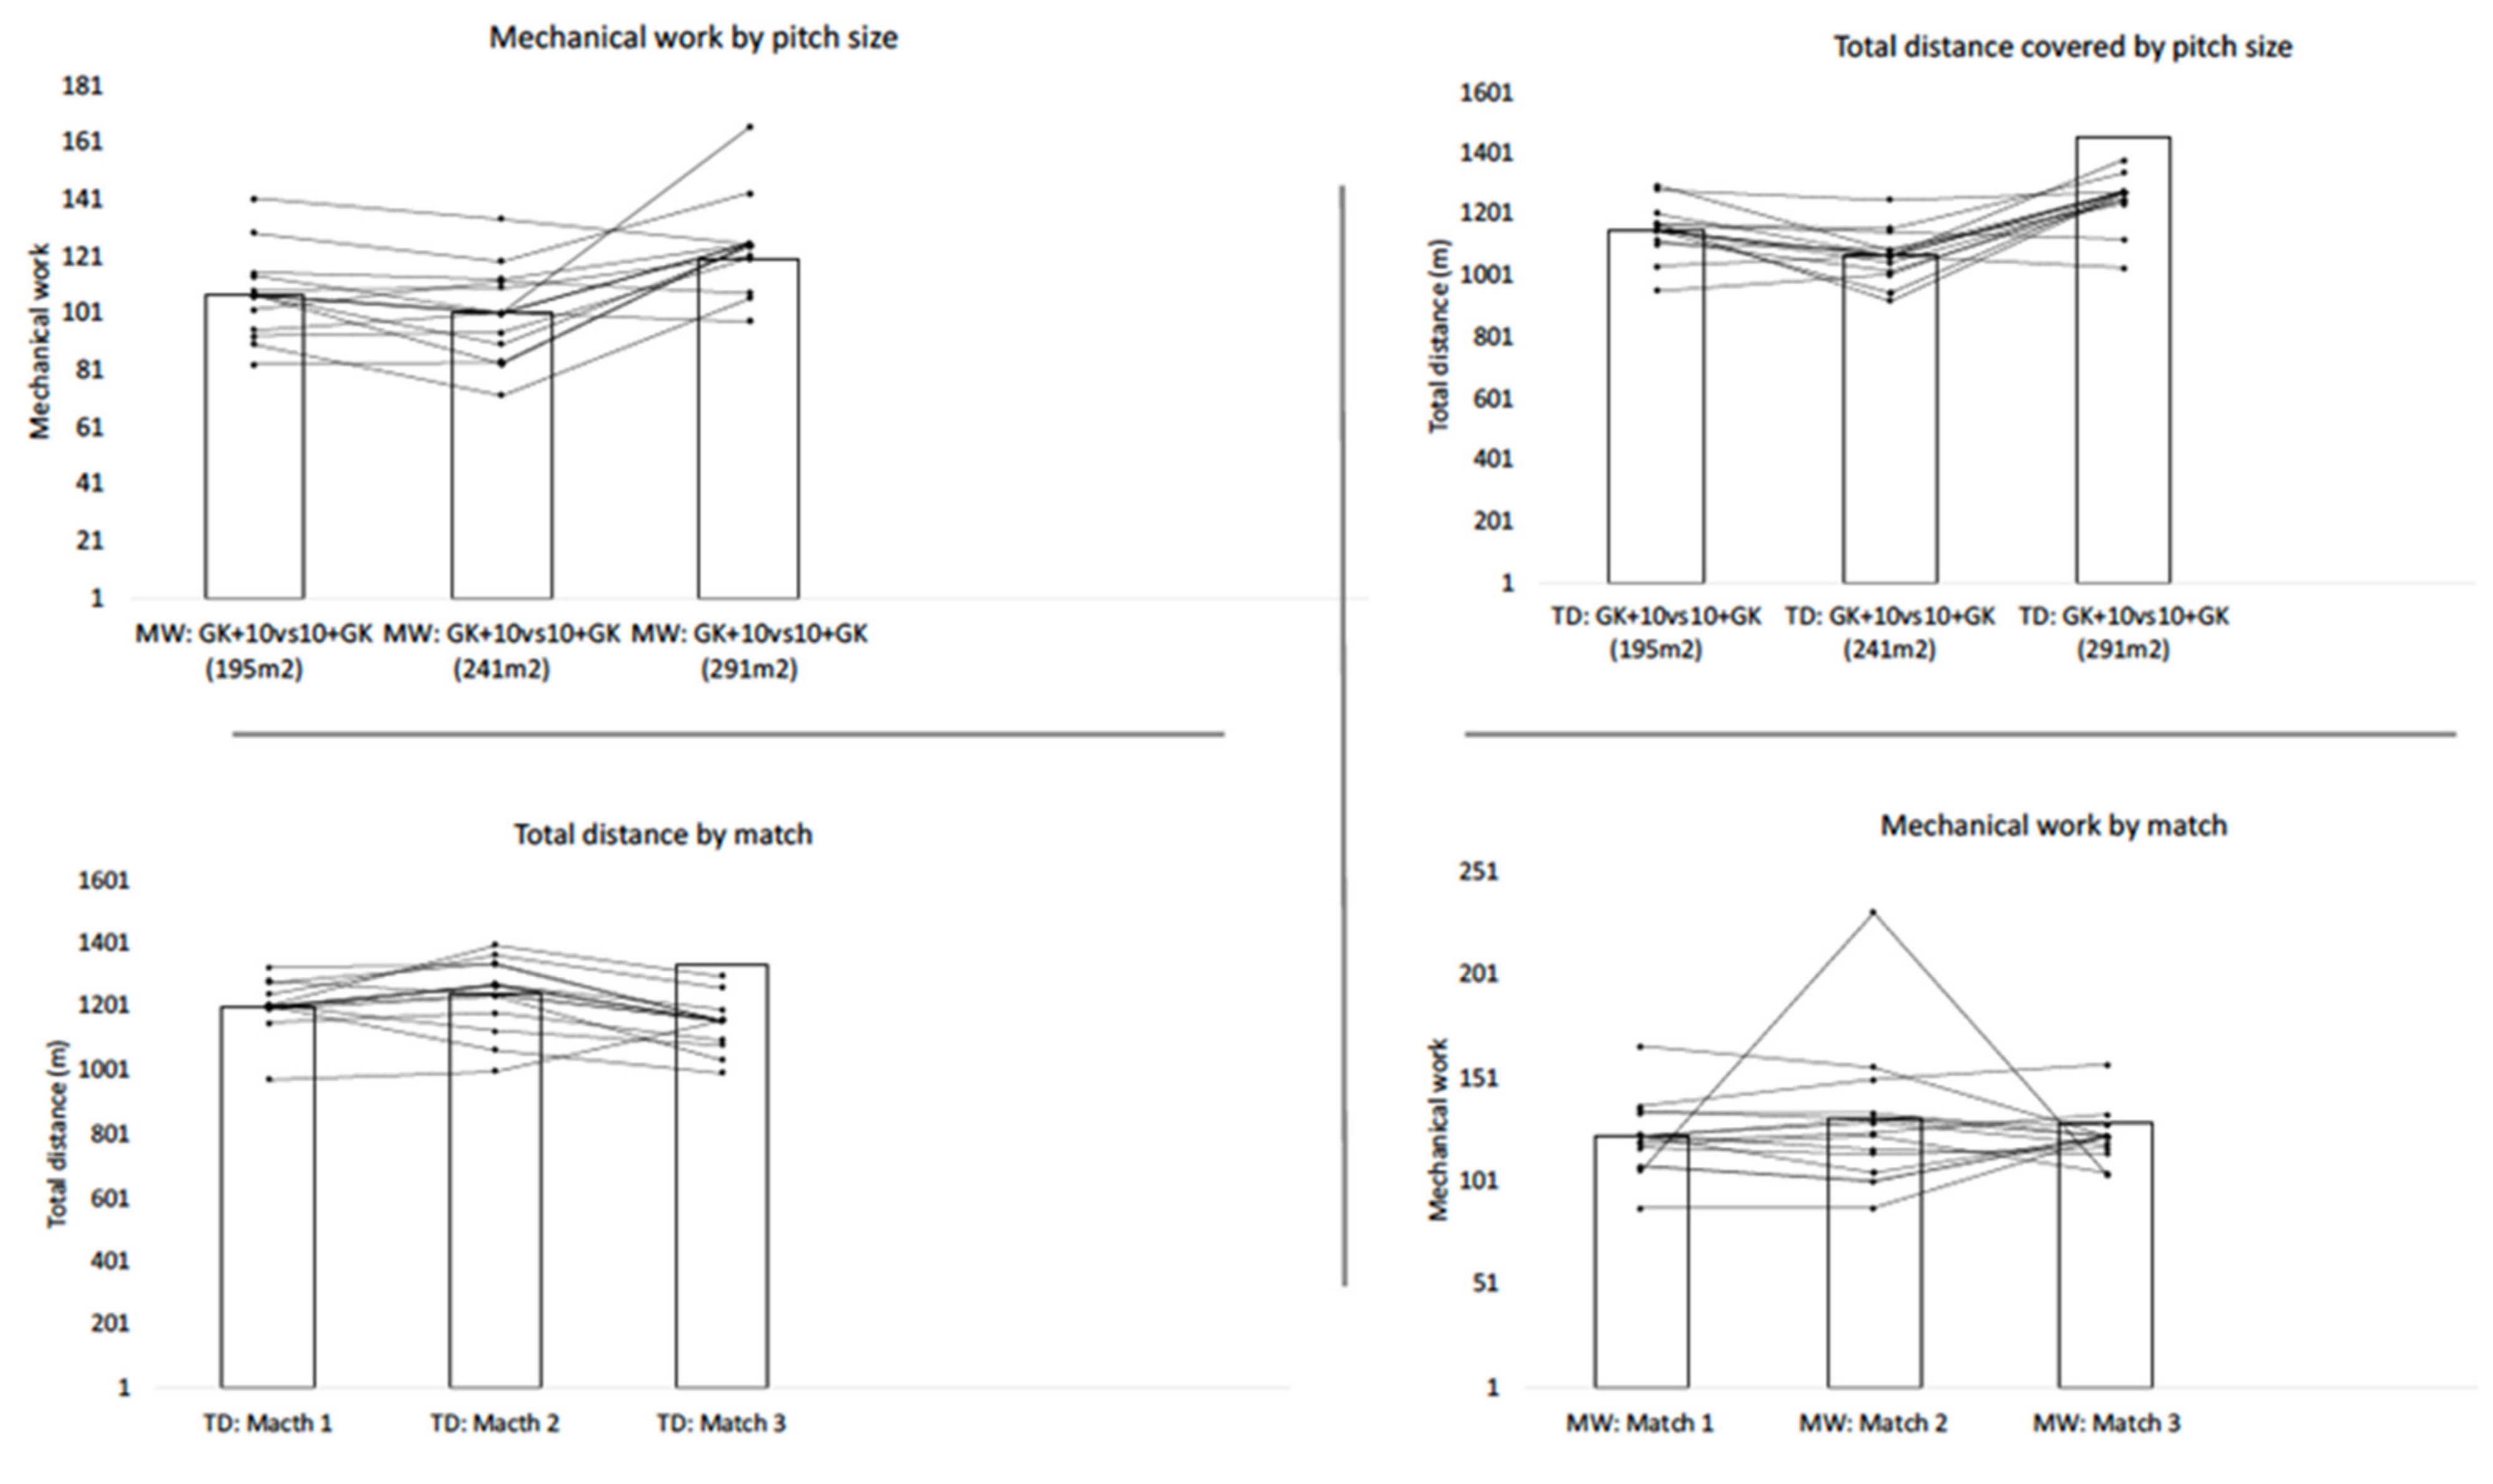
3.1. Total Distance
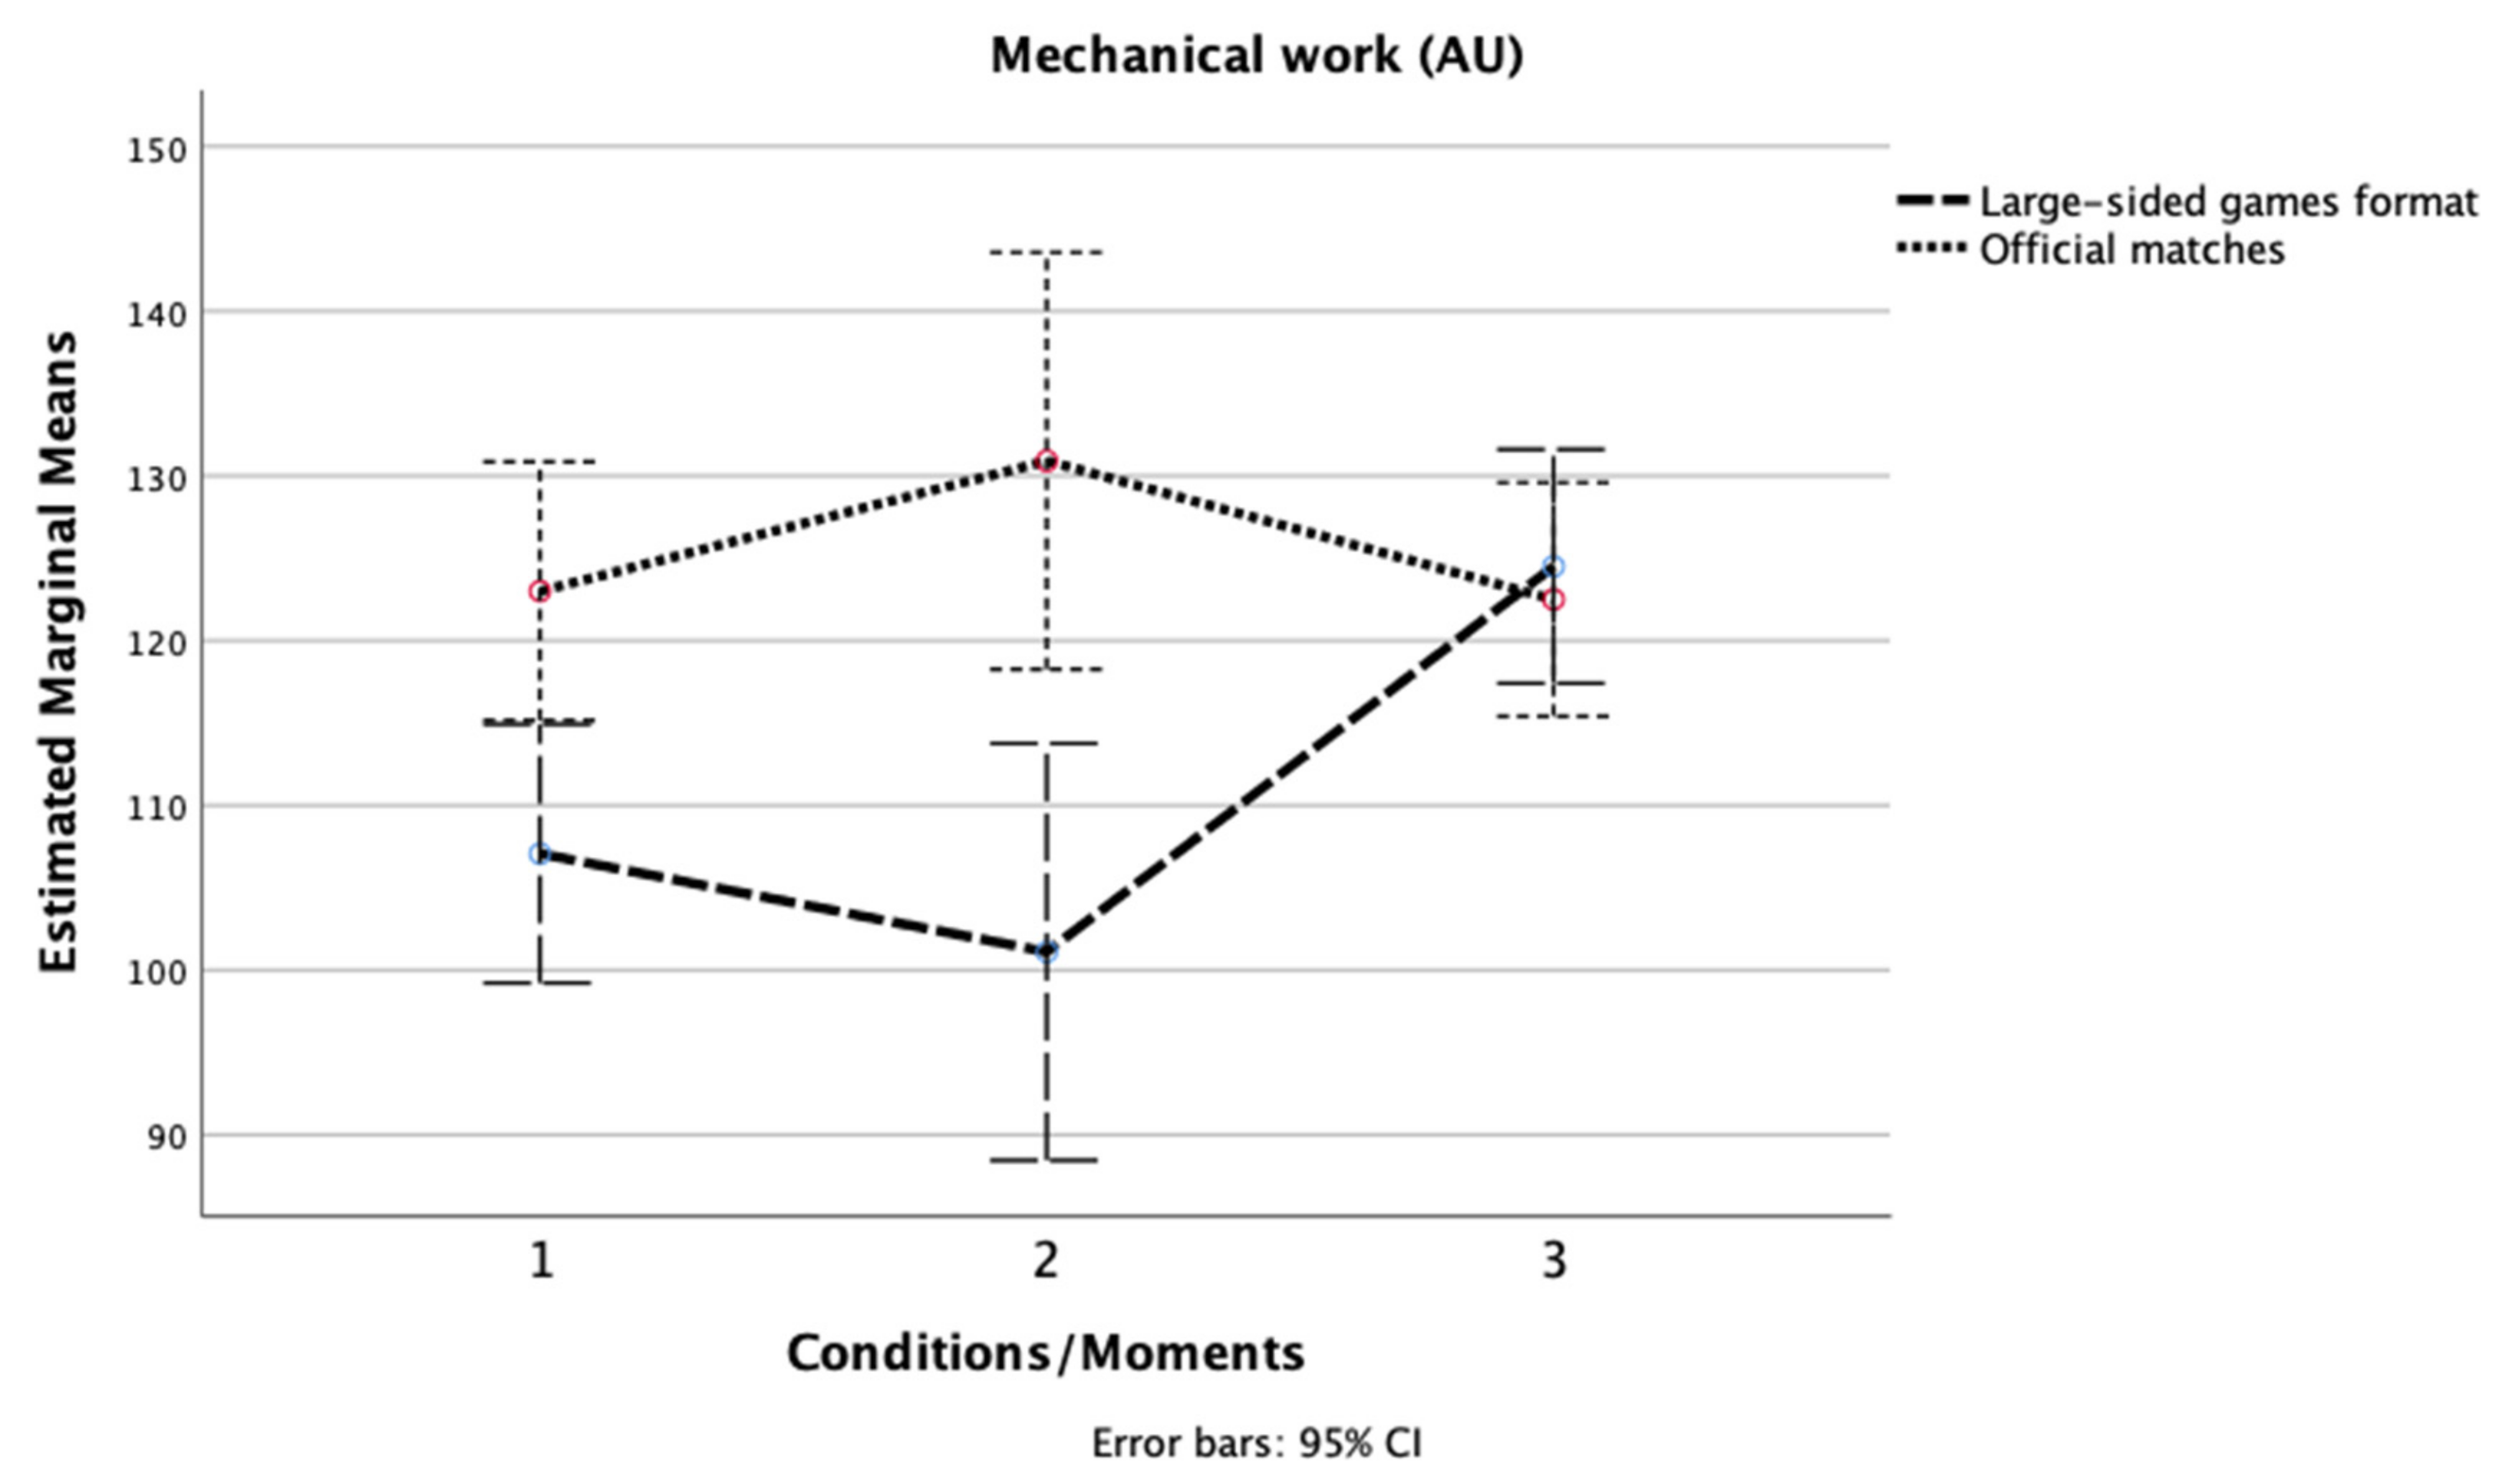
3.2. Mechanical Work
4. Discussion
5. Conclusions
Author Contributions
Funding
Institutional Review Board Statement
Informed Consent Statement
Data Availability Statement
Acknowledgments
Conflicts of Interest
References
- Hill-Haas, S.V.; Dawson, B.; Impellizzeri, F.M.; Coutts, A.J. Physiology of small-sided games training in football: A systematic review. Sports Med. 2011, 41, 199–220. [Google Scholar] [CrossRef] [PubMed]
- Gonçalves, B.; Esteves, P.; Folgado, H.; Ric, A.; Torrents, C.; Sampaio, J. Effects of pitch area-restrictions on tactical behavior, physical, and physiological performances in soccer large-sided games. J. Strength Cond. Res. 2017, 31, 2398–2408. [Google Scholar] [CrossRef] [PubMed]
- Owen, A.L.; Wong, D.P.; Paul, D.; Dellal, A. Physical and technical comparisons between various-sided games within professional soccer. Int. J. Sports Med. 2013, 35, 286–292. [Google Scholar] [CrossRef] [PubMed]
- Serra-Olivares, J.; Clemente, F.M.; González-Víllora, S. Tactical expertise assessment in youth football using representative tasks. SpringerPlus 2016, 5, 1301. [Google Scholar] [CrossRef] [Green Version]
- Halouani, J.; Chtourou, H.; Gabbett, T.; Chaouachi, A.; Chamari, K. Small-sided games in team sports training: A brief review. J. Strength Cond. Res. 2014, 28, 3594–3618. [Google Scholar] [CrossRef]
- Sarmento, H.; Clemente, F.M.; Harper, L.D.; Da Costa, I.T.; Owen, A.; Figueiredo, A.J. Small sided games in soccer—A systematic review. Int. J. Perform. Anal. Sport 2018, 18, 693–749. [Google Scholar] [CrossRef]
- Bujalance-Moreno, P.; Latorre-Román, P.; García-Pinillos, F. A systematic review on small-sided games in football players: Acute and chronic adaptations. J. Sports Sci. 2019, 37, 921–949. [Google Scholar] [CrossRef]
- Clemente, F.M.; Afonso, J.; Sarmento, H. Small-sided games: An umbrella review of systematic reviews and meta-analyses. PLoS ONE 2021, 16, e0247067. [Google Scholar] [CrossRef]
- Akenhead, R.; Nassis, G.P. Training load and player monitoring in high-level football: Current practice and perceptions. Int. J. Sports Physiol. Perform. 2016, 11, 587–593. [Google Scholar] [CrossRef]
- Miguel, M.; Oliveira, R.; Loureiro, N.; García-Rubio, J.; Ibáñez, S. Load measures in training/match monitoring in soccer: A systematic review. Int. J. Environ. Res. Public Health 2021, 18, 2721. [Google Scholar] [CrossRef]
- McLaren, S.J.; Macpherson, T.W.; Coutts, A.J.; Hurst, C.; Spears, I.R.; Weston, M. The relationships between internal and external measures of training load and intensity in team sports: A meta-analysis. Sports Med. 2018, 48, 641–658. [Google Scholar] [CrossRef] [PubMed] [Green Version]
- Gómez-Carmona, C.D.; Pino-Ortega, J.; Sánchez-Ureña, B.; Ibáñez, S.J.; Rojas-Valverde, D. Accelerometry-based external load indicators in sport: Too many options, same practical outcome? Int. J. Environ. Res. Public Health 2019, 16, 5101. [Google Scholar] [CrossRef] [PubMed] [Green Version]
- Barreira, P.; Robinson, M.A.; Drust, B.; Nedergaard, N.J.; Azidin, R.M.F.R.; Vanrenterghem, J. Mechanical Player Load™ using trunk-mounted accelerometry in football: Is it a reliable, task- and player-specific observation? J. Sports Sci. 2017, 35, 1674–1681. [Google Scholar] [CrossRef] [PubMed]
- Barrett, S.; Midgley, A.; Lovell, R. PlayerLoad™: Reliability, convergent validity, and influence of unit position during treadmill running. Int. J. Sports Physiol. Perform. 2014, 9, 945–952. [Google Scholar] [CrossRef]
- Malone, S.; Owen, A.; Newton, M.; Mendes, B.; Tiernan, L.; Hughes, B.; Collins, K. Wellbeing perception and the impact on external training output among elite soccer players. J. Sci. Med. Sport 2018, 21, 29–34. [Google Scholar] [CrossRef]
- Akenhead, R.; Harley, J.A.; Tweddle, S.P. Examining the external training load of an English premier league football team with special reference to acceleration. J. Strength Cond. Res. 2016, 30, 2424–2432. [Google Scholar] [CrossRef]
- Giménez, J.V.; Leicht, A.S.; Gomez, M.A. Physical performance differences between starter and non-starter players during professional soccer friendly matches. J. Hum. Kinet. 2019, 69, 283–291. [Google Scholar] [CrossRef] [Green Version]
- Clemente, F.M.; Owen, A.; Serra-Olivares, J.; Nikolaidis, P.T.; van der Linden, C.M.I.; Mendes, B. Characterization of the weekly external load profile of professional soccer teams from Portugal and the Netherlands. J. Hum. Kinet. 2019, 66, 155–164. [Google Scholar] [CrossRef] [Green Version]
- Clemente, F.M.; Rabbani, A.; Conte, D.; Castillo, D.; Afonso, J.; Clark, C.C.T.; Nikolaidis, P.T.; Rosemann, T.; Knechtle, B. Training/match external load ratios in professional soccer players: A full-season study. Int. J. Environ. Res. Public Health 2019, 16, 3057. [Google Scholar] [CrossRef] [Green Version]
- Clemente, F.M.; Seerden, G.; van der Linden, C.M. Quantifying the physical loading of five weeks of pre-season training in professional soccer teams from Dutch and Portuguese leagues. Physiol. Behav. 2019, 209, 112588. [Google Scholar] [CrossRef]
- Clemente, F.M.; Wong, D.P.; Martins, F.M.L.; Mendes, R.S. Acute effects of the number of players and scoring method on physiological, physical, and technical performance in small-sided soccer games. Res. Sports Med. 2014, 22, 380–397. [Google Scholar] [CrossRef] [PubMed]
- Halouani, J.; Chtourou, H.; Dellal, A.; Chaouachi, A.; Chamari, K. Physiological responses according to rules changes during 3 vs. 3 small-sided games in youth soccer players: Stop-ball vs. small-goals rules. J. Sports Sci. 2014, 32, 1485–1490. [Google Scholar] [CrossRef] [PubMed]
- Stevens, T.G.A.; De Ruiter, C.J.; Beek, P.J.; Savelsbergh, G.J.P. Validity and reliability of 6-a-side small-sided game locomotor performance in assessing physical fitness in football players. J. Sports Sci. 2016, 34, 527–534. [Google Scholar] [CrossRef] [PubMed] [Green Version]
- Ric, A.; Hristovski, R.; Gonçalves, B.; Torres, L.; Sampaio, J.; Torrents, C. Timescales for exploratory tactical behaviour in football small-sided games. J. Sports Sci. 2016, 34, 1723–1730. [Google Scholar] [CrossRef] [Green Version]
- Mc Lean, S.; Kerhervé, H.; Naughton, M.; Lovell, G.; Gorman, A.; Solomon, C. The effect of recovery duration on technical proficiency during small sided games of football. Sports 2016, 4, 39. [Google Scholar] [CrossRef] [Green Version]
- Owen, A.L.; Djaoui, L.; Newton, M.; Malone, S.; Mendes, B. A contemporary multi-modal mechanical approach to training monitoring in elite professional soccer. Sci. Med. Footb. 2017, 1, 216–221. [Google Scholar] [CrossRef]
- Stevens, T.G.A.; De Ruiter, C.J.; Twisk, J.W.R.; Savelsbergh, G.J.P.; Beek, P.J. Quantification of in-season training load relative to match load in professional Dutch Eredivisie football players. Sci. Med. Footb. 2017, 1, 117–125. [Google Scholar] [CrossRef]
- Faul, F.; Erdfelder, E.; Lang, A.-G.; Buchner, A. G*Power 3: A flexible statistical power analysis program for the social, behavioral, and biomedical sciences. Behav. Res. Methods 2007, 39, 175–191. [Google Scholar] [CrossRef]
- Lacome, M.; Simpson, B.M.; Cholley, Y.; Lambert, P.; Buchheit, M. Small-sided games in elite soccer: Does one size fit all? Int. J. Sports Physiol. Perform. 2018, 13, 568–576. [Google Scholar] [CrossRef]
- Ometto, L.; Vasconcellos, F.V.; Cunha, F.; Teoldo, I.; Souza, C.R.B.; Dutra, M.B.; O’Sullivan, M.; Davids, K. How manipulating task constraints in small-sided and conditioned games shapes emergence of individual and collective tactical behaviours in football: A systematic review. Int. J. Sports Sci. Coach. 2018, 13, 1200–1214. [Google Scholar] [CrossRef]
- Beenham, M.; Barron, D.J.; Fry, J.; Hurst, H.H.; Figueirdo, A.; Atkins, S. A Comparison of GPS workload demands in match play and small-sided games by the positional role in youth soccer. J. Hum. Kinet. 2017, 57, 129–137. [Google Scholar] [CrossRef] [PubMed] [Green Version]
- Casamichana, D.; Castellano, J.; Castagna, C. Comparing the physical demands of friendly matches and small-sided games in semiprofessional soccer players. J. Strength Cond. Res. 2012, 26, 837–843. [Google Scholar] [CrossRef] [PubMed] [Green Version]
- Clemente, F.M.; Praça, G.M.; Bredt, S.D.G.T.; van der Linden, C.M.I.; Serra-Olivares, J. External load variations between medium- and large-sided soccer games: Ball possession games vs regular games with small goals. J. Hum. Kinet. 2019, 70, 191–198. [Google Scholar] [CrossRef] [PubMed] [Green Version]
- Chow, J.Y.; Davids, K.; Button, C.; Shuttleworth, R.; Renshaw, I.; Araújo, D. Nonlinear pedagogy: A constraints-led framework for understanding emergence of game play and movement skills. Nonlinear Dyn. Psychol. Life Sci. 2006, 10, 71–103. [Google Scholar]
- Chow, J.Y.; Komar, J.; Seifert, L. The role of nonlinear pedagogy in supporting the design of modified games in junior sports. Front. Psychol. 2021, 12, 744814. [Google Scholar] [CrossRef]


| Official Match 1 | Official Match 2 | Official Match 3 | |
|---|---|---|---|
| Date | 31 October 2020 | 7 November 2020 | 30 November 2020 |
| Home/away game | Home | Away | Home |
| Game score | Draw | Loss | Loss |
| Player 1 | 100% of the time | 100% of the time | 100% of the time |
| Player 2 | 100% of the time | 100% of the time | |
| Player 3 | 100% of the time | 100% of the time | 90% of the time |
| Player 4 | 100% of the time | 100% of the time | |
| Player 5 | 100% of the time | 76% of the time | 96% of the time |
| Player 6 | 100% of the time | 48% of the time | |
| Player 7 | 82% of the time | ||
| Player 8 | 60% of the time | 48% of the time | |
| Player 9 | 100% of the time | 84% of the time | 100% of the time |
| Player 10 | 85% of the time | 100% of the time | 76% of the time |
| Player 11 | 100% of the time | 100% of the time | |
| Player 12 | 51% of the time | 100% of the time | |
| Player 13 | 51% of the time | ||
| Player 14 | 100% of the time | ||
| Player 15 | 100% of the time | ||
| Player 16 | 76% of the time |
| Week 1 | Week 2 | Week 3 | |
|---|---|---|---|
| Format | GK + 10 vs. 10 + GK | GK + 10 vs. 10 + GK | GK + 10 vs. 10 + GK |
| Pitch size | 67 m × 64 m (4288 m2) | 78 m × 68 m (5304 m2) | 100 m × 64 m (6400 m2) |
| Area per player | 195 m2 | 241 m2 | 291 m2 |
| Task objectives | The main objective for the three LSG conditions was to score as many as goals as possible and not to to give any possible chance for the opponent to score. | ||
| Task rules | All the official game rules were maintained for the three LSG, except for the offside rule and the start and restart of play rule. Every time one of the teams won a free kick (direct and indirect), a penalty, a throw-in or a corner kick, the restart of the game was performed by the GK of the team to whom the goal kick belonged. All LSG were also played with free touch rule per player. | ||
| Sets | 1 | ||
| Minutes per set | 10′ | ||
| Mean | SD | 95% Confidence Interval for Mean | ||
|---|---|---|---|---|
| Lower Bound | Upper Bound | |||
| Age (years) | 26.3 | 2.9 | 23.8 | 28.7 |
| Weight (kg) | 78.6 | 6.2 | 73.3 | 84.8 |
| Height (cm) | 181.6 | 5.2 | 178.7 | 184.3 |
| BMI (kg/m2) | 23.8 | 1.5 | 22.5 | 25.3 |
| Percent of body fat | 10.4 | 2.9 | 8.9 | 11.9 |
| Countermovement jump (cm) | 39.0 | 4.8 | 35.3 | 42.7 |
| Squat jump (cm) | 38.1 | 4.5 | 34.4 | 41.6 |
| Handgrip strength (kg) | 50.6 | 8.1 | 44.9 | 58.1 |
| Sprint 35 m (s) | 4.9 | 0.3 | 4.7 | 5.2 |
| GK + 10 vs. 10 + GK (195 m2) | Official Match 1 | Official Match 2 | Official Match 3 | ||||
|---|---|---|---|---|---|---|---|
| M ± SD; Med | M ± SD; Med | p | M ± SD; Med | p | M ± SD; Med | p | |
| AvgTD | 1149.2 ± 81.5; 1149.0 | 1203.6 ± 74.7; 1203.6 | 0.017 | 1236.4 ± 105.2; 1236.4 | 0.012 | 1156.5 ± 87.1; 1156.5 | 0.877 |
| AvgMW | 107.1 ± 14.1;107.0 | 123.0 ± 16.6; 123.0 | 0.002 | 130.9 ± 31.7; 130.0 | 0.003 | 122.5 ± 12.0; 122.5 | 0.007 |
| GK + 10 vs. 10 + GK (241 m2) | |||||||
| AvgTD | 1064.6 ± 78.4;1064.6 | - | <0.001 | - | 0.001 | - | 0.008 |
| AvgMW | 101.1 ± 15.0; 101.1 | - | <0.001 | - | 0.001 | - | 0.001 |
| GK + 10 vs. 10 + GK (291 m2) | |||||||
| AvgTD | 1273.4 ± 101.9; 1273.4 | - | 0.026 | - | 0.196 | - | 0.011 |
| AvgMW | 124.5 ± 15.6; 124.5 | - | 0.918 | - | 0.717 | - | 0.437 |
Publisher’s Note: MDPI stays neutral with regard to jurisdictional claims in published maps and institutional affiliations. |
© 2022 by the authors. Licensee MDPI, Basel, Switzerland. This article is an open access article distributed under the terms and conditions of the Creative Commons Attribution (CC BY) license (https://creativecommons.org/licenses/by/4.0/).
Share and Cite
Caldeira, R.; Gouveia, É.R.; Ihle, A.; Marques, A.; Clemente, F.M.; Lopes, H.; Henriques, R.; Sarmento, H. The Relationship between Different Large-Sided Games and Official Matches on Professional Football Players’ Locomotor Intensity. Int. J. Environ. Res. Public Health 2022, 19, 4214. https://doi.org/10.3390/ijerph19074214
Caldeira R, Gouveia ÉR, Ihle A, Marques A, Clemente FM, Lopes H, Henriques R, Sarmento H. The Relationship between Different Large-Sided Games and Official Matches on Professional Football Players’ Locomotor Intensity. International Journal of Environmental Research and Public Health. 2022; 19(7):4214. https://doi.org/10.3390/ijerph19074214
Chicago/Turabian StyleCaldeira, Romualdo, Élvio Rúbio Gouveia, Andreas Ihle, Adilson Marques, Filipe Manuel Clemente, Helder Lopes, Ricardo Henriques, and Hugo Sarmento. 2022. "The Relationship between Different Large-Sided Games and Official Matches on Professional Football Players’ Locomotor Intensity" International Journal of Environmental Research and Public Health 19, no. 7: 4214. https://doi.org/10.3390/ijerph19074214
APA StyleCaldeira, R., Gouveia, É. R., Ihle, A., Marques, A., Clemente, F. M., Lopes, H., Henriques, R., & Sarmento, H. (2022). The Relationship between Different Large-Sided Games and Official Matches on Professional Football Players’ Locomotor Intensity. International Journal of Environmental Research and Public Health, 19(7), 4214. https://doi.org/10.3390/ijerph19074214