
The Environmental Impact Assessment of Sanitation Projects in Chile: Overview and Improvement Opportunities Focused on Follow-Ups


 , and
, and 
Abstract
1. Introduction
2. Methods
2.1. Study Area
2.2. Data Source
2.3. Selection of Projects
2.4. Selection of Indicators
2.5. Statistical Analysis
3. Results and Discussion
3.1. The Sanitation Projects in the Chilean EIA System
3.2. Comparison of Sanitation Projects Entered as EIS and EID
3.3. Improvement Opportunities of the EIA Process concerning to Sanitation Projects
4. Conclusions
Author Contributions
Funding
Institutional Review Board Statement
Informed Consent Statement
Data Availability Statement
Conflicts of Interest
Appendix A

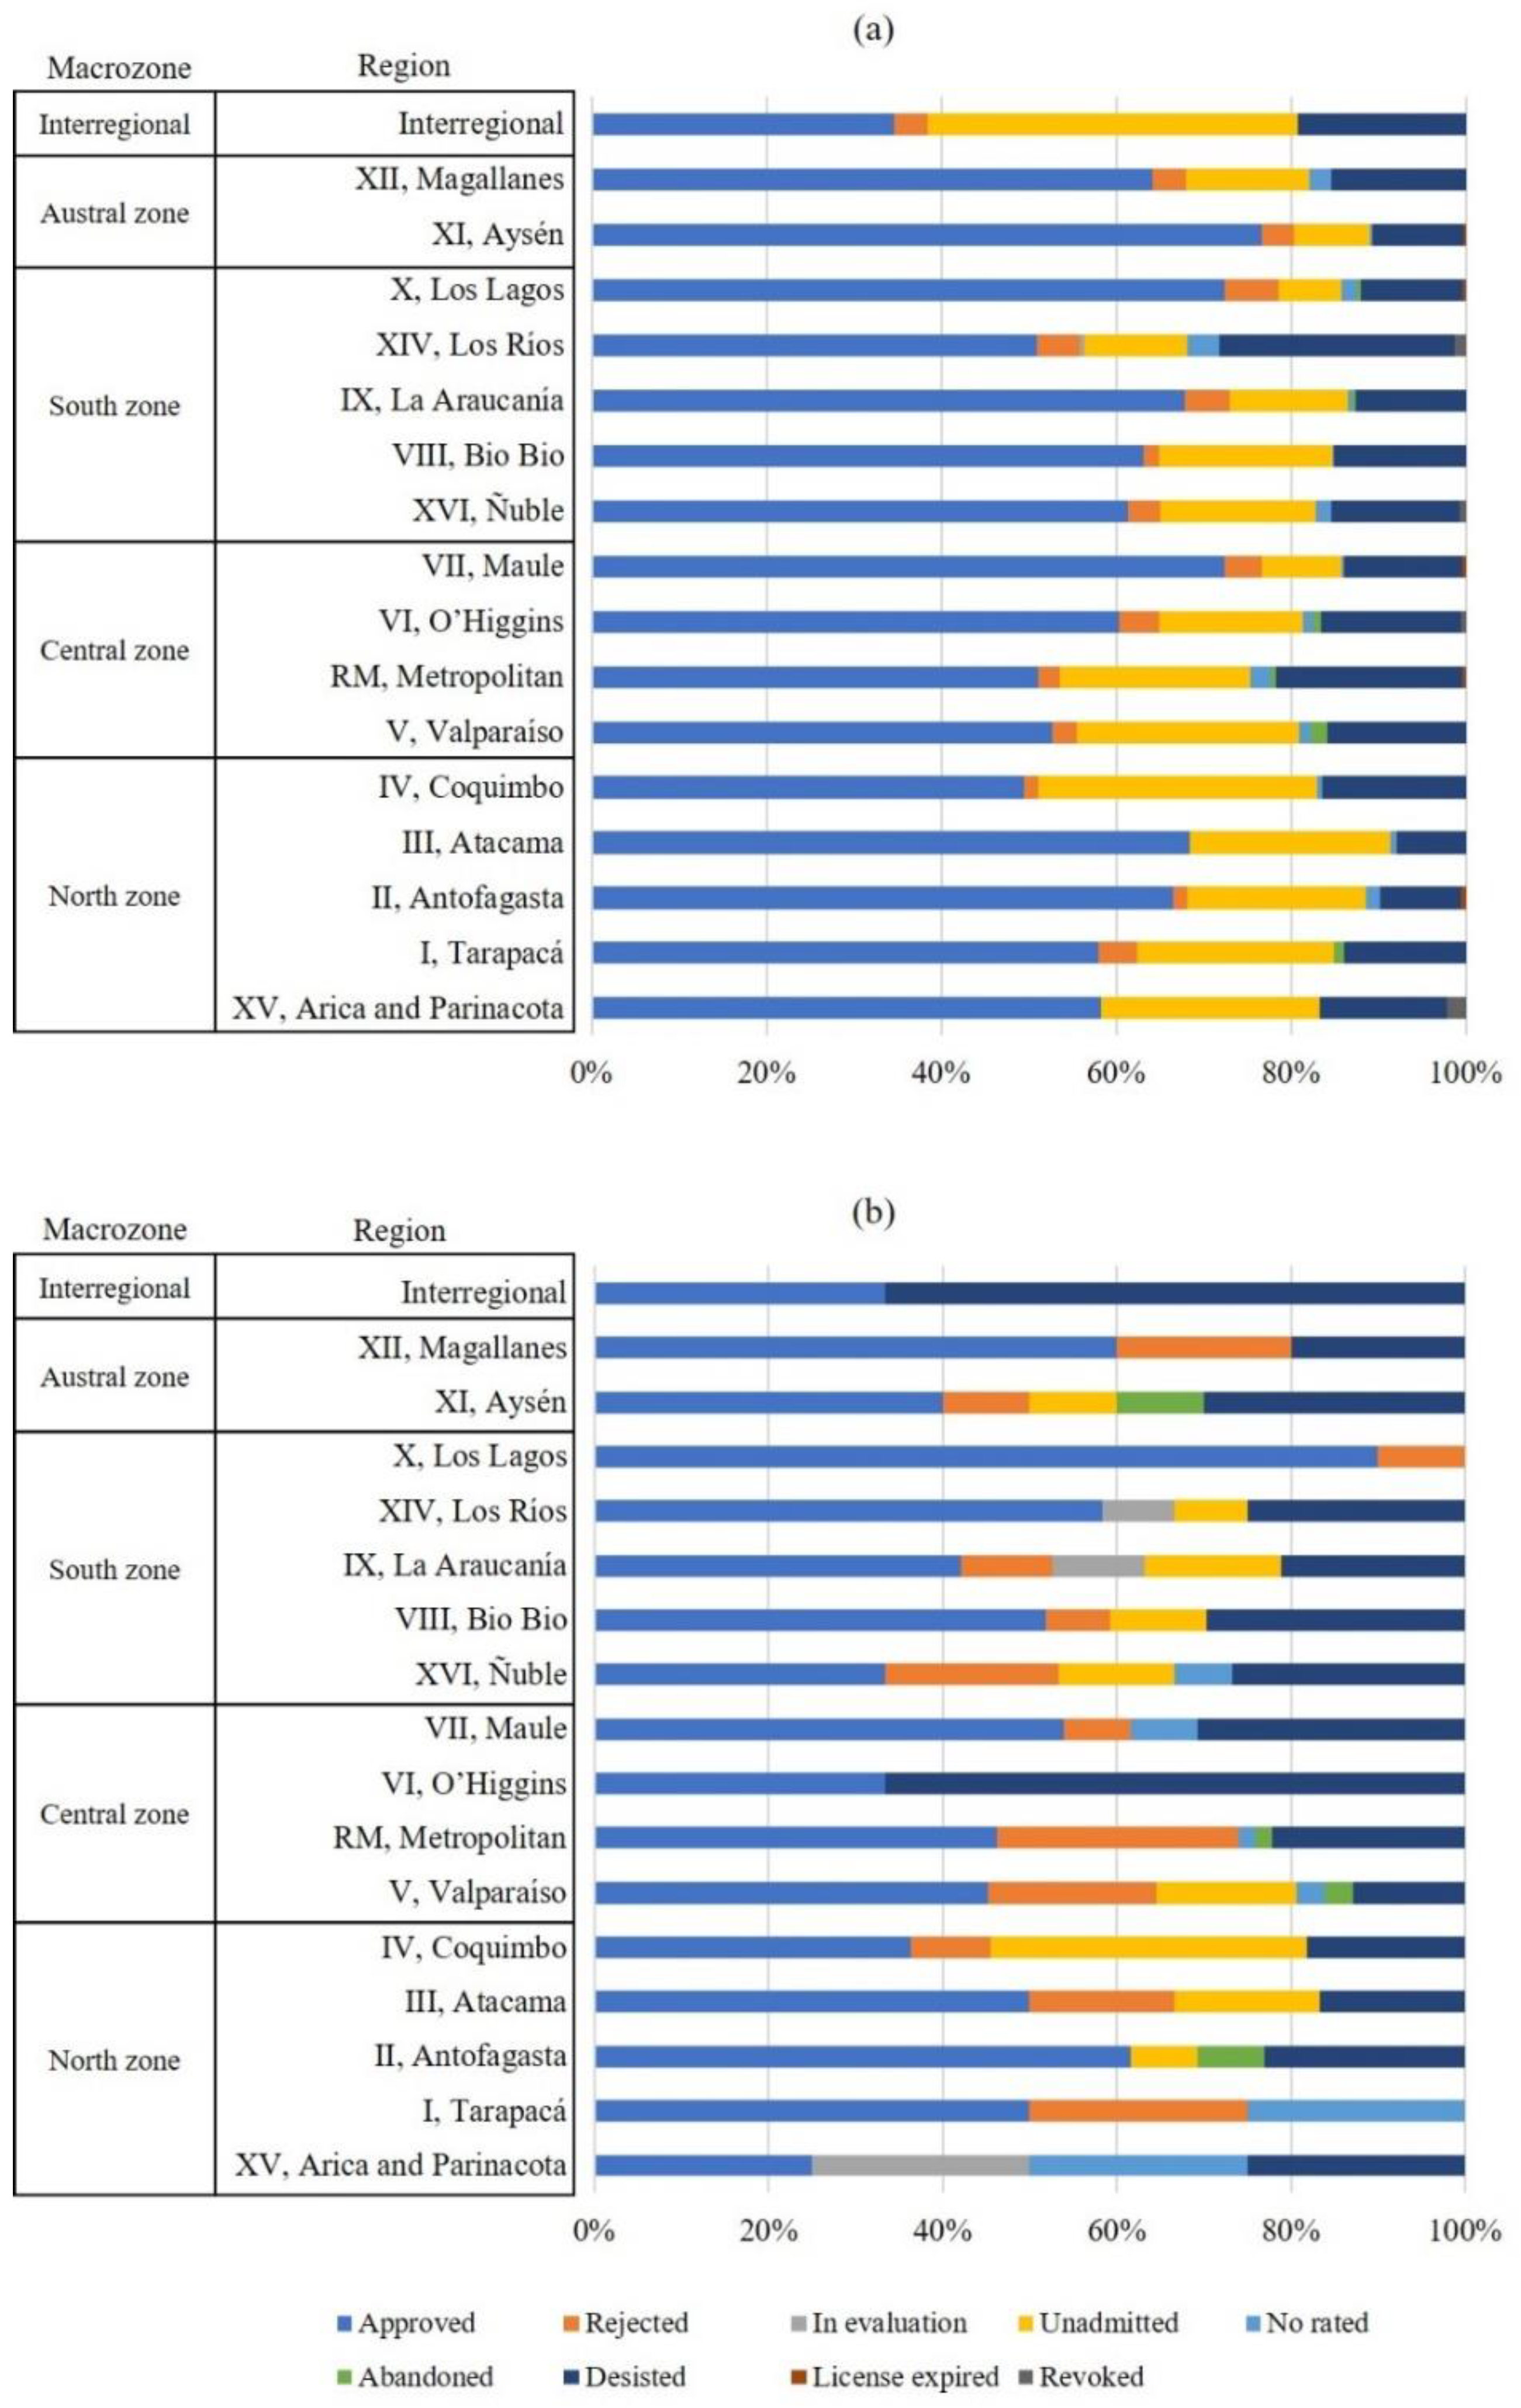
| Region | Approved | Rejected | In Evaluation | Unadmitted | No Rated | Abandoned | Desisted | License Expired | Revoked | |||||||||
|---|---|---|---|---|---|---|---|---|---|---|---|---|---|---|---|---|---|---|
| EIS | EID | EIS | EID | EIS | EID | EIS | EID | EIS | EID | EIS | EID | EIS | EID | EIS | EID | EIS | EID | |
| XV, Arica and Parinacota | 1 | 28 | 1 | 12 | 1 | 1 | 7 | 1 | ||||||||||
| I, Tarapacá | 2 | 54 | 1 | 4 | 21 | 1 | 1 | 13 | ||||||||||
| II, Antofagasta | 8 | 123 | 3 | 1 | 38 | 3 | 1 | 3 | 17 | 1 | ||||||||
| III, Atacama | 6 | 87 | 2 | 2 | 29 | 1 | 2 | 10 | ||||||||||
| IV, Coquimbo | 4 | 87 | 1 | 3 | 4 | 56 | 1 | 2 | 29 | |||||||||
| V, Valparaíso | 14 | 166 | 6 | 9 | 5 | 80 | 1 | 4 | 1 | 6 | 4 | 50 | ||||||
| RM, Metropolitan | 25 | 414 | 15 | 20 | 176 | 1 | 20 | 1 | 4 | 12 | 173 | 2 | 1 | |||||
| VI, O’Higgins | 2 | 267 | 20 | 73 | 5 | 4 | 4 | 71 | 2 | |||||||||
| VII, Maule | 7 | 480 | 1 | 28 | 61 | 1 | 2 | 4 | 90 | 2 | ||||||||
| XVI, Ñuble | 5 | 100 | 3 | 6 | 2 | 29 | 1 | 3 | 4 | 24 | 1 | |||||||
| VIII, Bio Bio | 14 | 223 | 2 | 6 | 3 | 70 | 1 | 8 | 53 | |||||||||
| IX, La Araucanía | 8 | 146 | 2 | 11 | 2 | 3 | 29 | 1 | 1 | 4 | 27 | |||||||
| XIV, Los Ríos | 7 | 83 | 8 | 1 | 1 | 1 | 19 | 6 | 3 | 44 | 2 | |||||||
| X, Los Lagos | 9 | 536 | 1 | 46 | 53 | 13 | 3 | 86 | 2 | 1 | ||||||||
| XI, Aysén | 4 | 316 | 1 | 15 | 1 | 36 | 1 | 1 | 3 | 43 | 1 | |||||||
| XII, Magallanes | 3 | 100 | 1 | 6 | 22 | 4 | 1 | 24 | ||||||||||
| Interregional | 1 | 9 | 1 | 11 | 2 | 5 | ||||||||||||
| Total | 120 | 3219 | 36 | 186 | 4 | 1 | 22 | 815 | 6 | 65 | 4 | 19 | 57 | 766 | 0 | 8 | 0 | 8 |
References
- Adejumoke, A.; Babatunde, A.; Abimbola, O.; Tabitha, A.; Adewumi, D.; Toyin, O. Water Pollution: Effects, Prevention, and Climatic Impact. Water Chall. Urban. World 2018, 33, 33–47. [Google Scholar] [CrossRef]
- Dharwal, M.; Parashar, D.; Shehu Shuaibu, M.; Garba, S.; Abubakar, S.; Baba Bala, B. Water pollution: Effects on health and environment of Dala LGA, Nigeria. Mater. Today Proc. 2020, 49, 3036–3039. [Google Scholar] [CrossRef]
- Salama, Y.; Chennaoui, M.; Sylla, A.; Mountadar, M.; Rihani, M.; Assobhei, O. Review of wastewater treatment and reuse in the Morocco: Aspects and perspectives. Int. J. Environ. Pollut. Res. 2014, 2, 9–25. [Google Scholar]
- United Nations. Sustainability Development Goals. 17 Goals to Transform Our World; United Nations: New York, NY, USA, 2021; Available online: https://www.un.org/sustainabledevelopment/ (accessed on 26 October 2021).
- World Health Organization. State of the World’s Sanitation: An Urgent Call to Transform Sanitation for Better Health, Environments, Economies and Societies; United Nations Children’s Fund (UNICEF) and the World Health Organization: New York, NY, USA, 2020; Available online: https://www.who.int/publications/i/item/9789240014473 (accessed on 30 November 2021).
- Zhou, X.; Li, Z.; Zheng, T.; Yan, Y.; Li, P.; Odey, E.A.; Mang, H.P.; Uddin, S. Review of global sanitation development. Environ. Int. 2018, 120, 246–261. [Google Scholar] [CrossRef]
- Supreme Decree 90 Establishes Emission Standards for the Regulation of Pollutants Associated with Discharges of Liquid Waste to Marine and Surface Continental Waters. In Official Journal of Chile; Government of Chile: Santiago, Chile, 2000.
- Chilean Regulation 1333 Water quality requirements for different uses. In Official Journal of Chile; Government of Chile: Santiago, Chile, 1978.
- Sanitary Sector Report of Superintendency of Sanitary Services; Government of Chile: Santiago, Chile, 2020. Available online: https://www.siss.gob.cl/586/articles-19431_recurso_1.pdf (accessed on 30 November 2021).
- Sanitary Sector Report of Superintendency of Sanitary Services; Government of Chile: Santiago, Chile, 2018. Available online: http://www.siss.gob.cl/586/articles-17722_recurso_1.pdf (accessed on 30 November 2021).
- Williams, C.J.R. Climate Change in Chile: An Analysis of State-of-the-Art Observations, Satellite-Derived Estimates and Climate Model Simulations. J. Earth Sci. Clim. Chang. 2017, 8, 400. [Google Scholar] [CrossRef]
- United Nations Convention on Biological Biodiversity. 1992. Available online: https://www.cbd.int/doc/legal/cbd-en.pdf (accessed on 30 November 2021).
- Sánchez, L.; Croal, P. Environmental impact assessment, from Rio 92 to +20 and beyond. Ambiente Soc. 2012, 15, 41–54. [Google Scholar] [CrossRef]
- Directive 2011/92/EU. Assessment of the effects of certain public and private projects on the environment. In Official Journal of the European Union; European Union Council: Brussels, Belgium, 2012; Volume L 26/1.
- Directive 2014/52/EU. Assessment of the effects of certain public and private projects on the environment. In Official Journal of the European Union; European Union Council: Brussels, Belgium, 2014; Volume L 124/1.
- Cave, B.; Pyper, R.; Fischer-Bonde, B.; Humboldt-Dachroeden, S.; Martin-Olmedo, P. Lessons from an International Initiative to Set and Share Good Practice on Human Health in Environmental Impact Assessment. Int. J. Environ. Res. Public Health 2021, 18, 1392. [Google Scholar] [CrossRef]
- Humboldt-Dachroeden, S.; Fischer-Bonde, B.; Gulis, G. Analysis of Health in Environmental Assessments—A Literature Review and Survey with a Focus on Denmark. Int. J. Environ. Res. Public Health 2019, 16, 4570. [Google Scholar] [CrossRef]
- Ferrer, Y. Seguimiento en el Tiempo de la Evaluación de Impacto Ambiental en Proyectos Mineros. Luna Azul 2016, 42, 256–269. [Google Scholar] [CrossRef]
- Law 20,417 Creates the Ministry of the Environment, the Environmental Assessment Service and the Superintendence of the Environment. In Official Journal of Chile; Government of Chile: Santiago, Chile, 2010.
- Supreme Decree 30 Regulation of the Environmental Impact Assessment System (repealed). In Official Journal of Chile; Government of Chile: Santiago, Chile, 1997.
- Supreme Decree 95 Regulation of the Environmental Impact Assessment System (repealed). In Official Journal of Chile; Government of Chile: Santiago, Chile, 2001.
- Supreme Decree 40 Regulation of the Environmental Impact Assessment System. In Official Journal of Chile; Government of Chile: Santiago, Chile, 2012.
- Supreme Decree 148 Sanitary Regulation on Hazardous waste Management. In Official Journal of Chile; Government of Chile: Santiago, Chile, 2003.
- Wood, C. Evaluación de Impacto Ambiental un Análisis Comparativo de Ocho Sistemas EIA, Doc de Trabajo N° 247; Centro de Estudios Públicos: Santiago, Chile, 1995. [Google Scholar]
- Annandale, D. Developing and evaluating environmental impact assessment systems for small developing countries. Impact Assess. Proj. Apprais. 2001, 19, 187–193. [Google Scholar] [CrossRef]
- Ahmad, B.; Wood, C. A comparative evaluation of the EIA systems in Egypt, Turkey and Tunisia. Environ. Environ. Impact Assess. Rev. 2002, 22, 213–234. [Google Scholar] [CrossRef]
- Khosravi, F.; Jha-Thakur, U.; Fischer, B. Evaluation of the environmental impact assessment system in Iran. Environ. Impact Assess. Rev. 2019, 74, 63–72. [Google Scholar] [CrossRef]
- Rodríguez-Luna, D.; Vela, N.; Alcalá, F.J.; Encina-Montoya, F. The environmental impact assessment in Chile: Overview, improvements, and comparisons. Environ. Impact Assess. Rev. 2021, 86, 106502. [Google Scholar] [CrossRef]
- Presidential Advisory Commission for the Evaluation of the EIA System; Technical Report; Gobierno de Chile: Santiago, Chile, 2017.
- Bergamini, K. Fiscalización y Cumplimiento Ambiental en Chile: Principales Avances, Desafíos y Tareas Pendientes. EURE 2015, 41, 267–277. [Google Scholar] [CrossRef]
- Superintendencia del Medio Ambiente. Resolución Exenta 85 Aprueba Bases Metodológicas Para la Determinación de Sanciones Ambientales–Actualización de la Superintendencia del Medio Ambiente y Revoca Resolución que Indica; Gobierno de Chile: Santiago, Chile, 2018.
- Superintendencia del Medio Ambiente. Bases Metodológicas Para la Determinación de Sanciones Ambientales–Actualización; Gobierno de Chile: Santiago, Chile, 2017.
- Dipper, B. Monitoring and Post-auditing in Environmental Impact Assessment: A Review. J. Environ. Plan. Manag. 1998, 41, 731–747. [Google Scholar] [CrossRef]
- Solbär, L.; Keskitalo, E.C.H. A Role for Authority Supervision in Impact Assessment? Examples from Finnish EIA Reviews. Arct. Rev. 2017, 8. [Google Scholar] [CrossRef]
- National Statistics Institute. Synthesis of Results: Census 2017; Government of Chile: Santiago, Chile, 2018. Available online: https://www.ine.cl/docs/default-source/censo-de-poblacion-y-vivienda/publicaciones-y-anuarios/2017/publicaci%C3%B3n-de-resultados/sintesis-de-resultados-censo2017.pdf?sfvrsn=1b2dfb06_6 (accessed on 10 November 2021).
- Rodríguez-Luna, D.; Vela, N.; Alcalá, F.J.; Encina-Montoya, F. The Environmental Impact Assessment in Aquaculture Projects in Chile: A Retrospective and Prospective Review Considering Cultural Aspects. Sustainability 2021, 13, 9006. [Google Scholar] [CrossRef]
- Lacy, S. Can environmental impact assessments alone conserve fresh water fish biota? Review of the Chilean experience. Environ. Impact Assess. Rev. 2017, 63, 87–94. [Google Scholar] [CrossRef]
- Campero, C.; Harris, L.; Kunz, N. De-politicising seawater desalination: Environmental Impact Assessments in the Atacama mining Region, Chile. Environ. Sci. Policy 2021, 120, 187–194. [Google Scholar] [CrossRef]
- Otzen, T.; Manterola, C. Técnicas de Muestreo sobre una Población a Estudio. Int. J. Morphol. 2017, 35, 227–232. [Google Scholar] [CrossRef]
- García-García, J.; Reding-Bernal, A.; López-Alvarenga, J.C. Cálculo del tamaño de la muestra en investigación en educación médica. Investigación Educación Médica 2013, 2, 217–224. Available online: http://www.scielo.org.mx/scielo.php?script=sci_arttext&pid=S2007-50572013000400007&lng=es&tlng=es (accessed on 30 November 2021). [CrossRef]
- López-Roldan, P.; Fachelli, S. Metodología de la Investigación Social Cuantitativa; Edición digital; Universidad Autónoma de Barcelona: Barcelona, Spain, 2015; Available online: http://ddd.uab.cat/record/129382 (accessed on 1 December 2021).
- Taherdoost, H. Sampling Methods in Research Methodology; How to Choose a Sampling Technique for Research. Int. J. Acad. Res. Manag. 2016, 5, 18–27. [Google Scholar] [CrossRef]
- Aguilar-Barojas, S. Fórmulas para el cálculo de la muestra en investigaciones de salud. Salud Tabasco 2005, 11, 333–338. Available online: https://www.redalyc.org/articulo.oa?id=48711206 (accessed on 25 February 2022).
- Arvidsson, R. On the use of ordinal scoring scales in social life cycle assessment. Int. J. Life Cycle Assess. 2019, 24, 604–606. [Google Scholar] [CrossRef]
- Fayers, P.M.; Hand, D.J. Causal variables, indicator variables and measurement scales: An example from quality of life. J. Royal Stat. Soc. Ser. A (Stat. Soc.) 2002, 165, 233–253. [Google Scholar] [CrossRef]
- Gower, J.C. A Q-technique for the calculation of canonical variates. Biometrika 1966, 53, 588–590. [Google Scholar] [CrossRef]
- Anderson, M.J.; Willis, T.J. Canonical Analysis of Principal Coordinates: A useful Method of constrained ordination for Ecology. Ecology 2003, 84, 511–525. [Google Scholar] [CrossRef]
- Clarke, K.; Gorley, R.; Somerfield, P.; Warwick, R. Change in Marine Communities: An Approach to Statistical Analysis and Interpretation, 3rd ed.; Primer-E Ltd.: Plymouth, UK, 2014. [Google Scholar]
- Servicio de Evaluación Ambiental. Guía de Evaluación de Impacto Ambiental Riesgo para la Salud de la Población en el Sistema de Evaluación de Impacto Ambiental; Gobierno de Chile: Santiago, Chile, 2012.
- Catrinu-Renström, M.; David, B.; Bakken, T.; Marttunen, M.; Mochet, A.; Roel, M.; Frank, H. Multi-criteria analysis applied to environmental impacts of hydropower and water resources regulation projects. SINTEF Energy Res. Rep. TR A7339 2013, 1, 30–38. [Google Scholar] [CrossRef]
- Gulis, G. Compliance, adherence, or implementation? Int. J. Public Health 2019, 64, 411–412. [Google Scholar] [CrossRef]


| Letter | Description |
|---|---|
| o.1 | Sewage systems for ≥10,000 inhabitants. |
| o.2 | Sewage systems or stormwater evacuation facilities when they are interconnected for ≥10,000 inhabitants. |
| o.3 | Drinking water systems that include uptaking and conveying water works, and intermediate processes to the user place for ≥10,000 inhabitants. |
| o.4 | Wastewater treatment plants for ≥2500 inhabitants. |
| o.5 | Treatment and/or disposal plants for solid waste from domestic and sanitary origin, transfer stations, and collection and classification centers serving ≥5000 inhabitants. |
| o.6 | Submarine emissaries. |
| o.7 | Treatment and/or disposal plants for liquid industrial waste, which meet one of the following conditions at least: (o.7.1) Include stabilization ponds. (o.7.2) Effluents are reused for irrigation, infiltration, sprinkling, and vial wash-down. (o.7.3) Provide treatment waste services to third parties. (o.7.4) Treatment of effluents with average daily pollutant load ≥ the equivalent sewage for 100 inhabitants, in one or more of the discharge quality standards. |
| o.8 | Treatment and/or disposal systems for solid industrial waste with treatment capacity ≥30 tons per day or ≥50 tons of disposal. |
| o.9 | Treatment and/or disposal and/or elimination systems for hazardous waste with treatment capacity of 1000 kg per day and 25 kg per day for those catalogued as “acute toxic” waste according to the Supreme Decree SD148 of 2003 of the Ministry of Health [23]. |
| o.10 | Treatment and/or disposal and/or elimination systems for special hazardous waste from human health requirements, with treatment capacity ≥250 kg per day. |
| o.11 | Repair or recovery of contaminated areas covering ≥1 hectare. |
| Macrozone | Region | Way for Projects’ Entry | |
|---|---|---|---|
| EIS | EID | ||
| North Zone | XV, Arica and Parinacota | 1 | 2 |
| I, Tarapacá | 1 | 2 | |
| II, Antofagasta | 1 | 2 | |
| III, Atacama | 2 | 1 | |
| IV, Coquimbo | 3 | ||
| Central Zone | V, Valparaíso | 1 | 3 |
| RM, Metropolitan | 2 | 7 | |
| VI, O’Higgins | 4 | ||
| VII, Maule | 1 | 9 | |
| South Zone | XVI, Ñuble | 1 | 2 |
| VIII, Bio Bio | 1 | 4 | |
| IX, La Araucanía | 1 | 3 | |
| XIV, Los Ríos | 1 | 1 | |
| X, Los Lagos | 1 | 10 | |
| Austral Zone | XI, Aysén | 1 | 6 |
| XII, Magallanes | 2 | ||
| 15 | 61 | ||
| Indicator | Description | Options | Score | References |
|---|---|---|---|---|
| A | Processing time (working days) | ≥361 | 1 | [36] |
| 271–360 | 2 | |||
| 181–270 | 3 | |||
| 91–180 | 4 | |||
| 1–90 | 5 | |||
| B | Description of the influence area | No information | 1 | [36] |
| Information not justified | 2 | |||
| General information only | 3 | |||
| Moderately justified information | 4 | |||
| Detailed and justified information | 5 | |||
| C | Methodology to identify and evaluate environmental impacts | Yes | 2 | [29,36] |
| No | 1 | |||
| D | Use of reference international regulations | Yes | 2 | [29,36] |
| No | 1 | |||
| E | Existence of mitigation measures | Yes | 2 | [26,36] |
| No | 1 | |||
| F | Existence of compensation measures | Yes | 2 | [26,36] |
| No | 1 | |||
| G | Existence of repair measures | Yes | 2 | [26,36] |
| No | 1 | |||
| H | Identification of contingency and emergency measures | Yes | 2 | [26,36] |
| No | 1 | |||
| I | Consultation and participation | Yes | 2 | [24,26,27,36] |
| No | 1 | |||
| J | Appeal after project approval or rejection | Yes | 2 | [26,36] |
| No | 1 | |||
| K | Public information after the environmental license is obtained | Yes | 2 | [32] |
| No | 1 | |||
| L | Post-auditing | No information about supervision or Unsupervised project | 1 | [28,29] |
| Project without non-compliance | 2 | |||
| Breach of the environmental license or Sector Permits | 3 | |||
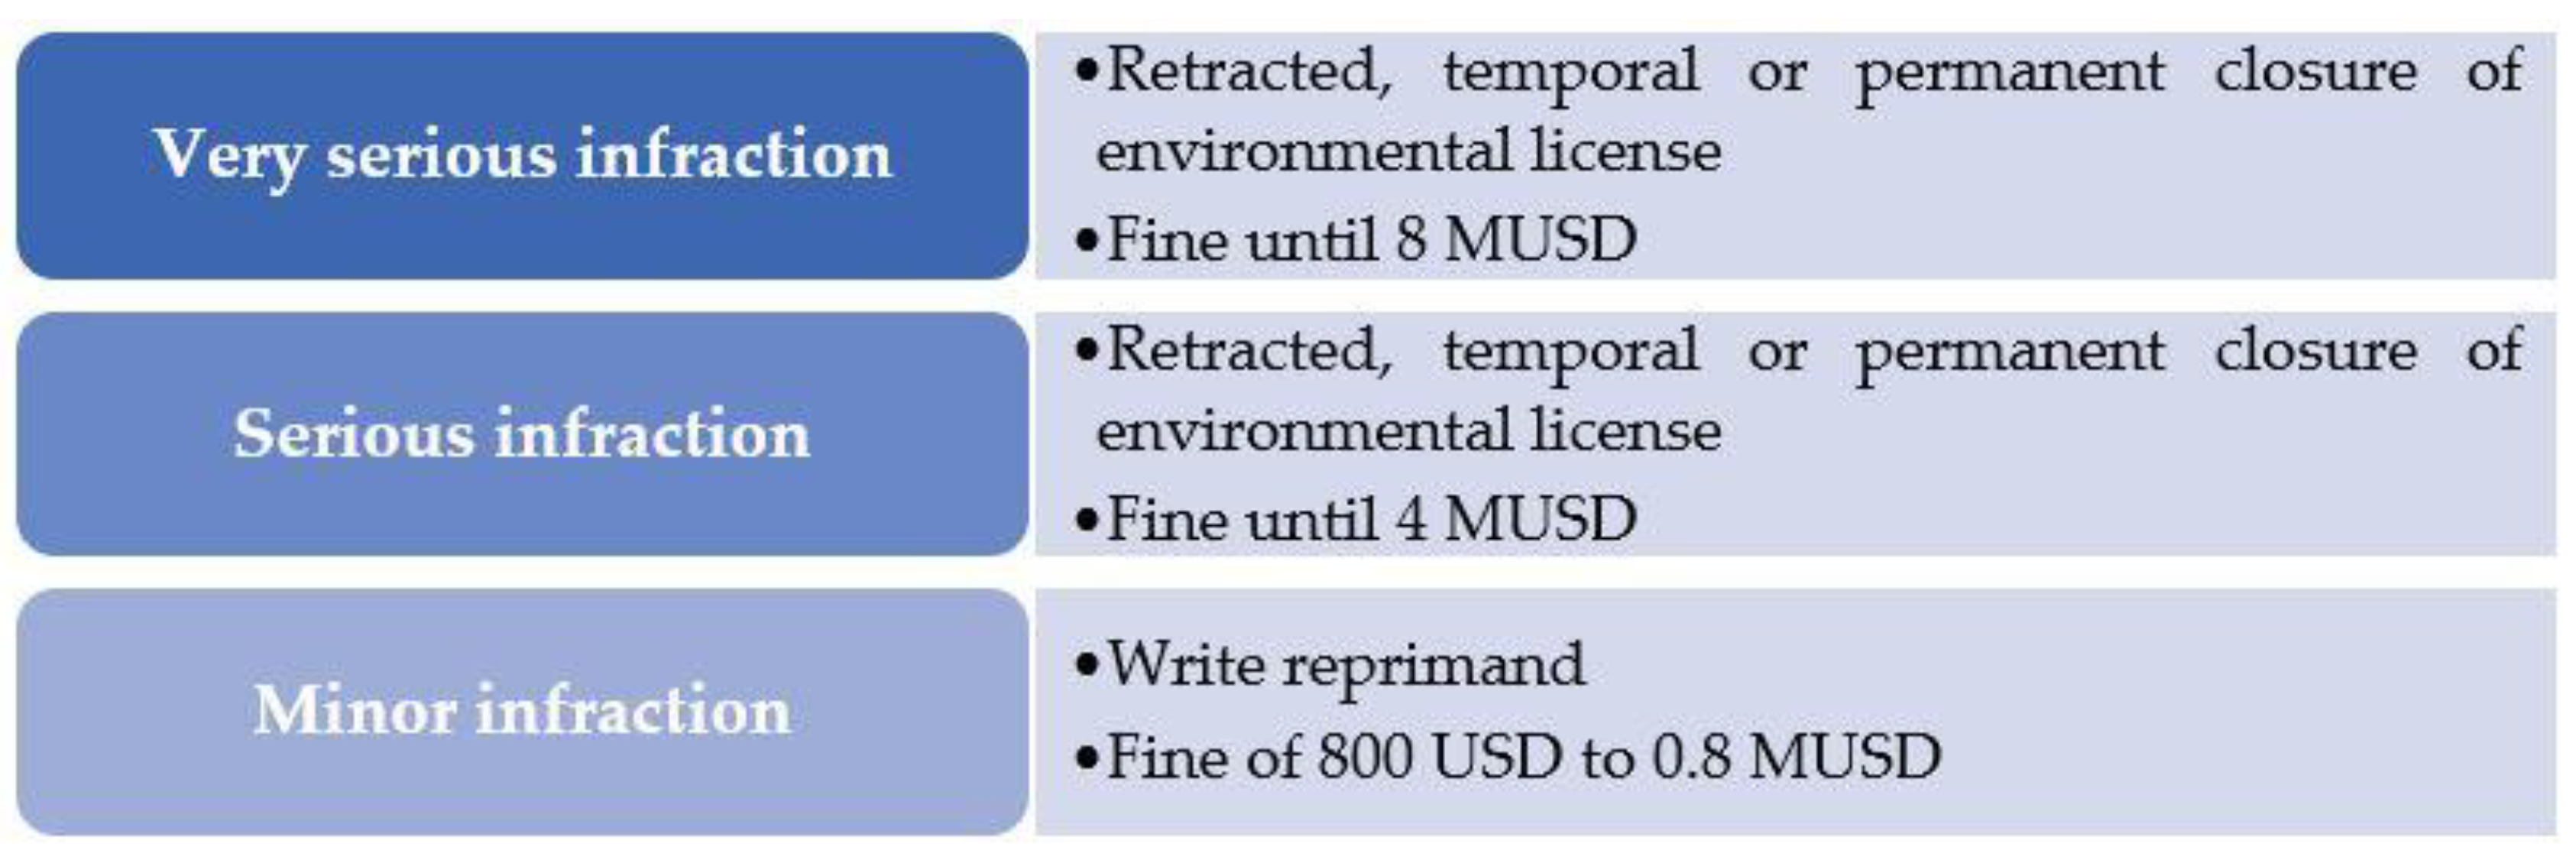
| M | Punishment for non-compliance | No information | 1 | [28,29] |
| Project without infraction | 2 | |||
| No classified or minor infraction | 3 | |||
| Serious infraction | 4 | |||
| Very serious infraction | 5 | |||
| N | Investment (MUSD) | 0–0.5 | 1 | – |
| >0.5–1 | 2 | |||
| >1–10 | 3 | |||
| >10–100 | 4 | |||
| >100 | 5 |
Publisher’s Note: MDPI stays neutral with regard to jurisdictional claims in published maps and institutional affiliations. |
© 2022 by the authors. Licensee MDPI, Basel, Switzerland. This article is an open access article distributed under the terms and conditions of the Creative Commons Attribution (CC BY) license (https://creativecommons.org/licenses/by/4.0/).
Share and Cite
Rodríguez-Luna, D.; Alcalá, F.J.; Encina-Montoya, F.; Vela, N. The Environmental Impact Assessment of Sanitation Projects in Chile: Overview and Improvement Opportunities Focused on Follow-Ups. Int. J. Environ. Res. Public Health 2022, 19, 3964. https://doi.org/10.3390/ijerph19073964
Rodríguez-Luna D, Alcalá FJ, Encina-Montoya F, Vela N. The Environmental Impact Assessment of Sanitation Projects in Chile: Overview and Improvement Opportunities Focused on Follow-Ups. International Journal of Environmental Research and Public Health. 2022; 19(7):3964. https://doi.org/10.3390/ijerph19073964
Chicago/Turabian StyleRodríguez-Luna, Dante, Francisco Javier Alcalá, Francisco Encina-Montoya, and Nuria Vela. 2022. "The Environmental Impact Assessment of Sanitation Projects in Chile: Overview and Improvement Opportunities Focused on Follow-Ups" International Journal of Environmental Research and Public Health 19, no. 7: 3964. https://doi.org/10.3390/ijerph19073964
APA StyleRodríguez-Luna, D., Alcalá, F. J., Encina-Montoya, F., & Vela, N. (2022). The Environmental Impact Assessment of Sanitation Projects in Chile: Overview and Improvement Opportunities Focused on Follow-Ups. International Journal of Environmental Research and Public Health, 19(7), 3964. https://doi.org/10.3390/ijerph19073964