
Impact of Short-Term Exposure to Extreme Temperatures on Mortality: A Multi-City Study in Belgium

 , , and
Abstract
:1. Introduction
2. Materials and Methods
2.1. Study Area
2.2. Data Collection
2.3. Statistical Analyses
2.3.1. Agglomeration-Specific Associations
2.3.2. Pooled Association
2.4. Cause-Specific Deaths and Subgroup Analyses
2.5. Sensitivity Analyses
3. Results
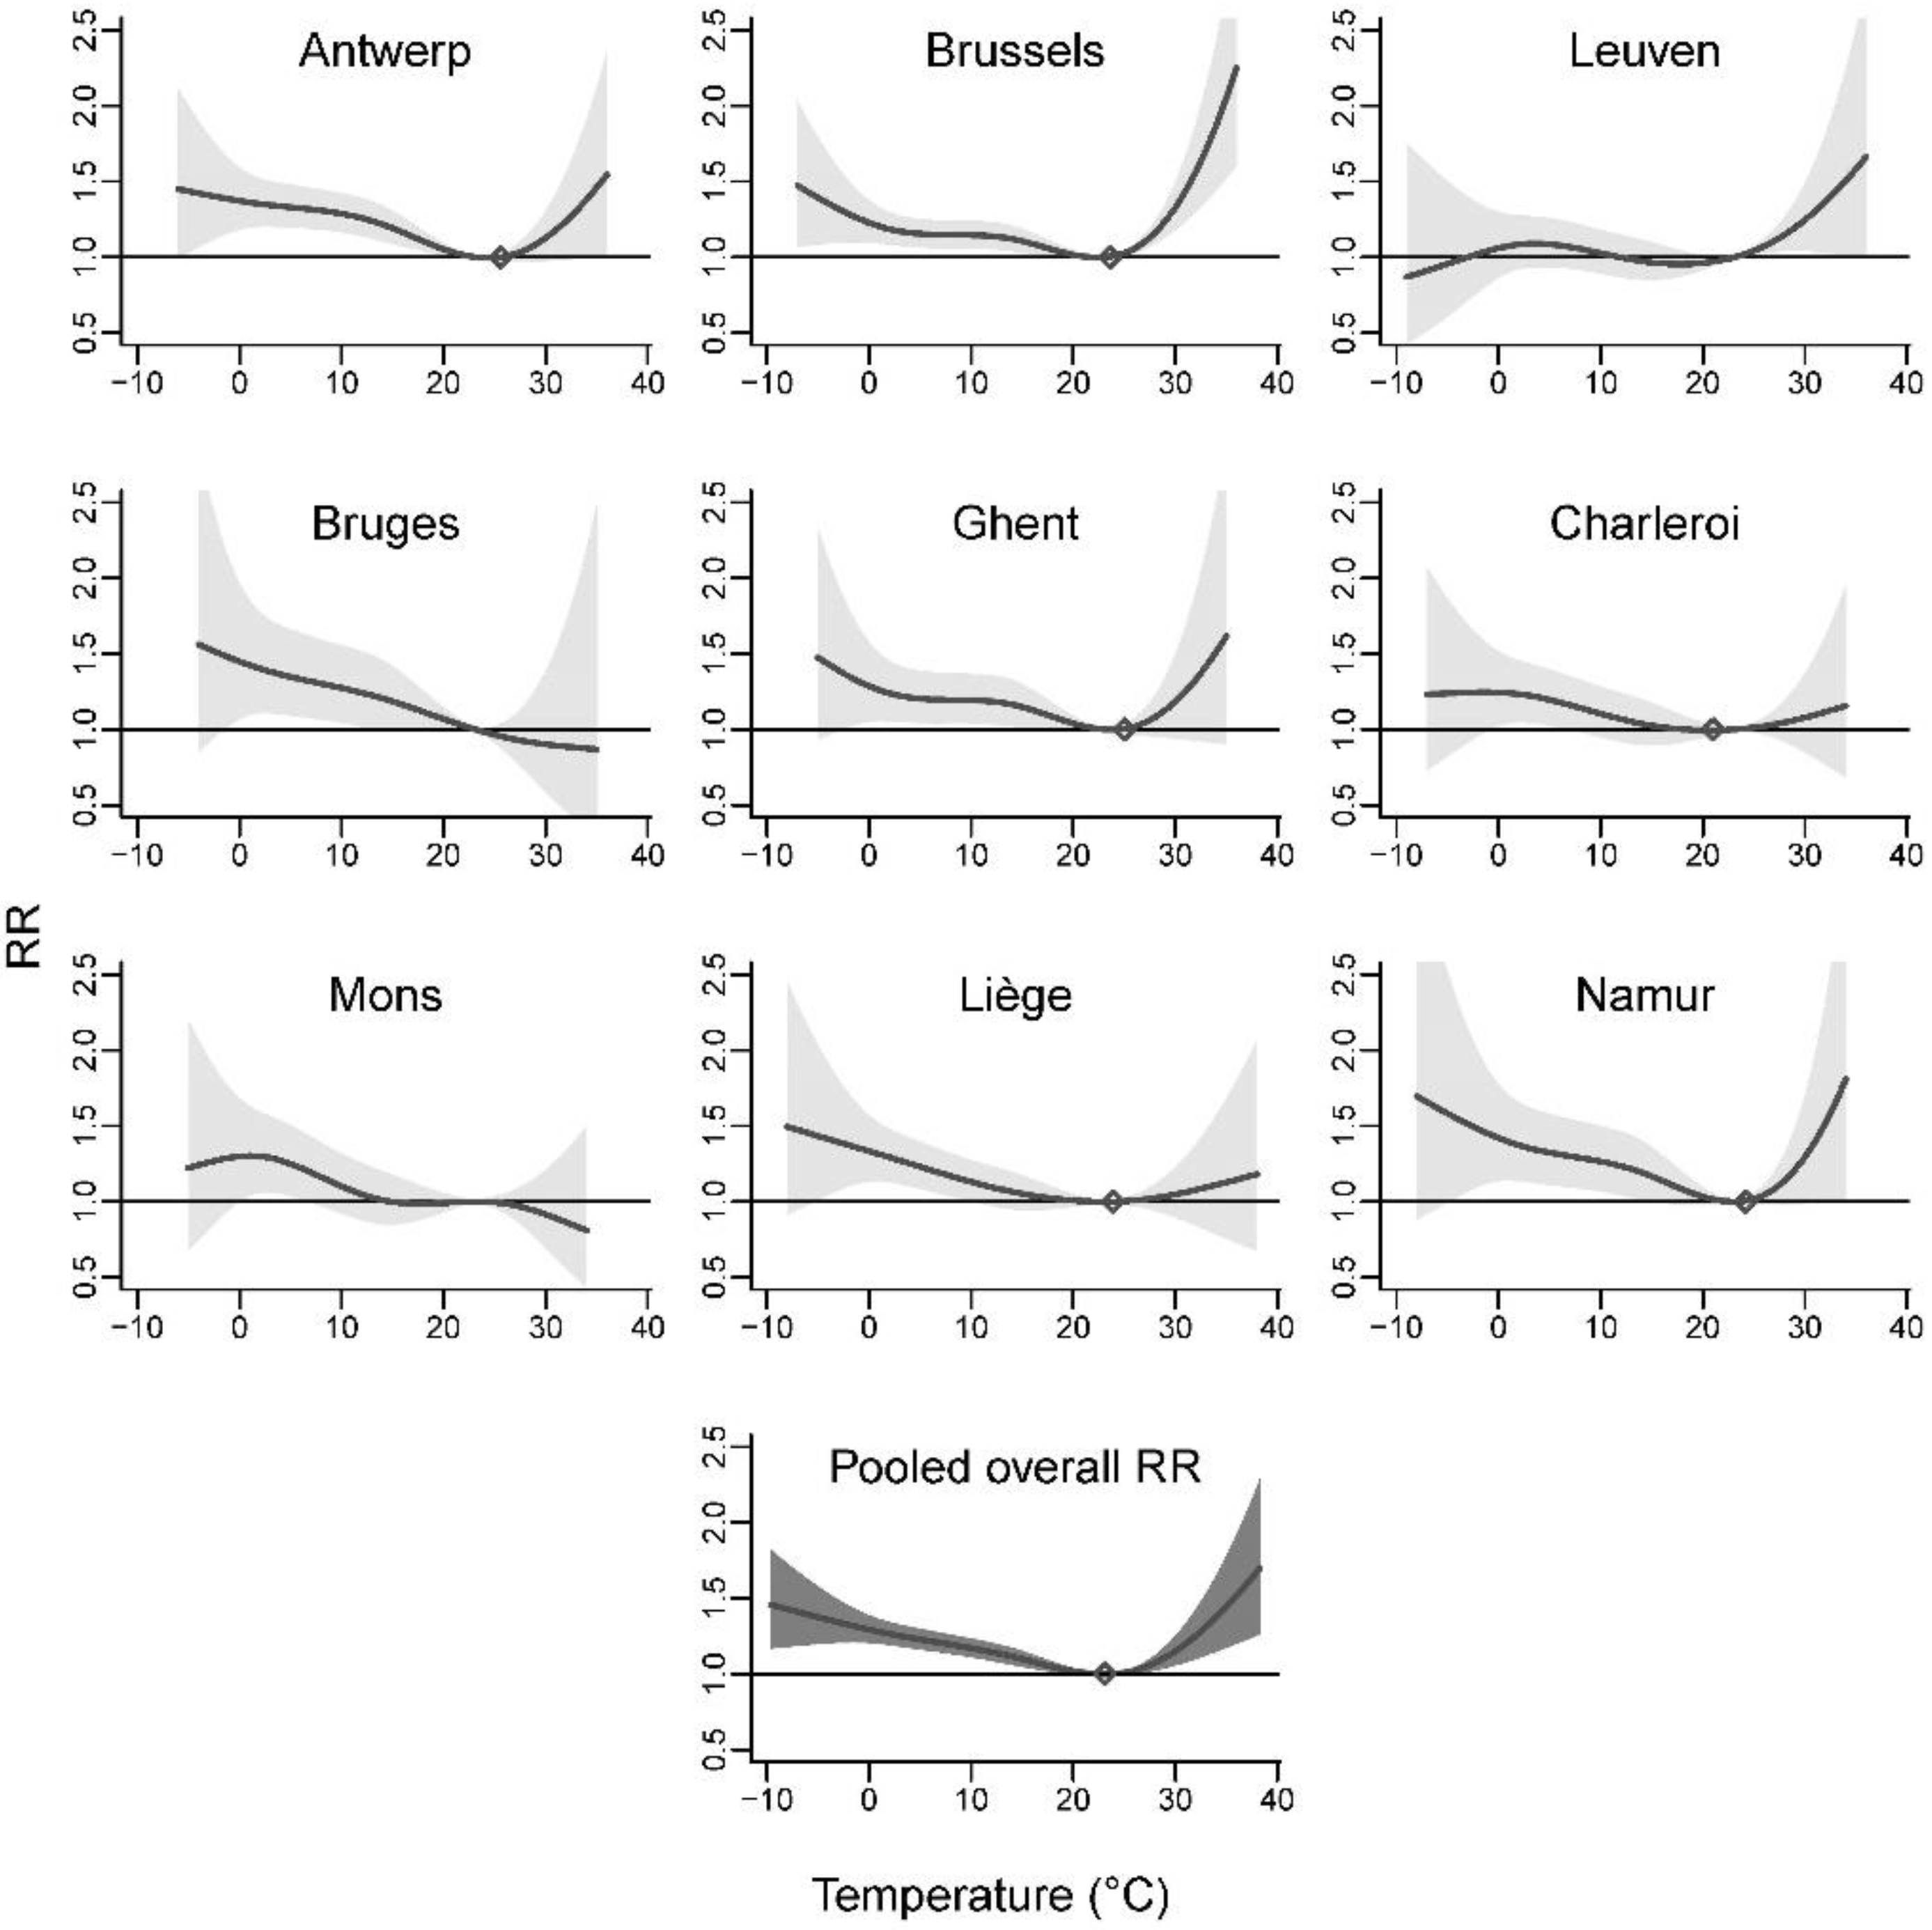
3.1. Agglomeration-Specific Associations
3.2. Pooled Association
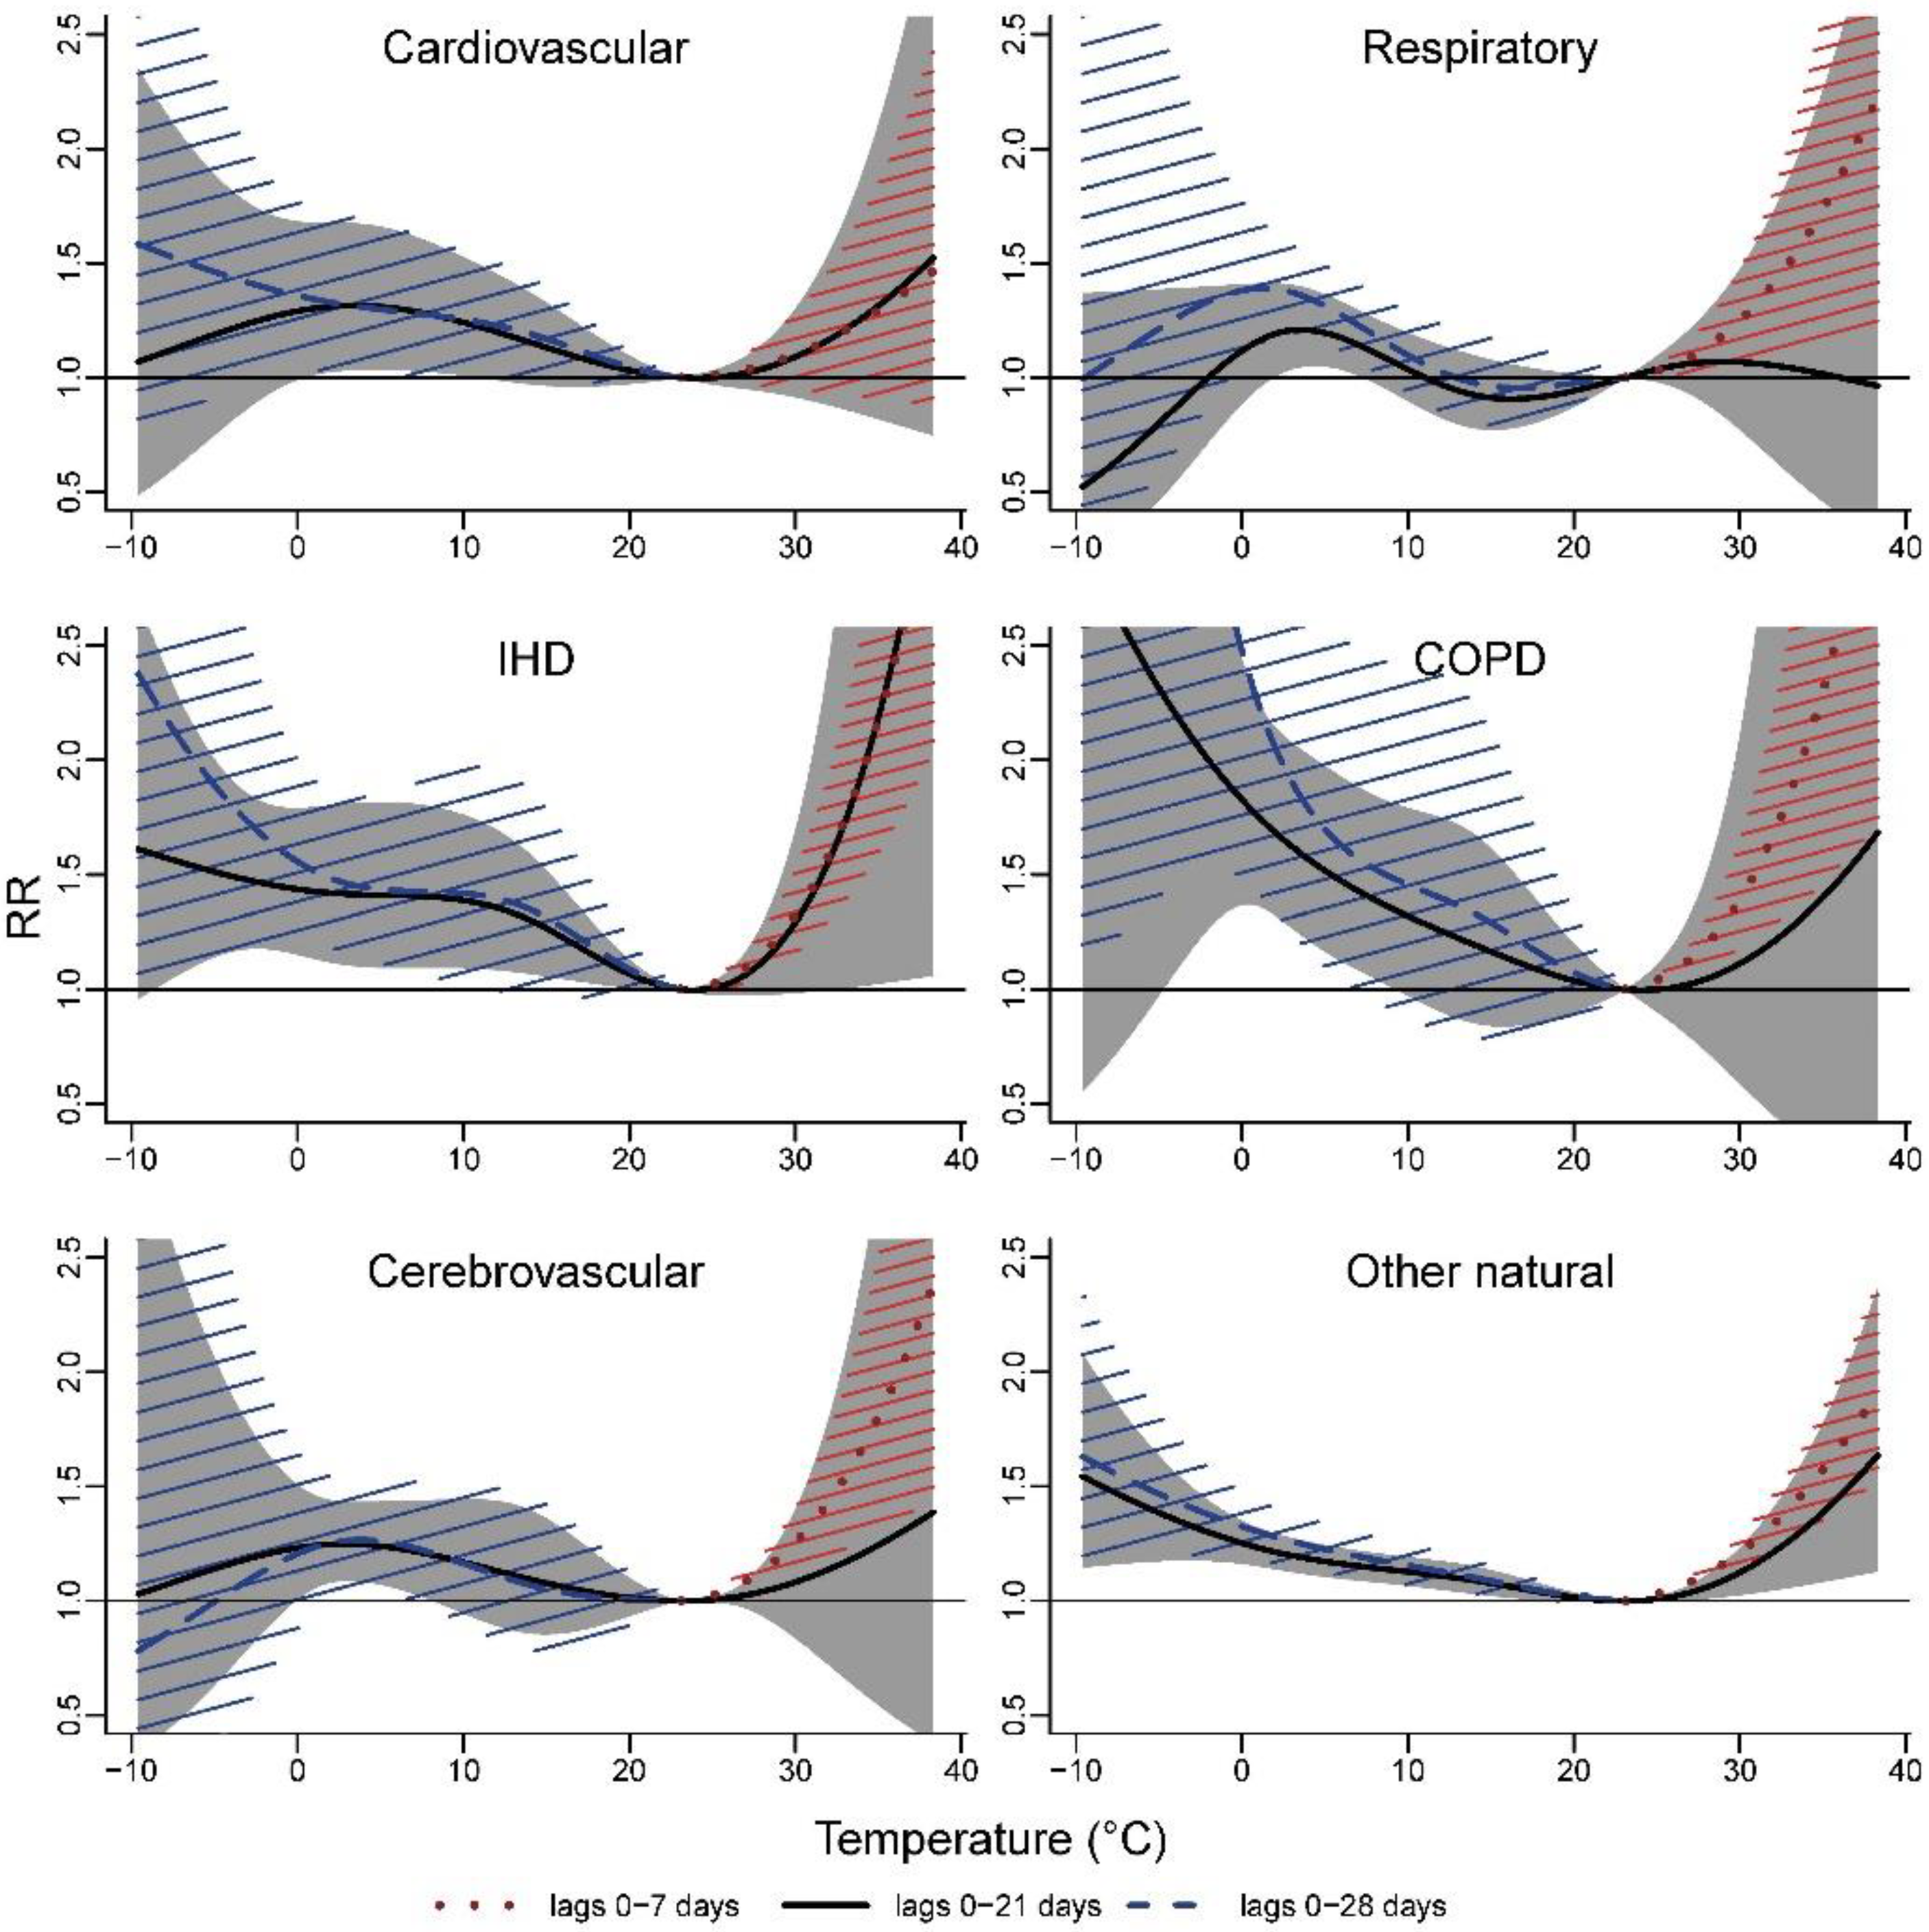
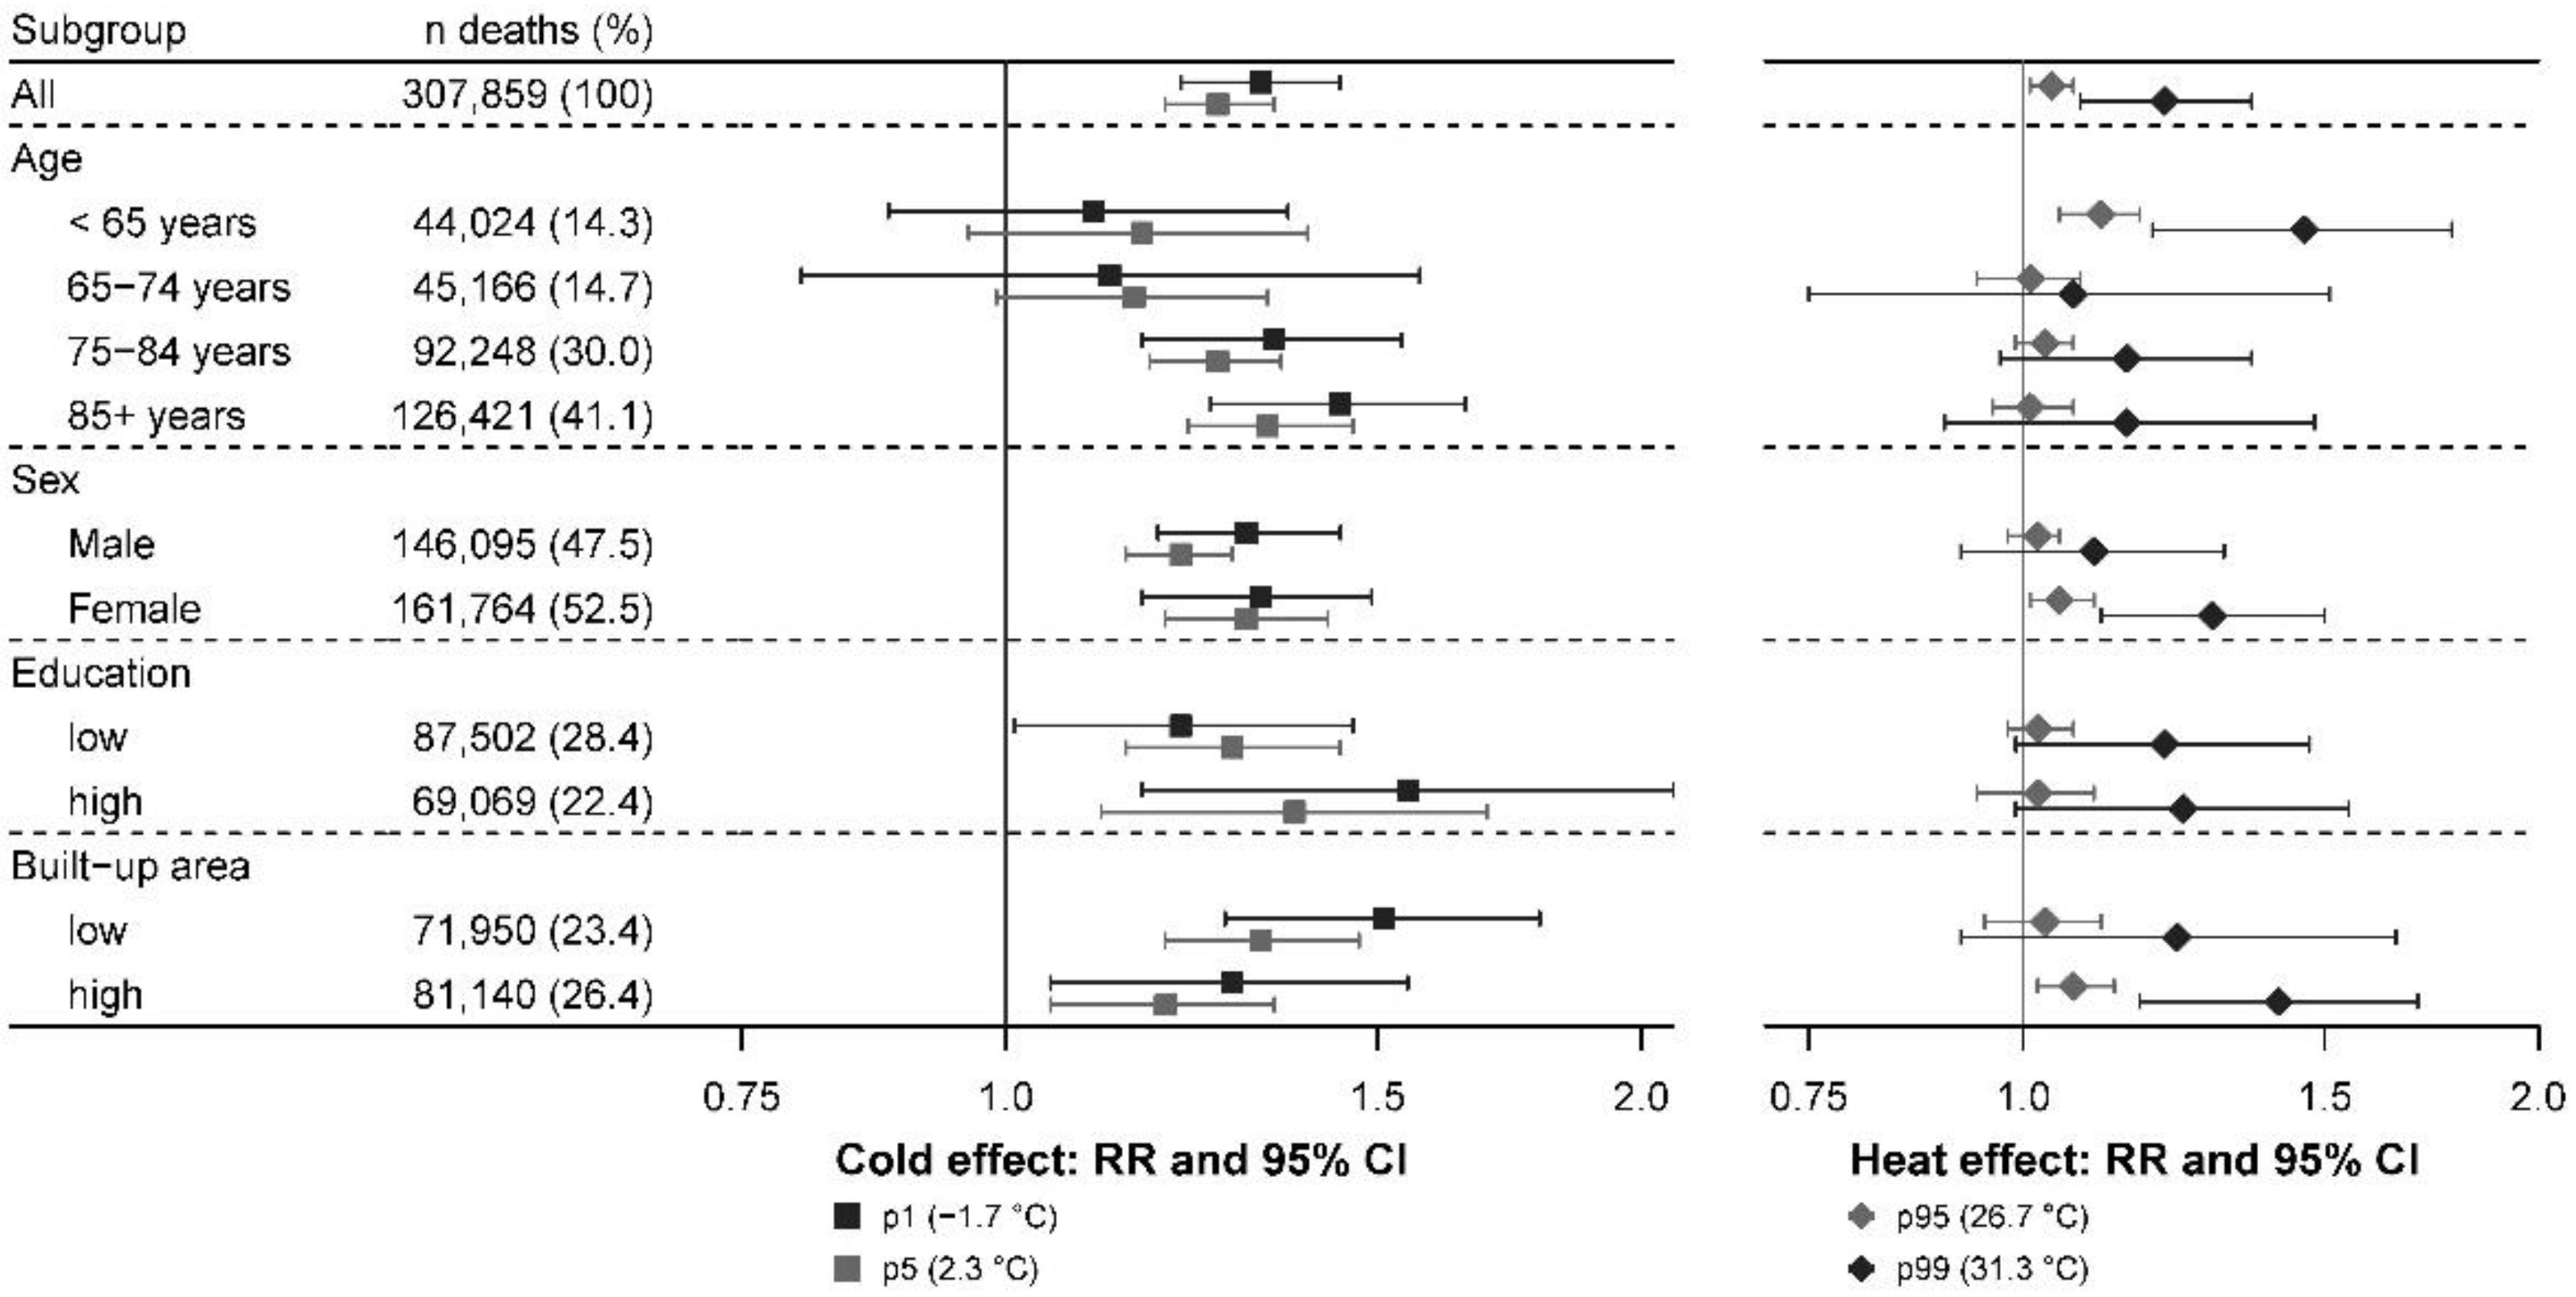
3.3. Cause-Specific Deaths and Subgroup Analyses
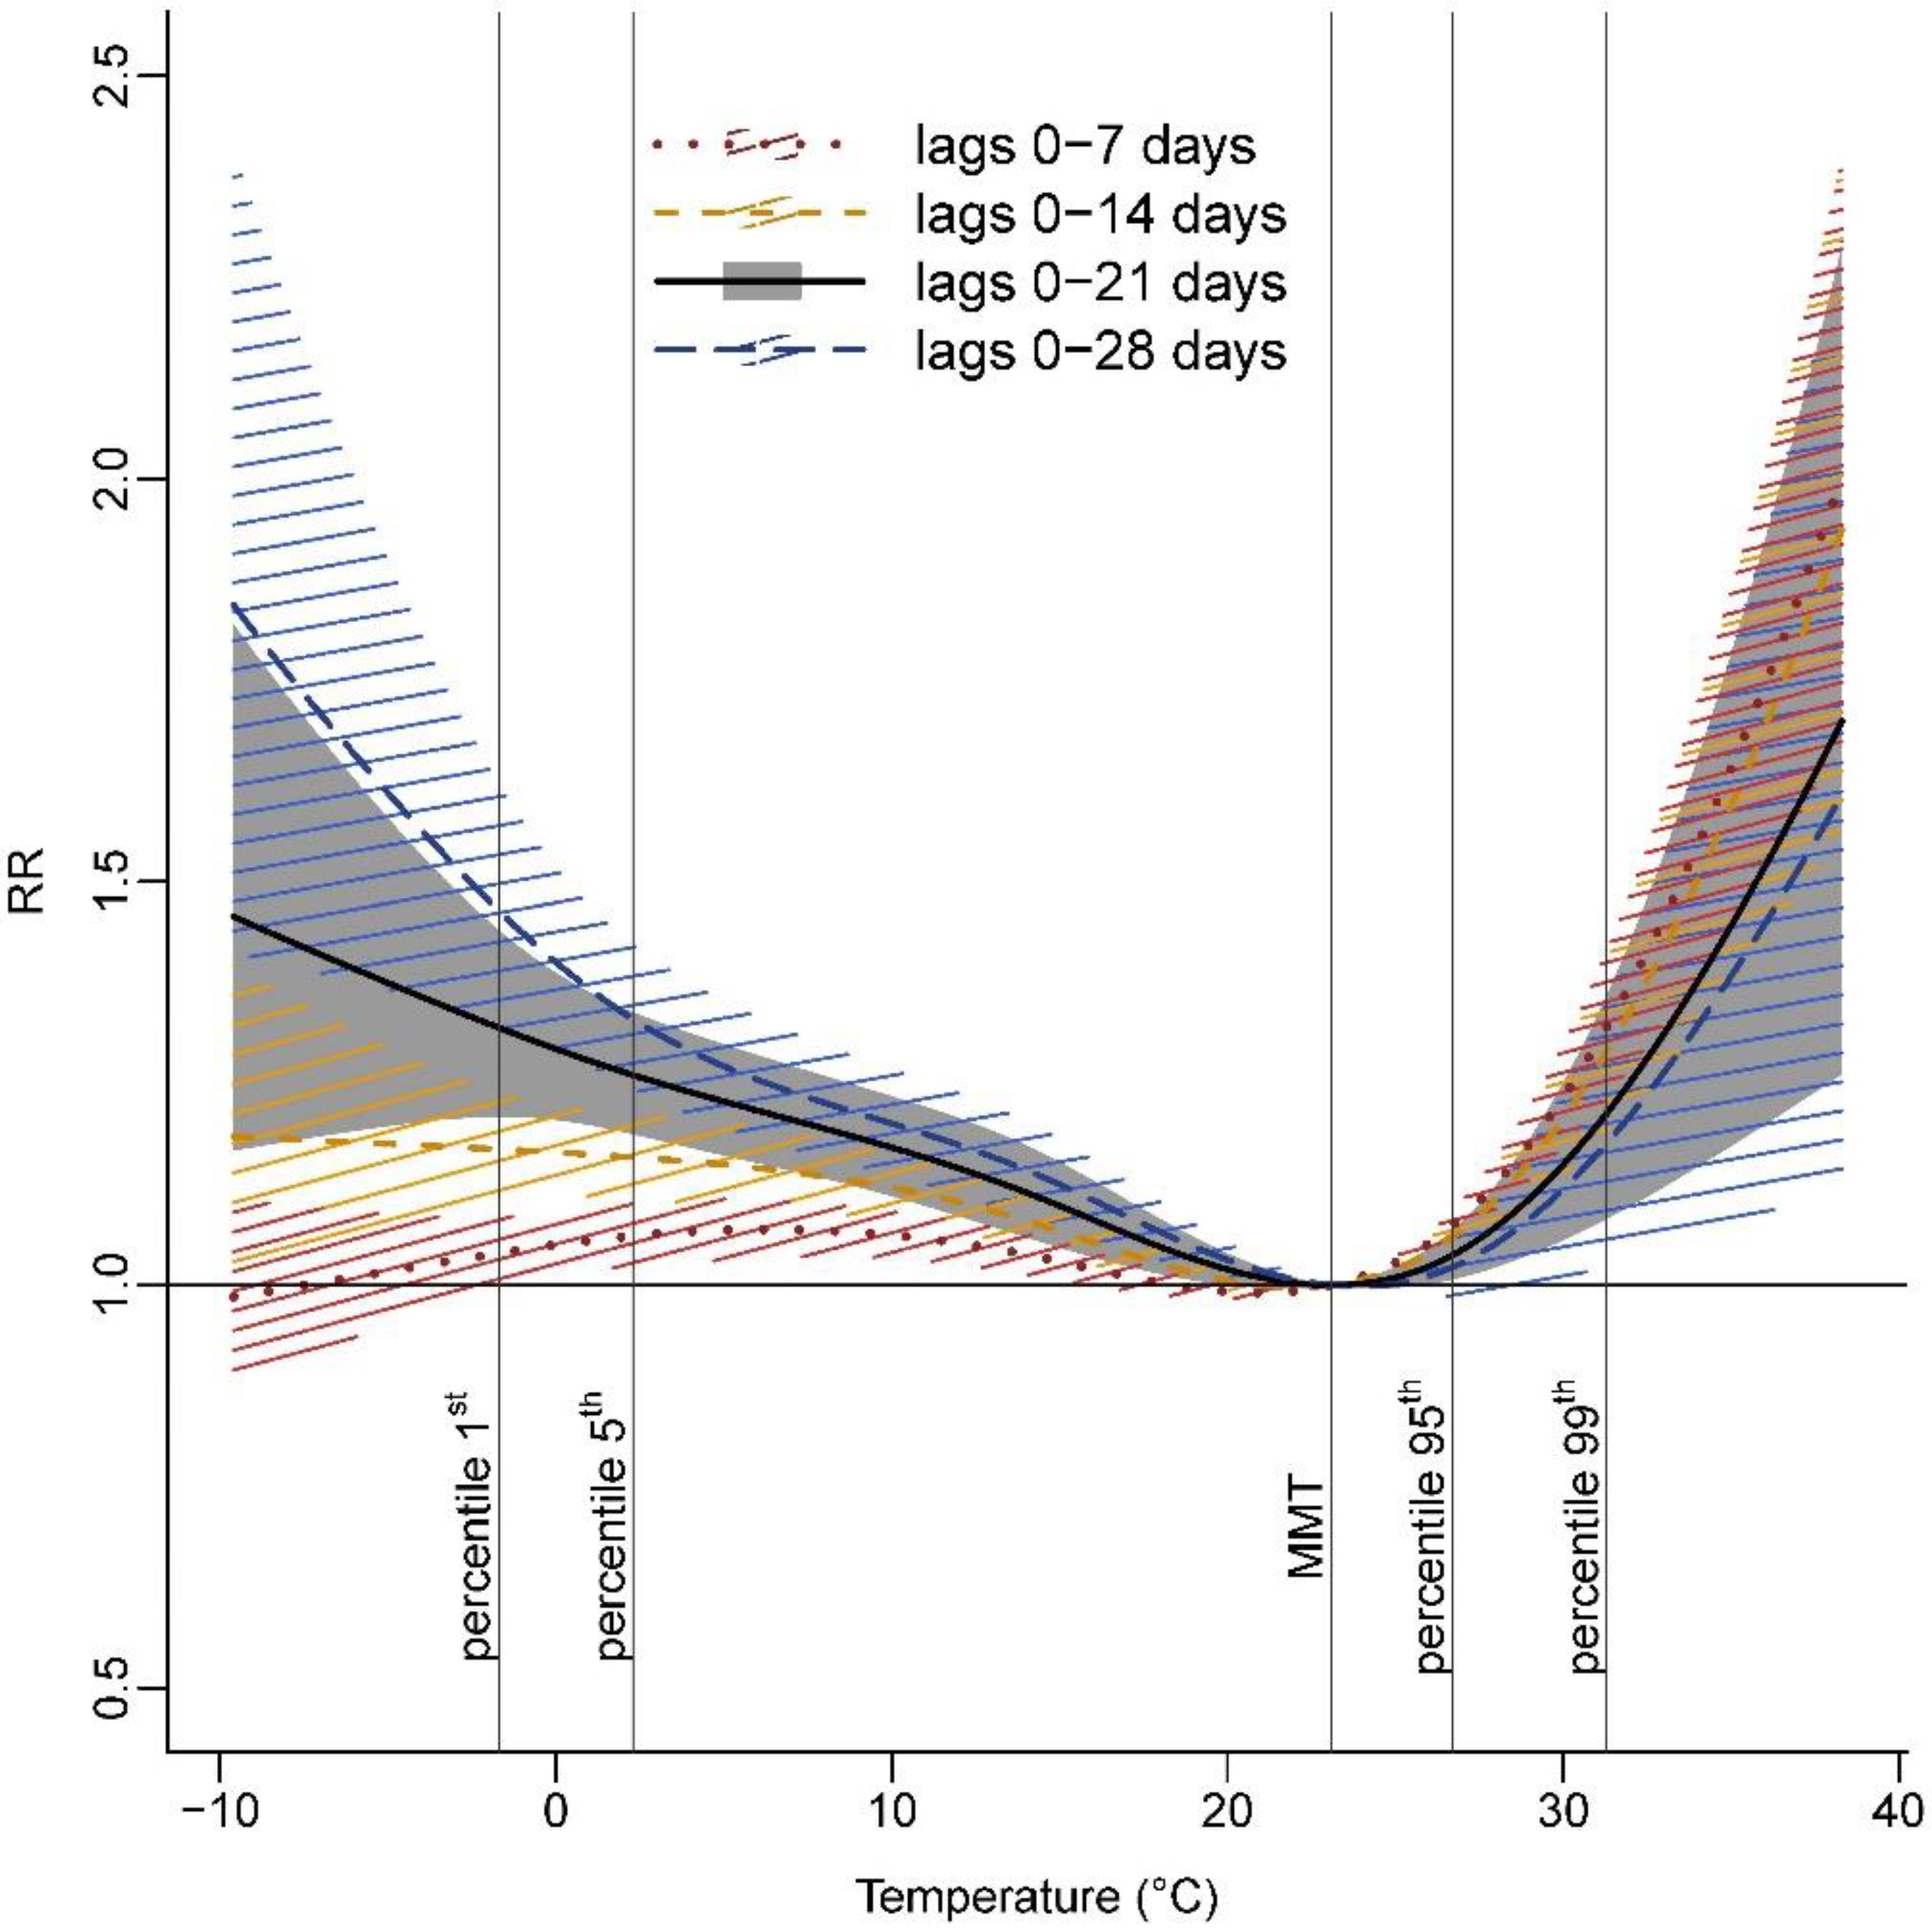
3.4. Sensitivity Analyses
4. Discussion
5. Conclusions
Supplementary Materials
Author Contributions
Funding
Institutional Review Board Statement
Informed Consent Statement
Data Availability Statement
Acknowledgments
Conflicts of Interest
References
- WMO. State of the Global Climate 2020; WMO: Geneva, Switzerland, 2021. [Google Scholar]
- Masson-Delmotte, V.; Zhai, P.; Pirani, A.; Connors, S.L.; Péan, C.; Berger, S.; Caud, N.; Chen, Y.; Goldfarb, L.; Gomis, M.I.; et al. (Eds.) IPCC, 2021: Climate Change 2021: The Physical Science Basis. Contribution of Working Group I to the Sixth Assessment Report of the Intergovernmental Panel on Climate Change; Cambridge University Press: Cambridge, UK, 2021. [Google Scholar]
- Jones, T.S.; Liang, A.P.; Kilbourne, E.M.; Griffin, M.R.; Patriarca, P.A.; Wassilak, S.G.; Mullan, R.J.; Herrick, R.F.; Donnell, H.D.; Choi, K.; et al. Morbidity and Mortality Associated with the July 1980 Heat Wave in St Louis and Kansas City, Mo. JAMA 1982, 247, 3327–3331. [Google Scholar] [CrossRef] [PubMed]
- Whitman, S.; Good, G.; Donoghue, E.R.; Benbow, N.; Shou, W.; Mou, S. Mortality in Chicago Attributed to the July 1995 Heat Wave. Am. J. Public Health 1997, 87, 1515–1518. [Google Scholar] [CrossRef] [Green Version]
- Fouillet, A.; Rey, G.; Laurent, F.; Pavillon, G.; Bellec, S.; Guihenneuc-Jouyaux, C.; Clavel, J.; Jougla, E.; Hémon, D. Excess Mortality Related to the August 2003 Heat Wave in France. Int. Arch. Occup. Environ. Health 2006, 80, 16–24. [Google Scholar] [CrossRef] [Green Version]
- Baccini, M.; Biggeri, A.; Accetta, G.; Kosatsky, T.; Katsouyanni, K.; Analitis, A.; Anderson, H.R.; Bisanti, L.; D’Ippoliti, D.; Danova, J.; et al. Heat Effects on Mortality in 15 European Cities. Epidemiology 2008, 19, 711–719. [Google Scholar] [CrossRef]
- Guo, Y.; Gasparrini, A.; Armstrong, B.G.; Tawatsupa, B.; Tobias, A.; Lavigne, E.; Coelho, M.; Pan, X.; Kim, H.; Hashizume, M.; et al. Heat Wave and Mortality: A Multicountry, Multicommunity Study. Environ. Health Perspect. 2017, 125, 87006. [Google Scholar] [CrossRef] [PubMed] [Green Version]
- Chen, R.; Yin, P.; Wang, L.; Liu, C.; Niu, Y.; Wang, W.; Jiang, Y.; Liu, Y.; Liu, J.; Qi, J.; et al. Association between Ambient Temperature and Mortality Risk and Burden: Time Series Study in 272 Main Chinese Cities. BMJ 2018, 363, k4306. [Google Scholar] [CrossRef] [PubMed] [Green Version]
- Almendra, R.; Santana, P.; Mitsakou, C.; Heaviside, C.; Samoli, E.; Rodopoulou, S.; Katsouyanni, K.; Vardoulakis, S. Cold-Related Mortality in Three European Metropolitan Areas: Athens, Lisbon and London. Implications for Health Promotion. Urban Clim. 2019, 30, 100532. [Google Scholar] [CrossRef]
- Burkart, K.G.; Brauer, M.; Aravkin, A.Y.; Godwin, W.W.; Hay, S.I.; He, J.; Iannucci, V.C.; Larson, S.L.; Lim, S.S.; Liu, J.; et al. Estimating the Cause-Specific Relative Risks of Non-Optimal Temperature on Daily Mortality: A Two-Part Modelling Approach Applied to the Global Burden of Disease Study. Lancet 2021, 398, 685–697. [Google Scholar] [CrossRef]
- Zhao, Q.; Guo, Y.; Ye, T.; Gasparrini, A.; Tong, S.; Overcenco, A.; Urban, A.; Schneider, A.; Entezari, A.; Vicedo-Cabrera, A.M.; et al. Global, Regional, and National Burden of Mortality Associated with Non-Optimal Ambient Temperatures from 2000 to 2019: A Three-Stage Modelling Study. Lancet Planet Health 2021, 5, e415–e425. [Google Scholar] [CrossRef]
- Kinney, P.L.; Schwartz, J.; Pascal, M.; Petkova, E.; Tertre, A.L.; Medina, S.; Vautard, R. Winter Season Mortality: Will Climate Warming Bring Benefits? Environ. Res. Lett. 2015, 10, 064016. [Google Scholar] [CrossRef]
- Ebi, K.L. Greater Understanding Is Need of Whether Warmer and Shorter Winters Associated with Climate Change Could Reduce Winter Mortality. Environ. Res. Lett. 2015, 10, 111002. [Google Scholar] [CrossRef] [Green Version]
- Gasparrini, A.; Guo, Y.; Sera, F.; Vicedo-Cabrera, A.M.; Huber, V.; Tong, S.; Coelho, M.d.S.Z.S.; Saldiva, P.H.N.; Lavigne, E.; Correa, P.M.; et al. Projections of Temperature-Related Excess Mortality under Climate Change Scenarios. Lancet Planet Health 2017, 1, e360–e367. [Google Scholar] [CrossRef]
- Macintyre, H.L.; Heaviside, C.; Cai, X.; Phalkey, R. The Winter Urban Heat Island: Impacts on Cold-Related Mortality in a Highly Urbanized European Region for Present and Future Climate. Environ. Int. 2021, 154, 106530. [Google Scholar] [CrossRef]
- Sartor, F.; Snacken, R.; Demuth, C.; Walckiers, D. Temperature, Ambient Ozone Levels, and Mortality during Summer, 1994, in Belgium. Environ. Res. 1995, 70, 105–113. [Google Scholar] [CrossRef] [PubMed]
- Martinez, G.S.; Diaz, J.; Hooyberghs, H.; Lauwaet, D.; De Ridder, K.; Linares, C.; Carmona, R.; Ortiz, C.; Kendrovski, V.; Aerts, R.; et al. Heat and Health in Antwerp under Climate Change: Projected Impacts and Implications for Prevention. Environ. Int. 2018, 111, 135–143. [Google Scholar] [CrossRef] [PubMed]
- De Troeyer, K.; Bauwelinck, M.; Aerts, R.; Profer, D.; Berckmans, J.; Delcloo, A.; Hamdi, R.; Van Schaeybroeck, B.; Hooyberghs, H.; Lauwaet, D.; et al. Heat Related Mortality in the Two Largest Belgian Urban Areas: A Time Series Analysis. Environ. Res. 2020, 188, 109848. [Google Scholar] [CrossRef] [PubMed]
- Gasparrini, A.; Guo, Y.; Hashizume, M.; Lavigne, E.; Zanobetti, A.; Schwartz, J.; Tobias, A.; Tong, S.; Rocklöv, J.; Forsberg, B.; et al. Mortality Risk Attributable to High and Low Ambient Temperature: A Multicountry Observational Study. Lancet 2015, 386, 369–375. [Google Scholar] [CrossRef]
- Leone, M.; D’Ippoliti, D.; De Sario, M.; Analitis, A.; Menne, B.; Katsouyanni, K.; de’ Donato, F.K.; Basagana, X.; Salah, A.B.; Casimiro, E.; et al. A Time Series Study on the Effects of Heat on Mortality and Evaluation of Heterogeneity into European and Eastern-Southern Mediterranean Cities: Results of EU CIRCE Project. Environ. Health 2013, 12, 55. [Google Scholar] [CrossRef] [Green Version]
- Benmarhnia, T.; Deguen, S.; Kaufman, J.S.; Smargiassi, A. Review Article: Vulnerability to Heat-Related Mortality, a Systematic Review, Meta-Analysis, and Meta-Regression Analysis. Epidemiology 2015, 26, 781–793. [Google Scholar] [CrossRef] [PubMed]
- WHO. WHO Heat and Health in the WHO European Region: Updated Evidence for Effective Prevention; WHO Regional Office for Europe: Copenhagen, Denmark, 2021. [Google Scholar]
- Eurostat. Degree of Urbanisation Classification—2011 Revision. 2011. Available online: https://ec.europa.eu/eurostat/statistics-explained/index.php?title=Degree_of_urbanisation_classification_-_2011_revision (accessed on 14 March 2022).
- Hamdi, R.; Deckmyn, A.; Termonia, P.; Demarée, G.R.; Baguis, P.; Vanhuysse, S.; Wolff, E. Effects of Historical Urbanization in the Brussels Capital Region on Surface Air Temperature Time Series: A Model Study. J. Appl. Meteorol. Climatol. 2009, 48, 2181–2196. [Google Scholar] [CrossRef] [Green Version]
- Fierens, F.; Vanpoucke, C.; Trimpeneers, E.; Peeters, O.; Quidé, S.; de Vos, T.; Maetz, P.; Hutsemékers, V. Annual Report Air Quality in Belgium 2015; Belgian Interregional Environment Agency: Brussels, Belgium, 2015. [Google Scholar]
- Vicedo-Cabrera, A.M.; Sera, F.; Guo, Y.; Chung, Y.; Arbuthnott, K.; Tong, S.; Tobias, A.; Lavigne, E.; de Sousa Zanotti Stagliorio Coelho, M.; Hilario Nascimento Saldiva, P.; et al. A Multi-Country Analysis on Potential Adaptive Mechanisms to Cold and Heat in a Changing Climate. Environ. Int. 2018, 111, 239–246. [Google Scholar] [CrossRef]
- Beck, H.E.; Zimmermann, N.E.; McVicar, T.R.; Vergopolan, N.; Berg, A.; Wood, E.F. Present and Future Köppen-Geiger Climate Classification Maps at 1-Km Resolution. Sci. Data 2018, 5, 180214. [Google Scholar] [CrossRef] [Green Version]
- Van Hecke, E.; Halleux, J.-M.; Decroly, J.-M.; Mérenne-Schoumaker, B. Enquête Socio-Économique 2001—Monographies. Noyaux D’habitat et Régions Urbaines Dans Une Belgique Urbanisée; SPF Economie, P.M.E., Classes Moyennes et Energie: Saint-Josse-ten-Noode, Belgium, 2009; p. 201. [Google Scholar]
- PMIC. ICD-10-CM: International Classification of Diseases, 10th Revision, Clinical Modification, Color Coded, 2018; Practice Management Information Corporation (PMIC): Los Angeles, CA, USA, 2018; ISBN 978-1-946868-02-2. [Google Scholar]
- Royal Meteorological Institute of Belgium RMI. Available online: http://publish.geo.be/geonetwork/F0ow2Say/api/records/RMI_DATASET_GRIDDEDOBS (accessed on 14 March 2022).
- Delvaux, C.; Ingels, R.; Vrábeĺ, V.; Journée, M.; Bertrand, C. Quality Control and Homogenization of the Belgian Historical Temperature Data. Int. J. Climatol. 2019, 39, 157–171. [Google Scholar] [CrossRef] [Green Version]
- Belgian Statistical Office—Census. 2011. Available online: https://census2011.fgov.be (accessed on 14 March 2022).
- DiMiceli, C.; Carroll, M.; Sohlberg, R.; Kim, D.-H.; Kelly, M.; Townshend, J. MOD44B MODIS/Terra Vegetation Continuous Fields Yearly L3 Global 250m SIN Grid V006 2015. Available online: https://ladsweb.modaps.eosdis.nasa.gov/missions-and-measurements/products/MOD44B/ (accessed on 14 March 2022).
- Lefebvre, W.; Degrawe, B.; Beckx, C.; Vanhulsel, M.; Kochan, B.; Bellemans, T.; Janssens, D.; Wets, G.; Janssen, S.; de Vlieger, I.; et al. Presentation and Evaluation of an Integrated Model Chain to Respond to Traffic- and Health-Related Policy Questions. Environ. Model. Softw. 2013, 40, 160–170. [Google Scholar] [CrossRef]
- Maclure, M. The Case-Crossover Design: A Method for Studying Transient Effects on the Risk of Acute Events. Am. J. Epidemiol. 1991, 133, 144–153. [Google Scholar] [CrossRef]
- Armstrong, B.G.; Gasparrini, A.; Tobias, A. Conditional Poisson Models: A Flexible Alternative to Conditional Logistic Case Cross-over Analysis. BMC Med. Res. Methodol. 2014, 14, 122. [Google Scholar] [CrossRef] [Green Version]
- Gasparrini, A.; Armstrong, B.; Kenward, M.G. Distributed Lag Non-Linear Models. Stat. Med. 2010, 29, 2224–2234. [Google Scholar] [CrossRef] [Green Version]
- Gasparrini, A.; Armstrong, B. Reducing and Meta-Analysing Estimates from Distributed Lag Non-Linear Models. BMC Med. Res. Methodol. 2013, 13, 1. [Google Scholar] [CrossRef] [PubMed] [Green Version]
- Fu, S.H.; Gasparrini, A.; Rodriguez, P.S.; Jha, P. Mortality Attributable to Hot and Cold Ambient Temperatures in India: A Nationally Representative Case-Crossover Study. PLoS Med. 2018, 15, e1002619. [Google Scholar] [CrossRef]
- Ma, Y.; Zhou, L.; Chen, K. Burden of Cause-Specific Mortality Attributable to Heat and Cold: A Multicity Time-Series Study in Jiangsu Province, China. Environ. Int. 2020, 144, 105994. [Google Scholar] [CrossRef]
- Gasparrini, A.; Armstrong, B.; Kenward, M.G. Multivariate Meta-Analysis for Non-Linear and Other Multi-Parameter Associations. Stat. Med. 2012, 31, 3821–3839. [Google Scholar] [CrossRef] [Green Version]
- Basagaña, X.; Sartini, C.; Barrera-Gómez, J.; Dadvand, P.; Cunillera, J.; Ostro, B.; Sunyer, J.; Medina-Ramón, M. Heat Waves and Cause-Specific Mortality at All Ages. Epidemiology 2011, 22, 765–772. [Google Scholar] [CrossRef]
- Keatinge, W.R.; Coleshaw, S.R.; Cotter, F.; Mattock, M.; Murphy, M.; Chelliah, R. Increases in Platelet and Red Cell Counts, Blood Viscosity, and Arterial Pressure during Mild Surface Cooling: Factors in Mortality from Coronary and Cerebral Thrombosis in Winter. Br. Med. J. 1984, 289, 1405–1408. [Google Scholar] [CrossRef] [Green Version]
- Hajat, S.; Kosatky, T. Heat-Related Mortality: A Review and Exploration of Heterogeneity. J. Epidemiol. Community Health 2010, 64, 753–760. [Google Scholar] [CrossRef]
- Ryti, N.R.I.; Guo, Y.; Jaakkola, J.J.K. Global Association of Cold Spells and Adverse Health Effects: A Systematic Review and Meta-Analysis. Environ. Health Perspect. 2016, 124, 12–22. [Google Scholar] [CrossRef]
- Bunker, A.; Wildenhain, J.; Vandenbergh, A.; Henschke, N.; Rocklöv, J.; Hajat, S.; Sauerborn, R. Effects of Air Temperature on Climate-Sensitive Mortality and Morbidity Outcomes in the Elderly; a Systematic Review and Meta-Analysis of Epidemiological Evidence. EBioMedicine 2016, 6, 258–268. [Google Scholar] [CrossRef] [Green Version]
- Basu, R. High Ambient Temperature and Mortality: A Review of Epidemiologic Studies from 2001 to 2008. Environ. Health 2009, 8, 40. [Google Scholar] [CrossRef] [Green Version]
- Xu, Z.; Etzel, R.A.; Su, H.; Huang, C.; Guo, Y.; Tong, S. Impact of Ambient Temperature on Children’s Health: A Systematic Review. Environ. Res. 2012, 117, 120–131. [Google Scholar] [CrossRef] [Green Version]
- Rocque, R.J.; Beaudoin, C.; Ndjaboue, R.; Cameron, L.; Poirier-Bergeron, L.; Poulin-Rheault, R.-A.; Fallon, C.; Tricco, A.C.; Witteman, H.O. Health Effects of Climate Change: An Overview of Systematic Reviews. BMJ Open 2021, 11, e046333. [Google Scholar] [CrossRef]
- Son, J.-Y.; Liu, J.C.; Bell, M.L. Temperature-Related Mortality: A Systematic Review and Investigation of Effect Modifiers. Environ. Res. Lett. 2019, 14, 073004. [Google Scholar] [CrossRef]
- Un-Habitat. State of the World’s Cities 2010/11: Cities for All: Bridging the Urban Divide; Routledge: London, UK, 2010; ISBN 978-1-136-54306-7. [Google Scholar]
- Oke, T.R. The Energetic Basis of the Urban Heat Island. Q. J. R. Meteorol. Soc. 1982, 108, 1–24. [Google Scholar] [CrossRef]
- Ostro, B.; Rauch, S.; Green, R.; Malig, B.; Basu, R. The Effects of Temperature and Use of Air Conditioning on Hospitalizations. Am. J. Epidemiol. 2010, 172, 1053–1061. [Google Scholar] [CrossRef]
- Stafoggia, M.; Forastiere, F.; Agostini, D.; Biggeri, A.; Bisanti, L.; Cadum, E.; Caranci, N.; de’ Donato, F.; De Lisio, S.; De Maria, M.; et al. Vulnerability to Heat-Related Mortality: A Multicity, Population-Based, Case-Crossover Analysis. Epidemiology 2006, 17, 315–323. [Google Scholar] [CrossRef]
- Zanobetti, A.; O’Neill, M.S.; Gronlund, C.J.; Schwartz, J.D. Susceptibility to Mortality in Weather Extremes: Effect Modification by Personal and Small Area Characteristics in a Multi-City Case-Only Analysis. Epidemiology 2013, 24, 809–819. [Google Scholar] [CrossRef] [Green Version]


| Agglomeration | Municipalities | Deaths | Population 1 | Daily Maximum Temperature (°C) | MMT 2 | |||||||
|---|---|---|---|---|---|---|---|---|---|---|---|---|
| n (%) | n (%) | n (%) | Min | p1 3 | p25 3 | Median | p75 3 | p99 3 | Max | T (°C) | p 3 | |
| Antwerp | 30 (13.8) | 54,096 (17.6) | 189,437 (18.3) | −6.9 | −1.2 | 9.8 | 15.6 | 20.5 | 31.5 | 36.2 | 25.6 | 92.6 |
| Brussels | 62 (28.4) | 89,070 (28.9) | 306,146 (29.6) | −7.5 | −1.6 | 9.5 | 15.6 | 20.5 | 31.3 | 36.2 | 23.6 | 87.5 |
| Leuven | 27 (12.4) | 22,973 (7.5) | 85,246 (8.2) | −9.7 | −1.6 | 9.6 | 15.8 | 20.8 | 32.2 | 36.3 | - | - |
| Bruges | 10 (4.6) | 16,142 (5.2) | 65,432 (6.3) | −4.9 | −0.5 | 9.8 | 14.9 | 19.7 | 29.4 | 35.7 | - | - |
| Ghent | 22 (10.1) | 28,748 (9.3) | 102,973 (10.0) | −5.4 | −0.9 | 9.7 | 15.4 | 20.2 | 30.3 | 35.9 | 25.0 | 92.0 |
| Charleroi | 14 (6.4) | 26,628 (8.6) | 74,395 (7.2) | −7.3 | −2.2 | 8.9 | 15.0 | 19.9 | 31.1 | 34.9 | 21.0 | 79.3 |
| Mons | 13 (6.0) | 15,932 (5.2) | 44,241 (4.3) | −5.6 | −1.7 | 9.5 | 15.5 | 20.3 | 31.0 | 35.0 | - | - |
| Liège | 24 (11.0) | 37,529 (12.2) | 112,923 (10.9) | −8.8 | −2.6 | 8.9 | 15.0 | 20.3 | 31.8 | 38.3 | 23.9 | 88.7 |
| Namur | 16 (7.3) | 16,741 (5.4) | 52,649 (5.1) | −8.3 | −2.7 | 8.7 | 14.9 | 20.0 | 31.0 | 34.9 | 24.2 | 90.5 |
| All | 218 | 307,859 | 1,033,442 | −9.7 | −1.7 | 9.4 | 15.4 | 20.4 | 31.3 | 38.3 | 23.1 | 86.3 |
| RR (95% CI) 1 | |||||
|---|---|---|---|---|---|
| Deaths | Cold Effect | Heat Effect | |||
| n (%) | p1 (−1.7 °C) 2 | p5 (2.3 °C) 2 | p95 (26.7 °C) 2 | p99 (31.3 °C) 2 | |
| All | 307,859 (100) | 1.32 (1.21–1.44) | 1.26 (1.19–1.34) | 1.04 (1.01–1.07) | 1.21 (1.08–1.36) |
| Causes of death | |||||
| Cardiovascular | 91,327 (29.7) | 1.26 (0.93–1.71) | 1.31 (1.03–1.68) | 1.01 (0.95–1.08) | 1.14 (0.89–1.45) |
| IHD 3 | 26,132 (8.5) | 1.46 (1.17–1.81) | 1.42 (1.11–1.81) | 1.05 (0.97–1.14) | 1.45 (0.99–2.13) |
| Cerebrovascular | 21,718 (7.1) | 1.21 (0.89–1.63) | 1.25 (1.08–1.44) | 1.02 (0.97–1.07) | 1.12 (0.76–1.64) |
| Respiratory | 34,493 (11.2) | 1.02 (0.74–1.40) | 1.20 (1.02–1.41) | 1.06 (0.94–1.19) | 1.06 (0.69–1.63) |
| COPD 4 | 13,937 (4.5) | 1.97 (1.29–3.01) | 1.66 (1.31–2.12) | 1.02 (0.81–1.28) | 1.17 (0.50–2.76) |
| Other natural | 182,039 (59.1) | 1.29 (1.17–1.42) | 1.21 (1.13–1.29) | 1.03 (1.00–1.06) | 1.18 (1.04–1.34) |
| Adjustment for air pollutants | |||||
| PM2.5, lag 1 day | 1.34 (1.22–1.46) | 1.27 (1.19–1.35) | 1.04 (1.01–1.07) | 1.21 (1.08–1.36) | |
| PM2.5, lag 3 days | 1.32 (1.21–1.45) | 1.26 (1.19–1.34) | 1.04 (1.01–1.07) | 1.22 (1.09–1.36) | |
| NO2, lag 1 day | 1.34 (1.22–1.46) | 1.27 (1.19–1.34) | 1.04 (1.01–1.07) | 1.21 (1.08–1.36) | |
| NO2, lag 3 days | 1.34 (1.22–1.47) | 1.27 (1.19–1.35) | 1.04 (1.01–1.07) | 1.21 (1.09–1.36) | |
| O3, lag 1 day | 1.33 (1.22–1.45) | 1.26 (1.19–1.34) | 1.03 (1.01–1.06) | 1.20 (1.08–1.34) | |
| O3, lag 3 days | 1.35 (1.24–1.47) | 1.28 (1.21–1.35) | 1.04 (1.00–1.07) | 1.21 (1.07–1.36) | |
Publisher’s Note: MDPI stays neutral with regard to jurisdictional claims in published maps and institutional affiliations. |
© 2022 by the authors. Licensee MDPI, Basel, Switzerland. This article is an open access article distributed under the terms and conditions of the Creative Commons Attribution (CC BY) license (https://creativecommons.org/licenses/by/4.0/).
Share and Cite
Demoury, C.; Aerts, R.; Vandeninden, B.; Van Schaeybroeck, B.; De Clercq, E.M. Impact of Short-Term Exposure to Extreme Temperatures on Mortality: A Multi-City Study in Belgium. Int. J. Environ. Res. Public Health 2022, 19, 3763. https://doi.org/10.3390/ijerph19073763
Demoury C, Aerts R, Vandeninden B, Van Schaeybroeck B, De Clercq EM. Impact of Short-Term Exposure to Extreme Temperatures on Mortality: A Multi-City Study in Belgium. International Journal of Environmental Research and Public Health. 2022; 19(7):3763. https://doi.org/10.3390/ijerph19073763
Chicago/Turabian StyleDemoury, Claire, Raf Aerts, Bram Vandeninden, Bert Van Schaeybroeck, and Eva M. De Clercq. 2022. "Impact of Short-Term Exposure to Extreme Temperatures on Mortality: A Multi-City Study in Belgium" International Journal of Environmental Research and Public Health 19, no. 7: 3763. https://doi.org/10.3390/ijerph19073763
APA StyleDemoury, C., Aerts, R., Vandeninden, B., Van Schaeybroeck, B., & De Clercq, E. M. (2022). Impact of Short-Term Exposure to Extreme Temperatures on Mortality: A Multi-City Study in Belgium. International Journal of Environmental Research and Public Health, 19(7), 3763. https://doi.org/10.3390/ijerph19073763