
The Impact of a Grocery Store Closure in One Rural Highly Obese Appalachian Community on Shopping Behavior and Dietary Intake

 , , ,
, , ,
Abstract
:1. Introduction
2. Materials and Methods
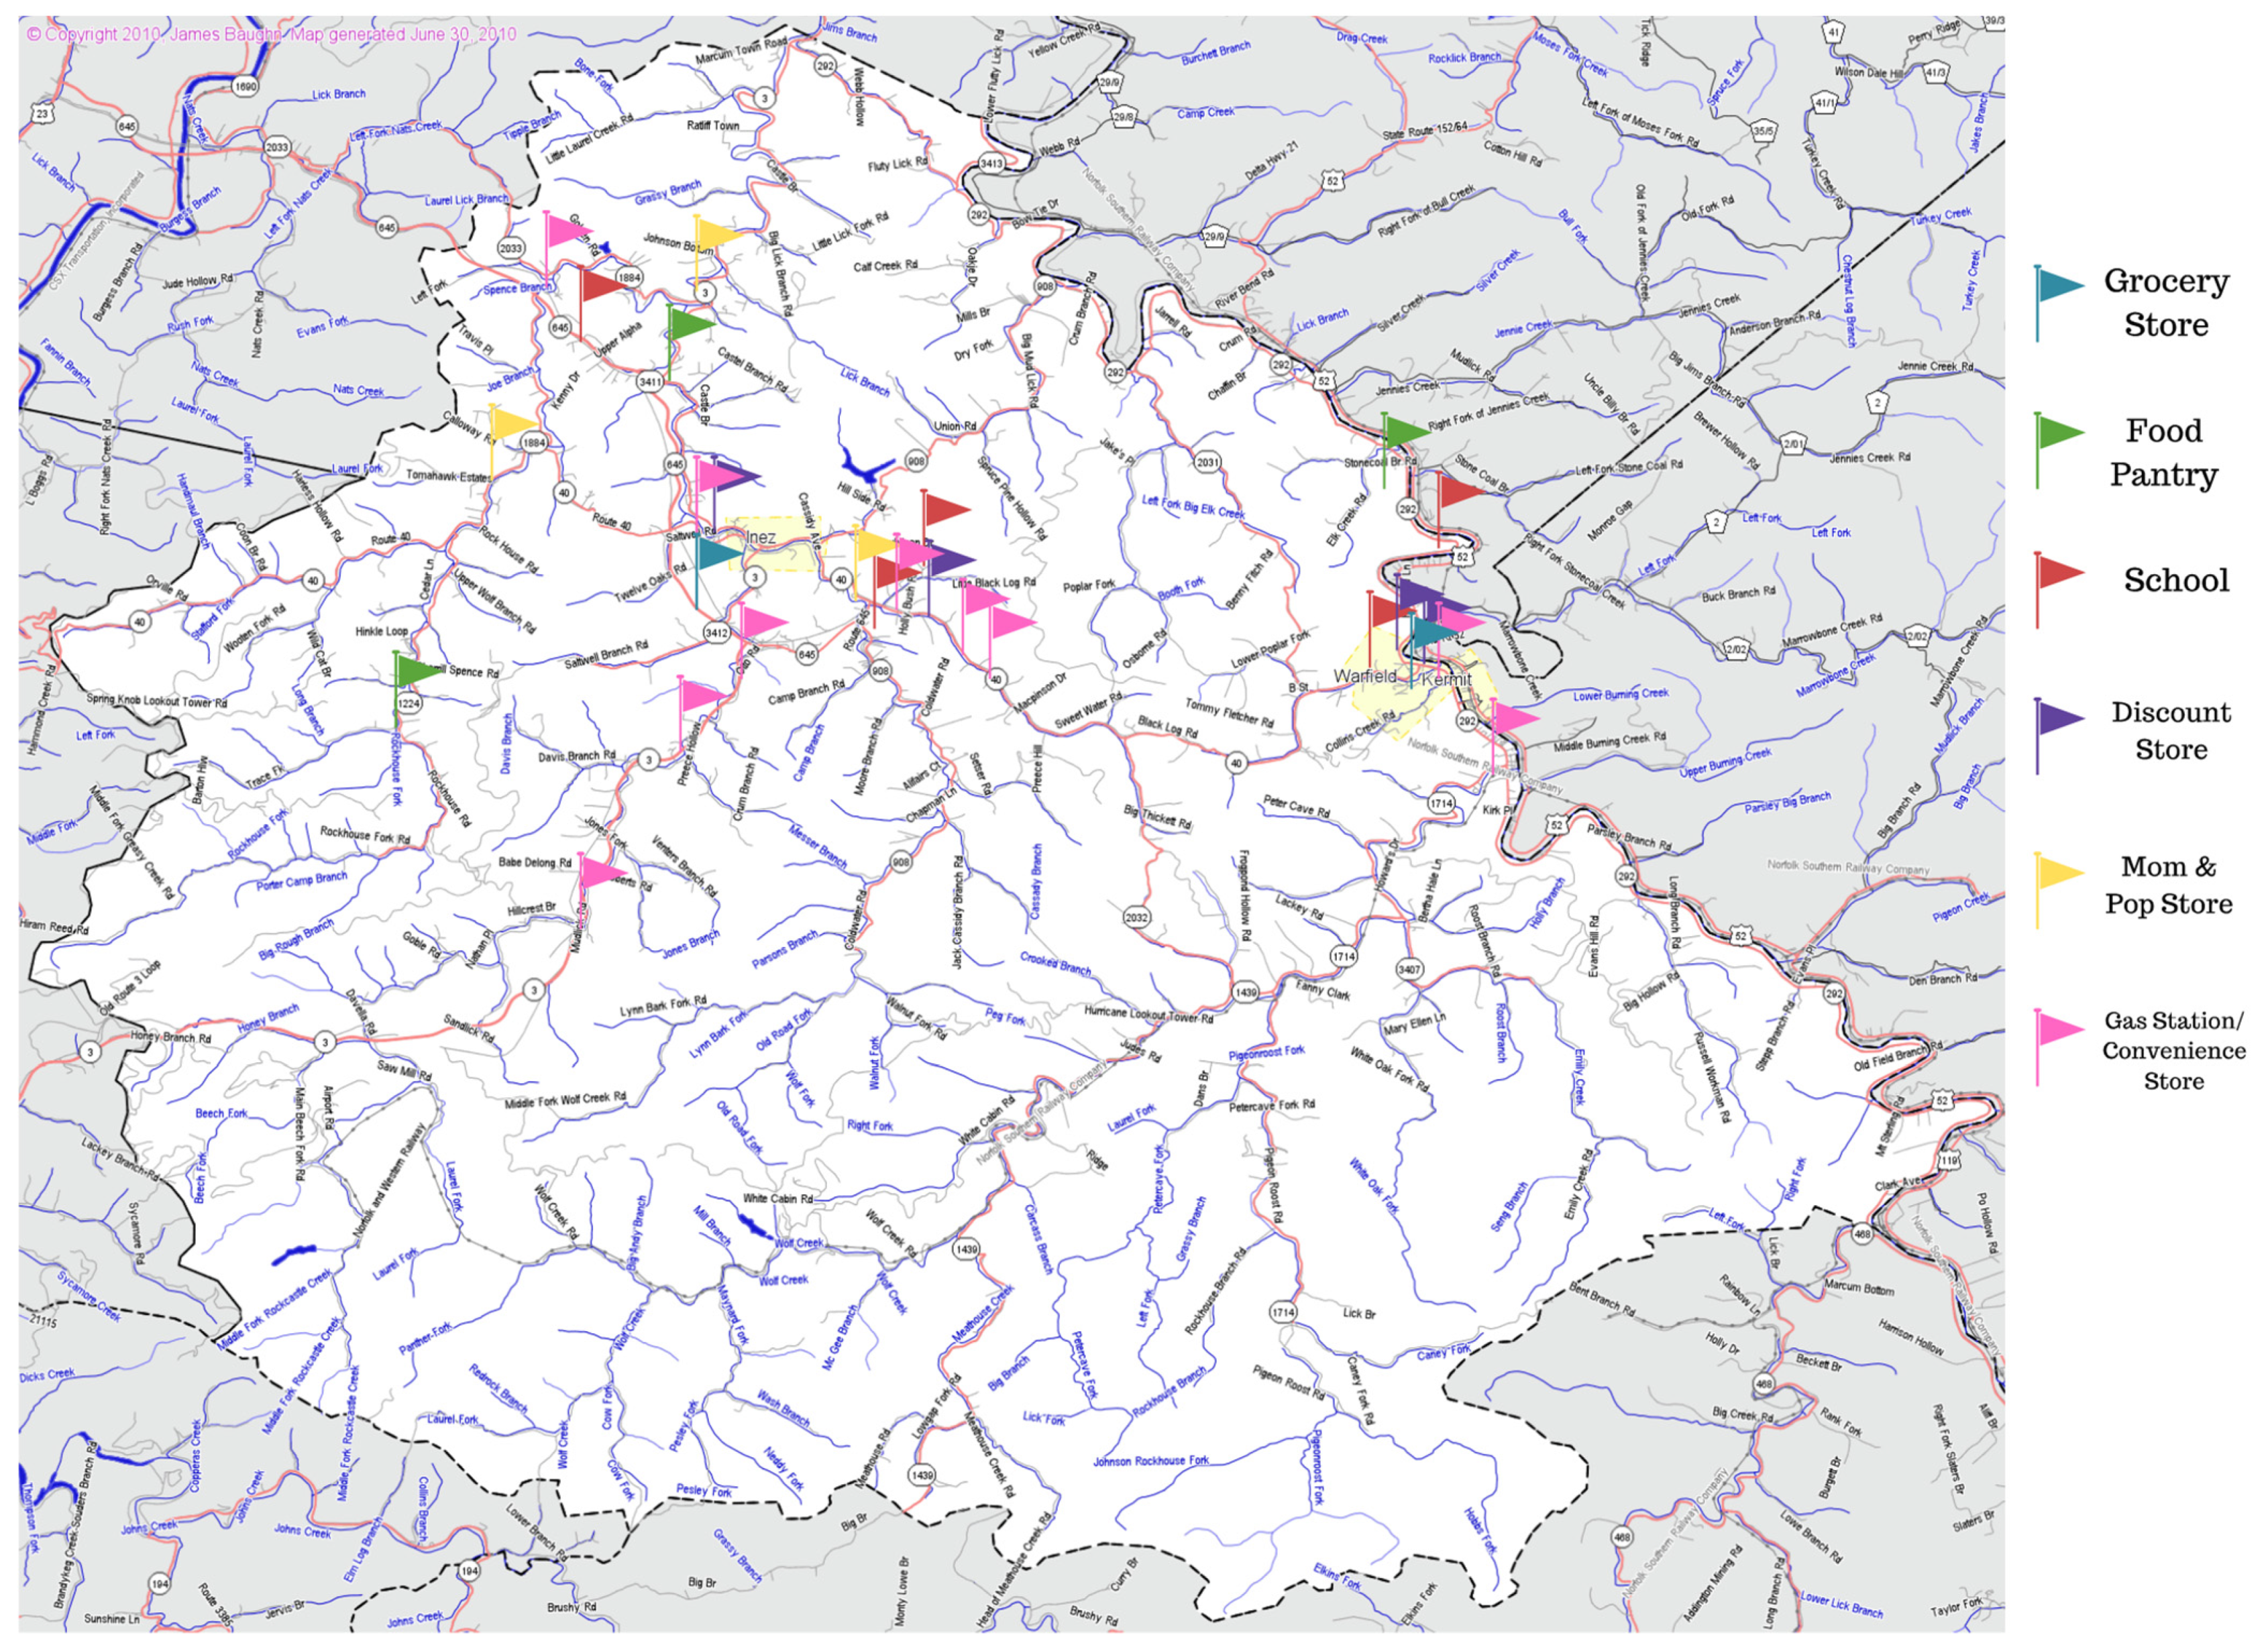
2.1. Study Setting
2.2. Survey Administration
2.3. Survey Measures
2.3.1. Grocery Shopping Measures
2.3.2. Dietary Intake Assessment
2.4. Analysis
3. Results
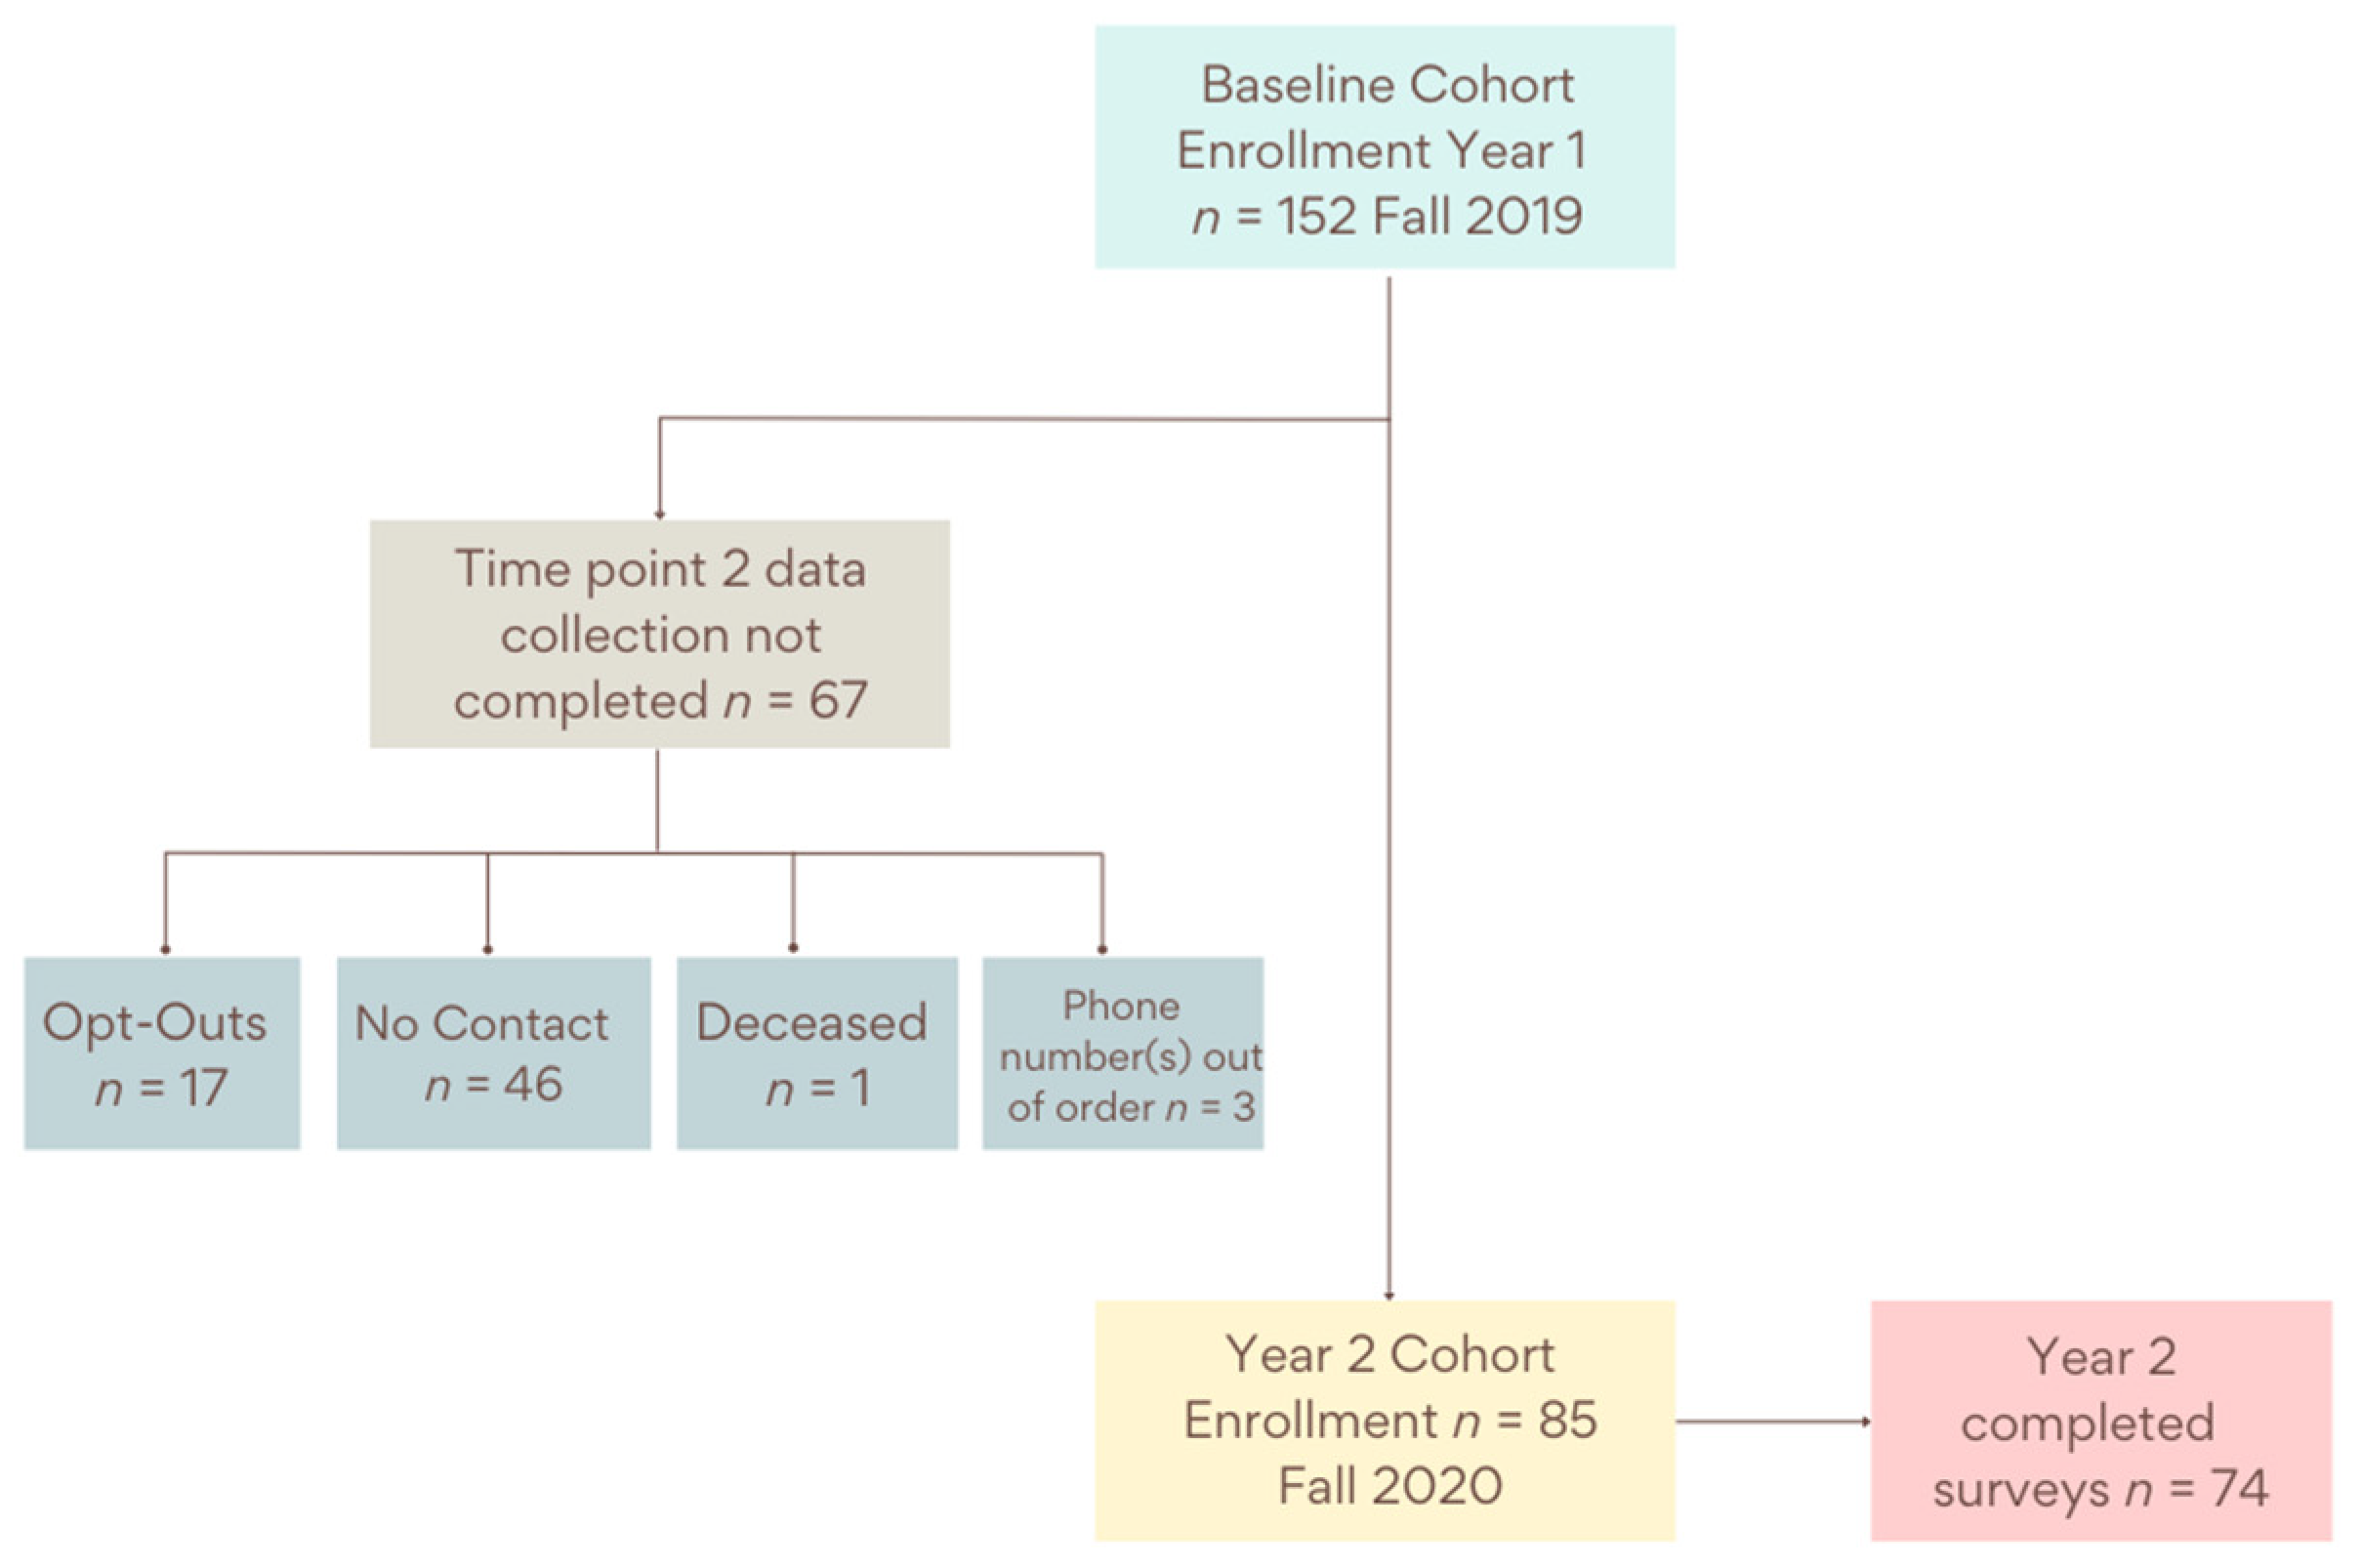
3.1. Study Sample
3.2. Grocery Shopping Habits
3.3. Dietary Intake
4. Discussion
5. Conclusions
Author Contributions
Funding
Institutional Review Board Statement
Informed Consent Statement
Data Availability Statement
Acknowledgments
Conflicts of Interest
References
- Gustafson, A.; Lewis, S.; Perkins, S.; Damewood, M.; Buckner, E.; Vail, A.; Mullins, J.; Jilcott-Pitts, S.B. Association Between the Retail Food Environment, Neighborhood Deprivation, and County-Level Dietary Outcomes Among Supplemental Nutrition Assistance Program–Education (SNAP-Ed) Recipients in Kentucky, 2010–2011. J. Hunger Environ. Nutr. 2013, 8, 362–377. [Google Scholar] [CrossRef]
- Johnson, K.A.; Jones-Smith, J.; Curriero, F.C.; Cheskin, L.J.; Benjamin-Neelon, S.E.; Perin, J.; Caicedo, M.R.; Thornton, R.L.J. Low-Income Black and Hispanic Children’s Neighborhood Food Environments and Weight Trajectories in Early Childhood. Acad. Pediatr. 2020, 20, 784–792. [Google Scholar] [CrossRef] [PubMed]
- Miller, M.; Saldarriaga, E.M.; Jones-Smith, J.C. Household socioeconomic status modifies the association between neighborhood SES and obesity in a nationally representative sample of first grade children in the United States. Prev. Med. Rep. 2020, 20, 101207. [Google Scholar] [CrossRef] [PubMed]
- Caspi, C.E.; Lenk, K.; Pelletier, J.E.; Barnes, T.L.; Harnack, L.; Erickson, D.J.; Laska, M.N. Association between store food environment and customer purchases in small grocery stores, gas-marts, pharmacies and dollar stores. Int. J. Behav. Nutr. Phys. Act. 2017, 14, 76. [Google Scholar] [CrossRef] [PubMed]
- Food Environment Atlas: Definitions and Data Sources. Available online: https://www.ers.usda.gov/data-products/food-environment-atlas/documentation/ (accessed on 24 January 2022).
- Steves, A.; Cho, C.; Metin, Ç.; Kong, X.; Boland, M. The Food Retail Landscape Across Rural America; U.S. Department of Agriculture, Economic Research Service: Washington, DC, USA, 2021. [Google Scholar]
- Flournoy, R.B.; Giang, T.J. Healthy Food Financing Intiative: An Innovative Approach to Improve Health and Spark Economic Development. In Proceedings of the APHA Annual Meeting and Exposition, Denver, CO, USA, 6–10 November 2010. [Google Scholar]
- Cummins, S.; Flint, E.; Matthews, S.A. New neighborhood grocery store increased awareness of food access but did not alter dietary habits or obesity. Health Aff. 2014, 33, 283–291. [Google Scholar] [CrossRef] [PubMed] [Green Version]
- Ghosh-Dastidar, M.; Hunter, G.; Collins, R.L.; Zenk, S.N.; Cummins, S.; Beckman, R.; Nugroho, A.K.; Sloan, J.C.; Dubowitz, T. Does opening a supermarket in a food desert change the food environment? Health Place 2017, 46, 249–256. [Google Scholar] [CrossRef] [PubMed]
- Singleton, C.R.; Li, Y.; Odoms-Young, A.; Zenk, S.N.; Powell, L.M. Change in Food and Beverage Availability and Marketing Following the Introduction of a Healthy Food Financing Initiative-Supported Supermarket. Am. J. Health Promot. 2019, 33, 525–533. [Google Scholar] [CrossRef] [PubMed]
- Brown, M.C.; Shrestha, U.; Huber, C.; Best, L.G.; O’Leary, M.; Howard, B.; Beresford, S.; Fretts, A.M. Characterizing the local food environment and grocery-store decision making among a large American Indian community in the north-central USA: Qualitative results from the Healthy Foods Healthy Families Feasibility Study. Public Health Nutr. 2019, 22, 2653–2661. [Google Scholar] [CrossRef] [PubMed]
- Taillie, L.S.; Grummon, A.H.; Fleischhacker, S.; Grigsby-Toussaint, D.S.; Leone, L.; Caspi, C.E. Best practices for using natural experiments to evaluate retail food and beverage policies and interventions. Nutr. Rev. 2017, 75, 971–989. [Google Scholar] [CrossRef] [PubMed]
- Facts, K.H. Martin County. Available online: http://www.kentuckyhealthfacts.org/ (accessed on 27 April 2021).
- Zahnd, W.E.; Murphy, C.; Knoll, M.; Benavidez, G.A.; Day, K.R.; Ranganathan, R.; Luke, P.; Zgodic, A.; Shi, K.; Merrell, M.A.; et al. The Intersection of Rural Residence and Minority Race/Ethnicity in Cancer Disparities in the United States. Int. J. Environ. Res. Public Health 2021, 18, 1384. [Google Scholar] [CrossRef] [PubMed]
- Rural Poverty & Well-Being. 2020. Available online: https://www.ers.usda.gov/topics/rural-economy-population/rural-poverty-well-being/ (accessed on 26 April 2021).
- Bureau, U.S.C. Small Area Income and Poverty Estimates (SAIPE). 2020. Available online: https://www.census.gov/data-tools/demo/saipe/ (accessed on 24 January 2022).
- America, F. Food Insecurity in Martin County. Map the Meal Gap 2019. Available online: https://map.feedingamerica.org/county/2019/overall/kentucky/county/martin (accessed on 3 December 2020).
- SNAP Participation Map. 2019. Available online: https://frac.org/maps/snap-county-map/snap-counties.html (accessed on 19 April 2021).
- Miller, W.C.; Rogalla, D.; Spencer, D.; Zia, N.; Griffith, B.N.; Heinsberg, H.B. Community adaptations to an impending food desert in rural Appalachia, USA. Rural Remote Health 2016, 16, 3901. [Google Scholar] [CrossRef]
- United States Census Bureau. QuickFacts: Martin County, Kentucky. 2021. Available online: https://www.census.gov/quickfacts/martincountykentucky (accessed on 2 December 2021).
- DeWitt, E.; Gillespie, R.; Norman-Burgdolf, H.; Cardarelli, K.M.; Slone, S.; Gustafson, A. Rural SNAP Participants and Food Insecurity: How Can Communities Leverage Resources to Meet the Growing Food Insecurity Status of Rural and Low-Income Residents? Int. J. Environ. Res. Public Health 2020, 17, 6037. [Google Scholar] [CrossRef]
- Survey, A.T.U. Eating & Health Module 2014–2016 Questionnaire. 2017. Available online: https://www.bls.gov/tus/ehmquestionnaire1416.pdf (accessed on 7 December 2020).
- Scoring the All-Day Screener. Available online: https://epi.grants.cancer.gov/diet/screeners/fruitveg/scoring/allday.html (accessed on 7 January 2022).
- Thompson, F.E.; Subar, A.F.; Smith, A.F.; Midthune, D.; Radimer, K.L.; Kahle, L.L.; Kipnis, V. Fruit and vegetable assessment: Performance of 2 new short instruments and a food frequency questionnaire. J. Am. Diet. Assoc. 2002, 102, 1764–1772. [Google Scholar] [CrossRef]
- Colditz, G.A.; Wei, E.K. Preventability of cancer: The relative contributions of biologic and social and physical environmental determinants of cancer mortality. Annu. Rev. Public Health 2012, 33, 137–156. [Google Scholar] [CrossRef] [PubMed] [Green Version]
- Yao, N.; Alcala, H.E.; Anderson, R.; Balkrishnan, R. Cancer Disparities in Rural Appalachia: Incidence, Early Detection, and Survivorship. J. Rural Health 2017, 33, 375–381. [Google Scholar] [CrossRef]
- Angelino, D.; Godos, J.; Ghelfi, F.; Tieri, M.; Titta, L.; Lafranconi, A.; Marventano, S.; Alonzo, E.; Gambera, A.; Sciacca, S. Fruit and vegetable consumption and health outcomes: An umbrella review of observational studies. Int. J. Food Sci. Nutr. 2019, 70, 652–667. [Google Scholar] [CrossRef]
- Fausnacht, A.; Myers, E.; Hess, E.; Davy, B.; Hedrick, V. Update of the BEVQ-15, a beverage intake questionnaire for habitual beverage intake for adults: Determining comparative validity and reproducibility. J. Hum. Nutr. Diet. 2020, 33, 729–737. [Google Scholar] [CrossRef]
- Hedrick, V.E.; Savla, J.; Comber, D.L.; Flack, K.D.; Estabrooks, P.A.; Nsiah-Kumi, P.A.; Ortmeier, S.; Davy, B.M. Development of a brief questionnaire to assess habitual beverage intake (BEVQ-15): Sugar-sweetened beverages and total beverage energy intake. J. Acad. Nutr. Diet. 2012, 112, 840–849. [Google Scholar] [CrossRef] [Green Version]
- Norman-Burgdolf, H.; DeWitt, E.; Cardarelli, K.M.; Gillespie, R.; Slone, S.; Gustafson, A. Sugar-sweetened beverage consumption among adults in rural Appalachia. Prev. Med. Rep. 2021, 24, 101642. [Google Scholar] [CrossRef] [PubMed]
- Glasgow, R.E.; Harden, S.M.; Gaglio, B.; Rabin, B.; Smith, M.L.; Porter, G.C.; Ory, M.G.; Estabrooks, P.A. RE-AIM Planning and Evaluation Framework: Adapting to New Science and Practice With a 20-Year Review. Front. Public Health 2019, 7, 64. [Google Scholar] [CrossRef] [Green Version]
- Holzman, D.C. Diet and Nutrition: White House Proposes Healthy Food Financing Initiative; National Institute of Environmental Health Sciences: Durham, NC, USA, 2010. [Google Scholar]
- Wykoff, R. The Intergenerational Cycles of Rural Health. Am. J. Public Health 2020, 110, 1279–1280. [Google Scholar] [CrossRef] [PubMed]
- Rural Health in America: How Shifting Populations Leave People Behind. 2019. Available online: https://nihcm.org/publications/rural-health-in-america-how-shifting-populations-leave-people-behind (accessed on 25 August 2020).
- Powell, L.M.; Slater, S.; Mirtcheva, D.; Bao, Y.; Chaloupka, F.J. Food store availability and neighborhood characteristics in the United States. Prev. Med. 2007, 44, 189–195. [Google Scholar] [CrossRef] [PubMed]
- Cho, C.; Volpe, R. Independent Grocery Stores in the Changing Landscape of the US Food Retail Industry; U.S. Department of Agriculture, Economic Research Service: Washington, DC, USA, 2017. [Google Scholar]
- Leone, L.A.; Fleischhacker, S.; Anderson-Steeves, B.; Harper, K.; Winkler, M.; Racine, E.; Baquero, B.; Gittelsohn, J. Healthy food retail during the COVID-19 pandemic: Challenges and future directions. Int. J. Environ. Res. Public Health 2020, 17, 7397. [Google Scholar] [CrossRef] [PubMed]
- Ellison, B.; McFadden, B.; Rickard, B.J.; Wilson, N.L. Examining food purchase behavior and food values during the COVID-19 pandemic. Appl. Econ. Perspect. Policy 2021, 43, 58–72. [Google Scholar] [CrossRef]
- Schaeffer, K. Among U.S. Couples, Women do More Cooking and Grocery Shopping Than Men. 2019. Available online: https://www.pewresearch.org/fact-tank/2019/09/24/among-u-s-couples-women-do-more-cooking-and-grocery-shopping-than-men/ (accessed on 10 November 2021).
- Crimarco, A.; Landry, M.J.; Gardner, C.D. Ultra-Processed Foods, Weight Gain, and Co-Morbidity Risk. Curr. Obes. Rep. 2021, 1–13. [Google Scholar] [CrossRef] [PubMed]
- Rahkovsky, I.; Snyder, S. Food Choices and Store Proximity; U.S. Department of Agriculture, Economic Research Service: Washington, DC, USA, 2015. [Google Scholar]
- Redman, R. Online Grocery to More Than Double Market Share by 2025. Available online: https://www.supermarketnews.com/online-retail/online-grocery-more-double-market-share-2025 (accessed on 20 January 2022).
- Redman, R. Increased Use of Online Grocery Shopping ‘Here to Stay’. 2021. Available online: https://www.supermarketnews.com/online-retail/increased-use-online-grocery-shopping-here-stay (accessed on 20 January 2022).
- United States Department of Agriculture. Kentucky, Missouri, and Texas Added to Innovative SNAP Online Pilot Program; United States Department of Agriculture: Washington, DC, USA, 2020. [Google Scholar]
- Food Research & Action Center. Rural Hunger in America: Supplemental Nutrition Assistance Program. 2018. Available online: https://frac.org/wp-content/uploads/rural-hunger-in-america-snap-get-the-facts.pdf (accessed on 25 August 2020).


| Demographic Characteristic | Time Point One n = 152 n (%) | Time Point Two n = 74 n (%) |
|---|---|---|
| Age (median (range), in years) | 56.0 (22–84) | 59.5 (22–85) |
| Gender | ||
| Male | 53 (34.9) | 23 (31.1) |
| Female | 99 (65.1) | 51 (68.9) |
| Race | ||
| White | 150 (98.7) | 74 (100) |
| Non-white | 2 (1.3) | 0 (0) |
| Education | ||
| Less than high school | 66 (43.4) | 26 (35.1) |
| High school graduate | 55 (36.2) | 30 (40.5) |
| Post-high school | 31 (20.4) | 18 (24.3) |
| Household Income | ||
| <$20,000 | 90 (60.4) | 44 (61.1) |
| ≥$20,000 | 59 (39.6) | 28 (38.9) |
| SNAP Participation | ||
| Yes | 60 (39.5) | 31 (41.9) |
| No | 92 (60.5) | 43 (58.1) |
| Travel time to store for grocery shopping | ||
| Less than 10 min | - | 19 (25.7) |
| 10–20 min | - | 14 (18.9) |
| 20–30 min | - | 24 (32.4) |
| More than 30 min | - | 17 (23.0) |
| Where do you get most of your groceries? 1 | ||
| Grocery Store | 122 (80.3) | 48 (63.5) |
| Supercenter | 31 (20.4) | 36 (48.6) |
| Discount Store | 1 (0.7) | 2 (2.7) |
| What is the primary reason you shop there? 1 | ||
| Price | 64 (42.1) | 22 (29.7) |
| Location | 62 (40.8) | 31 (41.9) |
| Quality | 12 (7.9) | 11 (14.9) |
| Variety | 14 (9.2) | 19 (25.7) |
| Time Point Two Shopping | ||||
|---|---|---|---|---|
| Time Point One Shopping | Yes n (%) | No n (%) | p-Value 1 | |
| Grocery Stores | Yes | 42 (56.8) | 14 (18.9) | 0.04 * |
| No | 5 (6.8) | 13 (17.6) | ||
| Super Stores | Yes | 16 (21.6) | 3 (4.1) | 0.0004 * |
| No | 20 (27.0) | 35 (47.3) | ||
| Discount Stores | Yes | 0 (0.0) | 1 (1.4) | 0.56 |
| No | 2 (2.7) | 71 (95.6) | ||
| Price Motivated | Yes | 8 (10.8) | 19 (25.7) | 0.38 |
| No | 14 (18.9) | 33 (44.6) | ||
| Location Motivated | Yes | 19 (25.7) | 13 (17.6) | 0.84 |
| No | 12 (16.2) | 30 (40.5) | ||
| Quality Motivated | Yes | 4 (5.4) | 2 (2.7) | 0.10 |
| No | 7 (9.5) | 61 (82.4) | ||
| Variety Motivated | Yes | 6 (8.1) | 3 (4.1) | 0.01 * |
| No | 13 (17.6) | 52 (70.3) | ||
| Food & Beverages | No Change | Already | Started | p-Value 1 |
|---|---|---|---|---|
| Fruit Juice | −0.2 ± 0.6 | −0.0 ± 0.2 | 0.1 ± 0.6 | 0.184 |
| Fruit | −0.3 ± 0.8 | −0.4 ± 0.8 | 0.2 ± 0.8 | 0.036 * |
| Tomato Sauce | −0.1 ± 0.2 | 0.0 ± 0.3 | 0.1 ± 0.3 | 0.035 * |
| Fruit/Vegetable overall | −0.7 ± 2.4 | −0.7 ± 2.2 | 1.4 ± 2.7 | 0.008 * |
| Water (grams) | 149.0 ± 650.2 | 0.9 ± 315.2 | 72.8 ± 684.7 | 0.675 |
| Total Beverage (Calories) | −146.0 ± 387.8 | 12.7 ± 273.6 | 53.7 ± 208.3 | 0.057 |
| Total Beverage (grams) | −229.0 ± 1331.9 | −85.9 ± 569.3 | −19.3 ± 811.3 | 0.756 |
| SSB (calories) | −18.9 ± 248.0 | 29.3 ± 179.4 | 82.4 ± 214.0 | 0.272 |
| SSB (grams) | −29.0 ± 633.4 | 47.7 ± 444.0 | 164.4 ± 722.1 | 0.539 |
| Milk (grams) | −150.9 ± 355.6 | −13.3 ± 190.6 | −47.5 ± 313.5 | 0.204 |
| Alcohol (grams) | −6.1 ± 20.2 | −2.7 ± 11.7 | 17.3 ± 54.1 | 0.036 * |
Publisher’s Note: MDPI stays neutral with regard to jurisdictional claims in published maps and institutional affiliations. |
© 2022 by the authors. Licensee MDPI, Basel, Switzerland. This article is an open access article distributed under the terms and conditions of the Creative Commons Attribution (CC BY) license (https://creativecommons.org/licenses/by/4.0/).
Share and Cite
Gillespie, R.; DeWitt, E.; Slone, S.; Cardarelli, K.; Gustafson, A. The Impact of a Grocery Store Closure in One Rural Highly Obese Appalachian Community on Shopping Behavior and Dietary Intake. Int. J. Environ. Res. Public Health 2022, 19, 3506. https://doi.org/10.3390/ijerph19063506
Gillespie R, DeWitt E, Slone S, Cardarelli K, Gustafson A. The Impact of a Grocery Store Closure in One Rural Highly Obese Appalachian Community on Shopping Behavior and Dietary Intake. International Journal of Environmental Research and Public Health. 2022; 19(6):3506. https://doi.org/10.3390/ijerph19063506
Chicago/Turabian StyleGillespie, Rachel, Emily DeWitt, Stacey Slone, Kathryn Cardarelli, and Alison Gustafson. 2022. "The Impact of a Grocery Store Closure in One Rural Highly Obese Appalachian Community on Shopping Behavior and Dietary Intake" International Journal of Environmental Research and Public Health 19, no. 6: 3506. https://doi.org/10.3390/ijerph19063506
APA StyleGillespie, R., DeWitt, E., Slone, S., Cardarelli, K., & Gustafson, A. (2022). The Impact of a Grocery Store Closure in One Rural Highly Obese Appalachian Community on Shopping Behavior and Dietary Intake. International Journal of Environmental Research and Public Health, 19(6), 3506. https://doi.org/10.3390/ijerph19063506