
Weekly Variations of Well-Being and Interactions with Training and Match Intensities: A Descriptive Case Study in Youth Male Soccer Players

 ,
,  ,
,  ,
,  ,
,  ,
,  ,
,  ,
,  ,
,  and
and 
Abstract
:1. Introduction
2. Materials and Methods
2.1. Study Design
2.2. Setting
2.3. Participants
2.4. Well-Being Questionnaire
2.5. Training and Match Intensity
2.6. Statistical Procedures
3. Results
4. Discussion
5. Conclusions
Author Contributions
Funding
Institutional Review Board Statement
Informed Consent Statement
Data Availability Statement
Conflicts of Interest
References
- Halson, S.L. Monitoring Training Load to Understand Fatigue in Athletes. Sport. Med. 2014, 44, 139–147. [Google Scholar] [CrossRef] [Green Version]
- Williams, S.; Trewartha, G.; Cross, M.J.; Kemp, S.P.T.; Stokes, K.A. Monitoring What Matters: A Systematic Process for Selecting Training-Load Measures. Int. J. Sports Physiol. Perform. 2017, 12, S2-101–S2-106. [Google Scholar] [CrossRef] [PubMed] [Green Version]
- Akenhead, R.; Nassis, G.P. Training load and player monitoring in high-level football: Current practice and perceptions. Int. J. Sports Physiol. Perform. 2016, 11, 587–593. [Google Scholar] [CrossRef] [PubMed]
- Weston, M. Training load monitoring in elite English soccer: A comparison of practices and perceptions between coaches and practitioners. Sci. Med. Footb. 2018, 2, 216–224. [Google Scholar] [CrossRef]
- Salter, J.; De Ste Croix, M.B.A.; Hughes, J.D.; Weston, M.; Towlson, C. Monitoring Practices of Training Load and Biological Maturity in UK Soccer Academies. Int. J. Sports Physiol. Perform. 2021, 16, 395–406. [Google Scholar] [CrossRef]
- Esposito, G.; Raiola, G. Monitoring the performance and technique consolidation in youth football players. Trends Sport Sci. 2020, 27, 93–100. [Google Scholar]
- Gabbett, T.J.; Nassis, G.P.; Oetter, E.; Pretorius, J.; Johnston, N.; Medina, D.; Rodas, G.; Myslinski, T.; Howells, D.; Beard, A.; et al. The athlete monitoring cycle: A practical guide to interpreting and applying training monitoring data. Br. J. Sports Med. 2017, 51, 1451–1452. [Google Scholar] [CrossRef] [Green Version]
- Selmi, O.; Ouergui, I.; Castellano, J.; Levitt, D.; Bouassida, A. Effect of an intensified training period on well-being indices, recovery and psychological aspects in professional soccer players. Rev. Eur. Psychol. Appl. 2020, 70, 100603. [Google Scholar] [CrossRef]
- Clemente, F.M.; Mendes, B.; Nikolaidis, P.T.; Calvete, F.; Carriço, S.; Owen, A.L. Internal training load and its longitudinal relationship with seasonal player wellness in elite professional soccer. Physiol. Behav. 2017, 179, 262–267. [Google Scholar] [CrossRef]
- Novack, L.F.; de Souza, G.C.; Conde, J.H.S.; de Souza, R.O.; Osiecki, R. Quantification of match internal load and its relationship with physical fitness and recovery state of professional soccer athletes during the competitive period. Hum. Mov. 2018, 19, 30–37. [Google Scholar] [CrossRef] [Green Version]
- Nobari, H.; Aquino, R.; Clemente, F.M.; Khalafi, M.; Adsuar, J.C.; Pérez-Gómez, J. Description of acute and chronic load, training monotony and strain over a season and its relationships with well-being status: A study in elite under-16 soccer players. Physiol. Behav. 2020, 225, 113117. [Google Scholar] [CrossRef] [PubMed]
- Nobari, H.; Alves, A.R.; Haghighi, H.; Clemente, F.M.; Carlos-Vivas, J.; Pérez-Gómez, J.; Ardigò, L.P. Association between training load and well-being measures in young soccer players during a season. Int. J. Environ. Res. Public Health 2021, 18, 4451. [Google Scholar] [CrossRef] [PubMed]
- Duignan, C.; Doherty, C.; Caulfield, B.; Blake, C. Single-item self-report measures of team-sport athlete wellbeing and their relationship with training load: A systematic review. J. Athl. Train. 2020, 55, 944–953. [Google Scholar] [CrossRef]
- Hasan, U.C.; Silva, R.; Clemente, F. Weekly variations of biomechanical load variables in professional soccer players: Comparisons between playing positions. Hum. Mov. 2021, 22, 19–34. [Google Scholar] [CrossRef]
- Nobari, H.; Fani, M.; Clemente, F.M.; Carlos-Vivas, J.; Pérez-Gómez, J.; Ardigò, L.P. Intra- and Inter-week Variations of Well-Being Across a Season: A Cohort Study in Elite Youth Male Soccer Players. Front. Psychol. 2021, 12, 671072. [Google Scholar] [CrossRef]
- Haddad, M.; Stylianides, G.; Djaoui, L.; Dellal, A.; Chamari, K. Session-RPE Method for Training Load Monitoring: Validity, Ecological Usefulness, and Influencing Factors. Front. Neurosci. 2017, 11, 612. [Google Scholar] [CrossRef]
- Hooper, S.L.; Mackinnon, L.T. Monitoring Overtraining in Athletes. Sport. Med. 1995, 20, 321–327. [Google Scholar] [CrossRef]
- De Muynck, G.-J.; Morbée, S.; Soenens, B.; Haerens, L.; Vermeulen, O.; Vande Broek, G.; Vansteenkiste, M. Do both coaches and parents contribute to youth soccer players’ motivation and engagement? An examination of their unique (de)motivating roles. Int. J. Sport Exerc. Psychol. 2021, 19, 761–779. [Google Scholar] [CrossRef] [Green Version]
- Berengüí, R.; Carralero, R.; Castejón, M.A.; Campos-Salinas, J.A.; Cantón, E. Values, motivational orientation and team cohesion amongst youth soccer players. Int. J. Sports Sci. Coach. 2021. [Google Scholar] [CrossRef]
- Borg, G. Perceived Exertion and Pain Scales; Human Kinetics: Champaign IL, USA, 1998; ISBN 0880116234. [Google Scholar]
- Foster, C.; Florhaug, J.A.; Franklin, J.; Gottschall, L.; Hrovatin, L.A.; Parker, S.; Doleshal, P.; Dodge, C. A new approach to monitoring exercise training. J. Strength Cond. Res. 2001, 15, 109–115. [Google Scholar]
- Batterham, A.M.; Hopkins, W.G. Making Meaningful Inferences about Magnitudes. Int. J. Sports Physiol. Perform. 2006, 1, 50–57. [Google Scholar] [CrossRef] [PubMed]
- Robey, E.; Dawson, B.; Halson, S.; Gregson, W.; Goodman, C.; Eastwood, P. Sleep quantity and quality in elite youth soccer players: A pilot study. Eur. J. Sport Sci. 2014, 14, 410–417. [Google Scholar] [CrossRef] [PubMed]
- Oliveira, R.; Brito, J.P.; Martins, A.; Mendes, B.; Marinho, D.A.; Ferraz, R.; Marques, M.C. In-season internal and external training load quantification of an elite European soccer team. PLoS ONE 2019, 14, e0209393. [Google Scholar]
- Nobari, H.; Silva, A.F.; Clemente, F.M.; Siahkouhian, M.; García-Gordillo, M.Á.; Adsuar, J.C.; Pérez-Gómez, J. Analysis of Fitness Status Variations of Under-16 Soccer Players Over a Season and Their Relationships With Maturational Status and Training Load. Front. Physiol. 2021, 11, 1840. [Google Scholar] [CrossRef]
- Martins, A.D.; Oliveira, R.; Brito, J.P.; Loureiro, N.; Querido, S.M.; Nobari, H. Intra-season variations in workload parameters in europe’s elite young soccer players: A comparative pilot study between starters and non-starters. Healthcare 2021, 9, 977. [Google Scholar] [CrossRef] [PubMed]
- Oliveira, R.; Brito, J.P.; Moreno-Villanueva, A.; Nalha, M.; Rico-González, M.; Clemente, F.M. Reference values for external and internal training intensity monitoring in young male soccer players: A systematic review. Healthcare 2021, 9, 1567. [Google Scholar] [CrossRef] [PubMed]
- Moalla, W.; Fessi, M.S.; Farhat, F.; Nouira, S.; Wong, D.P.; Dupont, G. Relationship between daily training load and psychometric status of professional soccer players. Res. Sport Med. 2016, 24, 387–394. [Google Scholar] [CrossRef]
- Greco, G.; Tambolini, R.; Ambruosi, P.; Fischetti, F. Negative effects of smartphone use on physical and technical performance of young footballers. J. Phys. Educ. Sport 2017, 17, 2495–2501. [Google Scholar]
- Fessi, M.S.; Moalla, W. Postmatch Perceived Exertion, Feeling, and Wellness in Professional Soccer Players. Int. J. Sports Physiol. Perform. 2018, 13, 631–637. [Google Scholar] [CrossRef]
- Lastella, M.; Roach, G.D.; Sargent, C. Travel fatigue and sleep/wake behaviors of professional soccer players during international competition. Sleep Health 2019, 5, 141–147. [Google Scholar] [CrossRef]


| Week | Start Date | End Date | Sessions (N) | Matches (N) |
|---|---|---|---|---|
| Week 1 | 29 July 2022 | 1 August 2021 | 3 | 0 |
| Week 2 | 3 August 2021 | 8 August 2021 | 4 | 1 |
| Week 3 | 10 August 2021 | 14 August 2021 | 4 | 1 |
| Week 4 | 17 August 2021 | 20 August 2021 | 4 | 0 |
| Week 5 | 24 August 2021 | 28 August 2021 | 4 | 1 |
| Week 6 | 30 August 2021 | 5 September 2021 | 3 | 2 |
| Week 7 | 6 September 2021 | 12 September 2021 | 5 | 0 |
| Week 8 | 13 September 2021 | 18 September 2021 | 4 | 1 |
| Week 9 | 20 September 2021 | 26 September 2021 | 4 | 1 |
| Week 10 | 27 September 2021 | 3 October 2021 | 4 | 2 |
| Week 11 | 4 October 2021 | 10 October 2021 | 3 | 2 |
| Week 12 | 11 October 2021 | 16 October 2021 | 3 | 2 |
| Week 13 | 18 October 2021 | 24 October 2021 | 4 | 2 |
| Week 14 | 25 October 2021 | 31 October 2021 | 4 | 2 |
| Week 15 | 1 November 2021 | 6 November 2021 | 5 | 0 |
| Week 16 | 8 November 2021 | 14 November 2021 | 4 | 2 |
| Week 17 | 15 November 2021 | 17 November 2021 | 2 | 0 |
| Score | Sleep Quality | Readiness | Fatigue | DOMS |
|---|---|---|---|---|
| 10 | Excellent | Totally available | Tired/Exhaustion | Extremely sore |
| 9 | ||||
| 8 | Good | Available | Very high | Very sore |
| 7 | ||||
| 6 | Sore | |||
| 5 | Moderate | Moderate | Moderate | Moderate |
| 4 | ||||
| 3 | Bad | Little available | ||
| 2 | Light | Light | ||
| 1 | Very bad | Very little available | ||
| 0 | No sleep | Nothing available | None | None |
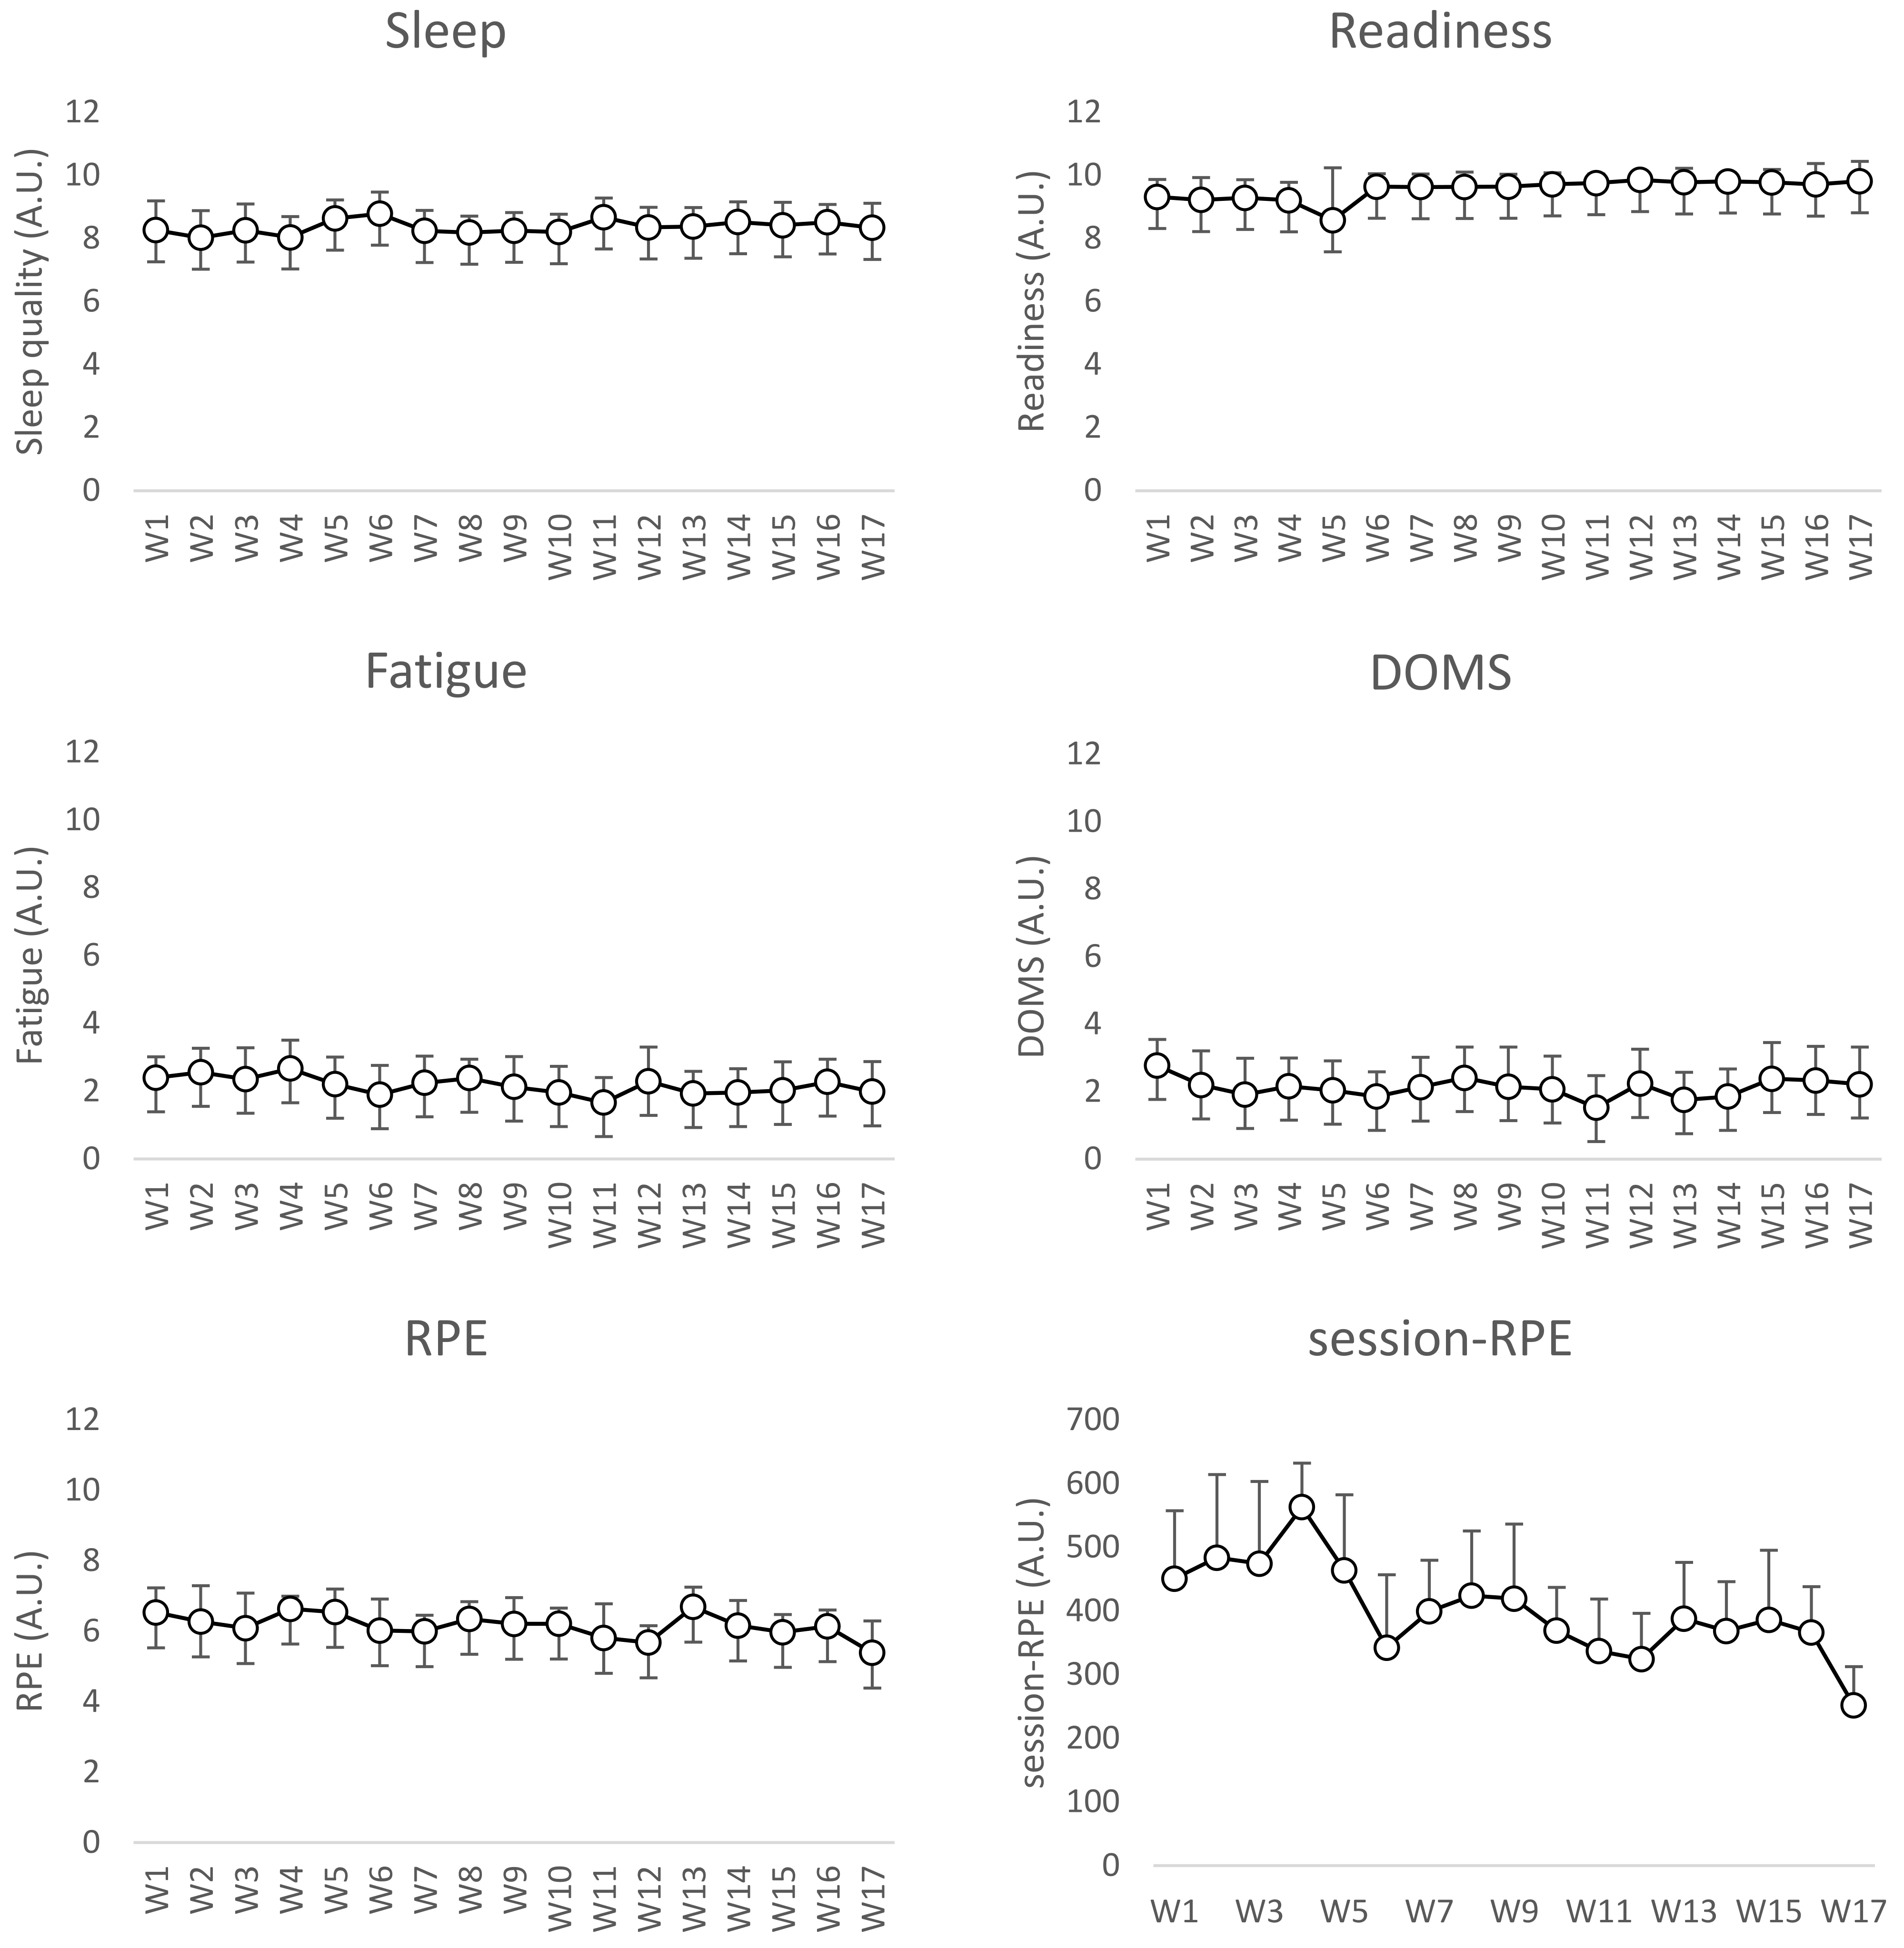
| Week | Sleep Quality (A.U.) | Readiness (A.U.) | Fatigue (A.U.) | DOMS (A.U.) | RPE (A.U.) | Session-RPE (A.U.) |
|---|---|---|---|---|---|---|
| W1 | 8.3 ± 0.9 | 9.3 ± 0.5 w11,w12,w14 | 2.4 ± 0.6 w11 | 2.8 ± 0.8 w5,w6,w11,w13,w14 | 6.5 ± 0.7 w7,w12,w15,w17 | 450.7 ± 106.9 w4,w11,w12,w17 |
| W2 | 8.0 ± 0.9 w6 | 9.2 ± 0.7 w12,w13 | 2.6 ± 0.7 w11 | 2.2 ± 1.0 | 6.3 ± 1.0 | 483.5 ± 130.6 w6,w10,w11,w12,w14,w16,w17 |
| W3 | 8.3 ± 0.8 | 9.3 ± 0.6 w11,w12,w13,w14 | 2.4 ± 0.9 | 1.9 ± 1.1 | 6.1 ± 1.0 | 474.2 ± 129.3 w11,w12,w14,w16,w17 |
| W4 | 8.0 ± 0.7 | 9.2 ± 0.6 w6,w9,w11,w12,w13,w14 | 2.7 ± 0.8 w6,w9,w10,w11,w14 | 2.2 ± 0.8 | 6.7 ± 0.4 w7,w10,w11,w12,w15,w16,w17 | 563.4 ± 69.1 w1,w6-w17 |
| W5 | 8.6 ± 0.6 | 8.6 ± 1.7 w12 | 2.2 ± 0.8 | 2.0 ± 0.9 | 6.6 ± 0.7 w7,w12,w15,w17 | 463.7 ± 118.8 w4,w11,w12,w14,w16,w17 |
| W6 | 8.8 ± 0.7 w2 | 9.6 ± 0.4 w4 | 1.9 ± 0.9 w4 | 1.9 ± 0.7 | 6.0 ± 0.9 | 342.2 ± 114.6 w2,w4 |
| W7 | 8.2 ± 0.6 | 9.6 ± 0.4 | 2.2 ± 0.8 | 2.1 ± 0.9 | 6.0 ± 0.5 w1,w4,w5,w13 | 399.2 ± 80.6 w4,w17 |
| W8 | 8.2 ± 0.5 | 9.6 ± 0.5 | 2.4 ± 0.6 w11 | 2.4 ± 0.9 w11 | 6.4 ± 0.5 w12,w17 | 424.0 ± 117.4 w4,w11,w17 |
| W9 | 8.2 ± 0.6 | 9.6 ± 0.4 w4 | 2.1 ± 0.9 w4 | 2.1 ± 1.2 | 6.2 ± 0.7 | 419.2 ± 117.4 w4,w17 |
| W10 | 8.2 ± 0.6 | 9.7 ± 0.4 | 2.0 ± 0.8 w4 | 2.1 ± 1.0 | 6.2 ± 0.4 w4,w12 | 369.2 ± 67.9 w2,w4,w17 |
| W11 | 8.7 ± 0.6 | 9.8 ± 0.3 w1,w3,w4 | 1.7 ± 0.7 w1,w2,w4,w8 | 1.5 ± 1.0 w8,w12,w16 | 5.8 ± 1.0 w4 | 336.2 ± 81.8 w1,w2,w3,w4,w5,w8,w17 |
| W12 | 8.4 ± 0.6 | 9.9 ± 0.2 w1,w2,w3,w4,w5 | 2.3 ± 1.0 | 2.2 ± 1.0 w11 | 5.7 ± 0.5 w1,w4,w5,w8,w10,w13,w16 | 324.3 ± 71.9 w1,w2,w3,w4,w5 |
| W13 | 8.4 ± 0.6 | 9.8 ± 0.4 w2,w3,w4 | 1.9 ± 0.7 | 1.8 ± 0.8 | 6.7 ± 0.6 w7,w12,w15,w16,w17 | 387.7 ± 88.7 w4,w17 |
| W14 | 8.5 ± 0.6 | 9.8 ± 0.3 w1,w3,w4 | 2.0 ± 0.7 w4 | 1.9 ± 0.8 | 6.2 ± 0.7 | 368.5 ± 77.4 w2,w3,w4,w5,w17 |
| W15 | 8.4 ± 0.7 | 9.8 ± 0.4 | 2.0 ± 0.9 | 2.4 ± 1.1 | 6.0 ± 0.5 w1,w4,w5,w13 | 386.0 ± 109.4 w4,w17 |
| W16 | 8.5 ± 0.6 | 9.7 ± 0.7 | 2.3 ± 0.7 | 2.3 ± 1.0 w11 | 6.1 ± 0.5 w4,w12,w13 | 366.1 ± 72.2 w2,w3,w4,w5,w17 |
| W17 | 8.3 ± 0.8 | 9.8 ± 0.6 | 2.0 ± 0.9 | 2.2 ± 1.1 | 5.4 ± 0.9 w1,w4,w5,w8,w13 | 251.7 ± 61.0 w1–w5;w7-w11,w13–w16 |
| RPE | Session-RPE | |
|---|---|---|
| Sleep | r = −0.018 (−0.109;0.074) p = 0.699 | r = −0.119 * (−0.209;−0.028) p = 0.010 |
| Readiness | r = −0.093 (−0.183;−0.002) p = 0.046 | r = −0.235 ** (−0.319;−0.146) p < 0.001 |
| Fatigue | r = 0.170 ** (0.080;0.258) p < 0.001 | r = 0.325 ** (0.240;0.404) p < 0.001 |
| DOMS | r = 0.111 * (0.071;0.249) p = 0.017 | r = 0.161 ** (0.486;0.249) p < 0.001 |
| RPE | Session-RPE | |
|---|---|---|
| Sleep | r = −0.091 (−0.184;0.004) p = 0.059 | r = −0.091 (−0.184;0.003) p = 0.058 |
| Readiness | r = −0.075 (−0.168;0.020) p = 0.122 | r = −0.115 * (−0.207;−0.021) p = 0.017 |
| Fatigue | r = 0.164 ** (0.070;0.254) p < 0.001 | r = 0.262 ** (0.171;0.347) p < 0.001 |
| DOMS | r = 0.102 * (0.004;0.191) p = 0.035 | r = 0.099 * (0.497;0.626) p = 0.040 |
| Sleep | Readiness | Fatigue | DOMS | |
|---|---|---|---|---|
| RPE | r = 0.049 (−0.046;0.142) p = 0.311 | r = −0.135 ** (−0.227;−0.041) p = 0.005 | r = 0.202 ** (0.109;0.290) p < 0.001 | r = 0.122 * (0.028; 0.214) p = 0.011 |
| Session-RPE | r = 0.021 (−0.074;0.115) p = 0.667 | r = −0.167 ** (−0.257;−0.073) p < 0.001 | r = 0.282 ** (0.193;0.367) p < 0.001 | r = 0.134 * (0.040; 0.225) p = 0.005 |
Publisher’s Note: MDPI stays neutral with regard to jurisdictional claims in published maps and institutional affiliations. |
© 2022 by the authors. Licensee MDPI, Basel, Switzerland. This article is an open access article distributed under the terms and conditions of the Creative Commons Attribution (CC BY) license (https://creativecommons.org/licenses/by/4.0/).
Share and Cite
Silva, A.F.; Oliveira, R.; Cataldi, S.; Clemente, F.M.; Latino, F.; Badicu, G.; Greco, G.; Leão, C.; Bonavolontà, V.; Fischetti, F. Weekly Variations of Well-Being and Interactions with Training and Match Intensities: A Descriptive Case Study in Youth Male Soccer Players. Int. J. Environ. Res. Public Health 2022, 19, 2935. https://doi.org/10.3390/ijerph19052935
Silva AF, Oliveira R, Cataldi S, Clemente FM, Latino F, Badicu G, Greco G, Leão C, Bonavolontà V, Fischetti F. Weekly Variations of Well-Being and Interactions with Training and Match Intensities: A Descriptive Case Study in Youth Male Soccer Players. International Journal of Environmental Research and Public Health. 2022; 19(5):2935. https://doi.org/10.3390/ijerph19052935
Chicago/Turabian StyleSilva, Ana Filipa, Rafael Oliveira, Stefania Cataldi, Filipe Manuel Clemente, Francesca Latino, Georgian Badicu, Gianpiero Greco, César Leão, Valerio Bonavolontà, and Francesco Fischetti. 2022. "Weekly Variations of Well-Being and Interactions with Training and Match Intensities: A Descriptive Case Study in Youth Male Soccer Players" International Journal of Environmental Research and Public Health 19, no. 5: 2935. https://doi.org/10.3390/ijerph19052935
APA StyleSilva, A. F., Oliveira, R., Cataldi, S., Clemente, F. M., Latino, F., Badicu, G., Greco, G., Leão, C., Bonavolontà, V., & Fischetti, F. (2022). Weekly Variations of Well-Being and Interactions with Training and Match Intensities: A Descriptive Case Study in Youth Male Soccer Players. International Journal of Environmental Research and Public Health, 19(5), 2935. https://doi.org/10.3390/ijerph19052935