
Examination of VOC Concentration of Aroma Essential Oils and Their Major VOCs Diffused in Room Air


Abstract
:1. Introduction
2. Materials and Methods
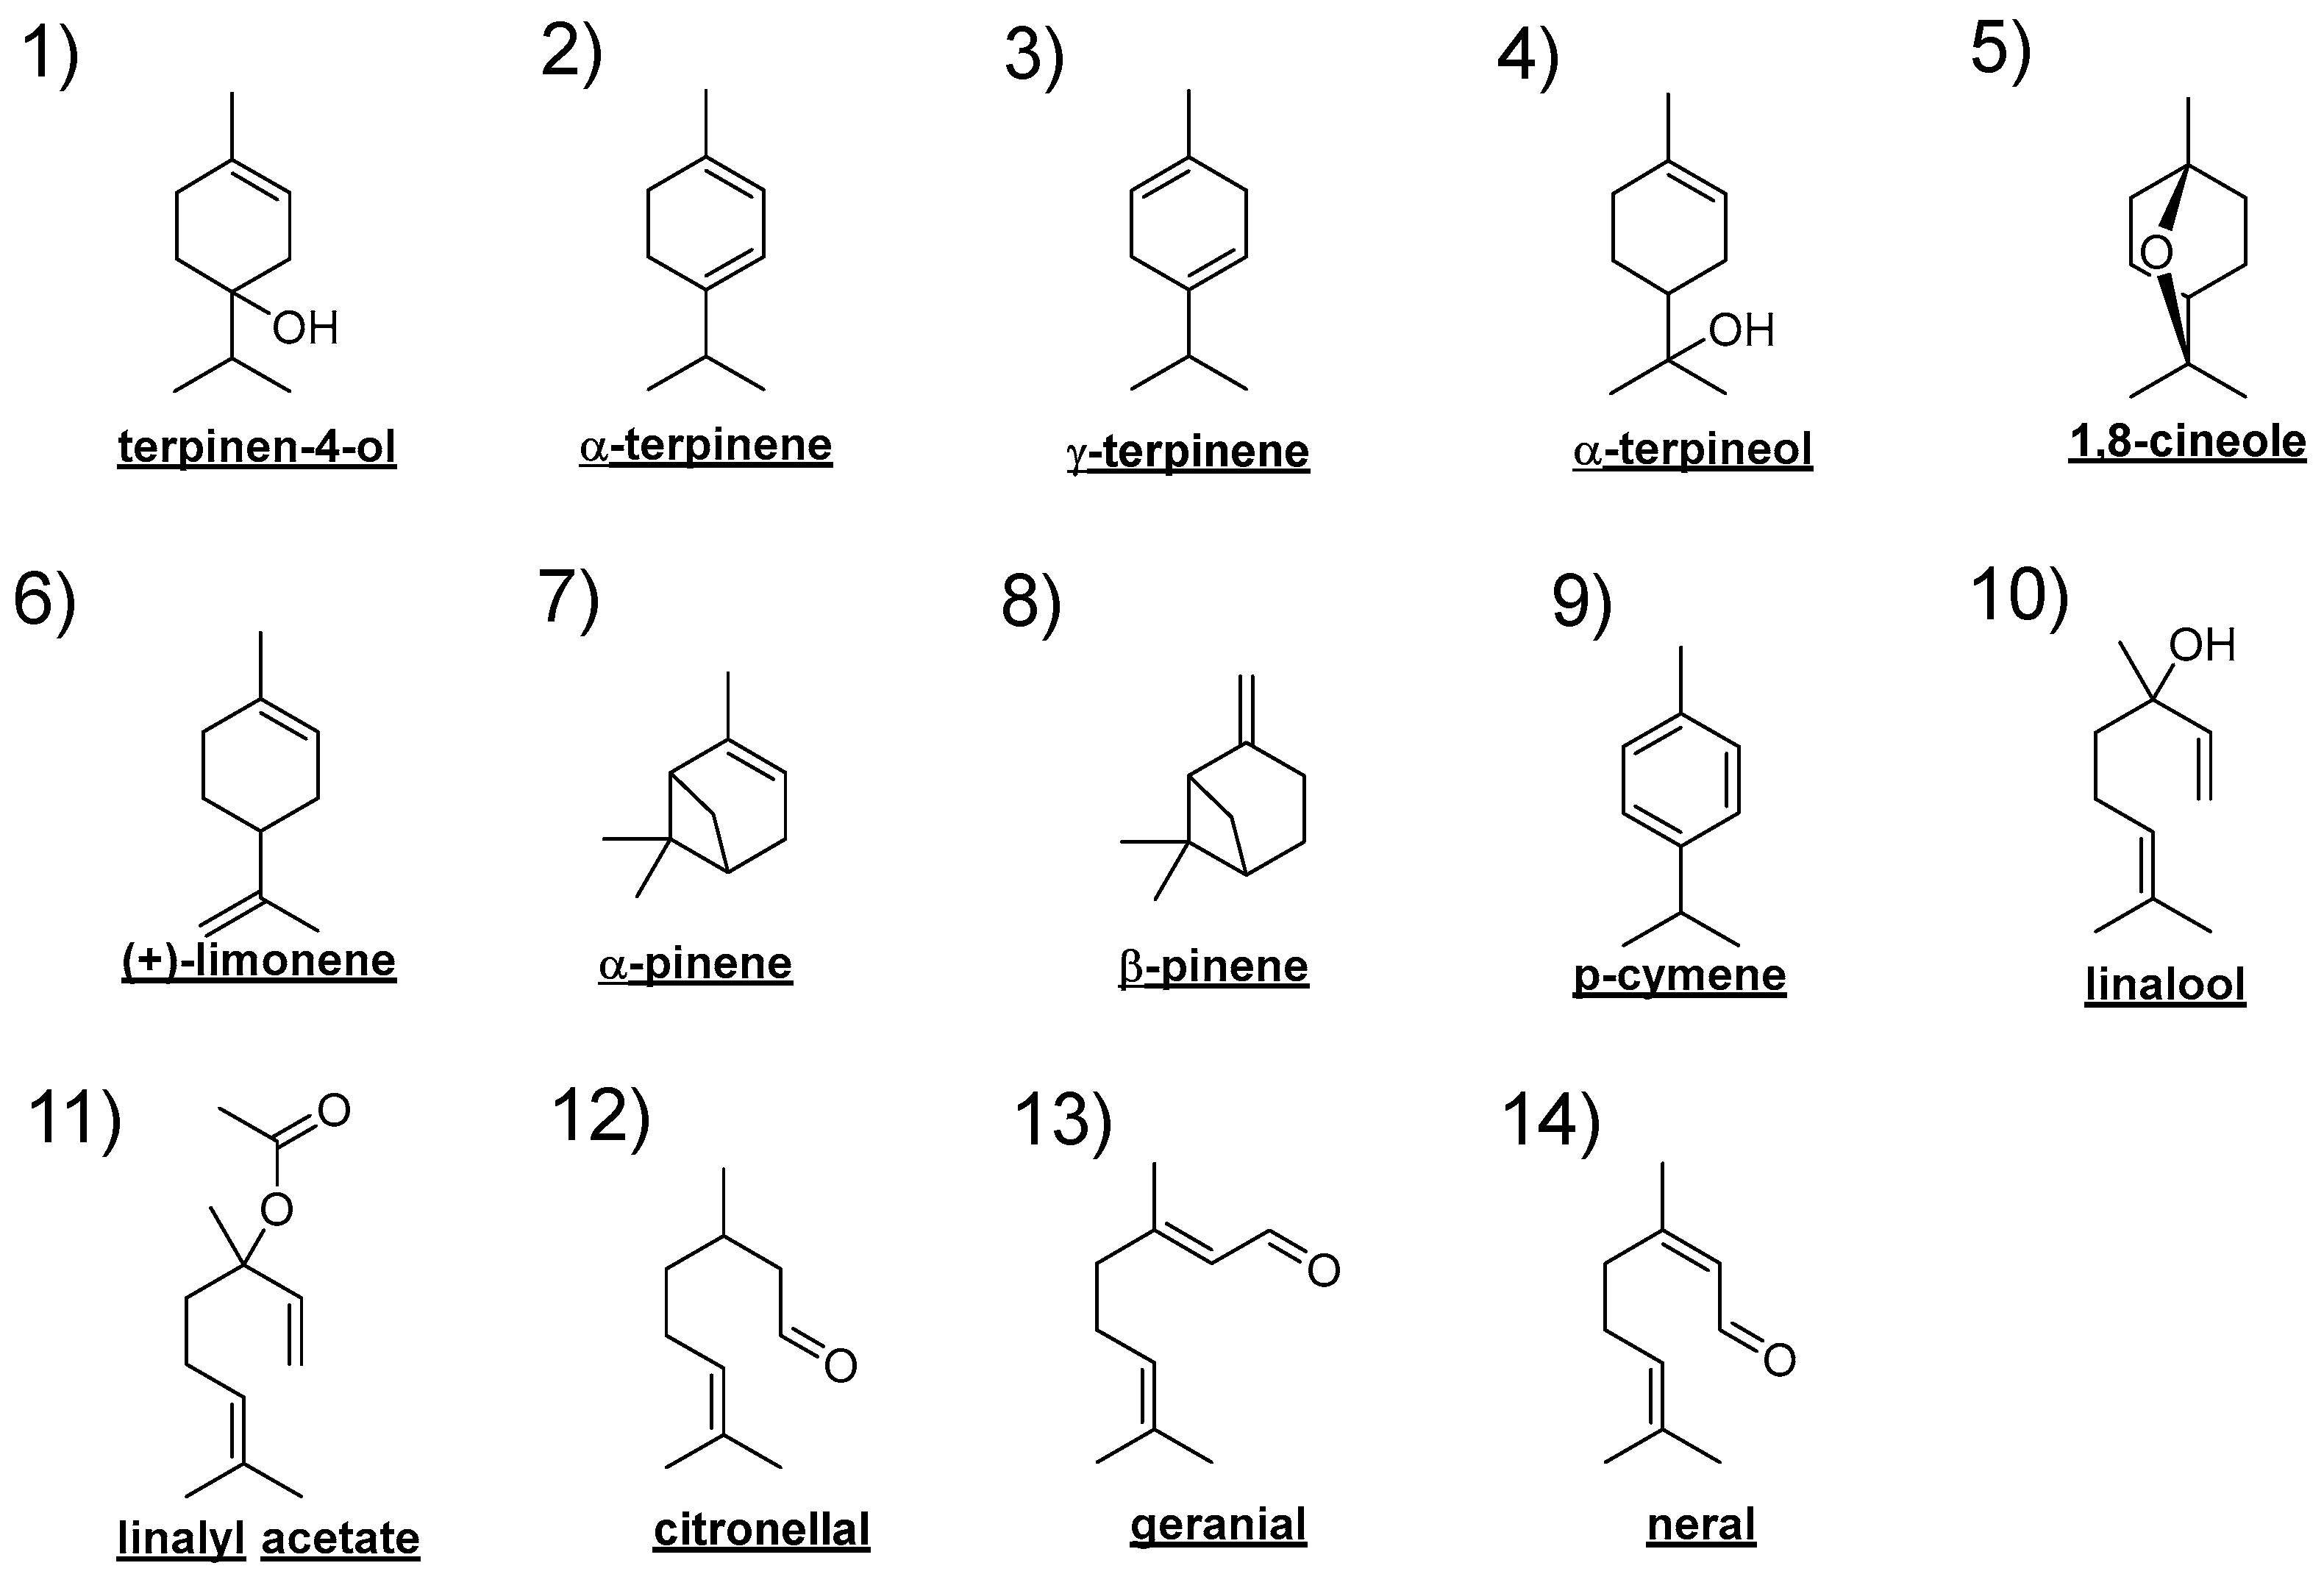
2.1. Essential Oils and Major Components
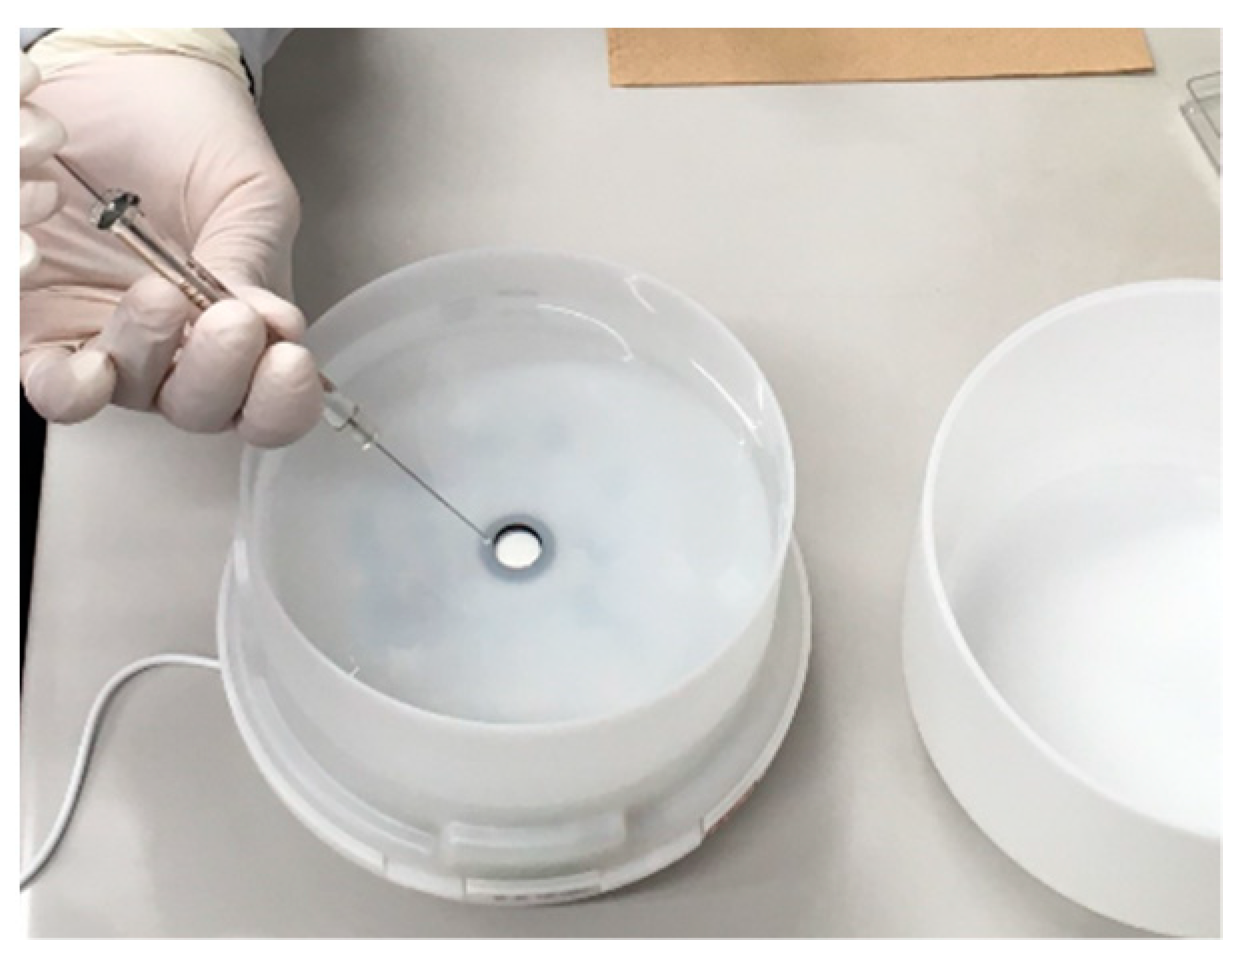
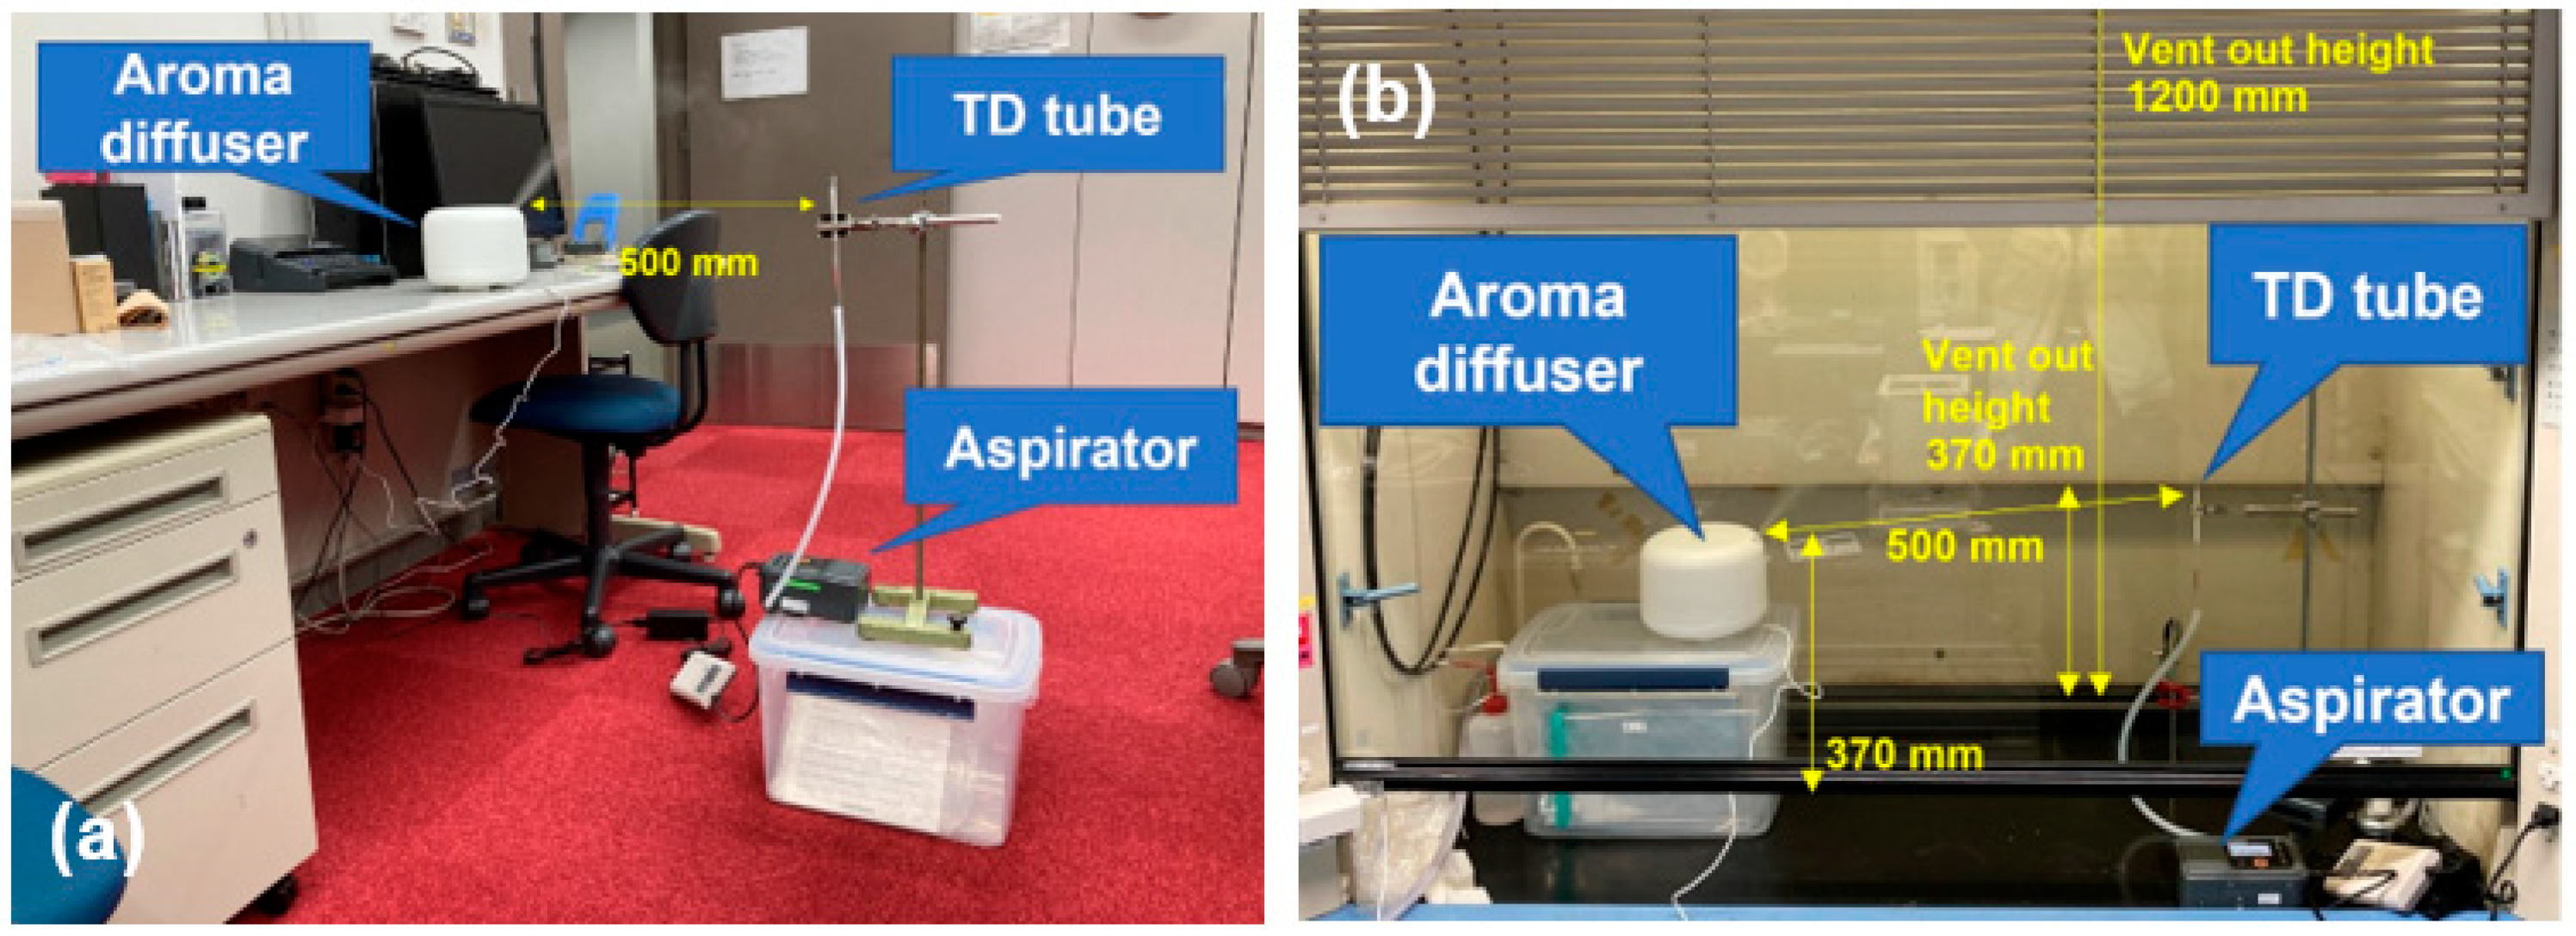
2.2. Diffusion of Essential Oil and VOC into Room Air
2.3. GC/MS Analysis
3. Results
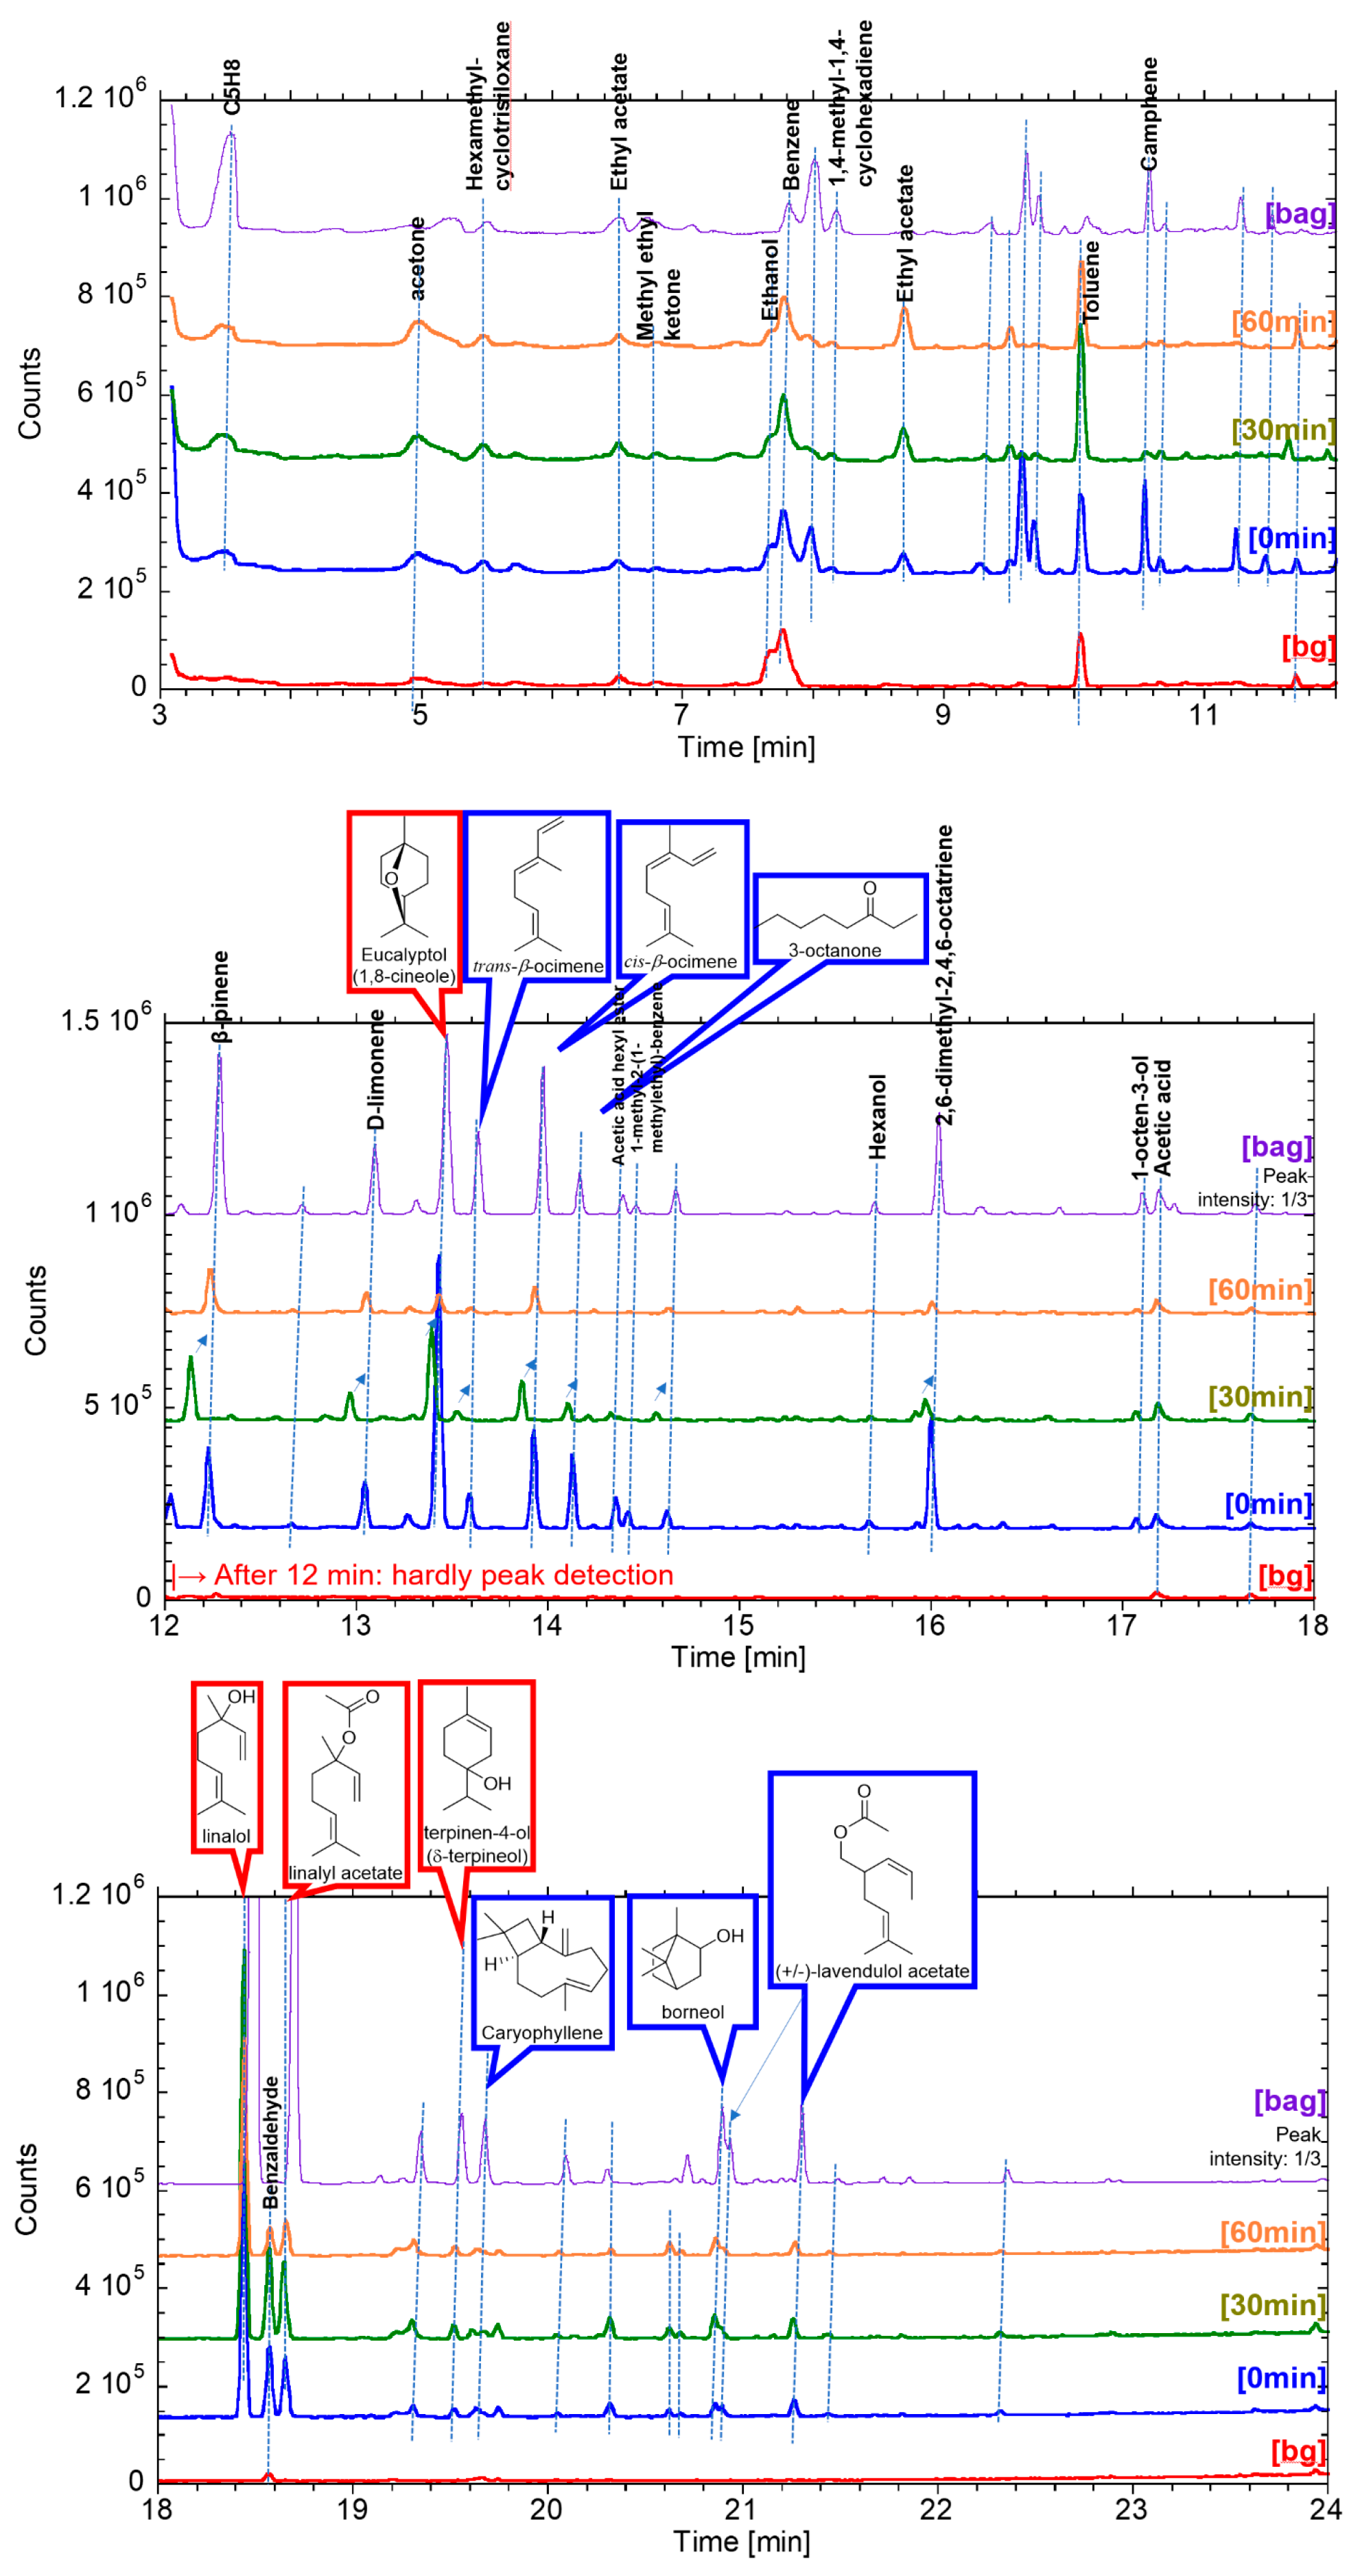
3.1. GC/MS Results of Essential Oils Diffused into Office Room
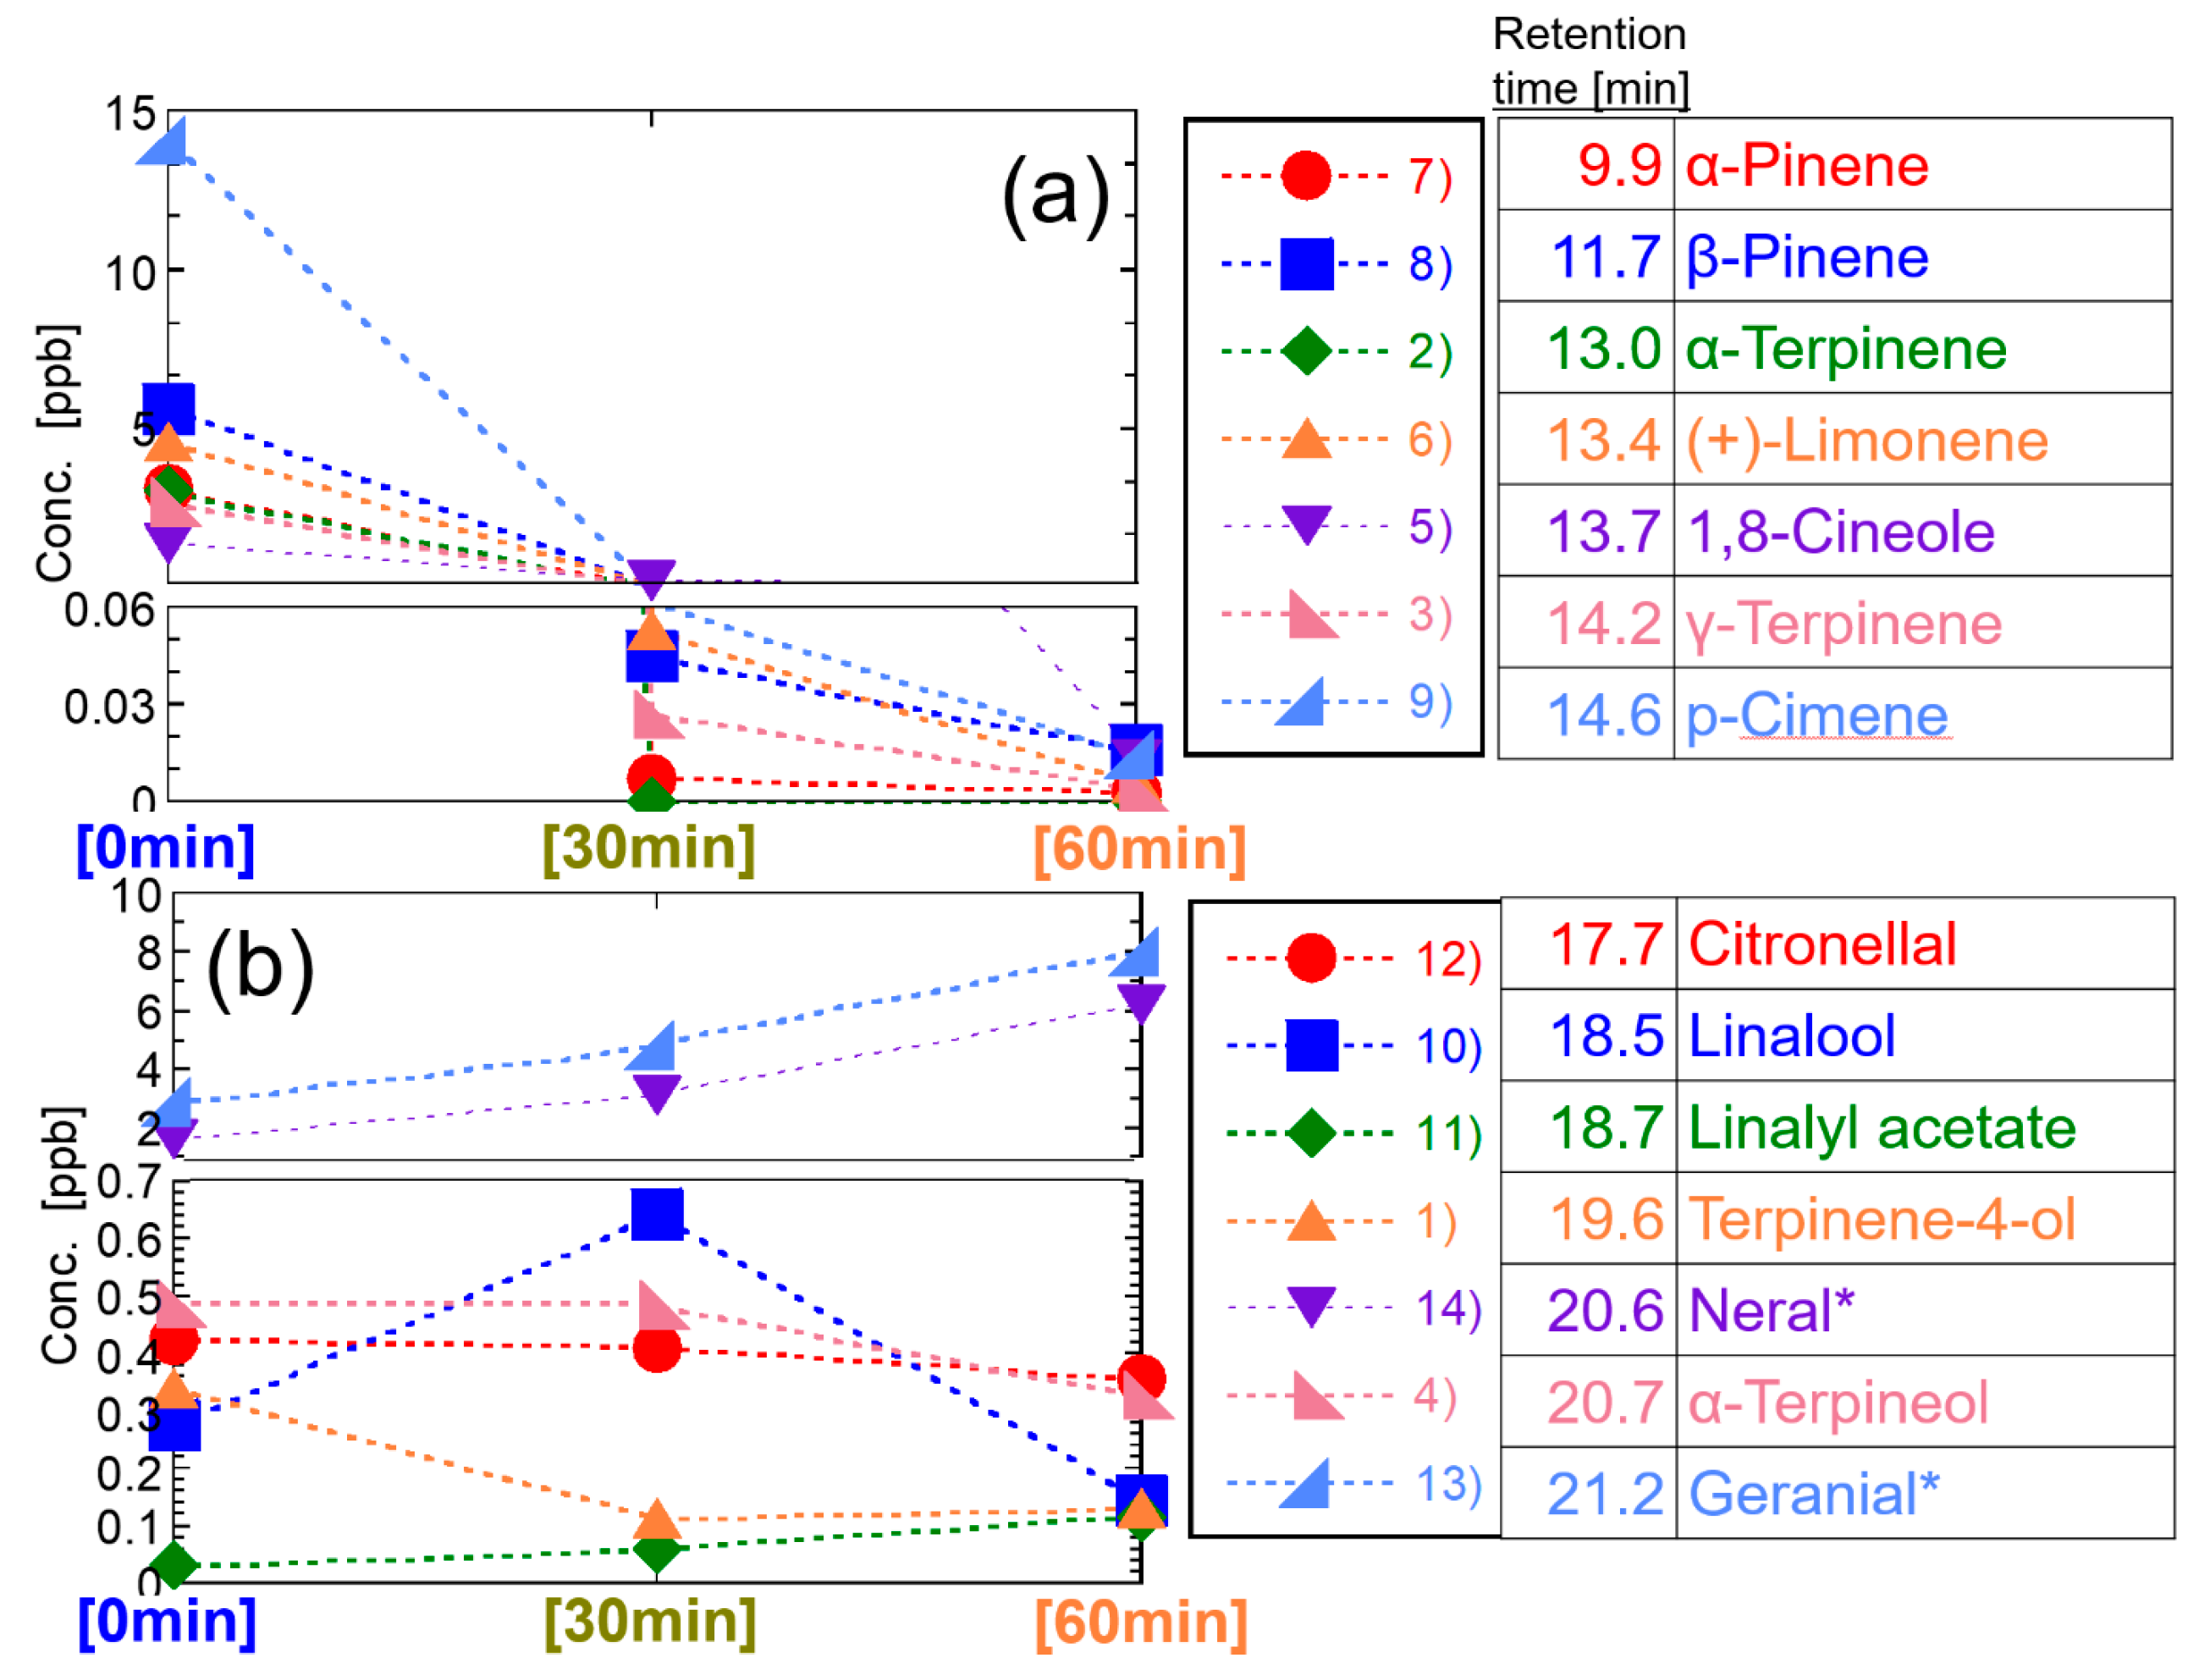
3.2. GC/MS Results of 14 Effective Components Diffused into Draft Chamber
4. Discussions
4.1. Temporal Change of the Concentration of VOCs in Essential Oils
4.2. Safety Issue of VOCs
5. Conclusions
Supplementary Materials
Author Contributions
Funding
Institutional Review Board Statement
Informed Consent Statement
Data Availability Statement
Acknowledgments
Conflicts of Interest
References
- Sasannejad, P.; Saeedi, M.; Shoeibi, A.; Gorji, A.; Abbasi, M.; Foroughipour, M. Lavender essential oil in the treatment of migraine headache: A placebo-controlled clinical trial. Eur. Neurol. 2012, 67, 288–291. [Google Scholar] [CrossRef] [PubMed]
- Yogi, W.; Tsukada, M.; Sato, Y.; Izuno, T.; Inoue, T.; Tsunokawa, Y.; Okumo, T.; Hisamitsu, T.; Sunagawa, M. Influences of Lavender Essential Oil Inhalation on Stress Responses during Short-Duration Sleep Cycles: A Pilot Study. Healthcare 2021, 9, 909. [Google Scholar] [CrossRef] [PubMed]
- Hart, P.H.; Brand, C.; Carson, F.; Riley, T.V.; Prager, R.H.; Finlay-Jones, J.J. Terpinen-4-ol, the main component of the essential oil of Melaleuca alternifolia (tea tree oil), suppresses inflammatory mediator production by activated human monocytes. Inflamm. Res. 2000, 49, 619–626. [Google Scholar] [CrossRef] [PubMed]
- Juergens, U.R.; Dethlefsen, U.; Steinkamp, G.; Gillissen, A.; Repges, R.; Vetter, H. Anti-inflammatory activity of 1.8-cineol (eucalyptol) in bronchial asthma: A double-blind placebo-controlled trial. Respir. Med. 2003, 97, 250–256. [Google Scholar] [CrossRef] [PubMed] [Green Version]
- Ballard, C.G.; O’Brien, J.T.; Reichelt, K.; Perry, E.K. Aromatherapy as a safe and effective treatment for the management of agitation in severe dementia: The results of a double-blind, placebo-controlled trial with Melissa. J. Clin. Psychiatry. 2002, 63, 553–558. [Google Scholar] [CrossRef] [PubMed]
- Cooke, B.; Ernst, E. Aromatherapy: A systematic review. Br. J. Gen. Pract. 2000, 50, 493–496. [Google Scholar] [PubMed]
- Peterfalvi, A.; Miko, E.; Nagy, T.; Reger, B.; Simon, D.; Miseta, A.; Czéh, B.; Szereday, L. Much More Than a Pleasant Scent: A Review on Essential Oils Supporting the Immune System. Molecules 2019, 24, 4530. [Google Scholar] [CrossRef] [PubMed] [Green Version]
- Şentürk, A.; Tekinsoy Kartın, P. The Effect of Lavender Oil Application via Inhalation Pathway on Hemodialysis Patients’ Anxiety Level and Sleep Quality. Holist. Nurs. Pract. 2018, 32, 324–335. [Google Scholar] [CrossRef] [PubMed]
- Sandner, G.; Heckmann, M.; Weghuber, J. Immunomodulatory Activities of Selected Essential Oils. Biomolecules 2020, 10, 1139. [Google Scholar] [CrossRef] [PubMed]
- Api, A.; Belsito, D.; Bruze, M.; Cadby, P.; Calow, P.; Dagli, M.; Dekant, W.; Ellis, G.; Fryer, A.; Fukayama, M.; et al. Criteria for the Research Institute for Fragrance Materials, Inc. (RIFM) safety evaluation process for fragrance ingredients. Food Chem. Toxicol. 2015, 82, S1–S19. [Google Scholar] [CrossRef] [PubMed]
- Koike, K. Phytotherapy; Kyoto Hirokawa, Co.: Kyoto, Japan, 2016; ISBN 978-4-906992-75-1. (In Japanese) [Google Scholar]
- Melissa Oil. Available online: https://www.timeless-edition.com/archives/1399#blend (accessed on 1 December 2021).
- Nurzyńska-Wierdak, R.; Bogucka-Kocka, A.; Szymczak, G. Volatile constituents of Melissa officinalis leaves determined by plant age. Nat. Prod. Commun. 2014, 9, 703–706. [Google Scholar] [CrossRef] [PubMed] [Green Version]
- Lavender Oil. Available online: https://aromapopo.co.jp/hpgen/HPB/entries/21.html (accessed on 1 December 2021).
- Pokajewicz, K.; Biało’n, M.; Svydenko, L.; Fedin, R.; Hudz, N. Chemical Composition of the Essential Oil of the New Cultivars of Lavandula angustifolia Mill. Bred in Ukraine. Molecules 2021, 26, 5681. [Google Scholar] [CrossRef] [PubMed]
- Eucalyptus. Available online: https://felice-kaori.com/article/8891a (accessed on 1 December 2021).
- Sebei, K.; Sakouhi, F.; Herchi, W.; Khouja, M.L.; Boukhchina, S. Chemical composition and antibacterial activities of seven Eucalyptus species essential oils leaves. Biol. Res. 2015, 48, 7. [Google Scholar] [CrossRef] [PubMed] [Green Version]
- Tea Tree Oil. Available online: https://www.cleanplanet.info/lab/Q/t_teatree.html (accessed on 1 December 2021).
- Carson, C.F.; Hammer, K.A.; Riley, T.V. Melaleuca alternifolia (Tea Tree) oil: A review of antimicrobial and other medicinal properties. Clin. Microbiol. Rev. 2006, 19, 50–62. [Google Scholar] [CrossRef] [PubMed] [Green Version]
- Davies, N.W.; Larkman, T.; Marriott, P.J.; Khan, A.I. Determination of Enantiomeric Distribution of Terpenes for Quality Assessment of Australian Tea Tree Oil. J. Agric. Food Chem. 2016, 64, 4817–4819. [Google Scholar] [CrossRef] [PubMed] [Green Version]
- Armanino, N.; Charpentier, J.; Flachsmann, F.; Goeke, A.; Liniger, M.; Kraft, P. What’s Hot, What’s Not: The Trends of the Past 20 Years in the Chemistry of Odourants. Angew. Chem. Int. Ed. 2020, 59, 16310. [Google Scholar] [CrossRef] [PubMed]
- Kroes, R.; Renwick, A.G.; Feron, V.; Galli, C.L.; Gibney, M.; Greim, H.; Guy, R.H.; Lhuguenot, J.C.; van de Sandt, J.J.M. Application of the threshold of toxicological concern (TTC) to the safety evaluation of cosmetic ingredients. Food Chem. Toxicol. 2007, 45, 2533–2562. [Google Scholar] [CrossRef] [PubMed]
- Table of Indoor VOC Concentration Guideline. Available online: http://www.nihs.go.jp/mhlw/chemical/situnai/hyou.html (accessed on 1 December 2021).
- Silva, G.V.; Martins, A.O.; Martins, S.D.S. Indoor Air Quality: Assessment of Dangerous Substances in Incense Products. Int. J. Environ. Res. Public Health 2021, 18, 8086. [Google Scholar] [CrossRef]
- Petry, T.; Vitale, D.; Joachim, F.J.; Smith, B.; Cruse, L.; Mascarenhas, R.; Schneider, S.; Singal, M. Human health risk evaluation of selected VOC, SVOC and particulate emissions from scented candles. Regul. Toxicol. Pharmacol. 2014, 69, 55–70. [Google Scholar] [CrossRef] [PubMed]


| Reference Book [11] | References and Internet Websites [12,13,14,15,16,17,18,19] | |||
|---|---|---|---|---|
| Melissa | (13) Geranial 25.4% (14) Neral 17.9% β-caryophyllene 9.7% (12) Citronellal 8.9% | Germacrene D 6.5% Caryophyllene oxide 5.4% Geraniol 4.6% | (13) Geranial 45.2% (14) Neral 32.8% (12) Citronellal 8.7% β-caryophyllene 3.3% | Caryophyllene oxide 2.1% β-Pinene oxide 1.1% Germacrene D below 0.05%. |
| Lavender | (10) Linalool 44.4% (11) Linalyl acetate 41.6% Lavendulyl acetate 3.7% | β-caryophyllene 1.8% (1) Terpinen-4-ol 1.5% Borneol 1.0% | (11) Linalyl acetate 38.0% (10) Linalool 31.9% cis-β-ocimene 4.0% trans-β-ocimene 2.5% (1) Terpinen-4-ol 2.2% Lavendulyl acetate 2.3% | 3-octanone 1.1% (5) 1,8-cineole + β-phellandrene 1.0% (4) α-terpineol 2.8% Camphor 0.46% Lavendulol 0.42% |
| Tea tree | (1) Terpinen-4-ol 39.8% (3) γ-terpinene 20.1% (2) α-terpinene 9.6% Terpinolene 3.5% | (5) 1,8-cineole 3.1% (4) α-terpineol 2.8% (9) p-cymene 2.7% (7) α-pinene 2.4% | (1) Terpinen-4-ol 37.56% (3) γ-terpinene 22.27% (2) α-terpinene 11.43% (9) p-cymene 4.00% Terpinolene 3.75% (7) α-pinene 2.63% | (5) 1,8-cineole 2.21% (4) α-terpineol 2.01% β-phellandrene 0.97% (6) (+)-limonene 0.96% (8) β-pinene 0.78% |
| Eucalyptus | (5) 1,8-cineole 74.7% (7) α-pinene 9.2% (6) (+)-limonene 5.4% | (E)-pinocarveol 3.4% Globulol 2.7% (9) p-cymene 2.4% | (Globulus) (5) 1,8-cineole 70–90% (7) α-pinene 10–20% (6) (+)-limonene below 10% | (Radiater) (5) 1,8-cineole 60–70% (7) α-pinene 2–5% (6) (+)-limonene 5–10% (Citriodoura) (12) Citronellal 65–75% |
| Instrument | Agilent GC 6890 + MS 5973N |
|---|---|
| Column | DB-WAX UI; length: 30 m, diameter: 0.25 mm, film: 0.50 μm |
| Column oven | hold at 40 °C for 5 min heat up to 240 °C at a rate of 10 °C/min hold at 240 °C for 10 min |
| MS scan | m/z: 27–450 |
| Wait time [min] | 3 |
| Threshold | 100 |
| Scan [s] | 3.4 |
| Scan velocity [μ/s] | 1.562 (N = 2) |
| Cycle time | 293.36 |
| Step size [m/z] | 0.1 |
| Retention Time [min] | Components | Molecular Formula | Molecular Weight | Concentration [ppt] *5 | ||
|---|---|---|---|---|---|---|
| 0 min | 30 min | 60 min | ||||
| 6.74 | Ethyl acetate *3 *4 | C4H8O2 | 92.8 | 4.4 | 6.1 | 4.1 |
| 7.68 | Ethanol *3 *4 | C2H6O | 98.1 | 14 | 15 | 11 |
| 7.80 | Benzene *3 *4 | C6H6 | 95.9 | 16 | 16 | 15 |
| 8.01 | Unknown *3 | - | - | 4.7 | 4.6 | 3.8 |
| 9.36 | Unknown *3 | - | - | 2.7 | 0.36 | - |
| 9.63 | Unknown *3 | - | - | 23 | 2.5 | - |
| 9.72 | α-Phellandrene *3 | C10H16 | 136.1 | 7.2 | 0.76 | - |
| 10.09 | Toluene *3 *4 | C7H8 | 98.0 | 15 | 25 | 15 |
| 10.57 | Camphene *3 | C10H16 | 136.1 | 12 | 1.1 | 0.55 |
| 12.28 | β-Pinene *1 | C10H16 | 136.1 | 13 | 10 | 7.3 |
| 13.10 | D-Limonene *1 | C10H16 | 136.1 | 6.5 | 4.2 | 3.0 |
| 13.47 | 1,8-Cineole *1 *2 | C10H18O | 154.1 | 6.3 | 2.0 | 0.33 |
| 13.64 | trans-β-Ocimene *2 | C10H16 | 136.1 | 4.5 | 1.0 | 0.37 |
| 13.97 | cis-β-Ocimene *2 | C10H16 | 136.1 | 12 | 4.6 | 2.9 |
| 14.16 | 3-Octanone *2 | C8H16O | 128.1 | 9.5 | 2.1 | 0.11 |
| 16.04 | 2,6-Dimethyl-2,4,6-Octatriene *3 | C10H16 | 136.1 | 15 | 2.2 | 0.94 |
| 17.11 | 1-Octen-3-ol *3 | C8H16O | 128.1 | 1.1 | 1.0 | 0.25 |
| 18.50 | Linalool *1 *2 | C10H18O | 154.1 | 27 | 41 | 22 |
| 18.61 | Benzaldehyde *3 | C7H6O | 106.0 | 8.8 | 12 | 3.5 |
| 18.70 | Linalyl acetate *1 *2 | C12H20O2 | 196.1 | 9.6 | 17 | 8.4 |
| 19.35 | Unknown *3 | - | - | 0.68 | 2.3 | 1.5 |
| 19.56 | Terpinen-4-ol *1 *2 | C10H18O | 154.1 | 0.6 | 1.1 | 0.65 |
| 19.68 | Caryophyllene *3 | C15H24 | 204.2 | 0.43 | 1.0 | 0.71 |
| 20.89 | Borneol *3 | C10H18O | 154.2 | 1.6 | 2.1 | 1.5 |
| 20.93 | (+) or (-)-Lavandulol acetate *2 | C12H20O2 | 196.1 | 1.6 | 1.7 | 0.91 |
| 21.30 | (+) or (-)-Lavandulol acetate *2 | C12H20O2 | 196.1 | 1.3 | 1.4 | 1.0 |
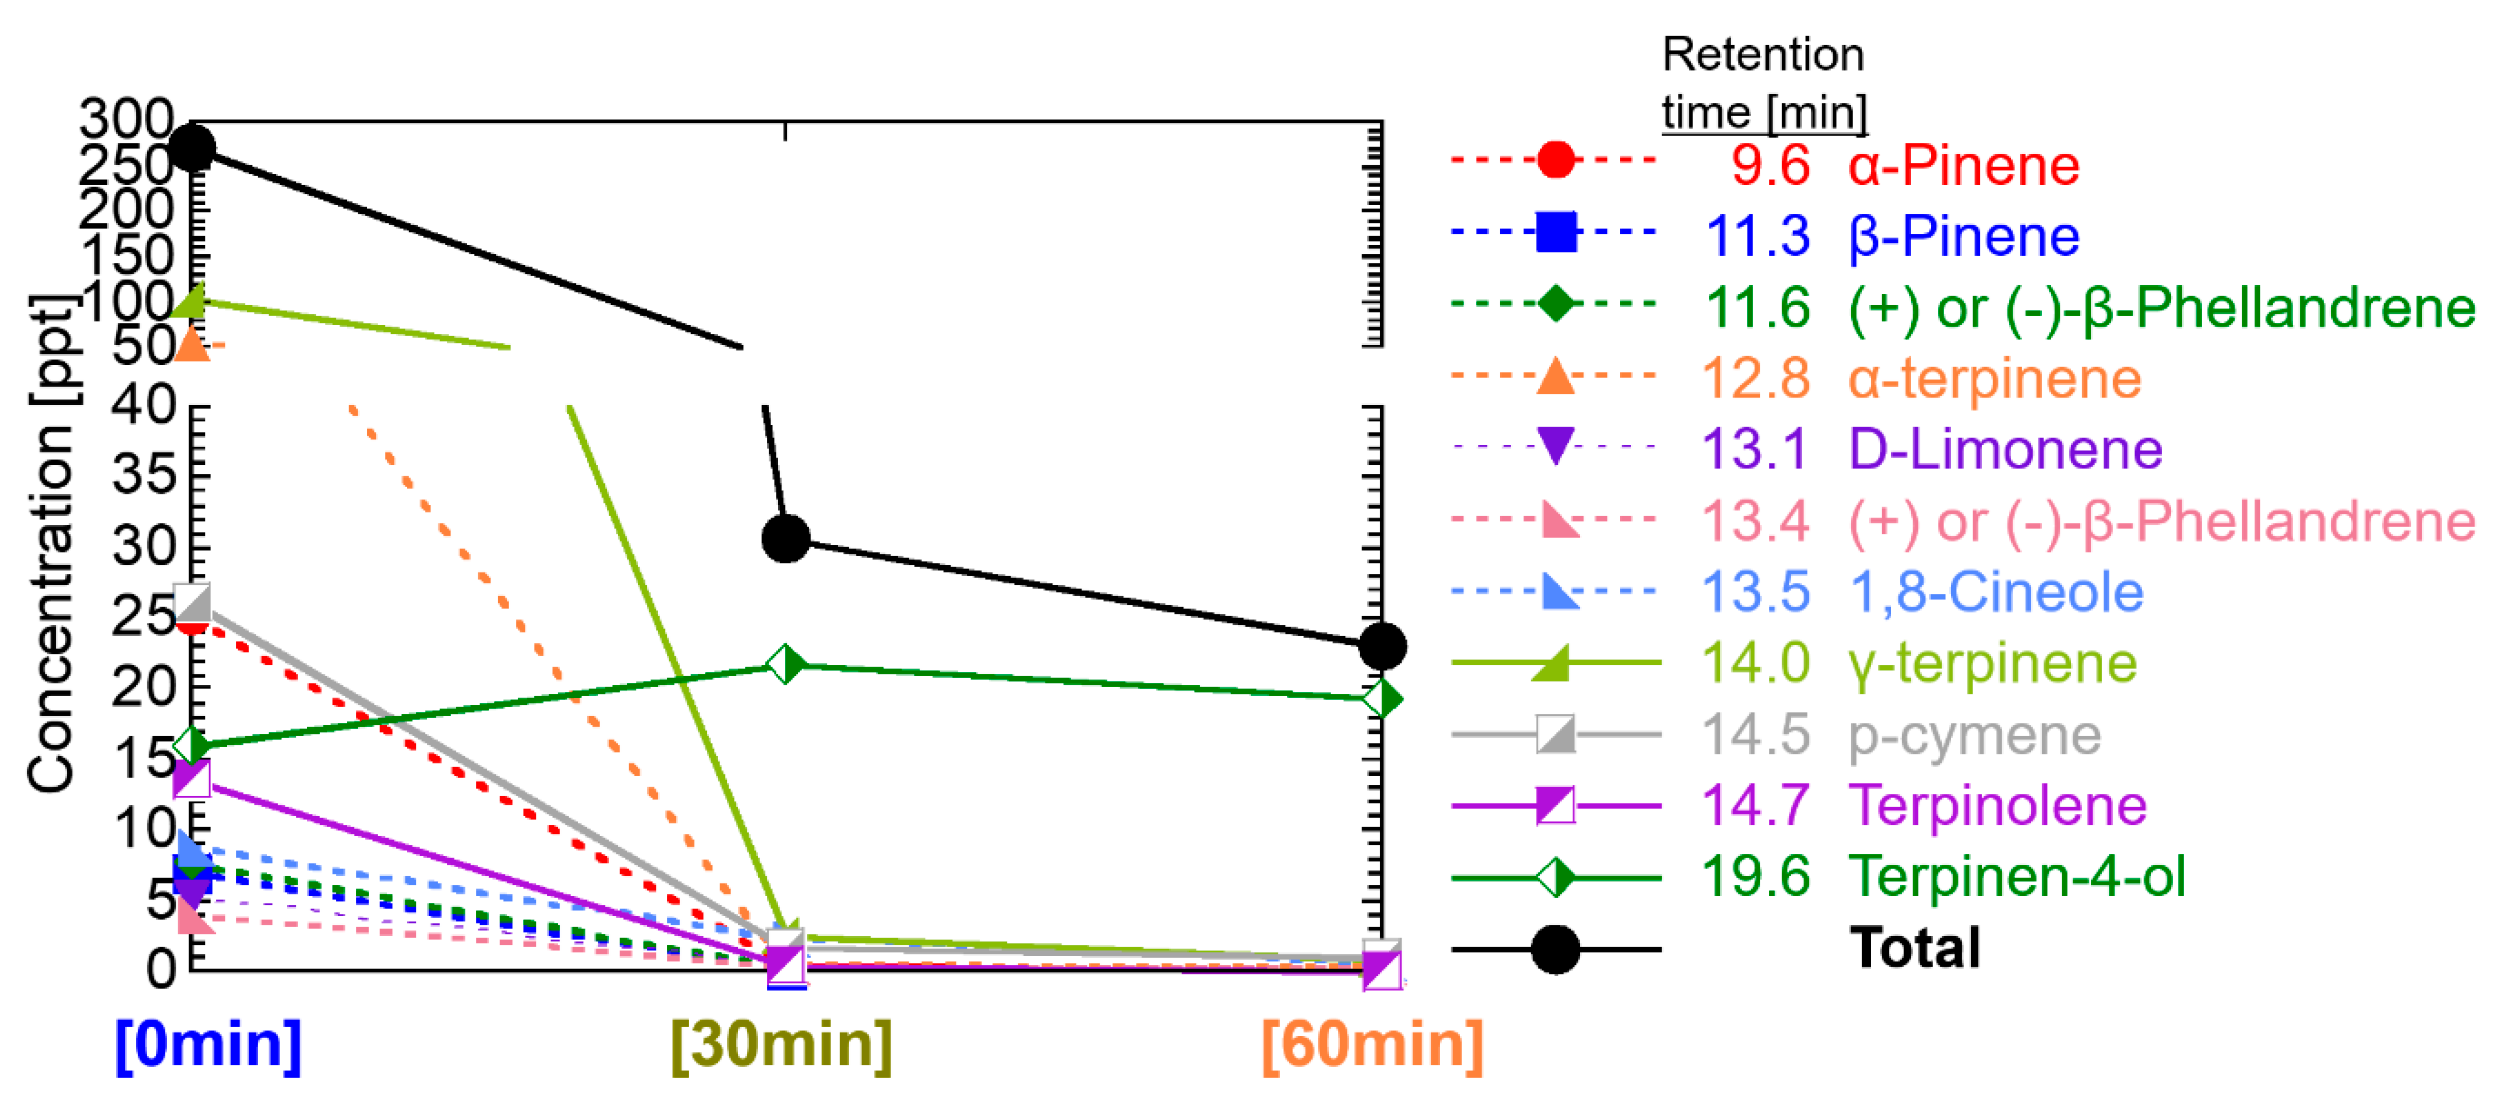
| Retention Time [min] | Components | Molecular Formula | Molecular Weight | Concentration [ppt] *6 | ||
|---|---|---|---|---|---|---|
| 0 min | 30 min | 60 min | ||||
| 6.55 | Ethyl Acetate *3 *4 | C4H8O2 | 88.1 | 6.2 | 4.8 | 14 |
| 6.71 | Methanol *5 | CH4O | 32.0 | - | - | - |
| 6.84 | Methyl ethyl ketone *3 | C4H8O | 72.1 | 1.6 | 2.6 | 4.1 |
| 7.71 | Ethanol *3 *4 | C2H6O | 46.0 | 20 | 32 | 25 |
| 7.81 | Benzene *3 *4 | C6H6 | 78.0 | 14 | 14 | 13 |
| 9.64 | α-Pinene *1 *2 | C10H16 | 136.1 | 25 | 0.41 | 0.19 |
| 11.32 | β-Pinene *1 *2 | C10H16 | 136.1 | 6.9 | 0.13 | 0.073 |
| 11.56 | (+) or (-)-β-Phellandrene *2 | C10H16 | 136.1 | 7.8 | 0.26 | 0.15 |
| 12.77 | α-terpinene *1 *2 | C10H16 | 136.1 | 54 | 0.55 | 0.38 |
| 13.14 | D-Limonene *1 *2 | C10H16 | 136.1 | 5.1 | 0.24 | 0.18 |
| 13.36 | (+) or (-)-β-Phellandrene *2 | C10H16 | 136.1 | 3.9 | 0.31 | 0.24 |
| 13.51 | 1,8-Cineole *1 *2 | C10H18O | 154.1 | 8.7 | 2.3 | 0.54 |
| 14.03 | γ-terpinene *1 *2 | C10H16 | 136.1 | 104 | 2.6 | 0.88 |
| 14.49 | p-cymene *1 *2 | C10H14 | 134.1 | 26 | 1.8 | 1.1 |
| 14.70 | Terpinolene *2 | C10H16 | 136.1 | 14 | 0.39 | - |
| 19.58 | Terpinen-4-ol *1 *2 | C10H18O | 154.1 | 16 | 22 | 19 |
| 21.49 | α-Terpinenol *1 *5 | C10H18O | 154.1 | - | - | - |
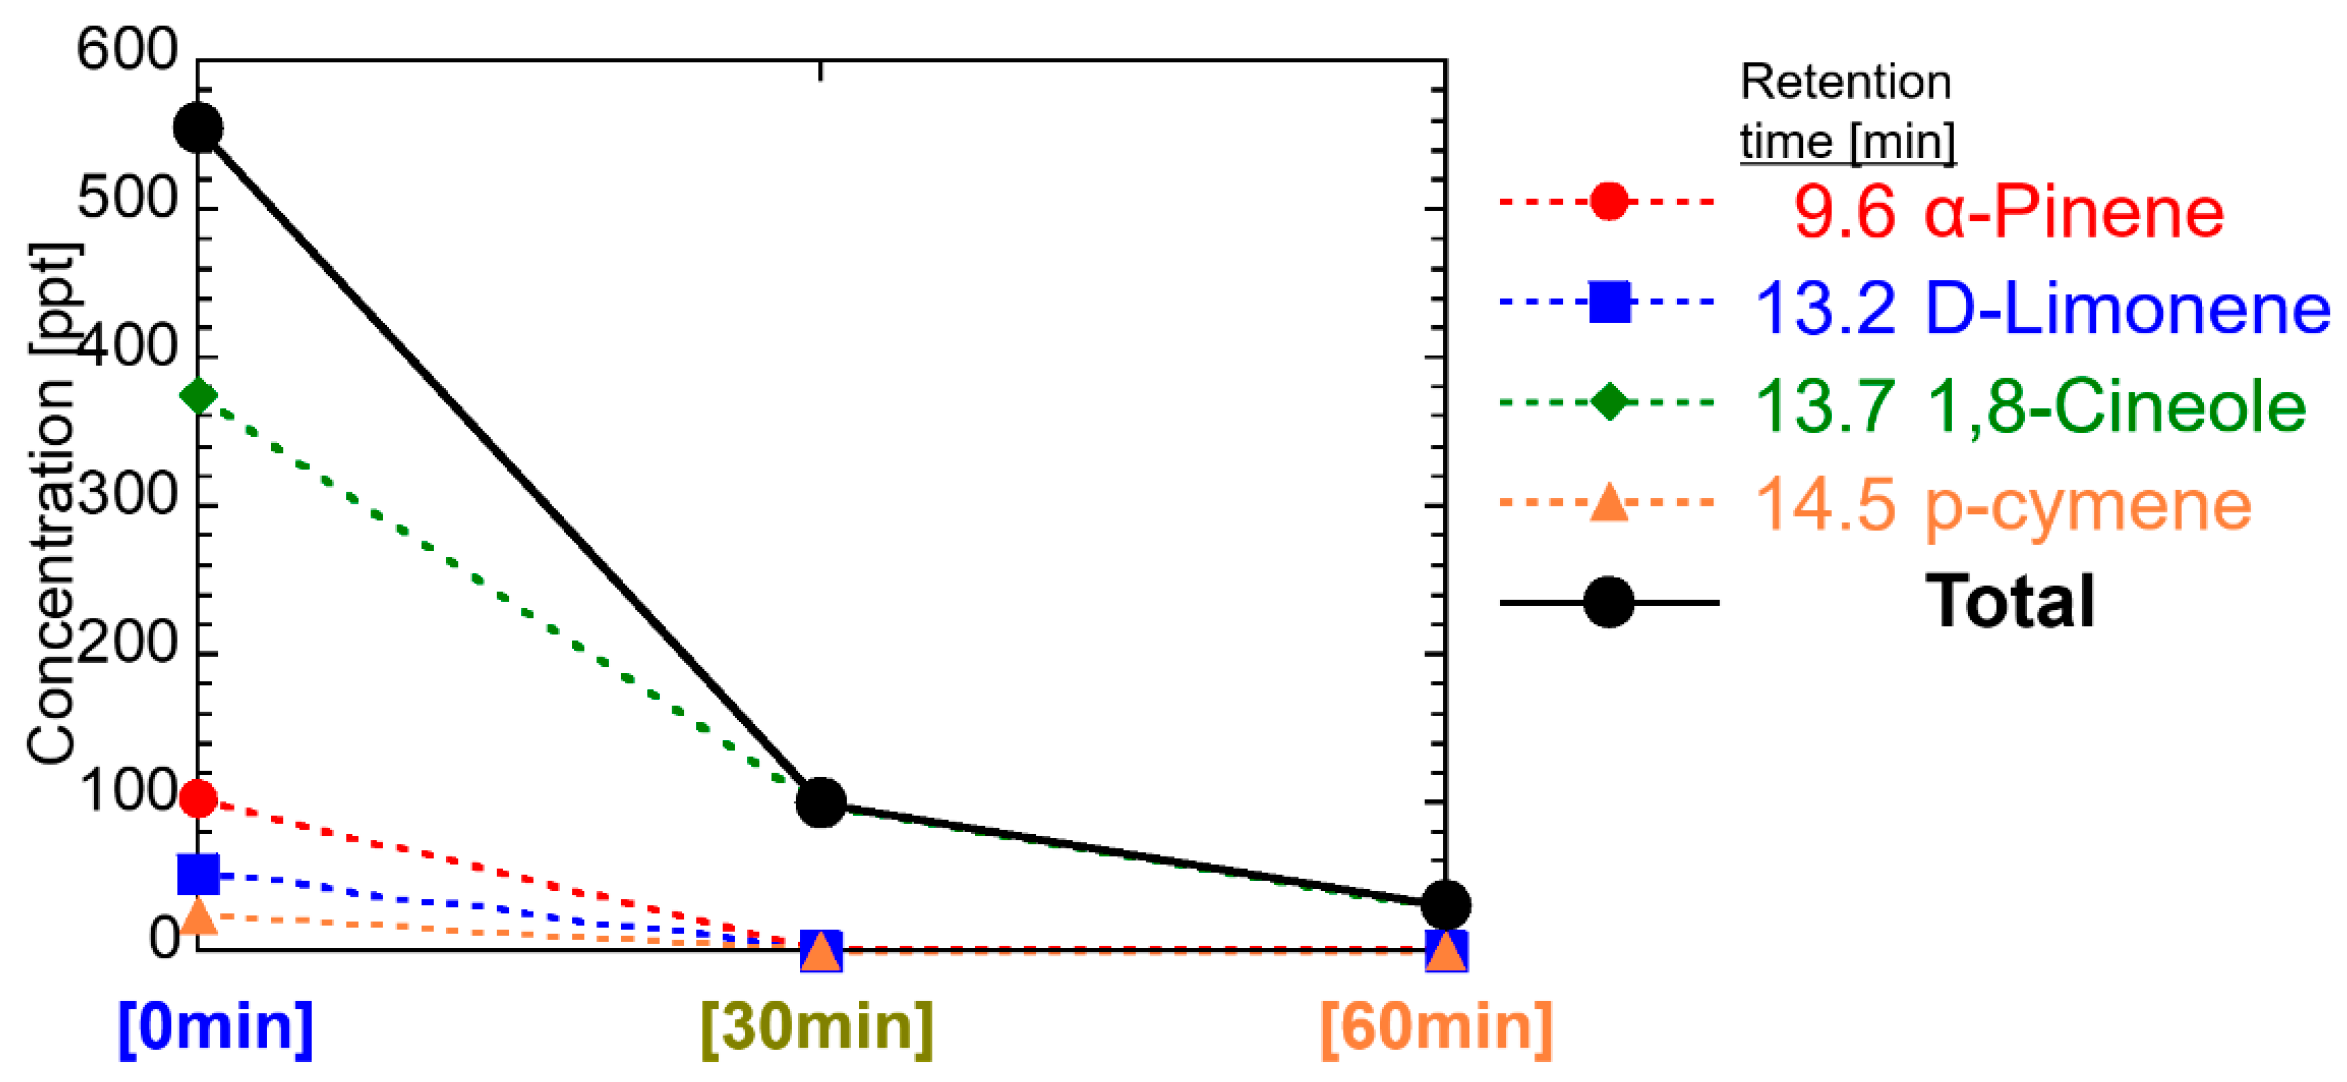
| Retention Time [min] | Components | Molecular Formula | Molecular Weight | Concentration [ppt] *6 | ||
|---|---|---|---|---|---|---|
| 0 min | 30 min | 60 min | ||||
| 6.56 | Ethyl Acetate *3 *4 | C4H8O2 | 88.1 | 1.9 | 0.93 | 0.80 |
| 7.73 | Ethanol *3 *4 | C2H6O | 46.0 | 6.9 | 5.9 | 21 |
| 7.81 | Benzene *3 *4 | C6H6 | 78.0 | 3.9 | 4.6 | 3.3 |
| 9.64 | α-Pinene *1 *2 | C10H16 | 136.1 | 168 | 2.2 | 1.3 |
| 11.32 | β-Pinene *1 *3 | C10H16 | 136.1 | 8.7 | 0.46 | - |
| 12.77 | α-terpinene *1 *3 | C10H16 | 136.1 | 0.57 | - | - |
| 13.16 | D-Limonene *1 *2 | C10H16 | 136.1 | 49 | 0.69 | - |
| 13.66 | 1,8-Cineole *1 *2 | C10H18O | 154.1 | 402 | 105 | 32 |
| 14.06 | γ-terpinene *1 *3 | C10H16 | 136.1 | 10 | - | - |
| 14.51 | p-cymene *1 *3 | C10H14 | 134.1 | 14 | 0.30 | 0.10 |
| 19.57 | Terpinen-4-ol *1 *3 | C10H18O | 154.1 | - | - | - |
| 21.49 | α-Terpinenol *1 *3 *5 | C10H18O | 154.1 | - | - | - |
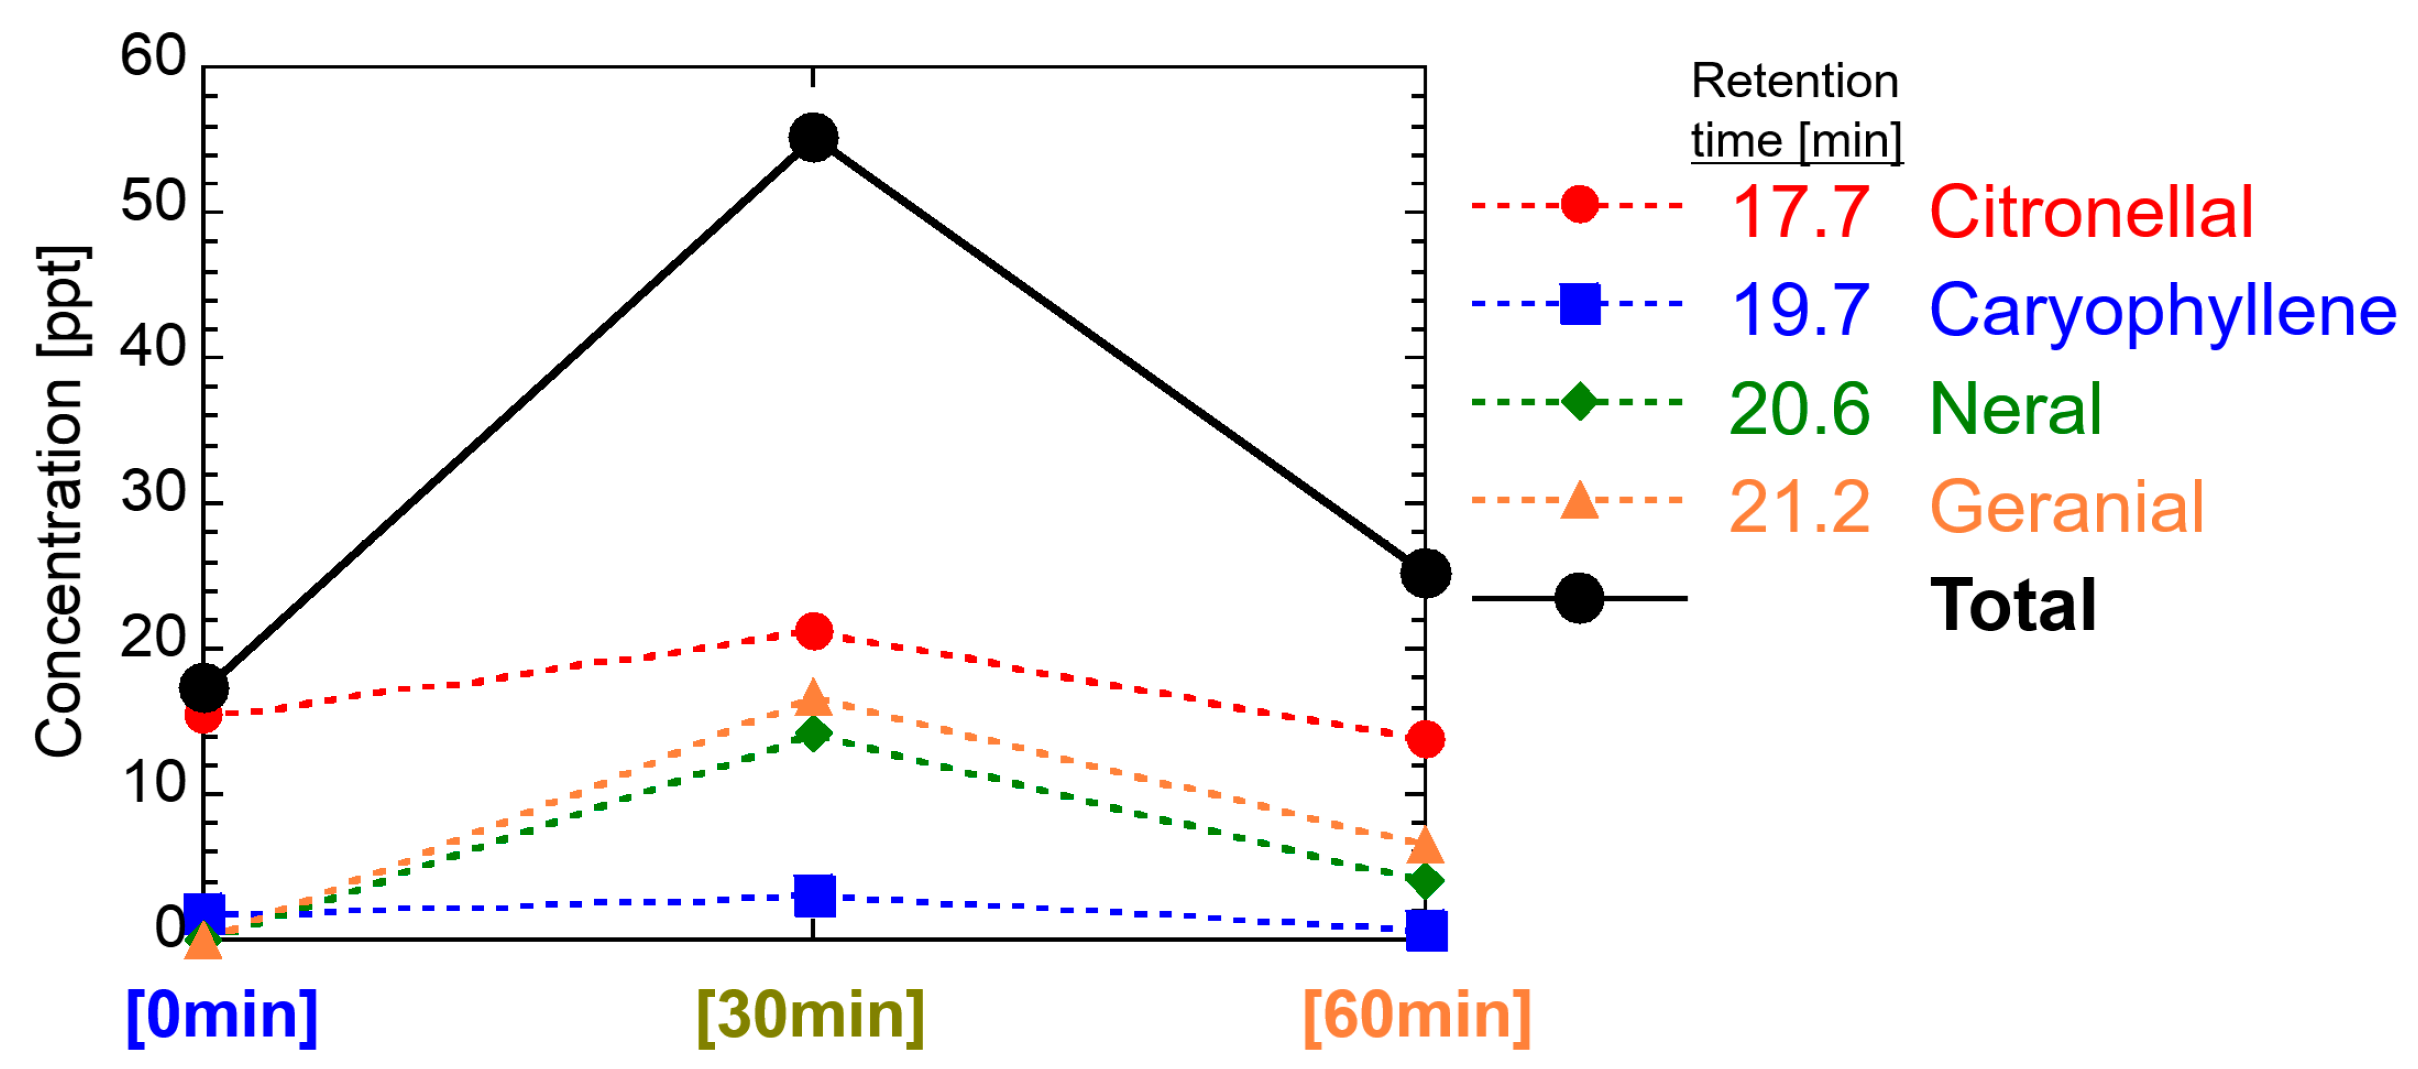
| Retention Time [min] | Components | Molecular Formula | Molecular Weight | Concentration [ppt] *6 | ||
|---|---|---|---|---|---|---|
| 0 min | 30 min | 60 min | ||||
| 6.55 | Ethyl Acetate *3 *4 | C4H8O2 | 88.1 | 3.1 | 6.2 | 11 |
| 6.72 | Methyl Alcohol *5 | CH4O | 32.0 | - | - | - |
| 6.83 | Methyl ethyl ketone *3 | C4H8O | 72.1 | 3.8 | 3.4 | 5.1 |
| 7.72 | Ethanol *3 *4 | C2H6O | 46.0 | 43 | 40 | 119 |
| 7.81 | Benzene *3 *4 | C6H6 | 78.0 | 27 | 22 | 22 |
| 8.57 | n-Propyl acetate | C5H10O2 | 102.1 | 5.7 | 5.5 | 6.9 |
| 10.07 | Toluene *3 *4 | C7H8 | 92.1 | 22 | 19 | 25 |
| 11.75 | Ethylbenzene *3 *4 | C8H10 | 106.1 | 4.3 | 3.0 | 5.4 |
| 12.23 | 1-Butanol *3 | C4H10O | 74.1 | 1.3 | 2.1 | 2.0 |
| 12.30 | Unknown *5 | - | - | - | - | - |
| 13.13 | D-Limonene *5 | C10H16 | 136.1 | - | - | - |
| 13.28 | 3-Methyl-2-Butenal *5 | C5H8O | 84.1 | - | - | - |
| 13.47 | Unknown *5 | - | - | - | - | - |
| 13.99 | 3-Carene *5 | C10H16 | 136.1 | - | - | - |
| 15.23 | 3-Methyl-2-buten-1-ol *5 | C5H10O | 86.1 | - | - | - |
| 17.20 | Acetic acid *5 | C2H4O2 | 60.0 | - | - | - |
| 17.71 | Citronellal *1 *2 | C10H18O | 154.1 | 16 | 21 | 14 |
| 18.47 | linalool *1 *3 | C12H20O2 | 196.1 | - | 2.3 | 1.1 |
| 18.60 | Benzaldehyde *3 | C7H6O | 106.0 | 2.5 | 2.6 | 3.1 |
| 19.68 | Caryophyllene *2 | C15H24 | 204.2 | 1.9 | 3.1 | 0.71 |
| 20.59 | Neral *1 *2 | C10H16O | 152.1 | - | 14 | 4.2 |
| 21.20 | Geranial *1 *2 | C10H16O | 152.1 | - | 17 | 6.6 |
| 21.35 | Unknown *3 | - | - | - | 3.0 | 1.3 |
| 21.48 | Unknown *3 | - | - | - | 2.4 | 1.1 |
| 21.85 | Unknown *3 | - | - | - | 0.67 | - |
| 22.36 | Unknown *3 | - | - | 1.2 | 7.4 | 2.8 |
| Lavender | Tee Tree Oil | Eucalyptus | Melissa | |
|---|---|---|---|---|
| Temporal change of total concentration | Constant level of 39–75 ppt for 60 min | 272 ppt at start, and its 31 ppt after 30 min | 555 ppt at start, its 100 ppt after 30 min | Constant level of 17–55 ppt for 60 min |
| Concentration decrease over time | Slight decrease | Explicit decrease | Explicit decrease | Slight decrease |
| concentration peak delay | Yes | No | No | Yes |
Publisher’s Note: MDPI stays neutral with regard to jurisdictional claims in published maps and institutional affiliations. |
© 2022 by the authors. Licensee MDPI, Basel, Switzerland. This article is an open access article distributed under the terms and conditions of the Creative Commons Attribution (CC BY) license (https://creativecommons.org/licenses/by/4.0/).
Share and Cite
Itoh, T.; Masuda, Y.; Matsubara, I.; Arai, J.; Shin, W. Examination of VOC Concentration of Aroma Essential Oils and Their Major VOCs Diffused in Room Air. Int. J. Environ. Res. Public Health 2022, 19, 2904. https://doi.org/10.3390/ijerph19052904
Itoh T, Masuda Y, Matsubara I, Arai J, Shin W. Examination of VOC Concentration of Aroma Essential Oils and Their Major VOCs Diffused in Room Air. International Journal of Environmental Research and Public Health. 2022; 19(5):2904. https://doi.org/10.3390/ijerph19052904
Chicago/Turabian StyleItoh, Toshio, Yoshitake Masuda, Ichiro Matsubara, Junichirou Arai, and Woosuck Shin. 2022. "Examination of VOC Concentration of Aroma Essential Oils and Their Major VOCs Diffused in Room Air" International Journal of Environmental Research and Public Health 19, no. 5: 2904. https://doi.org/10.3390/ijerph19052904
APA StyleItoh, T., Masuda, Y., Matsubara, I., Arai, J., & Shin, W. (2022). Examination of VOC Concentration of Aroma Essential Oils and Their Major VOCs Diffused in Room Air. International Journal of Environmental Research and Public Health, 19(5), 2904. https://doi.org/10.3390/ijerph19052904